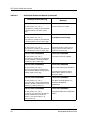
1
®
ATX Switch
Management Module Guide
Notice
Cabletron Systems reserves the right to make changes in specifications and other information
contained in this document without prior notice. The reader should in all cases consult Cabletron
Systems to determine whether any such changes have been made.
The hardware, firmware, or software described in this manual is subject to change without notice.
IN NO EVENT SHALL CABLETRON SYSTEMS BE LIABLE FOR ANY INCIDENTAL,
INDIRECT, SPECIAL, OR CONSEQUENTIAL DAMAGES WHATSOEVER (INCLUDING BUT
NOT LIMITED TO LOST PROFITS) ARISING OUT OF OR RELATED TO THIS MANUAL OR
THE INFORMATION CONTAINED IN IT, EVEN IF CABLETRON SYSTEMS HAS BEEN
ADVISED OF, KNOWN, OR SHOULD HAVE KNOWN, THE POSSIBILITY OF SUCH
DAMAGES.
Virus Disclaimer
Cabletron has tested its software with current virus checking technologies. However, because no
anti-virus system is 100% reliable, we strongly caution you to write protect and then verify that
the Licensed Software, prior to installing it, is virus-free with an anti-virus system in which you
have confidence.
Cabletron Systems makes no representations or warranties to the effect that the Licensed
Software is virus-free.
Copyright © May 1998, by Cabletron Systems, Inc. All rights reserved.
Printed in the United States of America.
Order Number: 9032068 E2
Cabletron Systems, Inc.
P.O. Box 5005
Rochester, NH 03866-5005
SPECTRUM, the SPECTRUM IMT/VNM logo, DCM, IMT, and VNM are registered
trademarks, and SpectroGRAPH, SpectroSERVER, Inductive Modeling Technology,
Device Communications Manager, SPECTRUM Portable Mangement Applications
(SPMA), and Virtual Network Machine are trademarks of Cabletron Systems, Inc.
Ethernet is a trademark of Xerox Corporation.
9032068 E2
i
Restricted Rights Notice
(Applicable to licenses to the United States Government only.)
1. Use, duplication, or disclosure by the Government is subject to restrictions as set forth in
subparagraph (c) (1) (ii) of the Rights in Technical Data and Computer Software clause at
DFARS 252.227-7013.
Cabletron Systems, Inc., 35 Industrial Way, Rochester, New Hampshire 03866-5005.
2. (a) This computer software is submitted with restricted rights. It may not be used,
reproduced, or disclosed by the Government except as provided in paragraph (b) of this
Notice or as otherwise expressly stated in the contract.
(b) This computer software may be:
(c)
(1)
Used or copied for use in or with the computer or computers for which it was
acquired, including use at any Government installation to which such computer or
computers may be transferred;
(2)
Used or copied for use in a backup computer if any computer for which it was
acquired is inoperative;
(3)
Reproduced for safekeeping (archives) or backup purposes;
(4)
Modified, adapted, or combined with other computer software, provided that the
modified, combined, or adapted portions of the derivative software incorporating
restricted computer software are made subject to the same restricted rights;
(5)
Disclosed to and reproduced for use by support service contractors in accordance with
subparagraphs (b) (1) through (4) of this clause, provided the Government makes
such disclosure or reproduction subject to these restricted rights; and
(6)
Used or copied for use in or transferred to a replacement computer.
Notwithstanding the foregoing, if this computer software is published copyrighted
computer software, it is licensed to the Government, without disclosure prohibitions, with
the minimum rights set forth in paragraph (b) of this clause.
(d) Any other rights or limitations regarding the use, duplication, or disclosure of this
computer software are to be expressly stated in, or incorporated in, the contract.
(e) This Notice shall be marked on any reproduction of this computer software, in whole or in
part.
ii
ATX Switch
Management Module Guide
Contents
Preface
What Is in This Guide .......................................................................................................... ix
Conventions ........................................................................................................................... x
Related SPECTRUM Documentation................................................................................... x
Other Related Documentation ............................................................................................. xi
Getting Help......................................................................................................................... xii
Chapter 1
Introduction
What Is in This Chapter..................................................................................................... 1-1
ATX LAN Switch Management Modules........................................................................... 1-1
ATX Switch Management Module Application ................................................................. 1-2
SPMA and the ATX Switch ................................................................................................ 1-3
Chapter 2
Device Views
What Is in This Chapter..................................................................................................... 2-1
Accessing the Logical or Interface Device Views .............................................................. 2-2
Logical Interface Icons ................................................................................................. 2-4
Interface Number Label/Device Topology View ................................................... 2-5
Administrative Status Label/IF Status View....................................................... 2-5
Interface Type Label/IF Configuration View........................................................ 2-5
Physical Address Label/IF Address Translation Table........................................ 2-6
IP Address Label/Network Information Panel..................................................... 2-6
Logical Gauge Label/Performance View............................................................... 2-7
Interface Detail View ................................................................................................... 2-7
Interface Options Panel ............................................................................................... 2-8
Gauge Control Panel ............................................................................................. 2-8
Logical Gauge Buttons ........................................................................................ 2-11
9032068 E2
iii
Chapter 3
Configuration Views
What Is in This Chapter .....................................................................................................3-1
Accessing the Device Configuration View..........................................................................3-1
Device Configuration View .................................................................................................3-2
Interface Configuration Table ...............................................................................3-3
Interface Configuration View ................................................................................3-4
Chapter 4
Event and Alarm Messages
What Is in This Chapter .....................................................................................................4-1
ATX Switch Events and Alarms .........................................................................................4-1
Index
iv
ATX Switch
Management Module Guide
Figures
Chapter 1
Figure 1-1.
Chapter 2
Figure 2-1.
Figure 2-2.
Figure 2-3.
Introduction
Application View ................................................................................................... 1-3
Device Views
ATX Switch Interface Device View ...................................................................... 2-3
Logical Interface Icon Click Zones ....................................................................... 2-4
Gauge Control Panel ............................................................................................ 2-9
9032068 E2
v
vi
ATX Switch
Management Module Guide
Tables
Chapter 2
Table 2-1.
Table 2-2.
Table 2-3.
Table 2-4.
Table 2-5.
Table 2-6.
Chapter 3
Table 3-1.
Chapter 4
Table 4-1.
Device Views
Interface Status Label Definitions ....................................................................... 2-5
Packet Breakdown Pie Chart................................................................................ 2-7
Packet Breakdown Pie Chart................................................................................ 2-7
Discard Breakdown Pie Chart .............................................................................. 2-8
Totals Gauge Mode Attribute and Color Definitions......................................... 2-10
Rate Gauge Mode Attributes and Color Definitions.......................................... 2-10
Configuration Views
ATX Switch Interface Types ................................................................................. 3-3
Event and Alarm Messages
ATX Switch Events and Alarms ........................................................................... 4-1
9032068 E2
vii
viii
ATX Switch
Management Module Guide
Preface
Use this guide if you are going to manage the ATX Switch through
SPECTRUM. Before reading this guide, you should be familiar with
SPECTRUM’s functions. You should also be familiar with any network
management and hardware requirements described in the related hardware
documentation.
What Is in This Guide
The following chapter descriptions outline the organization of the ATX
Switch Management Module Guide.
Chapter
Description
Chapter 1
Introduction
Describes the ATX Switch management modules
and model types.
Chapter 2
Device Views
Describes the Logical and Interface Device views
and each view’s representations of the ATX Switch.
Chapter 3
Configuration Views
Describes the configuration views for the
ATX Switch and the device-specific management
information provided by each view.
Chapter 4
Event and Alarm Messages
Contains a listing and explanation of the alarm and
event messages generated in the Event Log or
Alarm Manager for the ATX Switch.
Chapter 5
Application View
Describes the Application view for the ATX Switch
and any application information provided by the
view.
9032068 E2
ix
Conventions
Conventions
This guide uses the following conventions:
• Menu selections and buttons referenced in text are printed in bold; for
example, Configuration or Detail.
• Buttons are represented by a shadowed box; for example,
Help
• Menu navigation is displayed in order of selection; for example, Icon
Subviews -> Utilities -> Application.
• Chapter titles appear in italics.
• Referenced documents appear in bold italics.
Related SPECTRUM Documentation
Refer to the following documentation for more information on using
SPECTRUM:
SPECTRUM Report Generator User’s Guide
Getting Started with SPECTRUM for Operators
Getting Started with SPECTRUM for Administators
How to Manage Your Network with SPECTRUM
Preface
x
ATX Switch
Management Module Guide
Other Related Documentation
Other Related Documentation
Refer to the following documentation for more information on managing
TCP/IP-based networks:
LAN Troubleshooting Handbook, Mark Miller (1989,
M&T Publishing, Inc.)
The Simple Book — An Introduction to Management of TCP/IP-based
Internets, Marshall T. Rose, Performance Systems International, Inc.
Computer Networks, Andrew S. Tanenbaum, Prentice-Hall, Inc.
Local Area Networks, Architectures and Implementations, James
Martin & Kathleen K. Chapman for the Arben Group, Inc. (1989,
Prentice-Hall, Inc.)
9032068 E2
Preface
xi
Getting Help
Getting Help
For additional support for SPECTRUM products, or to make comments or
suggestions regarding SPECTRUM or this manual, contact Cabletron
Systems Technical Support via one of the following means:
Location
Mail
FAX
Telephone
603-337-3075
603-337-3500
(*)-44-635-552062
(*)-44-635-580000
Europe
Cabletron Systems, Ltd.
Network House
Newbury Business Park
London Road, Newbury
Berkshire, England RG13 2PZ
E-mail: [email protected]
(*)-61-2-950-5950
(*)-61-2-950-5900
Pacific
Cabletron Systems, Inc.
Allambie Grove Estate
25 French’s Forest Road East
French’s Forest, NSW 2086
Sydney, Australia
E-mail: [email protected]
(*)-81-3-3240-1985
(*)-81-3-3240-1981
Japan
Cabletron Systems, KK
JTB Building 9F
164 Maranouchi
Chiyoda-ku
Tokyo 100 Japan
E-mail: [email protected]
(*)-65-7763382
(*)-65-7755355
Singapore
Cabletron Systems, Inc.
85 Science Park Drive
#03-03/04
The Cavendish
Singapore 051
E-mail: [email protected]
(*)-49-6103/991-229
(*)-49-6103/991-269
Germany
Cabletron Systems GmbH
Dreieich Park
Im Gefierth 13d
63303 Dreieich
Frankfurt, Germany
E-mail: [email protected]
Cabletron Systems, Inc.
P. O. Box 5005
North America
Rochester, NH 03866-5005
E-mail: [email protected]
*International Operator Code
Questions About SPECTRUM Documentation?
E-MAIL
Preface
xii
Send your questions, comments or suggestions regarding SPECTRUM
documentation to the Technical Communications Department directly via the
following internet address:
[email protected]
ATX Switch
Management Module Guide
Chapter 1
Introduction
What Is in This Chapter
This chapter describes the SPECTRUM Management Module for the ATX
Advanced Technology Backbone LAN Switch. It also provides the model type
name assigned to the ATX Advanced Technology Backbone LAN Switch in
SPECTRUM.
ATX LAN Switch Management Modules
The ATX Advanced Technology Backbone LAN Switch (herein referred to as
the ATX Switch) offers full multiprotocol support for Ethernet, Token Ring,
FDDI and Fast Ethernet. Local routing for major protocols is supported.
Translational switching capabilities exist at the (bridging) link layer and
(routing) network layer between Ethernet and Token Ring. This allows
switching between network technologies for non-routable protocols. The
switching layers can be mixed and matched on a port-by-port basis.
Additionally, ATX offers a redundant load-sharing power supply, hotswappable modules, and a dual RISC-based Packet Processing Engine for full
wire speed performance.
The ATX Switch Management Module includes a software emulation of the
actual device attributes and functionality. The ATX Switch Management
Module Guide provides all the information necessary to manage the ATX
Switch using SPECTRUM.
The ATX Switch Management Module supports one model type, CSI_ATX,
used to represent the physical ATX Switch, the supported applications, and
the interfaces. The following chapters provide a description of the model and
relationship to the views in SPECTRUM.
9032068 E2
1-1
ATX Switch Management Module Application
ATX Switch Management Module Application
SPECTRUM management of the ATX Switch is based on common and devicespecific applications. The following common applications and sub-applications
are discussed in the Bridging Applications, MIB-II Applications,
Miscellaneous Applications:
• IP Routing (IP2RtrApp)
• Bridging
- Gen Bridge (Gen_Bridge_App)
- Spanning Tree (Span_Tree_App)
- Static (Static_App)
- Transparent (Transparent_App)
• Ethernet App (EthernetApp)
• MIB-II (SNMP2_Agent)
- System (System2_App)
- ICMP (ICMP_App)
- TCP (TCP2_App)
- UDP (UDP2_App)
RMON and DLM are also supported and SPECTRUM management modules
for these MIBs may be purchased separately. Refer to the documentation
provided with the RMON and DLM management modules for descriptions of
these capabilities.
Introduction
1-2
ATX Switch
Management Module Guide
SPMA and the ATX Switch
SPMA and the ATX Switch
SPECTRUM also supports SPECTRUM Portable Management Application
(SPMA) functionality for the ATX Switch. To open the SPMA Application view
from any SPECTRUM view, do the following:
1. Highlight the Device icon.
2. From the View menu, select Icon Subviews -> Utilities -> Application.
The Application view provides buttons to select SPMA-specific views and
dialog boxes. Figure 1-1 shows an example of an SPMA Application view.
Figure 1-1.
Application View
Applications
118.24 of type CSI_ATX
Hub View
Gen Bridge App of type Gen_Bridge_App
Bridge View
MIB-II of type SNMP2_Agent
Generic SNMP (MIB I II)
Close
For details on the following SPMA views, refer to the SPECTRUM Portable
Management Application for the ATX User’s Guide.
Bridge View
Chapter 9, Using the ATX Bridge View, provides detailed instructions for
configuring and managing the bridging capabilities available for many client
modules. Bridge capabilities include monitoring Bridge operation, using the
special and filtering databases, and setting forwarding thresholds and
notification options.
9032068 E2
Introduction
1-3
SPMA and the ATX Switch
For details on the following SPMA views refer to the SPECTRUM Portable
Management Application Tools Guide.
Generic SNMP (MIB I II)
Chapter 2, Using the MIB I, MIB II Tool, explains how to use this tool to view
and change MIB I and MIB II object ID values.
Community Names
Chapter 3, Using the SPMA Community Names Tool, explains Cabletron’s
“Component” structure of device MIBs, and describes how to change device
community names.
Introduction
1-4
ATX Switch
Management Module Guide
Chapter 2
Device Views
What Is in This Chapter
This chapter describes the Device views available for the ATX Switch
Management Module and includes representations of the modules, ports, and
interfaces. It also describes any subviews available. The Device views
accessible from the Icon Subviews menu are as follows:
• Logical Device view
• Interface Device view
The Logical Device view allows you to access the ATX Switch’s SPECTRUM
Portable Management applications and the logical representations of the ATX
Switch's interfaces. The Interface Device view allows you to access the views
that monitor and control the interfaces. The sections on the following pages
provide information on accessing the ATX Switch Device views.
9032068 E2
2-1
Accessing the Logical or Interface Device Views
Accessing the Logical or Interface Device Views
The Device view is accessed using one of the following methods:
• Double-click on the Device view button of the ATX Switch module icon.
This opens the Device view that was opened last (i.e. Logical or
Interface).
Device view button
• Highlight the ATX Switch device icon and select Device -> Logical or
Interface from the Icon Subviews menu. This opens the SPECTRUM
Portable Management Application (SPMA) Hub view, which is described
in the SPECTRUM Portable Management Application for the ATX
User’s Guide.
Go Back
Go Up
Icon Subviews
view Path
New view
Bookmarks
view History
Current view Info...
Notes...
Jump by name...
Zoom
Map Hierarchy
Device Views
2-2
Close
Navigate
Alarms
Performance
Notes...
Utilities
Zoom
Device
DevTop
Logical
Interface
ATX Switch
Management Module Guide
Accessing the Logical or Interface Device Views
Figure 2-1 shows an example of the ATX Switch Interface Device view.
Figure 2-1.
ATX Switch Interface Device View
118.24 of type CSI_ATX of Landscape machine:Primary
*
File
View
Help?
Net Addr
Model Name
Sys Up Time
Contact
Manufacturer
Description
Device Type
Location
Prime-App
Serial Number
Network Information
Phy Addr
Find
Address
Interface Description
OFF
1
PPP
ON
ETHERNET
0.0.2.1.0.5.1.A:B
OFF
9
OFF
13
OFF
17
PPP
ETHERNET
ETHERNET
0.0.2.1.0.5.1.:BC
0.0.2.1.0.5.1.A:BB
0.0.2.1.0.5.1.A:A:A
0.0.2.1.0.5.1.AJ
0
0
ETHERNET
0
2
OFF
5
OFF
6
OFF
10
0
0
OFF
14
ETHERNET
ETHERNET
ETHERNET
0.0.2.1.0.5.1.A:BC
0.0.2.1.0.5.1.A:CC
0.0.2.1.0.5.1.B:BC
0
0
0
ON
18
FDDI
0.0.2.1.0.5.1.C
132.177.118.24
0
OFF
3
ETHERNET
0.0.2.1.0.5.1.A:C
0
9032068 E2
OFF
7
ETHERNET
0.0.2.1.0.5.1.A
0
OFF
11
ETHERNET
0
OFF
15
ETHERNET
0.0.2.1.0.5.1.A:A
0.0.2.1.0.5.1.D:BC
0
0
Device Views
2-3
Accessing the Logical or Interface Device Views
Logical Interface Icons
Logical Interface Icons
The ATX Switch Interface Device view displays a logical representation of the
device’s interfaces. A Logical Interface Icon represents each port on the ATX
Switch device. Additional views for the interface can be accessed by singleclicking on the interface icon to highlight it and then selecting the Icon
Subviews option from the View menu, or by double-clicking each icon zone.
The Port Notes facility is also accessed from the Icon Subviews menu.
The Logical Interface Icon consists of six zones, providing configuration and
performance information. Figure 2-2 provides a detailed illustration of the
Logical Interface Icon and the following sections provide further information
about each icon zone.
Figure 2-2.
Logical Interface Icon Click Zones
(a)
Close
Navigate
Alarms
Performance
Notes...
Utilities
DevTop
Detail
IF Status
IF Configuration
IF Address Translation Table
Network Information Panel
Thresholds
Model Information
(b)
2
ON
Ethernet
(c)
0:0:1D:17:2F:3C
(d)
132.177.118.24
(e)
0
(f)
a. Interface Number Label/Device Topology View
b. Administrative Status Label/IF Status View
c. Interface Type Label/IF Configuration View
d. MAC Address Label/IF Address Translation Table
e. IF Address Label/Network Information Panel
f.
Device Views
2-4
Logical Gauge Label/Interface Performance View
ATX Switch
Management Module Guide
Accessing the Logical or Interface Device Views
Logical Interface Icons
Interface Number Label/Device Topology View
Zone (a) of the Logical Interface Icon accesses the ATX Switch Device Topology
view, discussed in SPECTRUM Views. The zone also displays the interface
number.
Administrative Status Label/IF Status View
Zone (b) of the Logical Interface Icon displays the IF Status label and an
appropriate background color to represent the current status of the interface.
Table 2-1 shows the possible interface statuses and their respective colors.
Table 2-1.
Interface Status Label Definitions
Operational
Status
Administrative
Status
Text Display
Color
ON
ON
ON
Green
OFF
OFF
OFF
Blue
OFF
ON
OFF
Yellow
Testing
Testing
Test
Red
Double-clicking on this IF Status view label accesses the Interface Status view
which provides the following information on the status of the interface:
Operational Status
A read-only indicator button displaying the current operational state of the
interface (ON, OFF, or Testing).
Administrative Status
The desired operational state of the interface (Default, ON, OFF, or Testing).
You may change the value for Administrative Status.
Interface Type Label/IF Configuration View
The IF Configuration view label (c) Logical Interface Icon displays the type of
ATX Switch interface. Possible device interface types are shown in Chapter 3,
Configuration Views. This view is also accessed by clicking the Config button
in the Performance view (see label (f)). Double-clicking on the IF
Configuration view label accesses the Interface Configuration view, which
provides the following information for the interface below the banner:
Operation Status
This read-only field provides the current operational state of the interface
(On, Off, or Testing).
9032068 E2
Device Views
2-5
Accessing the Logical or Interface Device Views
Logical Interface Icons
Admin Status
You can select the desired operational state of the interface (On, Off, or
Testing).
Last Change
The System UpTime value when the interface entered its current operational
state. This is provided in the format: D + HH:MM:SS, for example, 1+20:40:25
if the ATX Switch has been active for one day and 20 hours, 40 minutes and 25
seconds.
Network Name/Address
The IP Address assigned to the ATX Switch.
Physical Address
The Ethernet (MAC) address of the interface.
Bandwidth
The estimated bandwidth of the interface measured in bits per second. For
interfaces that do not vary in bandwidth, or when no accurate estimate can be
made, a nominal bandwidth is provided.
Packet Size
The largest packet that can be transmitted or received by the port, measured
in octets.
Queue Length
The length of the outbound packet queue, in packets.
Physical Address Label/IF Address Translation Table
Zone (d) of the Interface Icon displays the physical address of the device
interface. Double-click this zone to access the Interface Address Translation
Table. This table cross-references device IP addresses to device MAC
(Ethernet) addresses for selected nodes between networks. Double-clicking on
any column entry opens an address-specific Address Translation Table
Information view.
IP Address Label/Network Information Panel
Zone (e) of the Logical Interface Icon accesses the Network Information Panel.
This panel provides Name, Network Address, and subnet mask information
for the interface for the ATX Switch device. Any of the network information
entries from this panel or the device’s IP address can be displayed on zone (e)
of the Logical Interface Icon. Refer to the Interface Options Panel section of
this chapter.
Device Views
2-6
ATX Switch
Management Module Guide
Accessing the Logical or Interface Device Views
Interface Detail View
Logical Gauge Label/Performance View
Zone (f) of the Logical Interface Icon (see Figure 2-2) accesses the Performance
view for the interface. The Performance view is a multi-line graph and
provides routing information (traffic flow) in packets, as described below. This
area is also a Logical Gauge which is described later in this chapter.
Multi-Attribute Line Graph
The Multi-Attribute Line Graph provides a general indication of routing
activity. The attributes displayed are pre-selected and use colors to represent
different statistics.
Interface Detail View
The Interface Detail view is accessed by clicking the Detail button in the
Performance view. It provides three color-coded pie charts displaying packet
breakdown information for the interface. Table 2-2, Table 2-3, and Table 2-4
list the information provided by these pie charts.
Each statistic is presented as a total amount since the interface was
initialized and as a percentage of overall network traffic.
Table 2-2.
Packet Breakdown Pie Chart
Statistic
Table 2-3.
Delivered
Packets delivered to a high level protocol.
Transmitted
Packets transmitted through this interface.
Errors
Packets containing errors preventing them from being
delivered to a higher level protocol.
Discards
Packets discarded even though no errors were detected
to make them undeliverable - such packets may have
been discarded to increase buffer space.
Packet Breakdown Pie Chart
Statistic
9032068 E2
Definition
Definition
In Errors
Packets received containing errors.
Out Errors
Packets transmitted containing errors.
Device Views
2-7
Accessing the Logical or Interface Device Views
Interface Options Panel
Table 2-4.
Discard Breakdown Pie Chart
Statistic
Definition
Unknown
Locally addressed packets received successfully but
discarded because of an unknown or unsupported protocol.
In No
Resource
Received packets discarded even though no errors were
encountered to prevent their continued processing - such
packets may have been discarded to increase buffer space.
Out No
Resource
Transmitted packets discarded even though no errors were
encountered to prevent their continued processing - such
packets may have been discarded to increase buffer space.
Interface Options Panel
The Interface Options Panel, displayed in the Interface Device view, is located
directly below the Device view banner and displays the ATX Switch Location/
Topology view icon. The Interface Options Panel allows a user to modify the
presentation of the Logical Interface Icon (described previously), and is
described below.
Filter
The Filter area of the Interface Options Panel is only implemented if the
SPECTRUM Routing Services Management Module is loaded. For more
information, refer to the SPECTRUM Management Module Guide for
Routing Services.
Network Information
The Network Information area of the Interface Options Panel allows you to
select what interface information is displayed in the Network Information
Label of that interface’s Logical Interface Icon. Possible selections are
ADDRESS, NAME, or MASK.
Interface Description
The Interface Description area of the Interface Options Panel displays a
description of the selected interface. If no interface is selected, this field is
empty.
Gauge Control Panel
The Gauge Control Panel (Figure 2-3) allows you to change the type of
statistical information presented in the Logical Gauge area of the Logical
Interface icon.
Device Views
2-8
ATX Switch
Management Module Guide
Accessing the Logical or Interface Device Views
Interface Options Panel
Figure 2-3.
Gauge Control Panel
Gauge Control Panel
Gauge Mode
Rates
Selected Attribute
Load
Totals
Load In
Percentages
Load Out
Packet Rate
Gauge Type
Packet In Rate
Packet Out Rate
Numeric
Error Rate
Linear
Error In Rate
Apply
Keep Settings
Reset
Close
Default
Logical
Gauge
Buttons
To access the Gauge Control Panel, double-click on the Interface Options
Panel, or single-click on the panel to highlight it and then select Gauge
Control Panel from the Icon Subviews menu. The Gauge Control Panel
provides the following information:
•
•
•
•
Selected Attribute
Gauge Mode
Gauge Type
Logical Gauge Buttons
Selected Attribute
This area of the Gauge Control Panel allows you to select the statistical
attribute displayed on the Logical Interface icon’s gauge. The label changes
color to reflect the attribute selected.
Gauge Mode
This area of the Gauge Control Panel allows you to select the mode presented
by the Logical Gauge. Possible selections are Totals, Rates, or Percentages.
The Percentages selection presents the percentage of the interface compared
to the rest of the interfaces. Table 2-5 provides a list of attributes and color
definitions for the Totals mode. Table 2-6 provides a list of attributes and color
definitions for the Rates mode.
9032068 E2
Device Views
2-9
Accessing the Logical or Interface Device Views
Interface Options Panel
Table 2-5.
Totals Gauge Mode Attribute and Color Definitions
Selected
Attribute
Table 2-6.
Color
In Errors
Orange
Out Errors
Orange
In Packets
Blue
Out Packets
Blue
Unknown Protocols
Tan
In No Resource
Yellow
Out No Resource
Yellow
In Octets
Gray
Out Octets
Gray
Rate Gauge Mode Attributes and Color Definitions
Selected
Attribute
Color
Load
Green
Load In
Green
Load Out
Green
Packet Rate
Blue
Packet In Rate
Blue
Packet Out Rate
Blue
Error Rate
Orange
Error In Rate
Orange
Error Out Rate
Orange
Discard Rate
Yellow
Discard In Rate
Yellow
Discard Out Rate
Yellow
Gauge Type
The Gauge Type option allows you to select either a numeric or linear
presentation of the Logical Gauge.
Device Views
2-10
ATX Switch
Management Module Guide
Accessing the Logical or Interface Device Views
Interface Options Panel
Logical Gauge Buttons
The following section describes the Logical Gauge buttons.
Apply
Applies the current settings to the Logical Gauge. It does not save the
settings.
Keep Settings
Saves the current gauge settings while running SpectroGRAPH.
Reset
Resets the settings to the last saved values.
Close
Closes the Gauge Control Panel.
Default
Resets the settings to the SPECTRUM default.
9032068 E2
Device Views
2-11
Accessing the Logical or Interface Device Views
Interface Options Panel
Device Views
2-12
ATX Switch
Management Module Guide
Chapter 3
Configuration Views
What Is in This Chapter
This chapter provides a description of the Configuration views for the ATX
Switch. These views allow you to access device and interface specific
configuration information, as well as traffic flow and error rates. The
following configuration views are available for the ATX Switch management
module.
• Device Configuration
• Interface Configuration
The Interface Configuration view is a sub-view of the Device Configuration
view.
Accessing the Device Configuration View
You can access the Device Configuration view using one of the following
methods:
9032068 E2
3-1
Device Configuration View
• Double-click on the Configuration view label of the ATX Switch device
icon.
Configuration view label
• Highlight the device icon and select Configuration from the Icon
Subviews menu.
Go Back
Go Up
Icon Subviews
view Path
New view
Bookmarks
view History
Current view Info...
Notes...
Jump by name...
Zoom
Map Hierarchy
Close
Navigate
Alarms
Performance
Notes...
Utilities
Zoom
Device
Configuration
Device Configuration View
The Device Configuration view for the ATX Switch provides detailed
information on the ATX Switch's network, host, port, and model configuration.
This view provides the following device configuration-specific information:
Device Name
The user-defined device name. This field is updateable.
Contact Status
The status of the ATX Switch. Possible values are Established, Lost, or Initial.
Number of Interfaces
The number of ports on the ATX Switch.
IF Address Translation
Allows you to the access Interface Address Translation Table; the fields are
described below. This table can be updated.
Configuration Views
3-2
ATX Switch
Management Module Guide
Device Configuration View
Interface Index
A unique value for each interface. Its value ranges between 1 and the value of
ifnumber. The value 0 for each interface must remain constant at least from
one reinitialization of the entity’s network management system to the next
reinitialization.
Physical Address
The interface’s address at the protocol layer immediately below IP in the
protocol stack. The Ethernet address of the bridge is returned, for both
channels of the bridge.
Network Address
The network address for the interface.
Reconfigure
This button allows you to reconfigure the device. When the reconfiguration is
complete, the “Action Successful” dialog box appears.
Interface Configuration Table
The Interface Configuration Table provides port configuration information for
each of the ATX Switch’s ports. The Interface Configuration Table and its
corresponding entry-specific views provide the following information:
Index
The port number on the ATX Switch.
Description
A textual description of the interface. This description may include the name
of the manufacturer, the product name, and the version number of the
hardware interface.
Type
The type of interface for the port. Possible interface types and a brief
description of each type are listed in Table 3-1.
Table 3-1.
ATX Switch Interface Types
Interface Type
9032068 E2
Description
Other
None of the following
ETHERNET
Ethernet CSMA/CD
ISO88023
ISO CSMA/CD
ISO88024
ISO token bus
ISO88025
ISO token ring
FDDI
Fiber Distributed Data Interface
Configuration Views
3-3
Device Configuration View
Table 3-1.
ATX Switch Interface Types (Continued)
Interface Type
Description
PPP
Point to Point Protocol
SLIP
Generic Serial Line IP
Bandwidth
The estimated bandwidth of the interface measured in bits per second. For
interfaces that do not vary in bandwidth or for which no accurate estimate can
be made, a nominal bandwidth is provided.
Physical Address
The Ethernet (MAC) address of the port.
Operation Status
The current operational state of the port (On, Off, or Testing).
Admin Status
The desired operational state of the port (On, Off, or Testing).
Last Change
The System UpTime value when the port entered its current operational
state.
Queue Length
The length of the outbound queue of packets.
Packet Size
The largest Maximum Transmission Unit (MTU) that can be transmitted or
received by the port, measured in octets.
Double-clicking on any column entry for a particular port accesses the
Interface Configuration view. This view is described below.
Interface Configuration View
You can access the IF Configuration view from the Interface icon in the
Interface Device view. The IF Configuration view provides the following
information:
Admin Status
The desired operational state of the port (On, Off, or Testing). You can change
the Admin Status in this view.
Network Name/Address
Displays the network name and IP address for this ATX Switch.
Configuration Views
3-4
ATX Switch
Management Module Guide
Chapter 4
Event and Alarm Messages
What Is in This Chapter
This chapter describes the types of events and alarms generated by the ATX
Switch.
ATX Switch Events and Alarms
Table 4-1 describes the event messages appearing in the Event Log, and any
corresponding probable cause messages that may be displayed in the
Enterprise Alarm Manager view for the ATX Switch.
Table 4-1.
ATX Switch Events and Alarms
Message in the Event Log
Alarm View Probable Cause
Message
CsEvFormat/Event00010306
{d "%w- %d %m-, %Y - %T"} A(n) {t} device, named {m}, has been cold
started. (event [{e}])
No probable cause message.
CsEvFormat/Event00010307
{d "%w- %d %m-, %Y - %T"} A(n) {t} device, named {m}, has been
warm started. (event [{e}])
No probable cause message.
9032068 E2
4-1
ATX Switch Events and Alarms
Table 4-1.
ATX Switch Events and Alarms (Continued)
Message in the Event Log
Alarm View Probable Cause
Message
CsEvFormat/Event00010308
CsPCause/Prob00010308
{d "%w- %d %m-, %Y - %T"} A(n) {t} device, named {m}, has detected
a communication Link Down. (event
[{e}])
Communication link is down.
CsEvFormat/Event00010309
{d "%w- %d %m-, %Y - %T"} A(n) {t} device, named {m}, has detected
a communication Link Up. (event [{e}])
No probable cause message.
CsEvFormat/Event0001030a
CsPCause/Prob0001030a
{d "%w- %d %m-, %Y - %T"} A(n) {t} device, named {m}, has detected
an Authentication Failure. (event [{e}])
Authorization failure. Other user is
trying to connect to device with an
invalid community string.
CsEvFormat/Event0001030b
CsPCause/Prob0001030b
{d "%w- %d %m-, %Y - %T"} A(n) {t} device, named {m}, has detected
an EGP Neighbor Loss. EGP Neighbor
IP address is {0 1}. (event [{e}])
Lost contact with EGP neighbor.
CsEvFormat/Event00010402
CsPCause/Prob00010402
{d "%w- %d %m-, %Y - %T"} Device {m} of type {t} is created with a
physical (MAC) address already used by
another model. (event [{e}])
DUPLICATE PHYSICAL ADDRESS
The model has the same Physical
address (MAC address) as that of
some other model.
CsEvFormat/Event019d0001
CsPCause/Prob019d0001
{d "%w- %d %m-, %Y - %T"} Device {m}, {0 5}, reports a temperature
change to {T SMC_temperature 3}. Trap
severity is {T SMC_Severity 1}.
The device could be hotter or it
could have dropped in
temperature.
CsEvFormat/Event019d0004
CsPCause/Prob019d0004
{d "%w- %d %m-, %Y - %T"} For device, {m}, the number of received
packets lost because of insufficient
buffers is {I 3}. Trap severity is {T
SMC_Severity 1}.
Received packets lost. Insufficient
buffers.
Event and Alarm Messages
4-2
ATX Switch
Management Module Guide
ATX Switch Events and Alarms
Table 4-1.
ATX Switch Events and Alarms (Continued)
Message in the Event Log
9032068 E2
Alarm View Probable Cause
Message
CsEvFormat/Event019d0005
CsPCause/Prob019d0005
{d "%w- %d %m-, %Y - %T"} For device, {m}, number of packets not
sent because of a multicast storm is {I 3}.
Trap severity is {T SMC_Severity 1}.
Packets not sent. Multicast storm.
CsEvFormat/Event019d0006
CsPCause/Prob019d0006
{d "%w- %d %m-, %Y - %T"} For device, {m}, the number of packets
not received because of internal buffer
congestion is {I 3}. Trap severity is {T
SMC_Severity 1}.
Packets not received. Internal
buffer congestion.
CsEvFormat/Event019d0007
CsPCause/Prob019d0007
{d "%w- %d %m-, %Y - %T"} For device, {m}, port, {I 5}, filtered and
discarded a packet from MAC address {0
3}. Trap severity is {T SMC_Severity 1}.
Filtered and discarded a packet. A
port’s combination filter has
exceeded the filter’s limits.
CsEvFormat/Event019d0008
CsPCause/Prob019d0008
{d "%w- %d %m-, %Y - %T"} Debug string, {I 3} received from device,
{m}: {0 5}.
Debug string received from the
device.
CsEvFormat/Event019d0009
CsPCause/Prob019d0009
{d "%w- %d %m-, %Y - %T"} Device, {m}, has finished a loopback test
or detected a loopback error. The current
operational state is {T SMC_LoopBack
3}. Packets transmitted, but not
received: {I 5}. Bad packets received:
{I 7}. Trap severity is
{T SMC_Severity 1}.
A loopback test was completed, or
there is a loopback error.
CsEvFormat/Event019d0013
CsPCause/Prob019d0013
{d "%w- %d %m-, %Y - %T"} Device, {m}, reports the trunking
protocol error, {T SMC_TrunkError 3}.
Trap severity is {T SMC_Severity 1}.
An error has occured in trunking.
Event and Alarm Messages
4-3
ATX Switch Events and Alarms
Table 4-1.
ATX Switch Events and Alarms (Continued)
Message in the Event Log
Alarm View Probable Cause
Message
CsEvFormat/Event019d0016
CsPCause/Prob019d0016
{d "%w- %d %m-, %Y - %T"} - Device, {m},
has rebooted, because of a Fatal Error.
The error information string is {0 3}.
Trap severity is {T SMC_Severity 1}.
Device rebooted because of a fatal
error.
CsEvFormat/Event019d0017
CsPCause/Prob019d0017
{d "%w- %d %m-, %Y - %T"} - For device,
{m}, the Configuration EEPROM has
failed. The device can not be rebooted,
and must be returned to the factory. Trap
severity is {T SMC_Severity 1}.
The Configuration EEPROM has
failed. The device can not be
rebooted, and must be returned to
the factory.
CsEvFormat/Event019d0018
CsPCause/Prob019d0018
{d "%w- %d %m-, %Y - %T"} - Device, {m},
has outbound congestion, and discarded
{I 3} packets. Trap severity is {T
SMC_Severity 1}.
Packets discarded, because of
outbound congestion.
CsEvFormat/Event019d0021
CsPCause/Prob019d0021
{d "%w- %d %m-, %Y - %T"} - Device, {m},
reports the number of hardware errors
in received and transmitted packets
exceeds the port’s limit. Discarded {I 3}
received packets. Discarded {I 5}
transmit packets. Trap severity is {T
SMC_Severity 1}.
The number of hardware errors in
received and transmitted packets
has exceeded the port’s limit.
CsEvFormat/Event019d0200
CsPCause/Prob019d0200
{d "%w- %d %m-, %Y - %T"} - A FDDI
port on device, {m} of type {t} has
detected an attachment configuration
change. The new state is
{T FDDISMTCFState3}. Trap severity is
{T SMC_Severity 1}.
PROBABLE CAUSE: The FDDI
MAC physical connection has
changed.
Event and Alarm Messages
4-4
RECOMMENDED ACTIONS: 1)
Refer to Event log for current
attachment state. 2) Check the A
and B port connections. 3) Check
the upstream and downstream
devices.
ATX Switch
Management Module Guide
ATX Switch Events and Alarms
Table 4-1.
ATX Switch Events and Alarms (Continued)
Message in the Event Log
9032068 E2
Alarm View Probable Cause
Message
CsEvFormat/Event019d0202
CsPCause/Prob019d0202
{d "%w- %d %m-, %Y - %T"} The AC input for the first power supply
on device, {m} of type {t} is
{T SMC_Power 3}. Trap severity is
{T SMC_Severity 1}.
PROBABLE CAUSE: The AC
input to the unit’s first power
supply has changed.
CsEvFormat/Event019d0203
CsPCause/Prob019d0203
{d "%w- %d %m-, %Y - %T"} The AC input for the second power
supply on device, {m} of type {t} is {T
SMC_Power 3}. Trap severity is {T
SMC_Severity 1}.
PROBABLE CAUSE: The AC
input to the unit’s second power
supply has changed.
CsEvFormat/Event019d0204
CsPCause/Prob019d0204
{d "%w- %d %m-, %Y - %T"} The DC output for the first power supply
on device, {m} of type {t} is {T
SMC_Power3}. Trap severity is {T
SMC_Severity 1}.
PROBABLE CAUSE: The DC
output of the unit’s first power
supply has changed.
RECOMMENDED ACTIONS: 1)
Refer to Event log for current AC
input state. If AC input state is
bad, 2) Check first power supply
unit on device. 3) Check power
source to device.
RECOMMENDED ACTIONS: 1)
Refer to Event log for current AC
input state. If AC input is bad, 2)
Check second power supply unit
on device. 3) Check power source
to device.
RECOMMENDED ACTIONS: 1)
Refer to Event log for current DC
output state. If DC output state is
bad, 2) Check first power supply
unit on device. 3) Check power
source to device.
Event and Alarm Messages
4-5
ATX Switch Events and Alarms
Table 4-1.
ATX Switch Events and Alarms (Continued)
Message in the Event Log
Alarm View Probable Cause
Message
CsEvFormat/Event019d0205
CsPCause/Prob019d0205
{d "%w- %d %m-, %Y - %T"} The DC output for the second power
supply on device, {m} of type {t} is {T
SMC_Power 3}. Trap severity is {T
SMC_Severity 1}.
PROBABLE CAUSE: The DC
output of the unit’s second power
supply has changed.
CsEvFormat/Event019d0211
CsPCause/Prob019d0211
{d "%w- %d %m-, %Y - %T"} The optical bypass for FDDI port {I 4}
has become {T SMC_FddiSB 3} for device
{m} of type {t}. Trap severity is {T
SMC_Severity 1}.
PROBABLE CAUSE: The FDDI
port optical bypass has changed.
CsEvFormat/Event019d0212
CsPCause/Prob019d0212
{d "%w- %d %m-, %Y - %T"} The fuse to the optical bypass for the
FDDI port {I 4} is {T SMC_FddiOBS 3}
for device {m} of type {t}. Trap severity is
{T SMC_Severity 1}.
PROBABLE CAUSE: The state of
the FDDI port optical bypass fuse
has changed.
CsEvFormat/Event019d0213
CsPCause/Prob019d0213
{d "%w- %d %m-, %Y - %T"} The FDDI port’s Station State for FDDI
port {I 4} on device {m} of type {t} has
changed to {0 3}. Trap severity is {T
SMC_Severity 1}.
PROBABLE CAUSE: The Station
state of the FDDI port has
changed.
Event and Alarm Messages
4-6
RECOMMENDED ACTIONS: 1)
Refer to Event log for current DC
output state. If DC output state is
bad, 2) Check second power
supply unit on device. 3) Check
power source to the device.
RECOMMENDED ACTIONS: 1)
Refer to Event log for current
optical bypass port state. 2) Check
the optical bypass port.
RECOMMENDED ACTIONS:
1)Refer to Event log for current
optical bypass fuse state.
RECOMMENDED ACTIONS: 1)
Refer to Event log for state
infomation.
ATX Switch
Management Module Guide
ATX Switch Events and Alarms
Table 4-1.
ATX Switch Events and Alarms (Continued)
Message in the Event Log
9032068 E2
Alarm View Probable Cause
Message
CsEvFormat/Event019d0214
CsPCause/Prob019d0214
{d "%w- %d %m-, %Y - %T"} The actual line speed for WAN port {I 4}
on device {m} of type {t} has changed to
{T SMC_WanSpeed 3}. Trap severity is
{T SMC_Severity 1}.
PROBABLE CAUSE: The actual
line speed of the WAN port has
changed.
CsEvFormat/Event019d0216
CsPCause/Prob019d0216
{d "%w- %d %m-, %Y - %T"} A module in device, {m} of type {t}, has
malfunctioned, causing a Fatal Error.
The error information string is: {0 3}.
Trap severity is {T SMC_Severity 1}.
PROBABLE CAUSE: A module
has failed.
CsEvFormat/Event019d0217
CsPCause/Prob019d0217
{d "%w- %d %m-, %Y - %T"} A module in device, {m} of type {t}, has
failed diagnostics. The diagnostic status
is: {T SMC_DiagStatus 3}. Additional
diagnostic code information is: {1 5}.
Trap severity is {T SMC_Severity 1}.
PROBABLE CAUSE: A module
has failed diagnostics.
CsEvFormat/Event019d0218
CsPCause/Prob019d0218
{d "%w- %d %m-, %Y - %T"} Module {I 4} of type {T SMC_hwType 3},
does not match it’s defined type of {T
SMC_hwType 5} in device {m} of type {t}.
Trap severity is {T SMC_Severity 1}.
PROBABLE CAUSE: A module
does not match its defined type.
CsEvFormat/Event019d0219
CsPCause/Prob019d0219
{d "%w- %d %m-, %Y - %T"} A port module {I 4} of type {0 3}, does not
match it’s defined type of {0 5} in device
{m} of type {t}. Trap severity is {T
SMC_Severity 1}.
PROBABLE CAUSE: A port does
not match its defined type.
RECOMMENDED ACTIONS: 1)
Refer to the Event log for line
speed information.
RECOMMENDED ACTIONS: 1)
Refer to Event log for status
information. 2) Check module
configuration.
RECOMMENDED ACTIONS: 1)
Refer to Event log for status
information. 2) Check module
configuration.
RECOMMENDED ACTIONS: 1)
Refer to Event log for module
information. 2) Check slot
configuration.
RECOMMENDED ACTIONS: 1)
Refer to Event log for port
information. 2) Check module and
slot configuration.
Event and Alarm Messages
4-7
ATX Switch Events and Alarms
Table 4-1.
ATX Switch Events and Alarms (Continued)
Message in the Event Log
Alarm View Probable Cause
Message
CsEvFormat/Event019d0220
CsPCause/Prob019d0220
{d "%w- %d %m-, %Y - %T"} A port on a module {1 4} of type {0 3}, has
a bad port status in device {m} of type {t}.
Trap severity is {T SMC_Severity 1}.
PROBABLE CAUSE: A port on
this module has a bad port status.
CsEvFormat/Event019d0221
CsPCause/Prob019d0221
{d "%w- %d %m-, %Y - %T"} A Duplicate MAC Address has been
detected on FDDI ring attached to device
{m} of type {t}. Trap severity is {T
SMC_Severity 1}.
PROBABLE CAUSE: Two or more
stations with the same MAC
address were detected on the
network.
RECOMMENDED ACTIONS: 1)
Refer to Event log for port
information. 2) Check cable
connections.
RECOMMENDED ACTIONS:
MAC address must be unique on
the network. 1) Locate the
offending stations and change the
adaptor cards.
Event and Alarm Messages
4-8
ATX Switch
Management Module Guide
Index
A
Action Successful 3-3
Address
MAC 2-4
Network 2-8
Admin Status 3-4
Administrative Status Label 2-5
Alarm
Messages 4-1
Apply Button 2-11
Attribute
Selected 2-9
B
Bandwidth 3-3
Blue 2-10
Button
Apply 2-11
Close 2-11
Default 2-11
Keep Settings 2-11
Reset 2-11
C
Config button 2-5
Conventions x
D
Default 2-11
Description 3-3
Device Configuration View
Contact Status 3-2
Number of Interfaces 3-2
Device Configuration view 3-1
Device Icon Panel 2-8
Device Topology View 2-5
Device Topology View Label 2-5
Device view banner 2-8
Device Views
Chassis 2-1
Interface 2-1
Discard Breakdown Pie Chart 2-8
Discard In Rate 2-10
Discard Out Rate 2-10
Discard Rate 2-10
DLM 1-2
E
Error In Rate 2-10
Error Out Rate 2-10
Error Rate 2-10
error rate 3-1
estimated bandwidth 2-6
Event
Messages 4-1
F
FDDI
Switch
Events and Alarms 4-1
Filter 2-8
G
Gauge
Control Panel 2-8
Logical 2-4, 2-8
Mode 2-9
Type 2-10
Getting Help xi
Gray 2-10
Green 2-10
I
ICMP_App 1-2
IF Address Translation Table Label/Physical
Address 2-6
IF Configuration View 2-5
9032068 E2
1
IF Configuration View label 2-5
IF Status label 2-5
IF Status View 2-5
IF Status View Label 2-5
Administrative Status 2-5
Operational Status 2-5
ifnumber 3-2
In Errors 2-10
In No Resource 2-10
In Octets 2-10
In Packets 2-10
Index 3-3
Interface
Description 2-8
Number 2-4
Percentages 2-9
Interface Adddress Translation Table 3-2
Interface Configuration View
Admin Status 2-6
Bandwidth 2-6
Last Change 2-6
Network Name/Address 2-6
Operation Status 2-5
Packet Size 2-6
Physical Address 2-6
Queue Length 2-6
Interface Configuration view 3-4
Interface Detail View 2-7
Interface Device View 2-1
Interface Index 3-2
Interface Number Label 2-5
Interface Type Label 2-5
IP Application 1-2
IP2_App 1-2
L
Last
Change 3-4
Load 2-10
In 2-10
Out 2-10
Logical Gauge 2-7
Logical Interface Icon 2-4
Logical LAN Interface Icons 2-4
Address
Label 2-4
Mask
Network 2-8
Maximum Transmission Unit 3-4
MIB-II 1-2
Mode
Gauge 2-9
model configuration 3-2
MTU 3-4
Multi-Attribute Line Graph 2-7
N
Name
Network 2-8
Network
Information 2-4, 2-8
Network Information Panel Label 2-6
Network Name 3-4
Notice i
O
Operation Status 3-4
Orange 2-10
Out Errors 2-10
Out No Resource 2-10
Out Octets 2-10
Out Packets 2-10
outbound packet queue 2-6
P
Packet Breakdown Pie Charts 2-7
Packet In Rate 2-10
Packet Out Rate 2-10
Packet Rate 2-10
Packet Size 3-4
Performance View 2-7
Performance View Label 2-7
Physical Address 3-3
Port Type Label 2-4
protocol stack 3-2
Protocols
Unknown 2-10
M
MAC
Index
2
ATX Switch
Management Module Guide
Q
Y
Queue Length 3-4
Yellow 2-10
R
Rates 2-9
reconfigure the device 3-3
Related Reading x, xi
Restricted Rights Notice ii
RMON 1-2
S
Selected 2-9
SNMP2_Agent 1-2
SPECTRUM
Portable Management Application 1-3
SPMA
Application View 1-3
Community Names 1-4
Front Panel Redundancy 1-3
Generic SNMP (MIB I II) 1-4
Status
Administrative 2-4
System UpTime value 2-6
System2_App 1-2
T
Tan 2-10
TCP/IP Based Networks xi
Terminology x
Totals 2-9
Trademarks i
traffic flow 3-1
Type 3-3
U
UDP
Application 1-2
UDP2_App 1-2
V
Virus Disclaimer i
9032068 E2
Index
3