1
®
FRX4000 and FRX6000
Management Module Guide
Notice
Cabletron Systems reserves the right to make changes in specifications and other information
contained in this document without prior notice. The reader should in all cases consult Cabletron
Systems to determine whether any such changes have been made.
The hardware, firmware, or software described in this manual is subject to change without notice.
IN NO EVENT SHALL CABLETRON SYSTEMS BE LIABLE FOR ANY INCIDENTAL,
INDIRECT, SPECIAL, OR CONSEQUENTIAL DAMAGES WHATSOEVER (INCLUDING BUT
NOT LIMITED TO LOST PROFITS) ARISING OUT OF OR RELATED TO THIS MANUAL OR
THE INFORMATION CONTAINED IN IT, EVEN IF CABLETRON SYSTEMS HAS BEEN
ADVISED OF, KNOWN, OR SHOULD HAVE KNOWN, THE POSSIBILITY OF SUCH
DAMAGES.
Virus Disclaimer
Cabletron has tested its software with current virus checking technologies. However, because no
anti-virus system is 100% reliable, we strongly caution you to write protect and then verify that
the Licensed Software, prior to installing it, is virus-free with an anti-virus system in which you
have confidence.
Cabletron Systems makes no representations or warranties to the effect that the Licensed
Software is virus-free.
Copyright © February, 1998 by Cabletron Systems, Inc. All rights reserved.
Printed in the United States of America.
Order Number: 9032285 E1
Cabletron Systems, Inc.
P.O. Box 5005
Rochester, NH 03866-5005
SPECTRUM, SPECTRUM IMT/VNM logo, DCM, IMT and VNM are registered trademarks,
and SpectroGRAPH, SpectroSERVER, Device Communications Manager, Inductive
Modeling Technology, and Virtual Network Machine are trademarks of Cabletron Systems,
Inc.
Ethernet is a trademark of Xerox Corporation.
9032285 E1
i
Restricted Rights Notice
(Applicable to licenses to the United States Government only.)
1. Use, duplication, or disclosure by the Government is subject to restrictions as set forth in
subparagraph (c) (1) (ii) of the Rights in Technical Data and Computer Software clause at
DFARS 252.227-7013.
Cabletron Systems, Inc., 35 Industrial Way, Rochester, New Hampshire 03866-0505.
2. (a) This computer software is submitted with restricted rights. It may not be used,
reproduced, or disclosed by the Government except as provided in paragraph (b) of this
Notice or as otherwise expressly stated in the contract.
(b) This computer software may be:
(c)
(1)
Used or copied for use in or with the computer or computers for which it was
acquired, including use at any Government installation to which such computer or
computers may be transferred;
(2)
Used or copied for use in a backup computer if any computer for which it was
acquired is inoperative;
(3)
Reproduced for safekeeping (archives) or backup purposes;
(4)
Modified, adapted, or combined with other computer software, provided that the
modified, combined, or adapted portions of the derivative software incorporating
restricted computer software are made subject to the same restricted rights;
(5)
Disclosed to and reproduced for use by support service contractors in accordance with
subparagraphs (b) (1) through (4) of this clause, provided the Government makes
such disclosure or reproduction subject to these restricted rights; and
(6)
Used or copied for use in or transferred to a replacement computer.
Notwithstanding the foregoing, if this computer software is published copyrighted
computer software, it i s licensed to the Government, without disclosure prohibitions, with
the minimum rights set forth in paragraph (b) of this clause.
(d) Any other rights or limitations regarding the use, duplication, or disclosure of this
computer software are to be expressly stated in, or incorporated in, the contract.
(e) This Notice shall be marked on any reproduction of this computer software, in whole or in
part.
ii
FRX4000 and FRX6000
Management Module Guide
Contents
Preface
What Is in This Guide .......................................................................................................... ix
Conventions ........................................................................................................................... x
Related SPECTRUM Documentation................................................................................... x
Other Related Documentation ............................................................................................. xi
Chapter 1
Introduction
What Is in This Chapter..................................................................................................... 1-1
FRX4000 and FRX6000 Devices ........................................................................................ 1-1
SPECTRUM Support.......................................................................................................... 1-2
Accessing SPECTRUM Views from the Device Icon .................................................. 1-2
Accessing Device-Specific Subviews............................................................................ 1-4
Using Standard Table Buttons.................................................................................... 1-5
Roadmap of SPECTRUM Views ........................................................................................ 1-6
SPMA Support .................................................................................................................... 1-6
Chapter 2
Device View
What Is in This Chapter..................................................................................................... 2-1
Interface Device View ......................................................................................................... 2-1
Interface Options Panel ............................................................................................... 2-3
Interface Description Map..................................................................................... 2-4
Gauge Control Panel ............................................................................................. 2-4
Interface Icon................................................................................................................ 2-8
Interface Label....................................................................................................... 2-9
Interface Type Label .............................................................................................. 2-9
MAC Address Label............................................................................................... 2-9
Gauge Label ......................................................................................................... 2-10
Chapter 3
Configuration Views
What Is in This Chapter..................................................................................................... 3-1
Device Configuration View ................................................................................................. 3-2
Device Configuration Information .............................................................................. 3-2
Interface Configuration Table ..................................................................................... 3-3
Interface Configuration View............................................................................................. 3-4
9032285 E1
iii
Chapter 4
Event and Alarm Messages
What Is in This Chapter .....................................................................................................4-1
FRX4000 and FRX6000 Events and Alarms .....................................................................4-1
Chapter 5
Application View
What Is in This Chapter .....................................................................................................5-1
Common Applications .........................................................................................................5-1
Device Application View .....................................................................................................5-2
Netlink Application.............................................................................................................5-5
Netlink RLP ConfigurationView..................................................................................5-5
Netlink Trap Address Table .........................................................................................5-6
Index
iv
FRX4000 and FRX6000
Management Module Guide
Figures
Chapter 1
Figure 1-1.
Figure 1-2.
Figure 1-3.
Figure 1-4.
Chapter 2
Figure 2-1.
Figure 2-2.
Figure 2-3.
Chapter 5
Figure 5-1.
Figure 5-2.
Introduction
Using Double-Click Zones to Access SPECTRUM Views ................................... 1-3
Accessing Icon Subviews Menus from the Device Icon ....................................... 1-4
Accessing Icon Subviews Menus from Labels ..................................................... 1-4
SPECTRUM Views Roadmap .............................................................................. 1-5
Device View
Interface Device View .......................................................................................... 2-2
Gauge Control Panel ............................................................................................ 2-5
Interface Icon ........................................................................................................ 2-8
Application View
Device Application View (Icon Mode) .................................................................. 5-3
Device Application View (List Mode) ................................................................... 5-4
9032285 E1
v
vi
FRX4000 and FRX6000
Management Module Guide
Tables
Chapter 2
Table 2-1.
Table 2-2.
Table 2-3.
Chapter 4
Table 4-1.
Device View
Interface Options Panel Icon Subviews Menu ..................................................... 2-3
Rates Gauge Mode: Attributes and Corresponding Colors ................................. 2-6
Totals Gauge Mode: Attributes and Corresponding Colors................................. 2-6
Event and Alarm Messages
ELS10 Events and Alarms .................................................................................... 4-1
9032285 E1
vii
viii
FRX4000 and FRX6000
Management Module Guide
Preface
Use this guide as a reference for the SPECTRUM FRX4000 and FRX6000
management software. Before reading this guide, you should be familiar with
SPECTRUM’s functions and navigational techniques. Also become familiar
with any network management and hardware requirements described in the
related hardware documentation.
For the purposes of this guide, the FRX4000 and FRX6000 are referred to as
“device.”
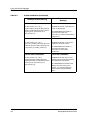
What Is in This Guide
The following chapter descriptions outline the organization of the FRX4000
and FRX6000 Management Module Guide:
Chapter
Description
Introduction
Describes the device, management module software,
and the model types.
Chapter 2
Describes the Device views representing this device.
Chapter 1
Device View
Chapter 3
Configuration Views
Describes the Configuration views for the device
and the network information provided by the views.
Chapter 4
Lists and explains the alarm and event messages
Event and Alarm Messages generated in the Event Log or Alarm Manager for
the device model type.
Chapter 5
Application View
Describes the Application view and the application
specific information for the device.
9032285 E1
ix
Conventions
Conventions
This guide uses the following conventions:
• Menu selections and buttons referenced in text are printed in bold; for
example, Configuration or Detail.
• Buttons names appear in shadowed boxes when introducing paragraphs
describing their use; for example:
Help
• Menu navigation appears in order of selection; for example, Icon
Subviews -> Utilities -> Application.
• Referenced chapter titles and section headings appear in italics.
• Referenced documents appear in bold italics.
• The FRX4000 and FRX6000 are referred to as “device.”
Related SPECTRUM Documentation
Refer to the following documentation for more information on using
SPECTRUM:
Report Generator User’s Guide
Getting Started with SPECTRUM for Operators
Getting Started with SPECTRUM for Administators
How to Manage Your Network with SPECTRUM
x
FRX4000 and FRX6000
Management Module Guide
Other Related Documentation
Other Related Documentation
Refer to the following documentation for more information on managing TCP/
IP-based networks:
Martin, James, Kathleen Kavanagh Chapman, and Joe Leben. Local Area
Networks: Architectures and Implementations, 2d ed. Englewood Cliffs,
NH: Prentice-Hall, 1994.
Miller, Mark. LAN Troubleshooting Handbook, M&T Publishing, Inc.,
1989.
Rose, Marshall T. The Simple Book: An Introduction to Management of
TCP/IP-based Internets, Englewood Cliffs, NJ: Prentice-Hall, 1991.
Tannenbaum, Andrew S. Computer Networks, 3d ed. Englewood Cliffs, NJ:
Prentice-Hall, 1994.
9032285 E1
xi
Other Related Documentation
xii
FRX4000 and FRX6000
Management Module Guide
Chapter 1
Introduction
What Is in This Chapter
This chapter introduces the SPECTRUM Management Modules for the
FRX4000 and FRX6000 Netlink Frame Relay devices. It describes the
following:
•
•
•
•
•
FRX4000 and FRX6000 Devices
SPECTRUM Model Types
Accessing SPECTRUM Views
Roadmap of SPECTRUM Views
SPMA Support
FRX4000 and FRX6000 Devices
The FRX4000 and FRX6000 Netlink Frame Relay devices provide access to
remote devices. The FRX4000 is used where eight serial interfaces or fewer
are required. The FRX6000 supports up to sixty-four serial interfaces and can
function as a central-site device for remote FRX4000’s.
9032285 E1
1-1
Introduction
SPECTRUM Model Types
SPECTRUM Model Types
The model type refers to the management module software package used to
specify attributes, actions, and associations for the physical device using the
Simple Network Management Protocol (SNMP) and Management Information
Bases (MIBs). The model types for the FRX4000 and FRX6000 Netlink Frame
Relay devices are:
• FRX4000
• FRX6000
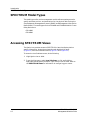
Accessing SPECTRUM Views
The Device icon provides access to SPECTRUM views that display devicespecific information. Access these views through double-click zones
(Figure 1-1) and Icon Subviews menus (Figure 1-2 and Figure 1-3).
To access the Icon Subviews menu, do the following:
1. Highlight the icon or label.
2. From the View menu, select Icon Subviews, or click and hold the
applicable mouse button (middle or right) over the icon or label. Refer to
the SPECTRUM Views for information on configuring your mouse.
1-2
FRX4000 and FRX6000
Management Module Guide
Introduction
Accessing SPECTRUM Views
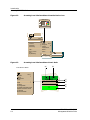
Figure 1-1.
Using Double-Click Zones to Access SPECTRUM Views
Accesses the Configuration view; see
Chapter 3, Configuration Views.
Accesses the Device Topology
view; refer to the
SPECTRUM Views.
Model Name
Accesses the Device view last
opened; see Chapter 2, Device
View.
FRX4000
Accesses the Application
view; see Chapter 5,
Application View.
Accesses the Performance
view; refer to the
SPECTRUM Views.
Accesses the Configuration view; see
Chapter 3, Configuration Views.
Model Name
Accesses the Device view
last opened; see Chapter 2,
Device View.
Accesses the Device
Topology view; refer to the
SPECTRUM Views.
FRX6000
Accesses the Performance
view; refer to the
SPECTRUM Views.
Accesses the Application view;
see Chapter 5, Application
View.
9032285 E1
1-3
Introduction
Accessing SPECTRUM Views
Figure 1-2.
Accessing Icon Subviews Menus from the Device Icon
Model Name
FRX6000
View
Ctrl+b
Go Back
Go Up
Icon Subviews
View Path
New View
Bookmarks
View History
Current View Info...
Notes...
Jump by name...
Zoom
Map Hierarchy
Figure 1-3.
Device
DevTop
Logical
Interface
Accessing Icon Subviews Menus from Labels
Icon Subviews Menu:
Close
Ctrl+c
Navigate
Alarms
Performance
Notes...
Utilities
Detail
IF Status
IF Configuration
IF Address Translation Table
Network Information Panel
Thresholds
Model Information
1-4
Close
Ctrl+c
Navigate
Alarms
Performance
Notes...
Utilities
Zoom
(a)
(b)
1
ON
Ethernet
0:0:1D:17:2F:3C
(c)
(d)
(e)
0
(f)
FRX4000 and FRX6000
Management Module Guide
Introduction
Roadmap of SPECTRUM Views
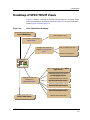
Roadmap of SPECTRUM Views
Figure 1-4 shows a “roadmap” of the SPECTRUM views for this device. These
views are accessible from double-click zones (Figure 1-1) and Icon Subviews
menus (Figure 1-2 and Figure 1-3).
Figure 1-4.
SPECTRUM Views Roadmap
Performance view; refer to the
SPECTRUMViews.
Interface Device view
Device views; see Chapter 2,
Device View.
Configuration view; see
Chapter 3, Configuration
Views.
Device Configuration view
Interface Configuration
Model Name
FRX6000
MIB II Application: refer to MIB-II
Applications
GenBridge Application: refer to
Bridging Applications.
Application view; see
Chapters 5-9,
Application View.
Ethernet Application: refer to
Miscellaneous Applications.
Token Ring Application: refer to
Miscellaneous Applications.
Frame Relay Application: refer to
Miscellaneous Applications.
DevTop view; refer to the
Netlink (FRX) Application
SPECTRUM Views.
9032285 E1
1-5
Introduction
SPMA Support
SPMA Support
SPECTRUM also supports the SPECTRUM Portable Management
Application (SPMA) functionality for the device. To open the SPMA
Application view from any SPECTRUM view, do the following:
1. Highlight the Device icon.
2. From the View menu, select Icon Subviews -> Utilities -> Application.
The SPMA views are described in the SPECTRUM Portable Management
Application Tools Guide.
1-6
FRX4000 and FRX6000
Management Module Guide
Chapter 2
Device View
What Is in This Chapter
This chapter describes the following Interface Device view and its subviews
available for the FRX4000 and FRX6000 Netlink Frame Relay devices.
See Chapter 1, Introduction, for information on Accessing SPECTRUM Views.
Interface Device View
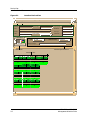
This view provides dynamic configuration and performance information for
each interface on this device. If the configuration changes, SPECTRUM
modifies the Device view after the next polling cycle to reflect the new
configuration. This view also provides a Device icon which allows you to
monitor the device operation and access other device-specific views. Figure 2-1
shows an example of the Interface Device view.
9032285 E1
2-1
Device View
Interface Device View
Figure 2-1.
Interface Device View
Model Name of type CSI_FRX6000 of Landscape : Primary
*
File
View
Help?
Model Name
System Up Time
Network Address
Contact
Manufacturer
Description
Device Type
Serial Number
Primary-Application
Location
Model Name
Find
Network Information
Phy Addr
ADDRESS
Interface Description
FRX6000
Interface Options Panel
Device Icon
Interface Icons
9
ON
13 ON
1
ON
5
ON
FrameRelay
iso88025
Ethernet
Other
0:0:1D:17:2F:3C 0:0:1D:17:2F:3C 0:0:1D:17:2F:3C 0:0:1D:17:2F:3C
0
0
0
10 ON
2
ON
6
ON
Ethernet
FrameRelay rfc877X25
0:0:1D:17:2F:3C 0:0:1D:17:2F:3C 0:0:1D:17:2F:3C
0
0
0
0
3
ON
7
ON
11 ON
Ethernet
Ethernet
Ethernet
0:0:1D:17:2F:3C 0:0:1D:17:2F:3C 0:0:1D:17:2F:3C
0
0
0
4
ON
8
ON
12 ON
Ethernet
Ethernet
Ethernet
0:0:1D:17:2F:3C 0:0:1D:17:2F:3C 0:0:1D:17:2F:3C
0
2-2
0
0
FRX4000 and FRX6000
Management Module Guide
Device View
Interface Device View
Interface Options Panel
This area of the Interface Device view (Figure 2-1) allows you to modify the
presentation of the highlighted Interface icon. Double-click the background (a
non-text area) of this panel to open the Gauge Control Panel, described on
Page 2-4. Table 2-1 lists the Icon Subviews menu selections available for this
panel
Table 2-1.
Interface Options Panel Icon Subviews Menu
Menu Selection
Description
Inf Description Map
Opens the Interface Description Map described on Page 2-4.
Gauge Control Panel
Opens the Gauge Control Panel described on Page 2-4.
The Interface Options Panel provides the following information:
Find
Allows you to quickly locate a specific interface by selecting one of the
following search categories as follows:
•
•
•
•
Phy Addr
IP Address
Type
Net Name
1. Double-click a category. This opens a dialog box.
2. Enter the interface to be found.
3. Click OK . The corresponding area of the relevant icon or icons becomes
highlighted.
Network Information
Allows you to select the kind of information displayed in the Network
Information Label of the highlighted icon. Possible selections are ADDRESS,
NAME, or MASK.
Interface Description
Describes the highlighted interface. If no interface is highlighted, this field is
empty. Double-click this field to access the Interface Description Map view
described below.
9032285 E1
2-3
Device View
Interface Device View
Interface Description Map
This view provides a table mapping the interface index number to the
description of the interface. To access this view, double-click the Interface
Description field on the Interface Options Panel or do the following:
1. Highlight the Interface Options panel.
2. From the View menu, select Icon Subviews -> Inf Description Map.
The Interface Description Map table provides the following information:
Index
Displays the number corresponding to the port’s interface.
Description
Displays a description of the interface; for example, Ethernet/802.3 T.
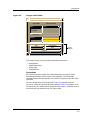
Gauge Control Panel
This panel (Figure 2-2) allows you to change the type of statistical information
displayed on the Gauge label of the Interface icon. To access the Gauge
Control Panel, double-click the background (a non-text area) of the Interface
Options panel or do the following:
1. Highlight the Interface Options panel.
2. From the View menu, select Icon Subviews -> Gauge Control Panel.
2-4
FRX4000 and FRX6000
Management Module Guide
Device View
Interface Device View
Figure 2-2.
Gauge Control Panel
Gauge Control Panel
Gauge Mode
Selected Attribute
Rates
Load
Totals
Load In
Percentages
Load Out
Packet Rate
Gauge Type
Packet In Rate
Packet Out Rate
Numeric
Error Rate
Linear
Error In Rate
Apply
Keep Settings
Reset
Close
Gauge
Buttons
Default
The Gauge Control Panel provides the following information:
•
•
•
•
Gauge Mode
Selected Attribute
Gauge Type
Gauge Buttons
Gauge Mode
This area allows you to select the mode presented by the Logical Gauge.
Possible selections are Totals, Rates, or Percentages. The Percentages
selection presents the percentage of the interface compared to the rest of the
interfaces.
The color displayed on the Gauge Label (Figure 2-3) depends upon the
particular mode and statistical attribute selected. Table 2-2 provides a list of
attributes and color definitions for the Rates mode. Table 2-3 provides a list of
attributes and color definitions for the Totals mode.
9032285 E1
2-5
Device View
Interface Device View
Table 2-2.
Rates Gauge Mode: Attributes and Corresponding Colors
Selected
Attribute
Table 2-3.
Color
Load
Green
Load In
Green
Load Out
Green
Packet Rate
Blue
Packet In Rate
Blue
Packet Out Rate
Blue
Error Rate
Orange
Error In Rate
Orange
Error Out Rate
Orange
Discard Rate
Tan
Discard In Rate
Tan
Discard Out Rate
Tan
Totals Gauge Mode: Attributes and Corresponding Colors
Selected
Attribute
Color
In Errors
Orange
Out Errors
Orange
In Packets
Blue
Out Packets
Blue
Unknown Protocols
Yellow
In No Resource
Tan
Out No Resource
Tan
In Octets
Green
Out Octets
Green
Selected Attribute
This area of the Gauge Control Panel allows you to select the statistical
attribute displayed on the Interface icon’s Gauge label. The label changes
color to reflect the attribute selected.
2-6
FRX4000 and FRX6000
Management Module Guide
Device View
Interface Device View
Gauge Type
This option allows you to select either a numeric or linear display on the
Gauge label.
Gauge Buttons
This area of the Gauge Control Panel provides the following buttons:
Apply
Applies the current settings to the Gauge label temporarily but does not save
the settings.
Keep Settings
Saves the current settings while running SpectroGRAPH. The settings return
to default when you restart SpectroGRAPH.
Reset
Returns the settings to the previously saved values.
Close
Closes the Gauge Control Panel.
Default
Resets the settings to the SPECTRUM default.
9032285 E1
2-7
Device View
Interface Device View
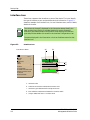
Interface Icon
These icons represent the interfaces or ports of the device. The icons identify
the type of interface or port and provide statistical information. Figure 2-3
shows an example of an interface icon, its Icon Subviews menu, and its labels/
double-click zones.
NOTE
The callouts (a through f) displayed in the illustration below identify the
label and the view to which it provides double-click access. Example:
Interface Type Label/Interface Configuration View displays the interface
type and provides double-click access to the Interface Configuration view.
The menu displayed in the illustration is the Icon Subviews menu for that
Interface icon.
Figure 2-3.
Interface Icon
Icon Subviews Menu:
Close
Ctrl+c
Navigate
Alarms
Performance
Notes...
Utilities
Detail
IF Status
IF Configuration
IF Address Translation Table
Network Information Panel
Thresholds
Model Information
(a)
(b)
1
ON
Ethernet
(c)
0:0:1D:17:2F:3C
(d)
0
(e)
a. Interface Label
b. Administrative Status Label/Interface Status View
c. Interface Type Label/Interface Configuration View
d. MAC Address Label/Interface Address Translation Table
e. Gauge Label/Performance - CSIIfPort View
2-8
FRX4000 and FRX6000
Management Module Guide
Device View
Interface Device View
Interface Label
This label displays the number identifying this interface.
Administrative Status Label
This label displays the status of this interface (On or Off). Double-click this
label to open the Interface Status view. The Interface Status view provides the
following information:
Color
Status
Description
Green
ON
Port is operational.
Blue
OFF
Port is off.
Yellow
TST
Port is in the test mode.
Operational Status
Displays the current operational state of this interface. Possible states are:
• On
• Off
• TST
Administrative Status
This menu-button allows you to change the current administrative state of the
port. Possible selections are:
•
•
•
•
On (select this to enable the interface)
Off (select this to disable the interface)
Testing
Default
Interface Type Label
This label displays the interface type. Double-click this label to open the
Interface Configuration View described on Page 3-4.
MAC Address Label
This label displays the Media Access Control (MAC) or physical address of the
interface. Double-click this label to open the Interface Address Translation
Table, which cross-references device IP address to device MAC (Ethernet)
addresses for selected nodes between networks. Double-click any table entry
to access an address-specific information view.
9032285 E1
2-9
Device View
Interface Device View
Gauge Label
This label displays the performance statistic determined by the Gauge Control
Panel for this interface. See Gauge Control Panel described earlier in this
chapter for more information. Double-click this label to open the Performance
view described in the SPECTRUM Views.
2-10
FRX4000 and FRX6000
Management Module Guide
Chapter 3
Configuration Views
What Is in This Chapter
This chapter describes the following Configuration views available for the
FRX4000 and FRX6000 Netlink Frame Relay devices:
• Device Configuration
• Interface Configuration
These views display network configuration and operating status as well as
network traffic flow.
See Chapter 1, Introduction, for information on Accessing SPECTRUM Views.
9032285 E1
3-1
Configuration Views
Device Configuration View
Device Configuration View
This view provides information on the configuration and operating status of
the device. To access this view, double-click on the model name of the device
icon, or do the following:
1. Highlight the device icon.
2. From the View menu, select Icon Subviews -> Configuration.
Device Configuration Information
This section of the Configuration view provides device-specific information.
Device Name
Displays the user-defined model name of the device.
Contact Status
Indicates if a connection with the device has been established.
Number of Interfaces
Displays the number of interfaces on the device.
Router Redundancy
This button gives you a choice of two options, True and False.
.
IF Address Translation
Accesses the Interface Address Translation Table, which cross-references
device IP addresses to device MAC (Ethernet) addresses for selected nodes
between networks.
Reconfigure
Allows you to reconfigure the table. Upon completion, a pop-up window
appears stating that the action was successful. Click the Close button.
3-2
FRX4000 and FRX6000
Management Module Guide
Configuration Views
Device Configuration View
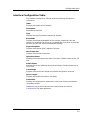
Interface Configuration Table
The Interface Configuration Table provides the following configuration
information:
Index
Displays the number of the interface.
Description
Describes the interface.
Type
Displays the type of hardware interface for the port.
Bandwidth
Displays the estimated bandwidth of the interface, measured in bits per
second. For interfaces that do not vary in bandwidth or for which no accurate
estimate can be made, a nominal bandwidth displays.
Physical Address
Displays the Ethernet (MAC) address of the port.
Max Frame Size
Displays the maximum frame size.
Operation Status
Displays the current operational state of this port. Possible values are On, Off
Test.
Admin Status
Displays the current administrative state of the port. Possible values are On,
Off, or Test.
Last Change
Displays the time the last change to the device configuration occurred.
Queue Length
Displays the number of packets in the queue.
Packet Size
Displays the largest packet, measured in octets, that can be transmitted or
received by the port.
Double-click any of the fields within this table to open the Interface
Configuration View described below.
9032285 E1
3-3
Configuration Views
Interface Configuration View
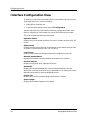
Interface Configuration View
To access this view from the Interface Device view, double-click the Interface
Type Label of the icon, or do the following:
1. Highlight the Interface icon.
2. From the Icon Subviews menu, select IF Configuration.
You can also access this view from the Interface Configuration Table of the
Device Configuration view. Double-click any of the fields within the table.
This view provides the following information:
Operation Status
Displays the current operating status of the port. Possible values are On, Off,
or Test.
Admin Status
Provides a button that allows you to change the current administrative state
of the port. Possible values are On, Off, or Testing.
Last Change
Displays the time the last change to the device configuration occurred.
Network Name/Address
Displays the network name and address connected to this interface.
Physical Address
Displays the physical (MAC) address of the port.
Bandwidth
Displays the estimated bandwidth of the interface measured in bits per
second. For interfaces that do not vary in bandwidth or for which no accurate
estimate can be made, a nominal bandwidth shows.
Packet Size
Displays the size of the packets being transmitted or received.
Queue Length
Displays the number of packets in the queue.
3-4
FRX4000 and FRX6000
Management Module Guide
Chapter 4
Event and Alarm Messages
What Is in This Chapter
This chapter lists the types of events and alarms generated by the FRX4000
and FRX6000 Netlink Frame Relay devices and provides any probable cause
messages corresponding to these alarms.
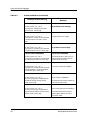
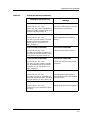
FRX4000 and FRX6000 Events and Alarms
Table 4-1 lists the SPECTRUM database directory paths (in bold) and the
messages displayed for the Event Log and Alarm Manager when applicable.
Table 4-1.
Events and Alarms
Message in the Event Log
Alarm View Probable Cause
Message
CsEvFormat/Event00010203
CsPCause/Prob00010203
{d "%w- %d %m-, %Y - %T"} The model created is not the same type
as the device. Model type = {t}, Name =
{m}, User = {u}. (event [{e}])
The model created is not the same
type as the device.
CsEvFormat/Event00010306
{d "%w- %d %m-, %Y - %T"} A(n) {t} device, named {m}, has been cold
started. (event [{e}])
No probable cause message.
9032285 E1
4-1
Event and Alarm Messages
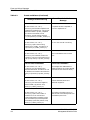
FRX4000 and FRX6000 Events and Alarms
Table 4-1.
Events and Alarms (Continued)
Message in the Event Log
Alarm View Probable Cause
Message
CsEvFormat/Event00010307
{d "%w- %d %m-, %Y - %T"} A(n) {t} device, named {m}, has been
warm started. (event [{e}])
No probable cause message.
CsEvFormat/Event00010308
CsPCause/Prob00010308
{d "%w- %d %m-, %Y - %T"} A(n) {t} device, named {m}, has detected
a communication Link Down. (event
[{e}])
Communication link is down.
CsEvFormat/Event00010309
4-2
{d "%w- %d %m-, %Y - %T"} A(n) {t} device, named {m}, has detected
a communication Link Up. (event [{e}])
No probable cause message.
CsEvFormat/Event0001030a
CsPCause/Prob0001030a
{d "%w- %d %m-, %Y - %T"} A(n) {t} device, named {m}, has detected
an Authentication Failure. (event [{e}])
Authorization failure. Other user is
trying to connect to device with an
invalid community string.
CsEvFormat/Event0001030b
CsPCause/Prob0001030b
{d "%w- %d %m-, %Y - %T"} A(n) {t} device, named {m}, has detected
an EGP Neighbor Loss. EGP Neighbor
IP address is {0 1}. (event [{e}])
Lost contact with EGP neighbor.
CsEvFormat/Event00010401
CsPCause/Prob00010401
{d "%w- %d %m-, %Y - %T"} Device {m} of type {t} is created with an
IP address already used by another
model. (event [{e}])
DUPLICATE IP ADDRESS
The model has the same IP address as
that of some other model.
CsEvFormat/Event00010402
CsPCause/Prob00010402
{d "%w- %d %m-, %Y - %T"} Device {m} of type {t} is created with a
physical (MAC) address already used by
another model. (event [{e}])
DUPLICATE PHYSICAL ADDRESS
The model has the same Physical
address (MAC address) as that of
some other model.
FRX4000 and FRX6000
Management Module Guide
Event and Alarm Messages
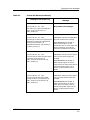
FRX4000 and FRX6000 Events and Alarms
Table 4-1.
Events and Alarms (Continued)
Message in the Event Log
Alarm View Probable Cause
Message
CsEvFormat/Event019d0001
CsPCause/Prob019d0001
{d "%w- %d %m-, %Y - %T"} Device {m}, {0 5}, reports a temperature
change to {T SMC_temperature 3}. Trap
severity is {T SMC_Severity 1}.
The device could be hotter or it could
have dropped in temperature.
CsEvFormat/Event019d0004
CsPCause/Prob019d0004
{d "%w- %d %m-, %Y - %T"} For device, {m}, the number of received
packets lost because of insufficient
buffers is {I 3}. Trap severity is {T
SMC_Severity 1}.
Received packets lost. Insufficient
buffers.
CsEvFormat/Event019d0005
CsPCause/Prob019d0005
{d "%w- %d %m-, %Y - %T"} For device, {m}, number of packets not
sent because of a multicast storm is {I 3}.
Trap severity is {T SMC_Severity 1}.
Packets not sent. Multicast storm.
CsEvFormat/Event019d0006
CsPCause/Prob019d0006
{d "%w- %d %m-, %Y - %T"} For device, {m}, the number of packets
not received because of internal buffer
congestion is {I 3}. Trap severity is {T
SMC_Severity 1}.
Packets not received. Internal buffer
congestion.
CsEvFormat/Event019d0007
CsPCause/Prob019d0007
{d "%w- %d %m-, %Y - %T"} For device, {m}, port, {I 5}, filtered and
discarded a packet from MAC address {0
3}. Trap severity is {T SMC_Severity 1}.
Filtered and discarded a packet. A
port’s combination filter has exceeded
the filter’s limits.
CsEvFormat/Event019d0008
CsPCause/Prob019d0008
{d "%w- %d %m-, %Y - %T"} Debug string, {I 3} received from device,
{m}: {0 5}.
Debug string received from the device.
9032285 E1
4-3
Event and Alarm Messages
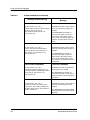
FRX4000 and FRX6000 Events and Alarms
Table 4-1.
Events and Alarms (Continued)
Message in the Event Log
4-4
Alarm View Probable Cause
Message
CsEvFormat/Event019d0009
CsPCause/Prob019d0009
{d "%w- %d %m-, %Y - %T"} Device, {m}, has finished a loopback test
or detected a loopback error. The current
operational state is {T SMC_LoopBack
3}. Packets transmitted, but not
received: {I 5}. Bad packets received:
{I 7}. Trap severity is {T SMC_Severity 1}
A loopback test was completed, or
there is a loopback error.
CsEvFormat/Event019d0013
CsPCause/Prob019d0013
{d "%w- %d %m-, %Y - %T"} Device, {m}, reports the trunking
protocol error, {T SMC_TrunkError 3}.
Trap severity is {T SMC_Severity 1}.
An error has occured in trunking.
CsEvFormat/Event019d0016
CsPCause/Prob019d0016
{d "%w- %d %m-, %Y - %T"} Device, {m}, has rebooted, because of a
Fatal Error. The error information string
is {0 3}. Trap severity is {T SMC_Severity
1}.
Device rebooted because of a fatal
error.
CsEvFormat/Event019d0017
CsPCause/Prob019d0017
{d "%w- %d %m-, %Y - %T"} For device, {m}, the Configuration
EEPROM has failed. The device can not
be rebooted, and must be returned to the
factory. Trap severity is {T SMC_Severity
1}.
The Configuration EEPROM has
failed. The device can not be rebooted,
and must be returned to the factory.
CsEvFormat/Event019d0018
CsPCause/Prob019d0018
{d "%w- %d %m-, %Y - %T"} Device, {m}, has outbound congestion,
and discarded {I 3} packets. Trap
severity is {T SMC_Severity 1}.
Packets discarded, because of
outbound congestion.
CsEvFormat/Event019d0021
CsPCause/Prob019d0021
{d "%w- %d %m-, %Y - %T"} Device, {m}, reports the number of
hardware errors in received and
transmitted packets exceeds the port’s
limit. Discarded {I 3} received packets.
Discarded {I 5} transmit packets. Trap
severity is {T SMC_Severity 1}.
The number of hardware errors in
received and transmitted packets has
exceeded the port’s limit.
FRX4000 and FRX6000
Management Module Guide
Event and Alarm Messages
FRX4000 and FRX6000 Events and Alarms
Table 4-1.
Events and Alarms (Continued)
Message in the Event Log
Alarm View Probable Cause
Message
CsEvFormat/Event019d0100
CsPCause/Prob019d0100
{d "%w- %d %m-, %Y - %T"} For device, {m}, reports the diagnostic
error, {0 3}. Trap severity is {T
SMC_Severity 1}.
No probable cause message.
CsEvFormat/Event019d0200
CsPCause/Prob019d0200
{d "%w- %d %m-, %Y - %T"} A FDDI port on device, {m} of type {t} has
detected an attachment configuration
change. The new state is {T
FDDISMTCFState3}. Trap severity is
{T SMC_Severity 1}.
PROBABLE CAUSE: The FDDI MAC
physical connection has changed.
CsEvFormat/Event019d0202
CsPCause/Prob019d0202
{d "%w- %d %m-, %Y - %T"} The AC input for the first power supply
on device, {m} of type {t} is {T
SMC_Power 3}. Trap severity is {T
SMC_Severity 1}.
PROBABLE CAUSE: The AC input to
the unit’s first power supply has
changed.
CsEvFormat/Event019d0203
CsPCause/Prob019d0203
{d "%w- %d %m-, %Y - %T"} The AC input for the second power
supply on device, {m} of type {t} is {T
SMC_Power 3}. Trap severity is {T
SMC_Severity 1}.
PROBABLE CAUSE: The AC input to
the unit’s second power supply has
changed.
RECOMMENDED ACTIONS: 1)
Refer to Event log for current
attachment state. 2) Check the A and
B port connections. 3) Check the
upstream and downstream devices.
RECOMMENDED ACTIONS: 1)
Refer to Event log for current AC
input state. If AC input state is bad, 2)
Check first power supply unit on
device. 3) Check power source to
device.
RECOMMENDED ACTIONS: 1)
Refer to Event log for current AC
input state. If AC input is bad, 2)
Check second power supply unit on
device. 3) Check power source to
device.
9032285 E1
4-5
Event and Alarm Messages
FRX4000 and FRX6000 Events and Alarms
Table 4-1.
Events and Alarms (Continued)
Message in the Event Log
4-6
Alarm View Probable Cause
Message
CsEvFormat/Event019d0204
CsPCause/Prob019d0204
{d "%w- %d %m-, %Y - %T"} The DC output for the first power supply
on device, {m} of type {t} is {T
SMC_Power3}. Trap severity is {T
SMC_Severity 1}.
PROBABLE CAUSE: The DC output
of the unit’s first power supply has
changed.
CsEvFormat/Event019d0205
CsPCause/Prob019d0205
{d "%w- %d %m-, %Y - %T"} The DC output for the second power
supply on device, {m} of type {t} is {T
SMC_Power 3}. Trap severity is {T
SMC_Severity 1}.
PROBABLE CAUSE: The DC output
of the unit’s second power supply has
changed.
CsEvFormat/Event019d0211
CsPCause/Prob019d0211
{d "%w- %d %m-, %Y - %T"} The optical bypass for FDDI port {I 4}
has become {T SMC_FddiSB 3} for device
{m} of type {t}. Trap severity is {T
SMC_Severity 1}.
PROBABLE CAUSE: The FDDI port
optical bypass has changed.
CsEvFormat/Event019d0212
CsPCause/Prob019d0212
{d "%w- %d %m-, %Y - %T"} The fuse to the optical bypass for the
FDDI port {I 4} is {T SMC_FddiOBS 3}
for device {m} of type {t}. Trap severity is
{T SMC_Severity 1}.
PROBABLE CAUSE: The state of the
FDDI port optical bypass fuse has
changed.
RECOMMENDED ACTIONS: 1)
Refer to Event log for current DC
output state. If DC output state is
bad, 2) Check first power supply unit
on device. 3) Check power source to
device.
RECOMMENDED ACTIONS: 1)
Refer to Event log for current DC
output state. If DC output state is
bad, 2) Check second power supply
unit on device. 3) Check power source
to the device.
RECOMMENDED ACTIONS: 1)
Refer to Event log for current optical
bypass port state. 2) Check the optical
bypass port.
RECOMMENDED ACTIONS: 1)Refer
to Event log for current optical bypass
fuse state.
FRX4000 and FRX6000
Management Module Guide
Event and Alarm Messages
FRX4000 and FRX6000 Events and Alarms
Table 4-1.
Events and Alarms (Continued)
Message in the Event Log
Alarm View Probable Cause
Message
CsEvFormat/Event019d0213
CsPCause/Prob019d0213
{d "%w- %d %m-, %Y - %T"} The FDDI port’s Station State for FDDI
port {I 4} on device {m} of type {t} has
changed to {0 3}. Trap severity is {T
SMC_Severity 1}.
PROBABLE CAUSE: The Station
state of the FDDI port has changed.
CsEvFormat/Event019d0214
CsPCause/Prob019d0214
{d "%w- %d %m-, %Y - %T"} The actual line speed for WAN port {I 4}
on device {m} of type {t} has changed to
{T SMC_WanSpeed 3}. Trap severity is
{T SMC_Severity 1}.
PROBABLE CAUSE: The actual line
speed of the WAN port has changed.
CsEvFormat/Event019d0216
CsPCause/Prob019d0216
{d "%w- %d %m-, %Y - %T"} A module in device, {m} of type {t}, has
malfunctioned, causing a Fatal Error.
The error information string is: {0 3}.
Trap severity is {T SMC_Severity 1}.
PROBABLE CAUSE: A module has
failed.
CsEvFormat/Event019d0217
CsPCause/Prob019d0217
{d "%w- %d %m-, %Y - %T"} A module in device, {m} of type {t}, has
failed diagnostics. The diagnostic status
is: {T SMC_DiagStatus 3}. Additional
diagnostic code information is: {1 5}.
Trap severity is {T SMC_Severity 1}.
PROBABLE CAUSE: A module has
failed diagnostics.
CsEvFormat/Event019d0218
CsPCause/Prob019d0218
{d "%w- %d %m-, %Y - %T"} Module {I 4} of type {T SMC_hwType 3},
does not match it’s defined type of {T
SMC_hwType 5} in device {m} of type {t}.
Trap severity is {T SMC_Severity 1}.
PROBABLE CAUSE: A module does
not match its defined type.
RECOMMENDED ACTIONS: 1)
Refer to Event log for state
infomation.
RECOMMENDED ACTIONS: 1)
Refer to the Event log for line speed
information.
RECOMMENDED ACTIONS: 1)
Refer to Event log for status
information. 2) Check module
configuration.
RECOMMENDED ACTIONS: 1)
Refer to Event log for status
information. 2) Check module
configuration.
RECOMMENDED ACTIONS: 1)
Refer to Event log for module
information. 2) Check slot
configuration.
9032285 E1
4-7
Event and Alarm Messages
FRX4000 and FRX6000 Events and Alarms
Table 4-1.
Events and Alarms (Continued)
Message in the Event Log
4-8
Alarm View Probable Cause
Message
CsEvFormat/Event019d0219
CsPCause/Prob019d0219
{d "%w- %d %m-, %Y - %T"} A port module {I 4} of type {0 3}, does not
match it’s defined type of {0 5} in device
{m} of type {t}. Trap severity is {T
SMC_Severity 1}.
PROBABLE CAUSE: A port does not
match its defined type.
CsEvFormat/Event019d0220
CsPCause/Prob019d0220
{d "%w- %d %m-, %Y - %T"} A port on a module {1 4} of type {0 3}, has
a bad port status in device {m} of type {t}.
Trap severity is {T SMC_Severity 1}.
PROBABLE CAUSE: A port on this
module has a bad port status.
CsEvFormat/Event019d0221
CsPCause/Prob019d0221
{d "%w- %d %m-, %Y - %T"} A Duplicate MAC Address has been
detected on FDDI ring attached to device
{m} of type {t}. Trap severity is {T
SMC_Severity 1}.
PROBABLE CAUSE: Two or more
stations with the same MAC address
were detected on the network.
RECOMMENDED ACTIONS: 1)
Refer to Event log for port
information. 2) Check module and slot
configuration.
RECOMMENDED ACTIONS: 1)
Refer to Event log for port
information. 2) Check cable
connections.
RECOMMENDED ACTIONS: MAC
address must be unique on the
network. 1) Locate the offending
stations and change the adaptor
cards.
FRX4000 and FRX6000
Management Module Guide
Chapter 5
Application View
What Is in This Chapter
This chapter describes the Netlink Application (Netlink App) for the FRX4000
and FRX6000 Netlink Frame Relay devices and the subviews available for
this application.
Common Applications
This device supports the following common applications described in the
Bridging Applicaitons, MIB-II Applications, or Miscellaneous
Applicaitons documentation:
• GenBridge (Gen_Bridge_App)
- Spanning Tree (Span_Tree_App)
- Static (Static_App)
- Transparent (Transparnt_App)
• MIB-II (SNMP2_Agent)
- ICMP (ICMP_App)
- IP (IP2_App)
- System (System2_App)
- UDP (UDP2_App)
• Ethernet (EthernetApp)
- EthernetIfApp_01 through _26 (EthernetIfApp) - depending upon the
device
• Token Ring Application (Token Ring App)
- TRIfApp_01 through _26 (TRIfApp) - depending upon the device
• FrameRelay Application (FrmRly App)
9032285 E1
5-1
Application View
Device Application View
The FRX4000 and FRX6000 also support the following major applications:
• Routing Services
• Standard RMON (RMONApp)
You can purchase SPECTRUM management of these applications separately.
Refer to the documentation provided with the purchased applications.
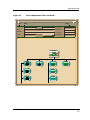
Device Application View
This view shows the common and device-specific applications supported by the
FRX4000 and FRX6000 Netlink Frame Relay devices and provides access to
application-specific information.
See Chapter 1, Introduction, for information on Accessing SPECTRUM Views.
Figure 5-2 shows an example of an Application view in the icon mode.
Figure 5-2 shows an example of an Application view in the list mode.
To change the display mode, from the View menu, select Mode -> List or
Icon.
5-2
FRX4000 and FRX6000
Management Module Guide
Application View
Device Application View
Figure 5-1.
Device Application View (Icon Mode)
Model Name of type CSI_FRX of Landscape VNMHost: Primary
*
File
View
Help?
Net Addr
Model Name
Sys Up Time
Contact
Manufacturer
Description
Device Type
Location
Prime-App
Serial Number
Model Name
FRX4000
Bridging
Network A
MIB-II
SNMP 2_A gent
CSIB ridge
Enet SDB
CSIRpt
S NMP2_A gent
Netlink App
FRXAp p
F RXA pp
ICMP
I CMP _A pp
C T_ Bdg Ene t_ Ap
Spanning Tree
ICMP _A pp
IP
I P2_App
CT_Stp_App
IP2_ App
9032285 E1
5-3
Application View
Device Application View
Figure 5-2.
Device Application View (List Mode)
Model Name of type CSI_FRX of Landscape VNMHost: Primary
*
File
Model Name
View
Help?
Net Addr
Sys Up Time
Contact
Manufacturer
Description
Device Type
Location
Prime-App
Serial Number
FRX6000
Gen_Bridge_App
Span_Tree_App
Static_App
Transparnt_App
SNMP2_Agent
ICMP_App
IP2_App
System2_App
UDP2_App
FRXApp
EthernetApp
EthernetIfApp
EthernetIfApp
EthernetIfApp
EthernetIfApp
EthernetIfApp
5-4
FRX4000 and FRX6000
Management Module Guide
Application View
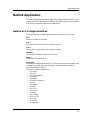
Netlink Application
Netlink Application
This section describes the Netlink Application supported by the device. The
model type for this application is FRXApp. The following views are available
from the Icon Subviews menu for this application:
Netlink RLP ConfigurationView
This view displays the following information for each RLP on the node:
RLP
The RLP number on the node.
LIC 1
The Type of Line Interface card in the first position.
LIC 2
The Type of Line Interface card in the first position.
Memory
The amount of memory installed on this RLP.
Status
The current state of this RLP.
Protocols
The protocols configured on this RLP. This is an octet string where each octet
represents a protocol type. The size of this is the maximum number of
protocols allowed on an RLP.
The protocol types are defined as:
• 00 = none
• 01 = X.25
• 02 = Frame Relay
• 03 = Async
• 04 = SDLC
• 05 = BSC Interactive
• 07 = IP
• 08 = SNMP
• 09 = RIP
• 0A = LLC2
• 0B = Trunk
• 0C = IPX
• 0D = Config
• 0E = LLC2-R
• 0F = IP-R
• 10 = NVSP
• 11 = Bridge
9032285 E1
5-5
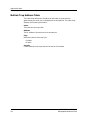
Application View
Netlink Application
Netlink Trap Address Table
This table view defines the IP address of end-nodes to receive alarms
generated by this node. Up to 16 addresses can be specified. This table view
displays the following information:
Index
The index into the trap table.
Address
The IP address of the end-station to send alarms.
Flag
Defines the status of this entry as:
• Disable
• Enable
Severity
Lowest severity level traps that will be sent to this Address.
5-6
FRX4000 and FRX6000
Management Module Guide
Index
A
C
Accessing
Device-specific Subviews 1-4
Icon Subviews Menu 1-4, 1-5
Views
Using Double-click Zones 1-3
Using Icon Subviews Menu 1-4
Address
Ethernet 3-3
MAC 2-8, 2-9, 3-3
Network 2-3
Physical 3-3
Admin Status 3-4
Alarm
Messages 4-1
Apply Button 2-7
Attribute
Selected 2-5
Configuration View
Device 3-2
Contact
Status 3-2
Conventions x
CSIIfPort
Configuration 3-4
B
Bridging Application 5-1
Button
Apply 2-7
Close 2-7
Default 2-7
Keep Settings 2-7
Reset 2-7
Standard Table
Find 1-5
Print 1-6
Sort 1-5
Update 1-5
D
Default 2-7
Device 5-3, 5-4
Configuration 3-1
Topology 2-9
Device Application view
List mode 5-3, 5-4
Device Configuration View 3-2
Device-specific Subviews 1-4
Double-click zones 1-3
E
Ethernet
Address 3-3
Ethernet Application 5-1
Event
Messages 4-1
F
FNB
Configuration View 3-4
Frame Size
Maximum 3-3
FrameRelay Application 5-1
FrmRly App 5-1
FRX4000 and FRX6000 Devices 1-1
9032285 E1
1
G
L
Gauge 2-8
Control Panel 2-4
Mode 2-5
Type 2-6
Gauge Control Panel
Gauge Mode
Rates Gauge Mode 2-6
Totals Gauge Mode 2-6
Gauge Mode - Rates
Color 2-6
Selected Attribute 2-6
Gauge Mode - Totals
Color 2-6
Selected Attribute 2-6
Gauge Mode
Rates Gauge Mode 2-6
Totals Gauge Mode 2-6
Getting Help xi
List Mode 5-3, 5-4
I
ICMP_App 5-1
Icon Subviews Menu
Accessing 1-4
Accessing from View Menu 1-4
Accessing Views 1-4
Accessing with Mouse 1-5
Index 3-3
Interface
Configuration Table 3-3
Description 2-3
Icon 2-8
Number 2-8, 2-9
Percentages 2-5
Introduction
Roadmap of SPECTRUM Views 1-6
SPECTRUM Support
Accessing Device-Specific
Subviews 1-4
Accessing SPECTRUM Views from
the Device Icon 1-4
Using Standard Table Buttons 1-5
IP Application 5-1
IP2_App 5-1
2
M
MAC Address 2-9
MAC Address Label 2-8
Mask
Network 2-3
Maximum
Frame Size 3-3
MIB-II Application 5-1
Mode
Gauge 2-5
List 5-3, 5-4
Model Information View 2-9
N
Name
Network 2-3
Netlink Application 5-5
Network
Information 2-3
Notice i
O
Operation Status 3-4
Operational Status 3-3
P
Physical
Address 3-3
Port
Configuration
View 2-9, 3-4
Type 2-9
FRX4000 and FRX6000
Management Module Guide
R
U
Rates 2-5
Rates Gauge Mode 2-6
Related Reading x, xi
Restricted Rights Notice ii
RMON 5-2
Roadmap 1-6
SPECTRUM
Roadmap of Views 1-7
Roadmap of SPECTRUM Views 1-6
UDP
Application 5-1
UDP2_App 5-1
Using Standard Table Buttons 1-5
S
V
View
Device Application
List Mode 5-3, 5-4
Virus Disclaimer i
SNMP2_Agent 5-1
Spanning Tree Bridging 5-1
SPECTRUM
Portable Management Application 1-6
Roadmap of Views 1-6
views
roadmap 1-7
SPECTRUM Support
Accessing Device-Specific Subviews 1-4
Accessing SPECTRUM Views from the
Device Icon 1-4
Using Standard Table Buttons 1-5
Standard Table Buttons 1-5
Static Bridging 5-1
Static_App 5-1
Status
Administrative 2-8
Adminstrative 2-9
System2_App 5-1
T
TCP/IP Based Networks xi
Terminology x
Token Ring App 5-1
Token Ring Application 5-1
Totals 2-5
Totals Gauge Mode 2-6
Trademarks i
Transparent Bridging 5-1
Transparnt_App 5-1
TRIfApp 5-1
Type 3-3
9032285 E1
3