1
2
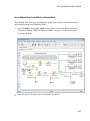
Thermal Liquid Models
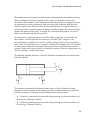
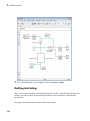
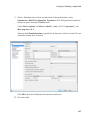
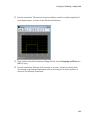
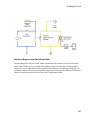
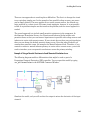
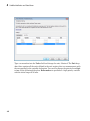
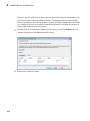
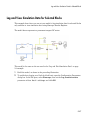
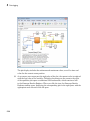
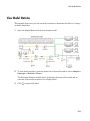
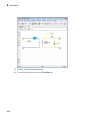
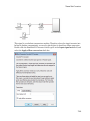
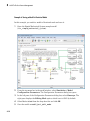
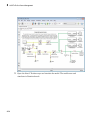
By reducing the inner diameter of the insulation layer to 0.20, you increase the
insulation thickness, slowing down heat loss through the pipe wall via thermal
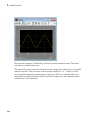
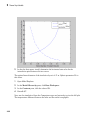
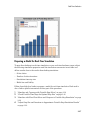
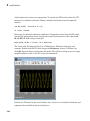
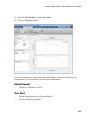
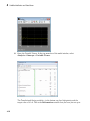
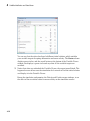
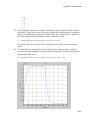
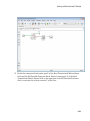
conduction. Run the simulation. Then, open the Comparison scope and autoscale to view
full plot.
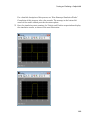
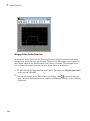
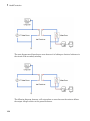
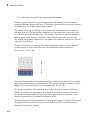
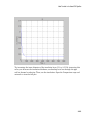
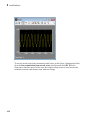
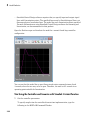
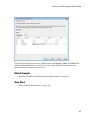
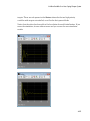
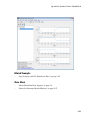
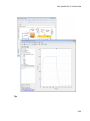
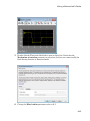
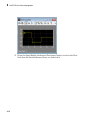
The new plot shows an oil temperature at the pipe outlet (top curve) that significantly
exceeds that at the pipe inlet (bottom line). Viscous dissipation now dominates the
thermal energy balance in the pipeline segment. The new insulation thickness poses a
design problem: in a long pipeline, a 1.1 K/km heating rate can raise the oil temperature
substantially at the receiving end of the pipeline.
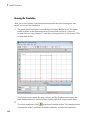
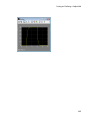
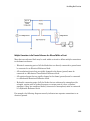
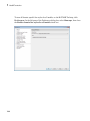
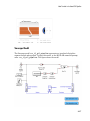
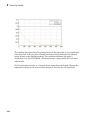
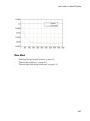
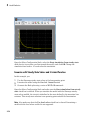
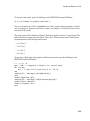
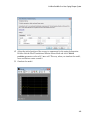
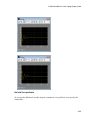
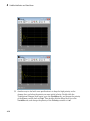
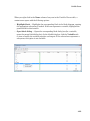
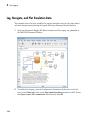
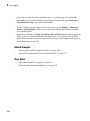
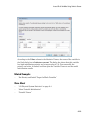
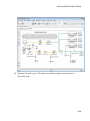
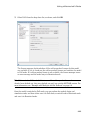
Plotting the kinematic viscosity as a function of time shows that its variability is now
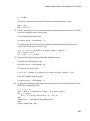
quite significant also. At the MATLAB command line, enter the logging command:
simscape.logging.plot({simlog.Pipe_TL.pipe_model.nu}).
2-22