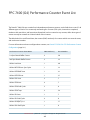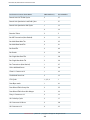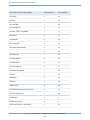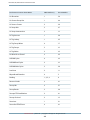
1
System Tracing
Tips and Tricks
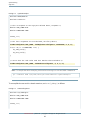
/*
* Use the kernel_debug() method when in the kernel (arg5 is unused),
* DBG_FUNC_START corresponds to chudBeginIntervalSignPost.
*/
kernel_debug(APPS_DEBUG(DBG_MACH_CHUD, LOOP_TIMER) | DBG_FUNC_START,
ITERATIONS, 0, 0, 0, 0);
for(ii = 0; ii < ITERATIONS; ii++) {
do_some_stuff();
do_more_stuff();
}
/* remember to use the same debugid value, with DBG_FUNC_END */
kernel_debug(APPS_DEBUG(DBG_MACH_CHUD, LOOP_TIMER) | DBG_FUNC_END,
0, 0, 0, 0, 0);
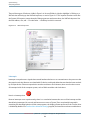
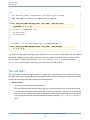
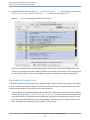
You should note that when using Sign Posts in the kernel, it is not necessary to add CHUD to the list of linked
frameworks. Adding the above code to your drivers will cause Sign Posts to be created in the System Trace
session without it. Similar code using the syscall(SYS_kdebug_trace,... invocation instead of
kernel_debug does exactly the same thing, but works from user code, instead.
Tips and Tricks
This section will list common things to look for in a System Trace , what they may mean, and how to improve
your application’s code using the information presented. The tips and tricks listed herein are organized according
to the view most commonly used to infer the associated behavior.
●
Summary View
●
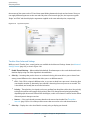
Short average run intervals for worker threads:
This can indicate that the amount of work given to each worker thread is too small to amortize the
cost of creating and synchronizing your threads. Try giving each thread more work to do, or dynamically
tune the amount of work given to each thread based on the number and speed of processors present
in the system (these values can be introspected at runtime using the sysctl() or sysctlbyname()
APIs).
Retired Document | 2012-07-23 | Copyright © 2012 Apple Inc. All Rights Reserved.
93