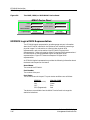
1
®
Cabletron SNMP Bridges
Management Module Guide
Notice
Cabletron Systems reserves the right to make changes in specifications and other information
contained in this document without prior notice. The reader should in all cases consult Cabletron
Systems to determine whether any such changes have been made.
The hardware, firmware, or software described in this manual is subject to change without notice.
IN NO EVENT SHALL CABLETRON SYSTEMS BE LIABLE FOR ANY INCIDENTAL,
INDIRECT, SPECIAL, OR CONSEQUENTIAL DAMAGES WHATSOEVER (INCLUDING BUT
NOT LIMITED TO LOST PROFITS) ARISING OUT OF OR RELATED TO THIS MANUAL OR
THE INFORMATION CONTAINED IN IT, EVEN IF CABLETRON SYSTEMS HAS BEEN
ADVISED OF, KNOWN, OR SHOULD HAVE KNOWN, THE POSSIBILITY OF SUCH
DAMAGES.
Virus Disclaimer
Cabletron has tested its software with current virus checking technologies. However, because no
anti-virus system is 100% reliable, we strongly caution you to write protect and then verify that
the Licensed Software, prior to installing it, is virus-free with an anti-virus system in which you
have confidence.
Cabletron Systems makes no representations or warranties to the effect that the Licensed
Software is virus-free.
Copyright © April, 1998, by Cabletron Systems, Inc. All rights reserved.
Printed in the United States of America.
Order Number: 9030368 E9
Cabletron Systems, Inc.
P.O. Box 5005
Rochester, NH 03866-5005
SPECTRUM, the SPECTRUM IMT/VNM logo, DCM, IMT, and VNM are registered
trademarks, and SpectroGRAPH, SpectroSERVER, Inductive Modeling Technology,
Device Communications Manager, and Virtual Network Machine are trademarks of
Cabletron Systems, Inc.
C++ is a trademark of American Telephone and Telegraph, Inc.
UNIX is a trademark of UNIX System Laboratories, Inc.
OSF/Motif and Motif are trademarks of the Open Software Foundation, Inc.
X Window System is a trademark of X Consortium, Inc.
Ethernet is a trademark of Xerox Corporation.
9030368 E9
i
Restricted Rights Notice
(Applicable to licenses to the United States Government only.)
1. Use, duplication, or disclosure by the Government is subject to restrictions as set forth in
subparagraph (c) (1) (ii) of the Rights in Technical Data and Computer Software clause at
DFARS 252.227-7013.
Cabletron Systems, Inc., 35 Industrial Way, Rochester, New Hampshire 03866-5005.
2. (a) This computer software is submitted with restricted rights. It may not be used,
reproduced, or disclosed by the Government except as provided in paragraph (b) of this
Notice or as otherwise expressly stated in the contract.
(b) This computer software may be:
(c)
(1)
Used or copied for use in or with the computer or computers for which it was
acquired, including use at any Government installation to which such computer or
computers may be transferred;
(2)
Used or copied for use in a backup computer if any computer for which it was
acquired is inoperative;
(3)
Reproduced for safekeeping (archives) or backup purposes;
(4)
Modified, adapted, or combined with other computer software, provided that the
modified, combined, or adapted portions of the derivative software incorporating
restricted computer software are made subject to the same restricted rights;
(5)
Disclosed to and reproduced for use by support service contractors in accordance with
subparagraphs (b) (1) through (4) of this clause, provided the Government makes
such disclosure or reproduction subject to these restricted rights; and
(6)
Used or copied for use in or transferred to a replacement computer.
Notwithstanding the foregoing, if this computer software is published copyrighted
computer software, it is licensed to the Government, without disclosure prohibitions, with
the minimum rights set forth in paragraph (b) of this clause.
(d) Any other rights or limitations regarding the use, duplication, or disclosure of this
computer software are to be expressly stated in, or incorporated in, the contract.
(e) This Notice shall be marked on any reproduction of this computer software, in whole or in
part.
ii
Cabletron SNMP Bridges
Management Module Guide
Contents
Preface
What is in this Guide ........................................................................................................... xi
Conventions ......................................................................................................................... xii
Related SPECTRUM Documentation................................................................................. xii
Other Related Documentation ............................................................................................ xii
Getting Help ....................................................................................................................... xiii
Chapter 1
Introduction
What is in this Chapter...................................................................................................... 1-1
SNMP Bridge Management Module.................................................................................. 1-1
Chapter 2
Device View
What is in this Chapter...................................................................................................... 2-1
Accessing the Device View ................................................................................................. 2-1
SNMP NB20E and NB25E Device Views.......................................................................... 2-2
SNMP NB20E and SNMP NB25E LEDs.................................................................... 2-4
SNMP NB30 Device View .................................................................................................. 2-5
SNMP NB30 LEDs....................................................................................................... 2-7
Remote V.35 and RS449 Port ................................................................................ 2-7
Remote DSX-1 Port................................................................................................ 2-7
Ethernet Port ......................................................................................................... 2-8
SNMP NB30 Front Panel Switches............................................................................. 2-8
EFDMIM Device View ........................................................................................................ 2-9
Accessing the Hub Logical/Physical Device View....................................................... 2-9
Hub Logical Device View ........................................................................................... 2-10
Gauge Control Panel............................................................................................ 2-12
IRM2, IRBM, or IRM3 Hub Physical Device Views ................................................. 2-15
MMAC Device Panel............................................................................................ 2-15
EFDMIM Logical MIM Representation .................................................................... 2-16
Logical Gauges..................................................................................................... 2-18
Gauge Mode ......................................................................................................... 2-19
EFDMIM Physical MIM Representation.................................................................. 2-19
EFDMIM LEDs.................................................................................................... 2-22
IRM Hub Physical Device View................................................................................. 2-23
MMAC Device Statistics Panel ........................................................................... 2-23
Configuring the EFDMIM in an IRM or IRBM Device View................................... 2-25
Configuring the EFDMIM in an IRM2 or IRM3....................................................... 2-26
9030368 E9
iii
Chapter 2
Device View (continued)
Copying the EFDMIM into a Location or Topology View .........................................2-27
Changing MIM Representations................................................................................2-28
Changing MIM Representations on the Entire Hub..........................................2-28
Changing MIM Representations Using the Menu Bar ......................................2-28
Changing MIM Representations Using the Mouse ............................................2-29
Clearing Duplicate EFDMIM Address Alarms .........................................................2-29
Case #1..................................................................................................................2-30
Case #2..................................................................................................................2-30
EFDMIM Generic Views ............................................................................................2-31
Chapter 3
Application Views
What is in this Chapter ......................................................................................................3-1
Accessing the Application View ..........................................................................................3-1
NB20E, NB25E, and NB30 Application Views ..................................................................3-3
HASPART Panel .........................................................................................................3-11
EFDMIM Application View ..............................................................................................3-11
Ring Table ...................................................................................................................3-11
HASPART Panel .........................................................................................................3-13
Chapter 4
Configuration Views
What is in this Chapter ......................................................................................................4-1
Accessing the Configuration View......................................................................................4-1
NB20E, NB25E, and NB30 Configuration Views ..............................................................4-3
Model Configuration .....................................................................................................4-3
Device Configuration ....................................................................................................4-3
EFDMIM Configuration View ......................................................................................4-8
Model Configuration ..............................................................................................4-8
Device Configuration..............................................................................................4-9
Chapter 5
Diagnostic Views
What is in this Chapter ......................................................................................................5-1
Accessing the Diagnostic View ...........................................................................................5-1
SNMP NB20E, SNMP NB25E and NB30 Diagnostic View ..............................................5-2
EFDMIM Diagnostic View..................................................................................................5-3
Bridge Port Table ..........................................................................................................5-4
iv
Cabletron SNMP Bridges
Management Module Guide
Chapter 6
Performance Views
What is in this Chapter...................................................................................................... 6-1
Accessing the Performance View ....................................................................................... 6-1
NB20E, NB25E and NB30 Performance View .................................................................. 6-2
EFDMIM Performance View .............................................................................................. 6-3
Packet Breakdown Pie Chart ...................................................................................... 6-4
Bridge Port Table ......................................................................................................... 6-4
Port Performance View ....................................................................................................... 6-5
SNMP NB20E and NB25E Port Performance View ................................................... 6-5
EFDMIM Port Performance View ............................................................................... 6-9
Port Packet Breakdown Pie Chart...................................................................... 6-10
SNMP NB30 Local Port Performance View .............................................................. 6-11
SNMP NB30 Remote Port Performance View .......................................................... 6-16
Chapter 7
Event and Alarm Messages
What is in this Chapter...................................................................................................... 7-1
NB20E, NB25E, and NB30 Events and Alarms ............................................................... 7-2
Index
9030368 E9
v
viii
Cabletron SNMP Bridges
Management Module Guide
Tables
Chapter 2
Table 2-1.
Table 2-2.
Table 2-3.
Chapter 3
Table 3-1.
Table 3-2.
Table 3-3.
Table 3-4.
Table 3-5.
Table 3-6.
Table 3-7.
Table 3-8.
Table 3-9.
Table 3-10.
Table 3-11.
Chapter 4
Table 4-1.
Table 4-2.
Table 4-3.
Table 4-4.
Chapter 6
Table 6-1.
Table 6-2.
Chapter 7
Table 7-1.
Device View
Gauge Selected Attribute Colors......................................................................... 2-13
Horizontal Bar Gauge Statistic Colors ............................................................... 2-18
Horizontal Bar Gauge Statistic Colors ............................................................... 2-24
Application Views
Bridge Database View Special Database Information Fields ............................. 3-3
Bridge Database View Acquired Database Information Fields .......................... 3-4
Bridge Database View Permanent Database Information Fields....................... 3-5
Permanent Database Static Address Filtering Options ...................................... 3-6
Permanent Database Information View Fields ................................................... 3-7
Acquired Database Table Static Address Filter Options .................................... 3-8
Acquired Database Information View Fields ....................................................... 3-9
Special Database New Database Information ..................................................... 3-9
Special Database Add an Entry View Options .................................................. 3-10
Possible FDDI Ring States.................................................................................. 3-12
Possible EFDMIM Duplicate Address Indications ............................................ 3-12
Configuration Views
Bridge Setup Information View Parameters........................................................ 4-6
Possible EFDMIM CFM States........................................................................... 4-10
Possible EFDMIM RMT States........................................................................... 4-11
Configuration View Jumper Setting Fields ....................................................... 4-12
Performance Views
Port Status Messages ............................................................................................ 6-6
Port Topology Settings View Fields.................................................................... 6-15
Event and Alarm Messages
Events and Alarms ................................................................................................ 7-2
9030368 E9
ix
x
Cabletron SNMP Bridges
Management Module Guide
Preface
Use this guide if you are going to manage a Cabletron SNMP Bridge through SPECTRUM. Before
reading this guide, you should be familiar with SPECTRUM’s functions as described in the
Operations and Administration documentation. You should also be familiar with any network
management and hardware requirements described in the related hardware documentation.
What is in this Guide
The following chapter descriptions outline the organization of the Cabletron
SNMP Bridges Management Module Guide.
Chapter
9030368 E9
Description
Chapter 1
Introduction
Describes the Cabletron SNMP Bridges
management module and model types.
Chapter 2
Device Views
Describes the Device Views available for each
Cabletron SNMP Bridge model type.
Chapter 3
Application Views
Describes the Application Views available for
each Cabletron SNMP Bridge model type.
Chapter 4
Configuration Views
Describes the Configuration View available for
each Cabletron SNMP Bridge model type.
Chapter 5
Diagnostic Views
Describes the Diagnostic View available for
each Cabletron SNMP Bridge model type.
Chapter 6
Performance Views
Describes the Performance View available for
each Cabletron SNMP Bridge model type.
Chapter 7
Event and Alarm
Messages
Contains a listing and explanation of the alarm
and event messages generated in the Event Log
or Alarm View for the Cabletron SNMP Bridge
model types.
Preface
xi
Conventions
Conventions
In this manual, the following conventions are used:
• Command names are printed in bold; for example, Clear or Save &
Close.
• Menu selections to access a view are printed in bold; for example,
Configuration or Detail.
• Buttons are represented by a shadowed box; for example, Help .
Related SPECTRUM Documentation
Refer to the Operations, Administration, and the following documentation for
more information on using SPECTRUM:
SPECTRUM Report Generator User’s Guide
Getting Started with SPECTRUM for Operators
Getting Started with SPECTRUM for Administators
How to Manage Your Network with SPECTRUM
Other Related Documentation
Refer to the following documentation for more information on managing TCP/
IP-based networks:
LAN Troubleshooting Handbook, Mark Miller (1989, M&T Publishing, Inc.)
The Simple Book — An Introduction to Management of TCP/IP-based
Internets, Marshall T. Rose, Performance Systems International, Inc.
Computer Networks, Andrew S. Tanenbaum, Prentice-Hall, Inc.
Local Area Networks, Architectures and Implementations, James Martin &
Kathleen K. Chapman for the Arben Group, Inc. (1989, Prentice-Hall, Inc.)
Getting Help
If you need additional support for this SPECTRUM Network Management
product, or have any questions, comments, or suggestions concerning this
Preface
xii
Cabletron SNMP Bridges
Management Module Guide
Getting Help
manual, contact Cabletron Systems Technical Support at one of the following
regional addresses.
Location
Mail
FAX
Telephone
North America
Cabletron Systems, Inc.
P. O. Box 5005
Rochester, NH 03866-5005
Email: [email protected]
603-337-3075
603-337-3500
Europe
Cabletron Systems, Ltd.
Network House
Newbury Business Park
London Road, Newbury
Berkshire, England RG13 2PZ
Email: [email protected]
(*)-44-635-552062
(*)-44-635-580000
Pacific
Cabletron Systems, Inc.
Allambie Grove Estate
25 French’s Forest Road East
French’s Forest, NSW 2086
Sydney, Australia
Email: [email protected]
(*)-61-2-950-5950
(*)-61-2-950-5900
Japan
Cabletron Systems, KK
Hamamatsucho MK Bldg.
4th Floor
1-4-12 Kaigan, Minato-Ku
Tokyo 101 Japan
Email: [email protected]
(*)-81-3-3459-1985
(*)-81-3-3459-1981
Singapore
Cabletron Systems, Inc.
85 Science Park Drive
#03-03/04
The Cavendish
Singapore 051
Email: [email protected]
(*)-65-7763382
(*)-65-7755355
Germany
Cabletron Systems GmbH
Dreieich Park
1m Gefierth 13d
63303 Dreieich
Frankfurt, Germany
Email: [email protected]
(*)-49-610-39910
(*)-49-610-3991109
*International Operator Code
Questions About SPECTRUM Documentation?
E-MAIL
9030368 E9
Send your questions, comments or suggestions regarding SPECTRUM
documentation to the Technical Communications Department directly via the
following internet address:
[email protected]
Preface
xiii
Getting Help
Preface
xiv
Cabletron SNMP Bridges
Management Module Guide
Chapter 1
Introduction
What is in this Chapter
This chapter describes the SPECTRUM Management Module for the
Cabletron SNMP Bridge family of devices. It also provides the Model Type
Names assigned to the SNMP Bridges in SPECTRUM. The Model Type Name
refers to the template used to specify device attributes, actions, and
associations for device models in SPECTRUM.
SNMP Bridge Management Module
The SPECTRUM SNMP Bridge Management Module manages the Cabletron
SNMP Bridge family of devices by using the SNMP network management
agent and the Management Information Bases (MIBs), included with the
management module.
There are four SPECTRUM model type names for the Cabletron SNMP
Bridge Devices, three for the standalone models (Bdg_CSI_SNB20,
Bdg_CSI_SNB25, BdgCSINB30), and one for the MMAC chassis module
(Bdg_CSI_EFDMIM).
Bdg_CSI_SNB20: An NB20E bridge managed through the Simple Network
Management Protocol (SNMP).
Bdg_CSI_SNB25: An NB25E bridge managed through SNMP.
BdgCSINB30: An NB30 T1 Remote Bridge managed through SNMP. Most
functions are like the NB25E but there are some differences noted throughout
the manual. NB30 bridges work in pairs.
9030368 E9
Introduction
1-1
SNMP Bridge Management Module
Bdg_CSI_EFDMIM: An EFDMIM Ethernet to FDDI bridging MIM designed
for installation in a Cabletron MMAC hub device and managed through
SNMP.
If you are running a previous version of SPECTRUM, the following user
interface aspects may differ from those in SPECTRUM version 4.0:
•
Order and names of menu selections
•
Navigational features (mouse button functionality)
For information about menu selections and navigating within previous
versions of SPECTRUM, refer to the SPECTRUM System User’s Guide. For
information about menu selections and navigating within SPECTRUM
version 4.0, refer to SPECTRUM Views and SPECTRUM Menus.
Introduction
1-2
Cabletron SNMP Bridges
Management Module Guide
Management Module Guide for the Cabletron Systems SNMP Bridges
Chapter 2
Device View
What is in this Chapter
This chapter provides a description of the Device View for the SNMP Bridges
Management Module. This description includes an explanation of the menu
bar access to the various views used to control and monitor the bridge, and
how to use the Device View to view EFDMIMs, access SPECTRUM generic
views, and monitor the performance of the bridges.
The Device View shows an actual representation of the bridge configuration.
The representation is updated after each SPECTRUM polling cycle to show
any changes in the bridge configuration.
Accessing the Device View
You can access the Device View using one of the following methods (refer to
Figure 2-1 ):
• Double-click on the Device View button of the bridge icon.
• Highlight the bridge icon and select Device from the Icon Subviews
menu.
9030368 E9
Device View
2-1
SNMP NB20E and NB25E Device Views
Figure 2-1.
Accessing the SNMP NB20E/NB25E/NB30 Device View
Double-click
10
1
.1
.01
Close
Navigate
Alarms
Performance
Notes...
Utilities
Zoom
Configuration
Diagnostic
Acknowledge
Flash Green Enabled
Application
Device
DevTop
Select Device
SNMP NB20E and NB25E Device Views
This view represents the physical status of the SNMP Bridge device and
provides menu access to the generic views. These generic views allow you to
access network configuration information as well as traffic flow and error data
for your bridge. The Device View creates an icon manager that represents
each of the ports associated with the bridge model.
The Device View periodically polls the bridge model in the SpectroSERVER
database to determine if any configuration changes have occurred. If a
configuration change has occurred, the configuration is changed within the
Device View to match the model in the SpectroSERVER database. Figure 2-2
provides and example of an SNMP Bridge NB-20E Device View.
Device View
2-2
Cabletron SNMP Bridges
Management Module Guide
SNMP NB20E and NB25E Device Views
Figure 2-2.
Cabletron SNMP NB-20E Bridge Device View
Primary Landscape 0x00400000 - VNM Host - MIS of type Hub_CSI_SNB20
* File
View
Device MenuHelp?
NB-20E
ON LINE
XMT
WITH REMOTE LANVIEW® AND MANAGEMENT
STAND BY
RCV
ETHERNET/IEEE 802.3 BRIDGING UNIT
FORWARD
BROADCAST
CP
ROOT
POK
2
9030368 E9
PORT
1
Device View
2-3
SNMP NB20E and NB25E Device Views
SNMP NB20E and SNMP NB25E LEDs
SNMP NB20E and SNMP NB25E LEDs
The LEDs on the bridge front panels in the Device View are animated to
reflect the state of the LEDs as of the last poll cycle. The LEDs turn on or off to
match the bridge on the network. For detailed information on the LED
definitions, and the operation of your bridge, refer to the documentation that
accompanied your bridge. The following is a general definition of specific
LEDs for the SNMP NB20E and SNMP NB25E bridge model types.
ON LINE
When this green LED is on, the bridge is receiving power, and has completed
its power up self test. The bridge is capable of forwarding packets.
STAND BY
When this yellow LED is on, the bridge is in “STANDBY” mode and not
capable of forwarding packets across the link.
XMT (Transmit)
When this green LED is flashing, the bridge is transmitting packets to that
network segment.
RCV (Receive)
When this yellow LED is flashing, the bridge is receiving data packets from
that network segment.
CP (Collision Present)
When this red LED is flashing, a collision is occurring on that network
segment.
POK (Port OK)
When this green LED is on, the port has passed an Internal Loop Back Test
and is ready for transmission
.
NOTE
Device View
2-4
You can access Port Performance Views through the Icon Subviews menu and
by single-clicking the right mouse button to bring up the pop-up menu while
in this Device View. The Device Menu allows you to access Configuration,
Performance, Diagnostic, and Application Views from the Device View.
Cabletron SNMP Bridges
Management Module Guide
SNMP NB30 Device View
SNMP NB30 Device View
This view represents the physical status of the SNMP NB30 Bridge device
and provides menu access to the generic views. These generic views allow you
to access network configuration information as well as traffic flow and error
data for your bridge.
The Device View periodically polls the bridge model in the SpectroSERVER
database to determine if any configuration changes have occurred. If a
configuration change has occurred, the configuration is changed within the
Device View to match the model in the SpectroSERVER database. Figure 2-3
provides and example of an SNMP Bridge NB-30 Device View.
9030368 E9
Device View
2-5
SNMP NB30 Device View
Figure 2-3.
Cabletron SNMP NB30 Bridge Device View
Primary Landscape 0x00400000 - VNM Host - MIS of type HubCSINB30
* File
View
Device MenuHelp?
NB-30
ETHERNET/IEEE 802.3 BRIDGING UNIT
WITH REMOTE LANVIEW®
POWER
STAND BY
FORWARD
BROADCAST
ROOT
LINK OK
LINK OK
XMT
YELLOW
ALARM
RED
ALARM
CTS
RCV
DM
CP
POK
POK
REMOTE
Device View
2-6
POK
ENET
Cabletron SNMP Bridges
Management Module Guide
SNMP NB30 Device View
SNMP NB30 LEDs
SNMP NB30 LEDs
The LEDs on the bridge front panels in the Device View are animated to
reflect the state of the LEDs as of the last poll cycle. The LEDs turn on or off to
match the bridge on the network. For detailed information on the LED
definitions, and the operation of your bridge, refer to the documentation that
accompanied your bridge. The following is a general definition of specific
LEDs for the SNMP NB30 bridge model types.
POWER
When this green LED is on, the bridge is receiving power.
STAND BY
When this yellow LED is on, the bridge is in “STANDBY” mode and not
capable of forwarding packets across the link.
Remote V.35 and RS449 Port
LINK OK
When this green LED is on, the bridge has a valid receive clock from the DCE.
CTS (Clear To Send)
When this yellow LED is on, the DCE is not conditioned to transmit data.
DM (Data Mode)
When this red LED is on, the DCE is not in the data transfer mode.
POK (Port OK)
When this green LED is on, the Remote Port has passed the Internal Loop
Back Test and is ready for transmission. A proper transmit clock from the
DCE must be present for this test to pass.
Remote DSX-1 Port
LINK OK
When this green LED is on, a valid T1 signal is present.
YELLOW ALARM
When this yellow LED on the local NB30 is on, the remote NB30 is in red
alarm.
RED ALARM
When this red LED on the local NB30 is on, it has lost synchronization with
the remote NB30.
POK (Port OK)
When this green LED is on, the Remote Port has passed the Internal Loop
Back Test and is ready for transmission.
9030368 E9
Device View
2-7
SNMP NB30 Device View
SNMP NB30 Front Panel Switches
Ethernet Port
XMT (Transmit)
When this green LED is flashing, the Ethernet side of the bridge is
transmitting packets.
RCV (Receive)
When this yellow LED is flashing, the Ethernet side of the bridge is receiving
data packets.
CP (Collision Present)
When this red LED is flashing, a collision is occurring on that Ethernet
segment.
POK (Port OK)
When this green LED is on, the Ethernet port has passed an Internal Loop
Back Test and is ready for transmission.
NOTE
You can access Port Performance Views (remote and local) through the Icon
Subviews menu and by single-clicking the right mouse button to bring up the
pop-up menu while in this Device View. The Device menu allows you to access
Configuration, Performance, Diagnostic, and Application Views from the
Device View.
SNMP NB30 Front Panel Switches
FORWARD BROADCAST
When this switch is on (•), it allows the NB30 to forward broadcast messages.
ROOT
NOTE
Device View
2-8
These switch settings are not depicted in the NB30 Device View, and must be
seen by selecting Bridge Setup from the Configuration View.
Cabletron SNMP Bridges
Management Module Guide
EFDMIM Device View
EFDMIM Device View
The EFDMIM is displayed in the Device View for a Cabletron hub. The hub
Device View shows an actual representation of the hub with an EFDMIM
installed in one of the slots. If the configuration changes (e.g., if an EFDMIM
board is pulled or added to the hub), you see the corresponding change within
this view. This change in the view occurs after the model’s next poll cycle.
This view represents the physical status of the EFDMIM installed in a
Cabletron hub chassis and provides menu access to the EFDMIM generic
views. These generic views allow you to access network configuration
information, as well as traffic flow and error data for your EFDMIM.
Depending on the type of Cabletron hub containing the EFDMIM, the Device
View appears slightly different. The Cabletron hub categories are as follows:
•
•
IRM2, IRBM, or IRM3
IRM
The Device View periodically polls the hub model in the SpectroSERVER
database to determine if any configuration changes have occurred. If a
configuration change has occurred, the Device View changes as well to match
the model in the SpectroSERVER database.
Accessing the Hub Logical/Physical Device View
You can access the Hub Logical or Physical Device View using one of the
following methods (refer to Figure 2-4):
• Double-click on the Device View button of the hub icon. This opens the last
device view accessed.
• Highlight the hub icon and select Device -> Logical or
Device -> Physical from the Icon Subviews menu.
9030368 E9
Device View
2-9
EFDMIM Device View
Hub Logical Device View
Figure 2-4.
Accessing the Hub Device View
Double-click
Close
Navigate
Alarms
Performance
Notes...
Utilities
Zoom
Configuration
Diagnostic
Acknowledge
Flash Green Enabled
Application
Device
DevTop
Logical
Physical
Select Logical or Physical
Hub Logical Device View
The IRM, IRM2, IRM3, and IRBM model types have available a Logical
Device view that provides statistical information on each MIM it contains.
Figure 2-5 provides an example of a Hub Logical Device View.
Device View
2-10
Cabletron SNMP Bridges
Management Module Guide
EFDMIM Device View
Hub Logical Device View
Figure 2-5.
Example of a Hub Logical Device View
Primary Landscape 0x00400000 - VNM Host - CTRON of type Hub_CSI_IRM3
* File
View
Device MenuHelp?
MMAC Device Panel
Name IRM3
Location
Network Address
Logical Gauges
Device Type
My Office
System UpTime
Hub_CSI_IRM3
2+01:17:39
132.177.118.24
Gauge Mode
Frames
MT8 MIM
EFDMIM
MT8 MIM
SN
SN
1
5
2
IRBM
SN
1
5
1
2
4
Rates
ON
OFF
M
B M
R A
G C
ON
ST
RC
DN
CR
PO
ON
RH
NK
DN
CR
PO
2
4
C
O
N
S
O
L
E
R
C
V
L
N
K
R
C
V
L
N
K
R
C
V
L
N
K
R
C
V
L
N
K
6
3
6
3
8
4
8
4
C
O
M
M
A
U
I
NS
LK
F
O
TH
I
R
RH
L
ETHERNET
A representation of an EFDMIM in this view presents the following
information:
9030368 E9
Device View
2-11
EFDMIM Device View
Hub Logical Device View
Slot Number
The number of the EFDMIM’s slot within the hub.
IP Address
The IP address of the EFDMIM.
Board Name
The name of the EFDMIM.
Port Number
The number of the port.
Port Status
The current status of the port. The port status conditions are as follows:
STATUS
NLNK (No Link)
ON
OFF
SEG (Segmented)
COLOR CODE
Yellow
Green
Blue
Red
Gauge Control Panel
The information displayed by the gauge located below the number and status
of each port is controlled by the Gauge Control Panel. Access the Gauge
Control Panel by clicking once on the hub’s logical representation, and
selecting Icon Subviews from the File menu.
NOTE
When clicking on the hub’s representation, be sure not to click on one of the
ports in the hub. Make sure that the entire hub board is highlighted before
accessing the Icon Subviews menu.
The Gauge Control Panel consists of three panels, as follows:
Gauge Mode
The Gauge Mode panel selections available are as follows:
Rates
Displays the selected statistic as a rate over a given time frame.
Totals
Displays the total value of the selected statistic over the MIM’s up time.
Percentages
Displays the selected statistic as a percentage of the total statistic for the
MIM.
Device View
2-12
Cabletron SNMP Bridges
Management Module Guide
EFDMIM Device View
Hub Logical Device View
Gauge Type
The Gauge Type panel selections are as follows:
Numeric
Displays the numeric value of the selected statistic, on a field whose color
corresponds to the attribute’s listing in the Selected Attribute panel. See Table
4-1 for a list of statistic colors.
Linear
Displays the value of the statistic as a bar graph, matching the color of the
selected attribute. See Table 2-1 for a list of statistic colors.
Table 2-1.
Gauge Selected Attribute Colors
Statistical Selection
Gauge Color
Frame Rate
Blue
Octet Rate
Green
Recv_Coll Rate
Light Orange
Trans_Coll Rate
Light Orange
Error Rate
Orange
Align_Errs Rate
Lavender
CRC_Errs Rate
Blue Green
Runts Rate
Light Blue
Giants Rate
Pink
OOW Rate
Salmon
Selected Attribute
The Selected Attribute panel selections are as follows:
Frame Rate
Indicates the amount of frames received or transmitted by the board or port.
Octet Rate
Indicates the amount of octets received or transmitted by the board or port.
Recv_Coll Rate
Indicates the amount of collisions received by the board or port.
Trans_Coll Rate
Indicates the amount of collisions generated by the board or port during
transmission.
Error Rate
Indicates the amount of errors detected by the board or port.
9030368 E9
Device View
2-13
EFDMIM Device View
Hub Logical Device View
Align_Errs Rate
Indicates the amount of misaligned packets detected by the board or port.
CRC_Errs Rate
Indicates the amount of packets received by the board or port with bad
Cyclical Redundancy Checks (CRC).
Runts Rate
Indicates the amount of runt packets received by the board or port. A runt
packet is one byte less than the standard Ethernet frame of 64 bytes not
including preamble.
Giants Rate
Indicates the amount of giant packets received by the board or port. A giant
packet exceeds 1518 bytes not including preamble.
OOW Rate
Indicates the amount of collisions out of the standard window (51.2µs) due to a
network problem.
Make the desired selections in each of the windows, and click on the Apply
button to apply the choices to the hub Device View. The view will update,
however the selections will not be saved upon closing the Control Panel unless
the Keep Settings button is first selected. Close the Control Panel by clicking
on the Close button.
In addition, the hub Logical Device View displays a variety of information
about the hub through a group of read-only dialog boxes at the top of the view,
contained inside a box whose color matches the current contact status color of
the hub.
Model Name
The user defined name of the hub model.
Contact
Identification and contact information of the person responsible for the hub.
Description
The description of the hub containing the EFDMIM, which lists the device
type as well as firmware version.
Location
The physical location of the hub device.
Net Address
The IP Address of the hub containing the EFDMIM.
System Up Time
The time the hub has been active without failure, in the format:
days+hours:minutes:seconds
Manufacturer
The manufacturer of the hub device.
Device View
2-14
Cabletron SNMP Bridges
Management Module Guide
EFDMIM Device View
IRM2, IRBM, or IRM3 Hub Physical Device Views
Device Type
The model type name of the hub containing the EFDMIM.
Serial Number
The serial number of the hub device.
IRM2, IRBM, or IRM3 Hub Physical Device Views
The IRM2, IRBM, or IRM3 hub Physical Device Views present a variety of
statistical information on each MIM installed in the hub chassis because of
the high level monitoring point intelligence inherent in these hubs. The
following sections describe the IRM2, IRBM, or IRM3 hub Device Views
containing an EFDMIM.
MMAC Device Panel
The top portion of an IRM2, IRBM, or IRM3 hub Physical Device View
containing the EFDMIM, displays the following information for the hub:
Name
The assigned or user-defined name for the hub containing the EFDMIM.
Location
The physical location of the hub containing the EFDMIM.
Net Address
The IP address of the hub containing the EFDMIM.
Device Type
The model type name of the hub containing the EFDMIM.
System UpTime
The time the hub has been active without failure displayed in the following
format: days+hours:minutes:seconds
A condition status banner surrounding this information displays the condition
status color for the hub containing the EFDMIM. In addition, the MMAC
Device Panel provides two buttons that allow you to change the type of
statistical information presented in the logical MIM horizontal bar gauges for
either the EFDMIM or the entire hub, as described in the following section.
Figure 2-6 shows an example of an IRM2, IRBM, or IRM3 MMAC Device
Panel.
9030368 E9
Device View
2-15
EFDMIM Device View
EFDMIM Logical MIM Representation
Figure 2-6.
The IRM2, IRBM, or IRM3 MMAC Device Panel
MMAC Device Panel
Name
Location
Network Address
Logical Gauges
IRBM Hub
My Office
Device Type
System UpTime
Hub_CSI_IRBM
2+01:17:39
132.177.118.24
Frames
Gauge Mode
Percentage
EFDMIM Logical MIM Representation
The EFDMIM logical representation provides gauge and port information
about the EFDMIM installed in the Cabletron hub instead of presenting a
physical image. For information on a Device View physical MIM
representation, refer to the section titled “EFDMIM Physical MIM
Representation.” Refer to the section titled “Changing MIM Representations”
for information on changing between logical and physical MIM
representations. Figure 2-7 shows an example of a logical MIM
representation.
An EFDMIM logical representation provides the following information about
the board and the ports on the board:
Board Name
The name of the EFDMIM.
Port Number
The number of the port.
Port Status
The current status of the port. The port status conditions are as follows:
STATUS
NLNK (No Link)
ON
OFF
SEG (Segmented)
COLOR CODE
Yellow
Green
Blue
Red
Two buttons are available from the MMAC Device Panel to change the
statistical selections.
Device View
2-16
Cabletron SNMP Bridges
Management Module Guide
EFDMIM Device View
EFDMIM Logical MIM Representation
Figure 2-7.
Logical Representation of an EFDMIM in a Physical Device View
Primary Landscape 0x00400000 - VNM Host - CTRON of type Hub_CSI_IRM3
* File
View
Device MenuHelp?
MMAC Device Panel
Device Type
Name IRM3
Location
Network Address
Logical
My Office
System UpTime
Hub_CSI_IRM3
2+01:17:39
132.177.118.24
Gauge Mode
Frames
MT8 MIM
EFDMIM
MT8 MIM
SN
SN
1
5
2
IRBM
SN
1
5
1
2
4
Rates
ON
OFF
M
B M
R A
G C
ON
ST
RC
DN
CR
PO
ON
RH
NK
DN
CR
PO
2
4
C
O
N
S
O
L
E
R
C
V
L
N
K
R
C
V
L
N
K
R
C
V
L
N
K
R
C
V
L
N
K
6
3
6
3
8
4
8
4
C
O
M
M
A
U
I
NS
LK
F
O
TH
I
R
RH
L
ETHERNET
9030368 E9
Device View
2-17
EFDMIM Device View
EFDMIM Logical MIM Representation
Logical Gauges
The Logical Gauges button accesses a menu that allows you to select the
statistic represented by the horizontal bar gauges for the overall board or
individual port on a MIM in logical MIM representation. The statistical
selections are as follows:
Frames
Indicates the amount of frames received or transmitted by the board or port.
Bytes
Indicates the amount of bytes received or transmitted by the board or port.
Recv_Colls
Indicates the amount of collisions received by the board or port.
Trans_Colls
Indicates the amount of collisions generated by the board or port during
transmission.
Total_Errors
Indicates the amount of errors detected by the board or port.
Align_Errors
Indicates the amount of misaligned packets detected by the board or port.
CRC_Errors
Indicates the amount of packets received by the board or port with bad
Cyclical Redundancy Checks (CRC).
Runts
Indicates the amount of runt packets received by the board or port. A runt
packet is one byte less than the standard Ethernet frame of 64 bytes not
including preamble.
Giants
Indicates the amount of giant packets received by the board or port. A giant
packet exceeds 1518 bytes not including preamble.
OutofWindow
Indicates the amount of collisions out of the standard window (51.2µs) due to a
network problem.
The horizontal bar gauge changes color depending on the statistic represented. Table 2-2 provides a list of the bar gauge statistic colors
Table 2-2.
Horizontal Bar Gauge Statistic Colors
Statistical Selection
Device View
2-18
Gauge Color
Frames
Light blue
Bytes
Blue
Recv_Colls
Dark green
Cabletron SNMP Bridges
Management Module Guide
EFDMIM Device View
EFDMIM Physical MIM Representation
Table 2-2.
Horizontal Bar Gauge Statistic Colors
Statistical Selection
Gauge Color
Trans_Colls
Purple
Total_Errors
Orange
Align_Errors
Lavender
CRC_Errors
Blue green
Runts
Light purple
Giants
Pink
OutofWindow
Salmon
Gauge Mode
The Gauge Mode button allows you to change the gauge representation of
the selected statistic. The Gauge Mode field definitions are as follows:
Percentages
Displays the selected statistic as a percentage of the total statistic for the
MIM.
Rates
Displays the selected statistic as a rate over a given time frame.
EFDMIM Physical MIM Representation
The physical MIMs representation of the EFDMIM shows the board, its LEDs,
and other physical features. Figure 2-8 shows an example of an IRM2, IRM3
or IRBM hub Device View in a physical MIM representation. Figure 2-9 shows
a detailed example of the EFDMIM physical representation.
9030368 E9
Device View
2-19
EFDMIM Device View
EFDMIM Physical MIM Representation
Figure 2-8.
Physical Representation of an EFDMIM in a Physical Device View
Primary Landscape 0x00400000 - VNM Host - CTRON of type Hub_CSI_IRM3
* File
View
Device MenuHelp?
MMAC Device Panel
Name IRM3
Location
Network Address
Logical Gauges
Device Type
My Office
Hub_CSI_IRM3
System UpTime
2+01:17:39
132.177.118.24
Gauge Mode
Frames
MT8 MIM
EFDMIM
MT8 MIM
SN
SN
1
5
Rates
SN
1
5
STAND
BY
POWER
F
D
D
I
SYS
OK
M
M
A
C
TX
RX
TX
RX
COL
POK
WRAP
2
4
2
4
IRBM
SN
TOK
M
B M
R A
G C
ON
ST
RC
DN
CR
PO
C
O
N
F
I
G
C
O
N
S
O
L
E
ON NET
R
C
V
L
N
K
R
C
V
L
N
K
R
C
V
L
N
K
R
C
V
ON
RH
NK
DN
CR
PO
L
N
K
6
3
6
3
8
4
8
4
B
Y
P
A
S
S
C
O
M
M
F
D
D
I
A
A
U
I
LINK
C
O
N
S
O
L
E
F
D
D
I
B
FDDI
Device View
2-20
NS
LK
F
O
TH
I
R
RH
L
ETHERNET
Cabletron SNMP Bridges
Management Module Guide
EFDMIM Device View
EFDMIM Physical MIM Representation
Figure 2-9.
EFDMIM Device View Physical Representation
EFDMIM
SN
STAND
BY
SYS
OK
POWER
F
D
D
I
M
M
A
C
TX
RX
TX
RX
WRAP
COL
TOK
POK
C
O
N
F
I
G
ON NET
B
Y
P
A
S
S
F
D
D
I
A
LINK
C
O
N
S
O
L
E
F
D
D
I
B
FDDI
9030368 E9
Device View
2-21
EFDMIM Device View
EFDMIM Physical MIM Representation
EFDMIM LEDs
This section provides an overview of the LEDs. For more detailed information,
refer to the manual that came with your hardware. The EFDMIM LEDs are
grouped into three categories: General, FDDI, and MMAC (Ethernet). During
operation of the EFDMIM, the LANVIEW LEDs can be interpreted as follows:
General LEDs
POWER
When lit, this green LED indicates that the power is on for the MMAC in
which the EFDMIM is installed and the EFDMIM is receiving power.
SYSOK
When lit, this green LED indicates that the EFDMIM internal self-test was
completed successfully. This self-test is run each time you power on the unit.
STANDBY
When lit, this yellow LED indicates that the bridge is in standby and no
packets are being forwarded. OFF is the normal mode with packets being
forwarded across the bridge.
FDDI Interface LEDs
TX
When flashing, this green LED indicates that data is being sent out on the
FDDI ring interface.
RX
When flashing, this yellow LED indicates that data is being received from the
FDDI ring interface.
WRAP
When lit, this red LED indicates that the EFDMIM is in a wrap condition.
OFF is the normal state.
TOKISD
This green LED flashes each time the EFDMIM places the token on the FDDI
ring.
ON NET
When lit, this green LED indicates that the EFDMIM’s FDDI interface is
inserted into the FDDI ring network. OFF indicates that the EFDMIM is
removed from the ring.
LINK A/B
When lit, these green LEDs indicate that an optical signal is being detected.
Device View
2-22
Cabletron SNMP Bridges
Management Module Guide
EFDMIM Device View
IRM Hub Physical Device View
MMAC (Ethernet) Interface LEDs
TX
When flashing, this green LED indicates that data is being sent out on the
Ethernet interface (MMAC backplane).
RX
When flashing, this yellow LED indicates that data is being received from the
Ethernet interface (MMAC backplane).
COL
This red LED flashes each time a packet collision occurs on the Ethernet/802.3
network.
POK
When lit, this green LED indicates that the EFDMIM Ethernet port internal
self-test was completed successfully. This self-test is run each time you power
on the unit.
IRM Hub Physical Device View
The Physical Device View for an SNMP or Cabletron Proprietary IRM
containing an SNMP Bridge device is similar to the Physical Device View for
IRM2, IRM3, or IRBM hubs. The only difference is that the top portion of the
IRM Physical Device View displays the MMAC Device Statistics Panel.
MMAC Device Statistics Panel
The MMAC Device Statistics Panel displays Frame Rate and Collision Rate
information for the hub. Each rate is color-coded to correspond to the MultiAttribute Line Graph. Figure 2-10 shows an example of an IRM MMAC
Device Statistics Panel.
Three buttons are also available from the MMAC Device Statistics Panel to
change the statistical presentation of the Multi-Attribute Line Graph or the
logical MIM horizontal bar gauges, as follows:
Log/Lin
The Log/Lin button toggles between a linear or logarithmic scale
presentation of the graph.
9030368 E9
Device View
2-23
EFDMIM Device View
IRM Hub Physical Device View
Logical Gauges
The Logical Gauges button accesses a menu that allows you to select the
statistic represented by the horizontal bar gauges for the overall board or
individual port on a MIM in a logical MIM representation. The statistical
selections are as follows:
Frames
Indicates the amount of frames received or transmitted by the board or port
Collisions
Indicates the total amount of collisions detected by the board or port
The horizontal bar gauge changes color depending on the statistic
represented, as shown in Table 2-3.
Table 2-3.
Horizontal Bar Gauge Statistic Colors
Statistical Selection
Gauge Color
Frames
Light blue
Collisions
Yellow
Gauge Mode
The Gauge Mode button allows you to change the gauge representation of
the selected statistic, as follows:
Percentage
Displays the selected statistic as a percentage of the total statistic for the
MIM.
Rate
Displays the selected statistic as a rate over a given time frame.
Device View
2-24
Cabletron SNMP Bridges
Management Module Guide
EFDMIM Device View
Configuring the EFDMIM in an IRM or IRBM Device View
Figure 2-10.
The MMAC Device Statistics Panel
Lin
Fri Jan 31 08:05:19 1996
MMAC Device Statistics
1000
800
Frame Rate
90
600
Collision Rate
0
400
200
0
0:9:0
0:6:0
0:3:0
0
Logical Gauges
Gauge Mode
Frames
Percentage
Configuring the EFDMIM in an IRM or IRBM Device View
To receive EFDMIM gauge and port information in the IRM or IRBM Device
View logical representation and for the EFDMIM LEDs to appear “live” in the
IRM or IRBM Device View physical representation, you must assign an IP
address to the EFDMIM installed in the hub chassis as follows:
1. Move the mouse pointer onto the EFDMIM. Single-click the left mouse
button to highlight the EFDMIM.
2. Select Icon Subviews from the View menu.
3. Select MIM Configuration View from the Icon Subviews menu to access
the EFDMIM Configuration View.
4. Select Edit from the File menu in the EFDMIM Configuration View.
5. Enter the IP address of the EFDMIM device. If you have already created
the EFDMIM as a stand alone icon, enter the same IP address here.
NOTE
9030368 E9
Cabletron recommends assigning a unique model name to the EFDMIM
installed in the hub chassis to easily differentiate it from an independent
EFDMIM icon (Bdg_CSI_EFDMIM) with the same assigned IP address.
Device View
2-25
EFDMIM Device View
Configuring the EFDMIM in an IRM2 or IRM3
6. Select Save &Close from the File menu in the EFDMIM Configuration
View.
7. A Pop-Up Window appears and prompts you whether to save the updated
configuration information. Click OK.
8. Select Go Back from the View menu in the EFDMIM Configuration View
to close this view.
Current EFDMIM gauge and port information in the IRM or IRBM Device
View logical representation will now be provided. The EFDMIM LEDs in the
IRM or IRBM Device View physical representation will now appear active.
Configuring the EFDMIM in an IRM2 or IRM3
To receive EFDMIM gauge and port information in the IRM2 or IRM3 Device
View logical representation and for the EFDMIM LEDs to appear “live” in the
IRM2 or IRM3 Device View physical representation, you must configure the
EFDMIM installed in the hub chassis. The EFDMIM can only be configured in
a Topology View. To configure the EFDMIM, execute the following procedures:
1. In the same Topology View level as the IRM2 or IRM3 with the installed
EFDMIM, create a stand alone icon representing the EFDMIM.
2. In Edit mode, create a logical connection pipe between the stand alone
EFDMIM icon and the IRM2 or IRM3 icon representing the hub with the
installed EFDMIM. SPECTRUM automatically connects the EFDMIM to
the hub’s internal port (CSIRptr Port).
3. In the EFDMIM DevTop view, connect the Off-Page Reference Icon
representing the IRM2 or IRM3 containing the EFDMIM to the EFDMIM
Ethernet port.
This completes the configuration procedure. Current EFDMIM gauge and port
information in the IRM2 or IRM3 Device View logical representation is now
provided. The EFDMIM LEDs in the IRM2 or IRM3 Device View physical
representation will now appear active.
NOTE
Device View
2-26
Once the EFDMIM has been configured in the Topology View, the stand alone
EFDMIM icon and the IRM2 or IRM3 icon containing the EFDMIM can be
copied into a Location View.
Cabletron SNMP Bridges
Management Module Guide
EFDMIM Device View
Copying the EFDMIM into a Location or Topology View
Copying the EFDMIM into a Location or Topology View
The EFDMIM installed in the hub chassis can be copied from the hub Device
View and pasted as a stand-alone icon into a Location or Topology View, as
follows:
1. Select Edit from the File menu.
2. Single-click on the EFDMIM to highlight it.
3. Select Copy from the Edit menu.
4. Navigate to the Location or Topology View.
5. Select Edit from the File menu.
6. Select Paste from the Edit menu.
The EFDMIM will now appear in the view as a stand-alone icon.
9030368 E9
Device View
2-27
EFDMIM Device View
Changing MIM Representations
Changing MIM Representations
You can change the MIM representation of the entire hub or the MIM
representation of the EFDMIM installed in the hub. This section describes
several ways to change the representation of MIMs in a hub.
Changing MIM Representations on the Entire Hub
To change the MIM representation of the entire hub Device View, follow these
steps:
1. In the hub’s Physical Device View, select the Device Menu menu option.
2. Click on either the Display Physical MIMs or Display Logical MIMs
menu option. The entire hub changes to the selected MIM representation.
Changing MIM Representations Using the Menu Bar
To change the MIM representation of the EFDMIM using the menu bar, follow
these steps:
1. In the hub’s Physical Device View, move the mouse pointer onto the
EFDMIM. Single-click the left mouse button to highlight the EFDMIM.
2. Select the View menu, and select the Icon Subviews submenu. Select the
Go Logical menu options from this submenu.
3. The EFDMIM changes its MIM representation. A selected single MIM
appears to extend from the hub chassis.
You must start in physical representation to use this toggle feature.
NOTE
Device View
2-28
Cabletron SNMP Bridges
Management Module Guide
EFDMIM Device View
Clearing Duplicate EFDMIM Address Alarms
Changing MIM Representations Using the Mouse
To change the MIM representation of the EFDMIM, using the mouse, follow
these steps:
You must start in physical representation to use this toggle feature.
NOTE
1. Move the mouse pointer onto the EFDMIM.
NOTE
Make sure that the mouse pointer is not on top of or next to a gauge or port
connector, otherwise a Port Performance View will open.
2. Double-click the left mouse button.
3. The EFDMIM changes its representation. A selected single MIM appears
to extend from the hub chassis.
Clearing Duplicate EFDMIM Address Alarms
If you have previously created a stand alone EFDMIM icon and have created
an IRM or IRBM hub icon and configured the EFDMIM installed in that hub
through the hub Device View, a duplicate address alarm condition (yellow
alarm) now exists in the hub icon containing the EFDMIM or the stand alone
EFDMIM icon. This occurs because SPECTRUM views the independent
EFDMIM icon and the EFDMIM installed in the hub icon as separate devices
with the same assigned IP address. To alleviate this alarm condition, you
must clear the duplicate alarm.
NOTE
9030368 E9
Although yellow alarm conditions are minor alerts, Cabletron Systems
recommends clearing these alarms when they occur.
Device View
2-29
EFDMIM Device View
Clearing Duplicate EFDMIM Address Alarms
Two methods exist for clearing this yellow alarm condition, depending on the
procedural order in which you created the independent EFDMIM icon and
configured the EFDMIM in the IRM or IRBM hub Device View. The particular
EFDMIM showing the duplicate IP address yellow alarm condition depends
on which EFDMIM was created or configured first. The following sections
describe the two possible ways of creating EFDMIMs and how to clear the
resulting duplicate alarms.
Case #1
1. Create the independent EFDMIM (Bdg_CSI _EFDMIM) icon.
2. Create the IRM or IRBM hub icon that contains the EFDMIM.
3. Configure the EFDMIM in the hub Device View.
If you followed the previous procedure, you can clear the duplicate address
alarm as follows:
1. Navigate to the hub Device View containing the EFDMIM.
2. Click on the EFDMIM to highlight it.
3. Select Icon Subviews from the View menu.
4. Select MIM Diagnostic View to access the EFDMIM Diagnostic View.
5. Select Alarms from the EFDMIM Diagnostic View. The Alarm View
displays an alarm icon for the EFDMIM installed in the hub with a yellow
alarm contact status color. The Symptom/Probable Cause box displays a
DUPLICATE IP ADDRESS message.
6. Choose the Clear option from the Tools menu to clear the alarm. You can
now exit from this view.
Case #2
1. Create the IRM or IRBM hub icon that contains the EFDMIM.
2. Configure the EFDMIM in the hub’s Device View.
3. Create the independent EFDMIM (Bdg_CSI_EFDMIM) icon.
4. If you followed the previous procedure, the EFDMIM (Bdg_CSI_EFDMIM)
icon appears with a yellow alarm contact status in the Topology View. You
can clear the duplicate address alarm as follows:
5. Click on the stand alone EFDMIM (Bdg_CSI_EFDMIM) icon.
6. Select Icon Subviews from the View menu.
Device View
2-30
Cabletron SNMP Bridges
Management Module Guide
EFDMIM Device View
EFDMIM Generic Views
7. Select Diagnostic from the Icon Subviews menu to access the EFDMIM
Diagnostic View.
8. Select Alarms from the EFDMIM Diagnostic View. The Alarm View
displays two alarms for the independent EFDMIM icon each with a yellow
alarm contact status color. The Symptom/Probable Cause box displays
DUPLICATE IP ADDRESS and DUPLICATE-PHYSICAL ADDRESS
messages respectively.
9. Choose the Clear option from the Actions menu to clear each of these
alarms. You can now exit from this view.
EFDMIM Generic Views
To access the EFDMIM generic views (Configuration, Diagnostic, Application,
and Performance) while in a hub Device View, follow these steps:
1. Single-click to select the EFDMIM physical or logical representation to
highlight it.
2. Select Icon Subviews from the View menu.
3. Select the generic view of interest.
NOTE
9030368 E9
The EFDMIM generic views can also be accessed from the independent
EFDMIM icon (Bdg_CSI_EFDMIM) .
Device View
2-31
EFDMIM Device View
EFDMIM Generic Views
Device View
2-32
Cabletron SNMP Bridges
Management Module Guide
Chapter 3
Application Views
What is in this Chapter
This chapter describes the Application Views available for all Cabletron
SNMP Bridges. The Application View contains network protocol traffic and
database information for the Cabletron bridge device. Some of these attributes
are external to SPECTRUM, since they are entered when the bridge device is
configured. Other attributes are internal, since they are entered when the
bridge device’s icon is created in the SpectroSERVER database. In the NB30 a
filtering database is not maintained by the device on frames received through
port 2 (the remote port). Consequently, filtering cannot be enabled or disabled
for that port and all frames received through that port are automatically
forwarded to port 1 (the local port).
Accessing the Application View
You can access the Application View using one of the following methods (refer
to Figure 3-1):
• Double-click on the Application View label of the bridge icon.
• Highlight the bridge icon and select Application from the Icon Subviews
menu.
9030368 E9
Application Views
3-1
Accessing the Application View
Figure 3-1.
Accessing the Application View
Double-click
10
1
.1
.01
Close
Navigate
Alarms
Performance
Notes...
Utilities
Zoom
Configuration
Diagnostic
Acknowledge
Flash Green Enabled
Application
Device
DevTop
9030368 E9
Select Application
Application Views
3-2
NB20E, NB25E, and NB30 Application Views
NB20E, NB25E, and NB30 Application Views
The initial SNMP NB20E, SNMP NB25E, NB30 Application View provides
the Model Name, Model Type, Network Address, HASPART Panel, and two
buttons.
Bridge Databases
The Bridge Databases button accesses the SNMP Bridge Database View.
This view provides information on the IEEE 802.1 Source Address Tables that
are used to determine which frames will be forwarded through the SNMP
bridge from one network segment to another. The following information is
provided:
Model Name
The user-defined name of the bridge model.
Special Database
Table 3-1 lists the information provided by this area of the SNMP Bridge
Database View.
Table 3-1.
Bridge Database View Special Database Information Fields
Field
9030368 E9
Description
Number of Filters
The current number of filters in the Special Database.
Max Number of Filters
The maximum number of filters allowed in the Special
Database.
Application Views
3-3
NB20E, NB25E, and NB30 Application Views
Acquired Database
Table 3-2 lists the information provided by this area of the SNMP Bridge
Database View.
Table 3-2.
Bridge Database View Acquired Database Information Fields
Field
Application Views
3-4
Description
Total Entries
The total number of Dynamic or Static entries in the
Acquired Database.
Maximum Entries
The maximum number of Dynamic or Static entries
allowed in the Acquired Database.
Static Entries
The number of addresses added to the Acquired
Database by you or the network manager.
Static Entry Age Lmt (Not
Available for NB30)
The length of time allowed for a Static entry in the
Acquired Database to be inactive before it is dropped
from the database. This time is fixed at zero (0) as
Static entries do not age-out.
Dynamic Entries
The number of Dynamic entries that have been
accumulated in the acquired database through the
bridge’s learning process.
Dynamic Entry Age Lmt
The length of time allowed for a Dynamic entry in the
Acquired Database to be inactive before it is dropped
from the database. A time range of 10 - 1,000,000
seconds can be specified.
Database Entries
Erase (set to zero) all Dynamic or Static entries in the
acquired database (except for the 16 [17 for the NB30]
permanent Static entries) by clicking the Erase
button.
Cabletron SNMP Bridges
Management Module Guide
NB20E, NB25E, and NB30 Application Views
Permanent Database
Table 3-3 lists the information provided by this area of the SNMP Bridge
Database View.
Table 3-3.
Bridge Database View Permanent Database Information Fields
Field
Description
Current Entries
The number of Static entries currently recorded in the
bridge’s Permanent Database.
Maximum Entries
The maximum number of Static entries allowed in the
Permanent Database.
Database Entries
Erase (set to zero) all Static entries in the permanent
database (except for the 16 [17 for the NB30]
permanent Static entries) by clicking the Erase
button. For the NB30 this also erases the entries in the
Acquired Database.
Three additional buttons are available to access the SNMP Bridge database
tables, as follows:
Permanent Database Table
The Permanent Database Table button accesses the SNMP Bridge
Permanent Database Table. The SNMP Bridge Permanent Database Table
displays addresses that remain in the Source Address Table when the system
is shut down. For the NB30, there is no Port2 Out column supported, and
Port1 Out is named Filtering. The Add New Database Entry area of the
Permanent Database Table allows you to enter a new Static hexadecimal
Ethernet address into the Permanent Database. A Select Filtering button is
also provided that accesses an SNMP Bridge Filter Selection View. Table 3-4
lists the filtering options for the Static address.
9030368 E9
Application Views
3-5
NB20E, NB25E, and NB30 Application Views
Table 3-4.
Permanent Database Static Address Filtering Options
Option
NOTE
Description
Prt1=Filter/Prt2=Filter
(Not Available for NB30)
Add an entry to the Permanent Database Table to
filter packets entering ports 1 and 2 if those packets
are destined for the specified address.
Prt1=Filter/
Prt2=Relay_Prt1
Add an entry to the Permanent Database Table to
filter packets entering port 1 and forward packets
entering port 2 if those packets are destined for the
specified address. In the NB30 a filtering database is
not maintained by the device on frames received
through port 2 (the remote port). Consequently,
filtering cannot be enabled or disabled for that port
and all frames received through that port are
automatically forwarded to port 1 (the local port).
Prt1=Relay_Prt2/
Prt2=Relay_Prt1
Add an entry to the Permanent Database Table to
forward packets entering ports 1 and 2 if those packets
are destined for the specified address. In the NB30 a
filtering database is not maintained by the device on
frames received through port 2 (the remote port).
Consequently, filtering cannot be enabled or disabled
for that port and all frames received through that port
are automatically forwarded to port 1 (the local port).
Prt1=Filter/Prt2=Filter
(Not Available for NB30)
Add an entry to the Permanent Database Table to
forward packets entering port 1 and filter packets
entering port 2 if those packets are destined for the
specified address.
Permanent Entry (NB30
only)
Delete the selected entry from the Permanent
Database Table.
Selecting a filtering option from this view, toggles to the next the filtering
option and highlights it. The initial filter selected is the actual option that is
used.
Double-clicking on a column entry accesses an entry-specific Permanent
Database Information View. Table 3-5 lists the information provided by this
view.
Application Views
3-6
Cabletron SNMP Bridges
Management Module Guide
NB20E, NB25E, and NB30 Application Views
Table 3-5.
Permanent Database Information View Fields
Field
Description
Model Name
The user-defined name of the bridge model.
Source Address
The source address of the entry selected.
Entry Type
The entry type: Static or Dynamic. Permanent
Database entries are always Static.
Port1 Out
(Filtering for NB30)
The outbound port for packets entering port 1. A readonly indicator button displays the port’s filtering
designation (Filter or Relay).
Port2 Out
(Not Available for NB30)
The outbound port for packets entering port 2. A readonly indicator button displays the port’s filtering
designation (Filter or Relay).
Permanent Entry
Allows you to delete this address from the Permanent
Database Table by clicking on the Delete button.
Acquired Database Table
The Acquired Database Table button accesses the SNMP Bridge Acquired
Database Table. The SNMP Bridge Acquired Database Table displays address
entries that do not remain in the Source Address Table when the system is
shut down. These entries can either be Static (entered by you) or Dynamic
(added to the table through the bridge’s learning process). For the NB30, there
is no Port2 Out column supported, and Port1 Out is named Filtering. The Add
New Database Entry area of the Acquired Database Table allows you to enter
a new Static Ethernet address into the Acquired Database. A Select
Filtering button is also provided that accesses an SNMP Bridge Filter
Selection View. Table 3-6 provides a list of the filtering options for the Static
address.
Double-clicking on a column entry in the Acquired Database Table accesses an
entry-specific Acquired Database Information View. Table 3-7 lists the
information provided by this view.
9030368 E9
Application Views
3-7
NB20E, NB25E, and NB30 Application Views
Table 3-6.
Acquired Database Table Static Address Filter Options
Field
NOTE
Application Views
3-8
Description
Prt1=Filter/Prt2=Filter
(Not Available for NB30)
Add an entry to the Acquired Database Table
to filter packets entering ports 1 and 2 if
those packets are destined for the specified
address.
Prt1=Filter/Prt2=Relay_Prt1
Add an entry to the Acquired Database Table
to filter packets entering port 1 and forward
packets entering port 2 if those packets are
destined for the specified address. In the
NB30 a filtering database is not maintained
by the device on frames received through port
2 (the remote port). Consequently, filtering
cannot be enabled or disabled for that port
and all frames received through that port are
automatically forwarded to port 1 (the local
port).
Prt1=Relay_Prt2/Prt2=Relay_Prt1
Add an entry to the Acquired Database Table
to forward packets entering ports 1 and 2 if
those packets are destined for the specified
address. In the NB30 a filtering database is
not maintained by the device on frames
received through port 2 (the remote port).
Consequently, filtering cannot be enabled or
disabled for that port and all frames received
through that port are automatically
forwarded to port 1 (the local port).
Prt1=Filter/Prt2=Filter
(Not Available for NB30)
Add an entry to the Acquired Database Table
to forward packets entering port 1 and filter
packets entering port 2 if those packets are
destined for the specified address.
Acquired Entry (NB30 only)
Delete the selected entry from the Acquired
Database Table.
Selecting a filtering option from this view, toggles to the next filtering option
and highlights it. The initial filter selected is the actual option that is used.
Cabletron SNMP Bridges
Management Module Guide
NB20E, NB25E, and NB30 Application Views
Table 3-7.
Acquired Database Information View Fields
Field
Description
Model Name
The user-defined name of the bridge model.
Source Address
The source address of the entry selected.
Entry Type
The entry type: Static or Dynamic.
Port1 Out (Filtering for
NB30)
The outbound port for packets entering port 1. A readonly indicator button displays the port’s filtering
designation (Filter or Relay).
Port2 Out
(Not Available for
NB30)
The outbound port for packets entering port 2. A readonly indicator button displays the port’s filtering
designation (Filter or Relay).
Acquired Entry
Allows you to delete this address from the Acquired
Database Table by clicking on the Delete button
Special Database Table
The Special Database Table button accesses the SNMP Bridge Special
Database Filter Table. The SNMP Bridge Special Database Filter Table
displays filtering information for forwarding packets through the bridge from
one network segment to another. For the NB30, there is no Port2 Out column
supported, and Port1 Out is named Port 1. Table 3-8 lists the information
provided by the Add New Database Entry area of the Special Database Filter
Table. An Add an Entry button is also provided that accesses an SNMP
Bridge Add an Entry View. This view allows you to select filtering options for a
Static address. Table 3-9 provides a list of the view’s filtering options.
Table 3-8.
Special Database New Database Information
Field
9030368 E9
Description
Next Available Filter
The number of the next available filter that can be added
to the Special Database Filter Table. This field will appear
red-boxed if the database is full and no more filters can be
added. For the NB30 the next available filter will be set to
255 if the database is full, and the field is not boxed in red.
Set to Next Available
Filter
Allows you to specify the next available filter to be added
to the Special Database Filter Table.
Application Views
3-9
NB20E, NB25E, and NB30 Application Views
Table 3-9.
Special Database Add an Entry View Options
Field
Port 1 Filter/Relay
Description
Set port 1 to filter or forward packets.
Port 2 Filter/Relay (Not Set port 2 to filter or forward packets.
Available for NB30)
Source Address
Set the Special Database to filter packets with a specific
source address.
Destination Address
Set the Special Database to filter packets with a specific
destination address.
Filter by Type Field
(Frame Type for NB30)
Set the Special Database to filter packets with a specific
type field.
Filter by Data Field
(Data Field for NB30)
Set the Special Database to filter packets based on the
first sixteen bits of data in the packet.
Enable/Disable Filter
Allows you to Enable or Disable the selected filtering.
(Filter Status for NB30)
Double-clicking on a column entry from the Special Database Filter Table
accesses a filter-specific Special Database Information View. A Delete Filter
button is provided that accesses the Delete Special Database Filter View. This
filter can be removed by clicking on the Delete button in this view.
System
The System button accesses the SNMP System Group View. This view
provides the following information:
System Descriptor
A textual description of the SNMP Bridge. This description includes the name
and version of the hardware type, the software operating system, and the
networking software.
System UpTime
The time, in days+hours:minutes:seconds, since the SNMP Bridge’s network
management software was last reinitialized.
System Object ID
The Structure of Management Information (SMI) identification of the network
management subsystem contained in the SNMP Bridge.
Application Views
3-10
Cabletron SNMP Bridges
Management Module Guide
EFDMIM Application View
HASPART Panel
HASPART Panel
The HASPART panel provides different entries for the different bridges
modeled. For the SNMP NB20E and SNMP NB25E only one entry choice is
available. Double-clicking on the Prt_Bdg_SEnet # entry accesses an
interface specific Ethernet Port Performance View. For the NB30 there are two
valid entry choices. Double-clicking on the CSIBrdg_LPort $ entry accesses
the Ethernet Port Performance View. Double-clicking on the CSIBrdgPrtV35
$ (this could also be CSIBrdgPrtDSX depending on the port type) accesses
an interface specific Remote Port Performance View. The section titled “Port
Performance View” describes the Ethernet Port Performance View and the
Remote Port Performance View.
EFDMIM Application View
The initial EFDMIM Application View provides the Model Name, Model Type,
Network Address, Ring Table, and the HASPART Panel.
Ring Table
The Ring Table provides an ordered list and description of each node on the
FDDI Ring and provides the following information:
MAC Address
The EFDMIM FDDI MAC address.
Up Neighbor
A 6 octet canonical representation of the upstream neighbor’s address. The
upstream neighbor is the last node on the ring to receive the FDDI token
before this node.
Node Class
A read-only indicator button displaying if the node is functioning as a station
or a concentrator.
Ring MACS
The number of devices on the FDDI Ring.
NonMaster
The total number of A-Ports, B-Ports, and S-Ports on the FDDI Ring.
Master Phys
The number of master ports on this FDDI Ring (from 0 to 255).
Ring Topology
The current state of the FDDI Ring. Table 3-10 shows the possible states.
9030368 E9
Application Views
3-11
EFDMIM Application View
Ring Table
Ring Duplicate
Indicates duplicate address information for the EFDMIM. Table 3-11 shows
the possible indications.
Table 3-10.
Possible FDDI Ring States
State
Table 3-11.
Isolated
The EFDMIM is not attached to the ring.
Non-Op
The EFDMIM is attempting to enter the ring.
Ring-Op
The ring is operational.
Detect
The claim/beacon process of the FDDI ring protocol has
exceeded 1 second. This indicates a potential problem.
Non-Op-Dup
The ring failed to complete the claim/beacon process
because a duplicate FDDI address has been detected.
Ring-Op-Dup
The ring is operational but a duplicate FDDI address
has been detected.
Directed
The claim/beacon process did not complete within 9
seconds. The EFDMIM is now sending directed
beacons to indicate a problem.
Trace
A problem has been detected with the station or its
upstream neighbor. A trace is being sent to notify the
upstream neighbor of the problem. The EFDMIM and
all stations between the EFDMIM and its upstream
neighbor will run self-tests.
Possible EFDMIM Duplicate Address Indications
Indicator
Application Views
3-12
Description
Description
My Duplicate
The EFDMIM has determined that its MAC address is
the same as another node on the FDDI Ring.
UNA Duplicate
The EFDMIM’s upstream neighbor has determined
that its MAC address is the same as another node on
the ring.
Cabletron SNMP Bridges
Management Module Guide
EFDMIM Application View
HASPART Panel
HASPART Panel
The EFD_If_Port # button available from the HASPART panel accesses an
interface specific EFDMIM Port Performance View. The EFDMIM Port
Performance View is described in the section titled “Port Performance View.”
9030368 E9
Application Views
3-13
EFDMIM Application View
HASPART Panel
Application Views
3-14
Cabletron SNMP Bridges
Management Module Guide
Chapter 4
Configuration Views
What is in this Chapter
This chapter describes the Configuration Views available for the Cabletron
SNMP Bridges. The Configuration View contains more detailed network
configuration information for the Cabletron SNMP Bridge. Some of these
configuration attributes are external and some internal. This view also allows
you to configure the polling cycles to the bridge device model in the
SpectroSERVER database.
Accessing the Configuration View
You can access the Configuration View using one of the following methods
(refer to Figure 4-1):
• Double-click on the Configuration View label of the bridge icon.
• Highlight the bridge icon and select Configuration from the Icon
Subviews menu.
9030368 E9
Configuration Views
4-1
Accessing the Configuration View
Figure 4-1.
Accessing the Configuration View
Double-click
10
1
.1
.01
Close
Navigate
Alarms
Performance
Notes...
Utilities
Zoom
Configuration
Diagnostic
Acknowledge
Flash Green Enabled
Application
Device
DevTop
9030368 E9
Select Configuration
Configuration Views
4-2
NB20E, NB25E, and NB30 Configuration Views
Model Configuration
NB20E, NB25E, and NB30 Configuration Views
Model Configuration
This area of the SNMP Bridge Configuration View provides the following
information:
Model Name
The user-defined name of the bridge model.
Network Address
The Internet Protocol (IP) address of the SNMP Bridge.
Community Name
The Community Name that has been assigned locally to this SNMP Bridge.
Security String
The SNMP Bridge’s assigned Security String. (Refer to User Security and
User Maintenance for details on setting up security in SPECTRUM.)
Polling Interval
The time, in seconds, between SpectroSERVER polls of the network for a
specific model.
Poll Log Ratio
The number of SpectroSERVER polls of a device that occur prior to logging
the poll results in the database.
Polling Status
This True/False button allows an administrator to disable SpectroSERVER
polls of a device by setting Polling Status to False and selecting Save All
Changes from the File menu. This is useful to disable rollup conditions for
minor network events such as a workstation power-down.
Device Configuration
This area of the SNMP Bridge Configuration View provides the following
information:
Bridge Name
The user-defined name of the bridge. The default is ETHERNET BRIDGE for
the NB20E and NB25E. The default is CABLETRON REMOTE for the NB30.
Bridge Type
The type of bridge (e.g., NB20E, NB25E, or NB30).
9030368 E9
Configuration Views
4-3
NB20E, NB25E, and NB30 Configuration Views
Device Configuration
Bridge Location
The user-defined name to indicate the location of the bridge on the network.
The default location is LOCAL.
Firmware Version
The release version of the firmware installed in the bridge.
Number of Ports
The number of ports on the bridge.
The SNMP Bridge Configuration View also provides six buttons:
Bridge/Root Information
The Bridge/Root Information button accesses the Bridge/Root Information
View. This view provides the following information:
Model Name
The user-defined name of the bridge model.
Root Bridge ID
The Ethernet address of the bridge that is currently functioning as the root
bridge.
Root Port
The number of the port that provides the lowest cost path to the root bridge.
Root Cost
The value or cost of the data path from the bridge to the root bridge.
Root Brdg Max Age
The maximum time a Bridge Protocol Data Unit (BPDU) can exist before it is
discarded if a bridge is the root or is attempting to become the root. A time
range of 6 to 40 seconds can be specified. The default is 20 seconds.
Additional Bridge Information
The Additional Bridge Information button accesses the Additional Bridge
Information View. This view provides the following information:
Model Name
The user-defined name of the bridge model.
Bridge Priority
The part of the bridge ID that contains the identifier used in the spanning tree
for priority comparisons. An allowed range of 0 through FFFF can be
specified. The default is 8000.
Hold Time
The minimum time period elapsing between the transmission of configuration
BPDUs through a given bridge port.
Protocol Max Age
The maximum age of received protocol information before it is discarded.
Configuration Views
4-4
Cabletron SNMP Bridges
Management Module Guide
NB20E, NB25E, and NB30 Configuration Views
Device Configuration
Trap Type Obj ID (Not Available for NB30)
Contains the object identifier of the first VarBinding in the last trap generated
by the bridge.
Bridge Setup Information
The Bridge Setup Information button accesses the Setup Information View.
This view is different for the NB20E, NB25E, and NB30. The information
supplied for the different model types is shown below:
NB20E and NB25E
Model Name
The user-defined name of the bridge model.
Bridge ID
The bridge priority plus the Ethernet address of the bridge.
Switch Settings
The current switch settings read from the bridge hardware.
Number of Restarts
The number of times the bridge has been powered up or restarted.
Type of Filtering
The type of filtering to be performed by the bridge. The default is IEEE 802.1.
STA Protocol
The spanning tree algorithm under which the bridge is operating. Selections
include: 802.1 compliant spanning tree algorithm environment (802.1), DEC
LAN Bridge 100 environment (DEC), and without spanning tree algorithm
enabled (None). The default is 802.1.
NB30
Model Name
The user-defined name of the bridge model.
Bridge ID
The bridge priority plus the Ethernet address of the bridge.
Firmware Version
The firmware version currently loaded on the NB30 bridge.
Number of Restarts
The number of times the bridge has been powered up or restarted.
Type of Filtering
The type of filtering to be performed by the bridge. The default is IEEE_802.1.
9030368 E9
Configuration Views
4-5
NB20E, NB25E, and NB30 Configuration Views
Device Configuration
STA Protocol
The spanning tree algorithm under which the bridge is operating. Selections
include: 802.1 compliant spanning tree algorithm environment (802.1), DEC
LAN Bridge 100 environment (DEC), and without spanning tree algorithm
enabled (None). The default is 802.1.
The Device Switch Settings section of the Bridge Setup Information View has
six additional read-only parameters. Table 4-1 provides a list of the
parameters.
Table 4-1.
Bridge Setup Information View Parameters
Field
Description
Broadcasts
Indicates whether the bridge will forward Broadcast
packets across the wide area transmission link.
Filtered means that packets will not be forwarded,
Forwarded means that they will be forwarded.
ROOT
Indicates whether the bridge has the Root Switch
enabled or disabled. OFF means the Root Switch is
disabled, ON means that it is enabled.
Switch 1
In the Up position this switch indicates the bridge is
configured to Data Mode Control Signal Switch, The
Down position indicates the bridge is configured to T1
Timing Mode Switch.
Switch 2
In the Up position this switch indicates that the
Spanning Tree Algorithm Switch is Enabled. The
Down position indicates that the switch is Disabled.
Switch 3
This switch selects the T1 frame format. In the Up
position this switch indicates the bridge is configured
to ESF frame format, the Down position selects the D4
frame format. Both bridges must use the same frame
format.
Switch 4
This switch is not used by the NB30 bridge.
Topology Information
The Topology Information button accesses the Topology Information View.
This view provides the following information:
Model Name
The user-defined name of the bridge model.
Time Topology Change
The time, in seconds, that has elapsed since the bridge’s Topology Change
Flag last recorded the value of a topology change.
Configuration Views
4-6
Cabletron SNMP Bridges
Management Module Guide
NB20E, NB25E, and NB30 Configuration Views
Device Configuration
Topology Change
Indicates if a bridge Topology change is in progress.
Topology Change Count
The number of times the bridge’s Topology Change Flag has been changed
since the bridge was powered up or initialized.
Fwd Dly & Hello Information
The Fwd Dly & Hello Information button accesses the Forward Delay &
Hello Information View. This view provides the following information:
Model Name
The user-defined name of the bridge model.
Forward Delay Parm
The value of the forward delay parameters when the bridge is the root or
attempting to become root. A time range of 4 to 30 seconds can be specified.
The default is 15.
Forward Delay
The time spent in the LISTENING state while moving from the BLOCKING
state to the LISTENING state, or the time spent in the LEARNING state
while moving from the LISTENING state to the FORWARDING state.
Hello Time Parm
The value of the Hello Time parameter when the bridge is the root or is
attempting to become the root. A time range of 1 to 10 seconds can be
specified. The default is 2 seconds.
Hello Time
Indicates, in seconds, the length of time the root bridge or bridge attempting
to become the root waits before resending configuration BPDUs.
Control
The Control button accesses the SNMP Bridge Control View. This view
provides the following information:
Current Bridge Status
The status of the bridge (ON-LINE, STAND BY, or DISABLED).
Bridge Status
Enable or disable the bridge by toggling this button.
9030368 E9
Configuration Views
4-7
NB20E, NB25E, and NB30 Configuration Views
EFDMIM Configuration View
Bridge Restart
Force the bridge to undergo a software reset by clicking on this button.
Bridge Settings
Restore the bridge settings to their default values by clicking on this button.
(Default settings for NB30).
Counters
Reset all device maintained counters by clicking on this button (NB30 only).
EFDMIM Configuration View
The EFDMIM Configuration View is divided into two sections: Model
Configuration and Device Configuration.
Model Configuration
This area of the EFDMIM Configuration View provides the following
information:
Model Name
The user-defined name of the bridge model.
Network Address
The Internet Protocol (IP) address of the EFDMIM.
Community Name
The Community Name that has been assigned locally to this EFDMIM.
Security String
The EFDMIM assigned Security String. (Refer to User Security and User
Maintenance for details on setting up security in SPECTRUM.)
Polling Interval
The time, in seconds, between SpectroSERVER polls of the network for a
specific model.
Poll Log Ratio
The number of SpectroSERVER polls of a device that occur prior to logging
the poll results in the database.
Configuration Views
4-8
Cabletron SNMP Bridges
Management Module Guide
NB20E, NB25E, and NB30 Configuration Views
EFDMIM Configuration View
Polling Status
This button allows an administrator to disable SpectroSERVER polls of a
device by setting Polling Status to FALSE and selecting Save All Changes
from the File menu. This is useful to disable rollup conditions for minor
network events such as a workstation power-down.
Device Configuration
This area of the EFDMIM Configuration View provides the following
information:
Bridge Name
The user-defined name of the bridge. The default is Cabletron Enet-FDDI
Bridge.
Firmware Version
The release version of the firmware installed in the bridge.
Bridge Address
The factory-set address for the EFDMIM displayed in Ethernet and FDDI
formats.
Bridge Location
The user-defined name to indicate the location of the bridge on the network.
The default location is LOCAL.
Bridge Uptime
The number of seconds since the EFDMIM was last reset or initialized.
Ring Uptime
The number of seconds since the most recent FDDI Ring oscillation. This field
resets to zero when the FDDI Ring is non-operational.
Two additional buttons are available from the EFDMIM Configuration View.
Additional Configuration
The Additional Configuration button accesses an additional EFDMIM
Configuration View, which provides the following information:
Model Name
The user-defined name of the bridge model.
Network Address
The Internet Protocol (IP) address of the EFDMIM.
9030368 E9
Configuration Views
4-9
NB20E, NB25E, and NB30 Configuration Views
EFDMIM Configuration View
CFM State
The EFDMIM current Configuration Management state. This indicates the
current physical connections to the EFDMIM. Table 6-13 shows possible CFM
states.
RMT State
The current state of the ring. Table 6-14 shows possible RMT states.
Bypass Attached
A read-only indicator button displaying whether the station has an optical
bypass switch (TRUE or FALSE).
Bypass Stuck
A read-only indicator button displaying whether the optical bypass switch is
stuck (TRUE or FALSE).
Bridge Mode
A read-only indicator button displaying whether the EFDMIM is an
encapsulating bridge (using FDDI as a backbone only) or a translation bridge
(translating packets into FDDI format).
Oscillations
The number of times the claim/beacon process has completed since the last
power-up. The counter does not accept a reset command.
Downstream MAC
The address of the EFDMIM’s downstream neighbor in canonical format.
Table 4-2.
Possible EFDMIM CFM States
State
Description
Both PHY-A and PHY-B are disconnected from the
ring. There are no connections at either the A or B
FDDI port.
Wrap-A
PHY-A is wrapped via the MAC (from PHY-A/Primary
In to MAC to Secondary Out/PHY-A) and PHY-B is
disconnected.
Wrap-B
PHY-B is wrapped via the MAC (from PHY-B/
Secondary In to MAC to Primary Out/PHY-B) and
PHY-A is disconnected.
Wrap-AB
PHY-B is connected to the MAC (from PHY-B/
Secondary In to MAC to Primary Out/PHY-B) and
PHY-A is wrapped (connecting Primary In to
Secondary Out), isolating PHY-A from the MAC.
Configuration Views
4-10
Isolated
Cabletron SNMP Bridges
Management Module Guide
NB20E, NB25E, and NB30 Configuration Views
EFDMIM Configuration View
Table 4-2.
Possible EFDMIM CFM States (Continued)
State
Table 4-3.
Through-A
Indicates that the primary ring is connected to the
MAC (from PHY-A/Primary In to MAC to Primary Out/
PHY-B). The secondary ring is isolated from the MAC
(from PHY-B/Secondary In to PHY-A/Secondary Out).
Through-B
Indicates that the secondary ring is connected to the
MAC (from PHY-B/Secondary In to MAC to Secondary
Out/PHY-A). The primary ring is isolated from the
MAC (from PHY-A/Primary In to PHY-B/Primary Out).
Possible EFDMIM RMT States
State
9030368 E9
Description
Description
Isolated
The EFDMIM is not attached to the ring.
Non-Op
The EFDMIM is attempting to enter the ring.
Ring-Op
The ring is operational.
Detect
The claim/beacon process of the FDDI ring protocol has
exceeded 1 second. This indicates a potential problem.
Non-Op-Dup
The ring failed to complete the claim/beacon process
because a duplicate FDDI address has been detected.
Ring-Op-Dup
The ring is operational but a duplicate FDDI address
has been detected.
Directed
The claim/beacon process did not complete within 9
seconds. The EFDMIM is now sending directed
beacons to indicate a problem.
Trace
A problem has been detected with the station or its
upstream neighbor. A trace is being sent to notify the
upstream neighbor of the problem. The EFDMIM and
all stations between the EFDMIM and its upstream
neighbor will run self-tests.
Configuration Views
4-11
NB20E, NB25E, and NB30 Configuration Views
EFDMIM Configuration View
Switch Settings
In addition, the Switch Settings area of the additional EFDMIM
Configuration View provides a table containing a series of read-only indicator
buttons that (if they appear depressed) indicate which jumper settings are
enabled on the EFDMIM board. Table 6-15 provides a list of the jumper
setting information fields.
Table 4-4.
Configuration View Jumper Setting Fields
Field
Description
Root
Not depressed indicates the spanning tree root is
selected.
ForwardBroad
Not depressed indicates packets are being forwarded
not filtered.
SpannTree
Not depressed indicates spanning tree facilities are
enabled.
BPDU
Not depressed indicates the spanning tree is using the
IEEE 802.1 Bridge Protocol Data Unit (BPDU) rather
than the DEC BPDU.
Bypass
Not depressed indicates there is an optical bypass
physically attached to the EFDMIM.
Ring
Not depressed indicates the EFDMIM should attach to
the primary FDDI Ring rather than the secondary
FDDI Ring.
Diagnostics
Not depressed indicates the EFDMIM is in its normal
operating mode and not running diagnostic self-tests.
Mode
Not depressed indicates the EFDMIM is an
encapsulating bridge (uses FDDI as a backbone
between two Ethernet segments) rather than a
translation bridge (communicates from Ethernet to
Ethernet or Ethernet to FDDI).
Control
The Control button accesses the EFDMIM Control View, providing the Model
Name, Network Address, and the following information:
Bridge Status
The status of the EFDMIM (ON-LINE, STAND BY, or DISABLED).
Bridge Status Control
Enable or disable the EFDMIM by toggling this button.
Configuration Views
4-12
Cabletron SNMP Bridges
Management Module Guide
NB20E, NB25E, and NB30 Configuration Views
EFDMIM Configuration View
Counters
Force the EFDMIM to reset its counters by clicking on this button. The
EFDMIM resets all counters except the following:
FDDI
FDDI
FDDI
FDDI
9030368 E9
Frame Count
Error Count
Lost Count
Ring Oscillations
Configuration Views
4-13
NB20E, NB25E, and NB30 Configuration Views
EFDMIM Configuration View
Configuration Views
4-14
Cabletron SNMP Bridges
Management Module Guide
Chapter 5
Diagnostic Views
What is in this Chapter
This chapter describes the Diagnostic View available for Cabletron SNMP
Bridges. The Diagnostic View provides a breakdown of network errors
gathered by the SNMP Bridge or EFDMIM on a network segment. Each error
attribute is summarized over two intervals: total interval since first poll and
rate interval between polls. Buttons allow you to select a graphical
representation for the error attributes, and to bring up the Event and Alarm
Log Views.
Accessing the Diagnostic View
You can access the Diagnostic View using one of the following methods (refer
to Figure 5-1):
• Double-click on the Diagnostic View label of the bridge icon.
• Highlight the bridge icon and select Diagnostic from the Icon Subviews
menu.
9030368 E9
Diagnostic Views
5-1
SNMP NB20E, SNMP NB25E and NB30 Diagnostic View
Figure 5-1.
Accessing the Diagnostic View
Double-click
10
1
.1
.01
Close
Navigate
Alarms
Performance
Notes...
Utilities
Zoom
Configuration
Diagnostic
Acknowledge
Flash Green Enabled
Application
Device
DevTop
Select Diagnostic
SNMP NB20E, SNMP NB25E and NB30
Diagnostic View
The initial SNMP Bridge Diagnostic View displays the following information:
Model Name
The user-defined name of the bridge model.
Bridge Name
The user-defined name of the bridge. The default is ETHERNET BRIDGE
(CABLETRON REMOTE BRIDGE for the NB30).
Bridge Type
The type of bridge (e.g., NB20E, NB25E, or NB30).
Status
The status of the bridge (ON-LINE, STAND BY, or DISABLED).
Diagnostic Views
5-2
Cabletron SNMP Bridges
Management Module Guide
EFDMIM Diagnostic View
Total
The total number of network errors detected by the bridge.
Last Poll
The number of network errors since the last network poll.
Network Errors
The Network Errors button accesses a rate graph displaying the total
number of network errors over a given timeframe.
Events
The Events button accesses the Event Log containing information on network
events specific to the SNMP Bridge.
Alarms
The Alarms button accesses the Alarm View containing information on
alarms specific to the SNMP Bridge.
EFDMIM Diagnostic View
The initial EFDMIM Diagnostic View displays the following information:
Model Name
The user-defined name of the bridge model.
Network Address
The Internet Protocol (IP) address of the EFDMIM.
Bridge Name
The user-defined name of the bridge. The default is Cabletron Enet-FDDI
Bridge.
Total
The total number of network errors detected by the bridge.
Last Poll
The number of network errors since the last network poll.
9030368 E9
Diagnostic Views
5-3
EFDMIM Diagnostic View
Bridge Port Table
Bridge Port Table
This area of the EFDMIM Diagnostic View displays the current state of the
EFDMIM Ethernet and FDDI ports and the amount of packets containing
errors detected by each port.
Double-clicking on an entry in the State column accesses a port-specific Port
Performance View. (Refer to the Port Performance View section in Chapter 6.)
Double-clicking on an entry in the Error Pkts column accesses a rate graph
displaying the amount of error packets detected by the port over a given time
frame.
Network Errors
The Network Errors button accesses a rate graph displaying the total
number of network errors over a given timeframe. The total number of
network errors detected by the EFDMIM and the number of errors since the
last network poll are also displayed.
Events
The Events button accesses the Event Log containing information on network
events specific to the EFDMIM.
Alarms
The Alarms button accesses the Alarm View containing information on
alarms specific to the EFDMIM.
Diagnostic Views
5-4
Cabletron SNMP Bridges
Management Module Guide
Chapter 6
Performance Views
What is in this Chapter
This chapter describes the Performance View available for the Cabletron
SNMP Bridges. The Performance View provides data attributes for the traffic
on the network segments connected to the Cabletron bridge devices. This view
summarizes traffic flow in frames.
Accessing the Performance View
You can access the Performance View by highlighting the bridge icon and
selecting Performance from the Icon Subviews menu, or by double-clicking
on the Performance Graph of the Location View bridge icon (refer to
Figure 6-1).
9030368 E9
Performance Views
6-1
NB20E, NB25E and NB30 Performance View
Figure 6-1.
Accessing the Performance View
Double-click
10
1
.1
.01
Close
Navigate
Alarms
Performance
Notes...
Utilities
Zoom
Configuration
Diagnostic
Acknowledge
Flash Green Enabled
Application
Device
DevTop
Select Performance
NB20E, NB25E and NB30 Performance View
The SNMP Bridge Performance View provides the following information:
Model Name
The user-defined name of the bridge model.
Bridge Status
The status of the SNMP Bridge (ON-LINE, STAND BY, or DISABLED).
Counters
Force the SNMP Bridge to reset its counters by clicking on this button. (Not
available for NB30).
Bridge Name (NB30 only)
The user-defined name of the bridge. The default is CABLETRON REMOTE
BRIDGE for the NB30.
9030368 E9
Performance Views
6-2
EFDMIM Performance View
Bridge Uptime
The time, in days+hours:minutes:seconds, since the SNMP Bridge’s network
management software was last reinitialized.
Frames Forwarded
This button accesses a rate graph displaying the number of forwarded frames
over a given timeframe. Gauges below the button indicate the number of
frames forwarded by the SNMP Bridge. This includes the total number of
frames forwarded since the bridge was initialized, and the difference in
frames forwarded between the previous SpectroSERVER poll and the current
poll presented as both a total number and a dynamic horizontal bar gauge.
Frames Received
This button accesses a rate graph displaying the number of received frames
over a given time frame. Gauges below the button indicate the number of
frames received by the SNMP Bridge. This includes the total number of
frames received since the bridge was initialized, and the difference in frames
received between the previous SpectroSERVER poll and the current poll
presented as both a total number and a dynamic horizontal bar gauge.
Frames Filtered
This button accesses a rate graph displaying the number of filtered frames
over a given time frame. Gauges below the button indicate the number of
frames filtered by the SNMP Bridge. This includes the total number of filtered
frames since the bridge was initialized, and the difference in frames
forwarded between the previous SpectroSERVER poll and the current poll
presented as both a total number and a dynamic horizontal bar gauge.
EFDMIM Performance View
The EFDMIM Performance View provides the following information:
Model Name
The user-defined name of the bridge model.
Network Address
The Internet Protocol (IP) address of the EFDMIM.
Bridge Status
The status of the EFDMIM (ON-LINE, STAND BY, or DISABLED).
Receive Packets
The number of packets received by the EFDMIM. This includes the total
number of packets received since the EFDMIM was initialized, and the
difference in packets received between the previous SpectroSERVER poll and
the current poll presented as both a total number and a dynamic horizontal
bar gauge.
9030368 E9
Performance Views
6-3
EFDMIM Performance View
Packet Breakdown Pie Chart
Packet Breakdown Pie Chart
The Packet Breakdown color-coded pie chart displays the following network
traffic information for the EFDMIM:
Fltr Pkts
The total amount of packets received and filtered through the EFDMIM’s
ports.
Fwrd Pkts
The total amount of packets received and forwarded through the EFDMIM’s
ports.
Xmit Pkts
The total amount of packets transmitted on the EFDMIM ports.
Error Pkts
The total amount of packets containing errors detected by the EFDMIM ports.
Bridge Port Table
This area of the EFDMIM Performance View provides the total number of
each statistic displayed in the Packet Breakdown Pie Chart on a port by port
basis. Double-clicking on any column entry accesses the EFDMIM Port
Performance View. (Refer to the Port Performance View section of this
chapter.)
Columns in the Bridge Port Table can be sorted incrementally using the Sort
button as follows:
1. Single-click on the particular column label. The Sort button appears at
the top of the table.
2. Single-click on the Sort button to sort that particular column. Statistical
information is sorted in descending order.
The Bridge Port Table can be updated using the Update button. Columns
that have been sorted will remain sorted as the table is updated.
Performance Views
6-4
Cabletron SNMP Bridges
Management Module Guide
Port Performance View
Port Performance View
The Port Performance View provides statistical and current operating
information for each port on the SNMP Bridge or EFDMIM. This view is
accessed through the Application View HASPART Panel, the Device View or
the Device Topology View. The EFDMIM Port Performance View can also be
accessed from the EFDMIM Diagnostic or Performance View Bridge Port
Table.
To access the Port Performance View from the Device View, follow these steps:
1. Click in the Device View with the right mouse button to display the popup menu.
2. Select Port Performance View from the pop-up menu.
There are three ways to access the Port Performance View from the DevTop
View. One way to display a Port Performance View from the DevTop View is to
double-click on either one of the gauges of a port representation in the Port
Connections Panel. You can also display a Port Performance View from the
DevTop view by following these steps:
1. Click on one of the gauges of a port representation in the Port Connections
Panel with the right mouse button to display the pop-up menu.
2. Choose Performance from the pop-up menu.
Finally, you can display the Port Performance View from the DevTop View by
following these steps:
1. Click on one of the gauges of a port representation in the Port Connections
Panel to highlight the icon.
2. Choose Icon Subviews from the View menu.
3. Choose Performance from the Icon Subviews menu.
SNMP NB20E and NB25E Port Performance View
The SNMP Bridge Port Performance View provides the following information:
Model Name
The user-defined name of the bridge model.
Network Address
The Internet Protocol (IP) address of the SNMP Bridge.
Bridge Type
The type of bridge (e.g., NB20E or NB25E).
9030368 E9
Performance Views
6-5
Port Performance View
SNMP NB20E and NB25E Port Performance View
Port Name
The user-defined name assigned to the port. The default names are PORT_1
and PORT_2.
Port Status
The current port operating status. Table 6-16 provides a list of the status
messages.
Table 6-1.
Port Status Messages
Message
Description
OFF
Indicates that the port is not operational due to a failed
network interface chip associated with that port.
OK/SQE ON
Indicates that the port is communicating with the
network and the transceiver has SQE (signal quality
error) detection enabled.
OK/SQE OFF
Indicates that the port is communicating with the
network and the transceiver has SQE (signal quality
error) detection disabled.
CARRIER LOST
Indicates that communication with the network has
not been established or has been lost.
Frames Received
This button accesses a rate graph displaying the number of received frames
over a given time frame. Gauges below the button indicate the number of
frames received by the specified port. This includes the total number of frames
received by this port since the bridge was initialized, and the difference in
frames received between the previous SpectroSERVER poll and the current
poll presented as both a total number and a dynamic horizontal bar gauge.
Frames Discarded
This button accesses a rate graph displaying the number of discarded frames
over a given time frame. Gauges below the button indicate the number of
frames received by the specified port but discarded during the forwarding
process. This includes the total number of frames discarded by this port since
the bridge was initialized, and the difference in frames discarded between the
previous SpectroSERVER poll and the current poll presented as both a total
number and a dynamic horizontal bar gauge.
Performance Views
6-6
Cabletron SNMP Bridges
Management Module Guide
Port Performance View
SNMP NB20E and NB25E Port Performance View
Frames Forwarded
This button accesses a rate graph displaying the number of forwarded frames
over a given time frame. Gauges below the button indicate the number of
frames forwarded by the specified port. This includes the total number of
frames forwarded by this port since the bridge was initialized, and the
difference in frames forwarded between the previous SpectroSERVER poll
and the current poll presented as both a total number and a dynamic
horizontal bar gauge.
Frames Dscrd No Buff
This button accesses a rate graph displaying the number of received frames
over a given time frame. Gauges below the button indicate the number of
frames discarded by the specified port due to a lack of buffer space. This
includes the total number of frames discarded by the port since the bridge was
initialized, and the difference in frames discarded between the previous
SpectroSERVER poll and the current poll presented as both a total number
and a dynamic horizontal bar gauge.
Frames DiscrdTimeout
This button accesses a rate graph displaying the number of discarded frames
over a given time frame. Gauges below the button indicate the number of
frames that were intended for forwarding by the specified port but were
discarded because the maximum time allowed for transmission was exceeded.
This includes the total number of frames discarded by the port since the
bridge was initialized, and the difference in frames discarded between the
previous SpectroSERVER poll and the current poll presented as both a total
number and a dynamic horizontal bar gauge.
Two additional buttons are available from the SNMP NB20E and NB25E Port
Performance View.
Port Diagnostics
The Port Diagnostics button accesses the Port Diagnostic View. The Port
Diagnostic View provides the following information:
Model Name
The user-defined name of the bridge model.
Network Address
The Internet Protocol (IP) address of the Bridge.
Bridge Type
The type of bridge (e.g., NB20E or NB25E.)
9030368 E9
Performance Views
6-7
Port Performance View
SNMP NB20E and NB25E Port Performance View
Giants
This button accesses a rate graph displaying the number of giant packets over
a given time frame. Fields to each side of the button indicate the amount of
giant packets that could not be transmitted by the port as both a total since
the bridge was initialized, and the total since the last poll. A giant packet
exceeds 1518 bytes not including preamble.
Collisions
This button accesses a rate graph displaying the number of port collisions over
a given time frame. Fields to each side of the button indicate the total amount
of collisions detected by the port as both a total since the bridge was
initialized, and the total since the last poll.
Xmits Aborted
Indicates the number of attempted transmissions that have been aborted due
to excessive collisions as both a total since the bridge was initialized, and the
total since the last poll. Before SPECTRUM aborts transmission, over sixteen
attempts are made to send the packet.
OOW Collisions
Indicates the amount of collisions out of the standard window (51.2µs) due to a
network problem as both a total since the bridge was initialized, and the total
since the last poll.
CRC Errors
Indicates the amount of packets received by the port with bad Cyclical
Redundancy Checks (CRC) as both a total since the bridge was initialized, and
the total since the last poll.
Alignment Errors
Indicates the amount of misaligned packets detected by the port as both a
total since the bridge was initialized, and the total since the last poll.
Port Configuration
The Port Configuration button accesses the Port Configuration View. The
Port Configuration View provides the following information:
Model Name
The user-defined name of the bridge model.
Network Address
The Internet Protocol (IP) address of the SNMP Bridge.
Bridge Type
The type of bridge (e.g., NB20E or NB25E).
Port Number
The number of the port.
Performance Views
6-8
Cabletron SNMP Bridges
Management Module Guide
Port Performance View
EFDMIM Port Performance View
Port Name
The user-defined name assigned to the port. The default names are PORT_1
and PORT_2.
Port Address
The Ethernet address of the port.
Port Type
The IEEE specification of the port (e.g., 802.3).
Port Priority
The part of the port identifier used with the spanning tree algorithm in
determining which port in a LAN segment has priority.
Port Path Cost
The contributory cost of the port to the total cost of the path when the specific
port is the root port. The allowable range is from 1 to 65,535.
Port to Root Bridge Cost
The cost of the path of this port to the root bridge on the network.
LAN Port
The SNMP Bridge port that is designated port for communication with the
LAN.
Topology Change ACK
A read-only indicator button displaying the value of the topology change
acknowledgment flag in the next configuration BPDU to be transmitted on
this port.
Port Network Name
The name of the network segment connected to the port. The default names
are LAN-1 and LAN-2.
Port Root Designator
The identification of the root bridge on the network.
EFDMIM Port Performance View
The EFDMIM Port Performance View provides the following information:
Model Name
The user-defined name of the bridge model.
Network Address
The Internet Protocol (IP) address of the EFDMIM.
Port Number
The number of the selected port.
9030368 E9
Performance Views
6-9
Port Performance View
EFDMIM Port Performance View
Port Status
A read-only indicator button displaying the current operational state of the
port (UP, DOWN, or TESTING).
Admin State
The required operational state of the EFDMIM (UP, DOWN, or TESTING)
selectable through this button and reflected in the Port Status read-only
indicator button.
Receive Packets
The number of packets received by the EFDMIM. This includes the total
number of packets received since the EFDMIM was initialized, and the
difference in packets received between the previous SpectroSERVER poll and
the current poll presented as both a total number and a dynamic horizontal
bar gauge.
Port Packet Breakdown Pie Chart
The Port Packet Breakdown color-coded pie chart displays the following
network traffic information for the specific port:
Fltr Pkts
The total amount of packets received and filtered through the port.
Fwrd Pkts
The total amount of packets received and forwarded through the port.
Xmit Pkts
The total amount of packets transmitted on the port.
Error Pkts
The total amount of packets containing errors detected by the port.
No additional buttons or subviews are available from the EFDMIM Port
Performance View.
Performance Views
6-10
Cabletron SNMP Bridges
Management Module Guide
Port Performance View
SNMP NB30 Local Port Performance View
SNMP NB30 Local Port Performance View
The SNMP NB30 Local Port Performance View provides the following
information:
Model Name
The user-defined name of the bridge model.
Network Address
The Internet Protocol (IP) address of the SNMP Bridge.
Bridge Type
The type of bridge (e.g., NB30).
Bridge Status
The status of bridge (ON-LINE, STAND BY, or DISABLED).
Bridge Uptime
The time, in days+hours:minutes:seconds, since the SNMP Bridge’s network
management software was last reinitialized.
Frames Received
This button accesses a rate graph displaying the number of received frames
over a given time frame. Gauges below the button indicate the number of
frames received by the specified port. This includes the total number of frames
received by this port since the bridge was initialized, and the difference in
frames received between the previous SpectroSERVER poll and the current
poll presented as both a total number and a dynamic horizontal bar gauge.
Frames Filtered
This button accesses a rate graph displaying the number of filtered frames
over a given time frame. Gauges below the button indicate the number of
frames filtered by the specified port. This includes the total number of frames
filtered by this port since the bridge was initialized, and the difference in
frames filtered between the previous SpectroSERVER poll and the current
poll presented as both a total number and a dynamic horizontal bar gauge.
Frames Forwarded
This button accesses a rate graph displaying the number of forwarded frames
over a given time frame. Gauges below the button indicate the number of
frames forwarded by the specified port. This includes the total number of
frames forwarded by this port since the bridge was initialized, and the
difference in frames forwarded between the previous SpectroSERVER poll
and the current poll presented as both a total number and a dynamic
horizontal bar gauge.
9030368 E9
Performance Views
6-11
Port Performance View
SNMP NB30 Local Port Performance View
Discarded – No Buffer
This button accesses a rate graph displaying the number of received frames
over a given time frame. Gauges below the button indicate the number of
frames discarded by the specified port due to a lack of buffer space. This
includes the total number of frames discarded by the port since the bridge was
initialized, and the difference in frames discarded between the previous
SpectroSERVER poll and the current poll presented as both a total number
and a dynamic horizontal bar gauge.
Discarded – Timeout
This button accesses a rate graph displaying the number of discarded frames
over a given time frame. Gauges below the button indicate the number of
frames that were intended for forwarding by the specified port but were
discarded because the maximum time allowed for transmission was exceeded.
This includes the total number of frames discarded by the port since the
bridge was initialized, and the difference in frames discarded between the
previous SpectroSERVER poll and the current poll presented as both a total
number and a dynamic horizontal bar gauge.
Two additional buttons are available from the SNMP NB30 Local Port
Performance View.
Port Diagnostics
The Port Diagnostics button accesses the Port Diagnostic View. The Port
Diagnostic View provides the following information:
Model Name
The user-defined name of the bridge model.
Network Address
The Internet Protocol (IP) address of the Bridge.
Bridge Type
The type of bridge (e.g., NB30).
Bridge Uptime
The time, in days+hours:minutes:seconds, since the SNMP Bridge’s network
management software was last reinitialized.
Performance Views
6-12
Cabletron SNMP Bridges
Management Module Guide
Port Performance View
SNMP NB30 Local Port Performance View
Giants
This button accesses a rate graph displaying the number of giant packets over
a given time frame. Fields to each side of the button indicate the amount of
giant packets that could not be transmitted by the port as both a total since
the bridge was initialized, and the total since the last poll. A giant packet
exceeds 1518 bytes not including preamble.
Collisions
This button accesses a rate graph displaying the number of port collisions over
a given time frame. Fields to each side of the button indicate the total amount
of collisions detected by the port as both a total since the bridge was
initialized, and the total since the last poll.
Xmits Aborted
Indicates the number of attempted transmissions that have been aborted due
to excessive collisions as both a total since the bridge was initialized, and the
total since the last poll. Before SPECTRUM aborts transmission, over sixteen
attempts are made to send the packet.
OOW Collisions
Indicates the amount of collisions out of the standard window (51.2µs) due to a
network problem as both a total since the bridge was initialized, and the total
since the last poll.
CRC Errors
Indicates the amount of packets received by the port with bad Cyclical
Redundancy Checks (CRC) as both a total since the bridge was initialized, and
the total since the last poll.
Alignment Errors
Indicates the amount of misaligned packets detected by the port as both a
total since the bridge was initialized, and the total since the last poll.
Port Configuration
The Port Configuration button accesses the Port Configuration View. The
Port Configuration View provides the following information:
Model Name
The user-defined name of the bridge model.
Network Address
The Internet Protocol (IP) address of the SNMP Bridge.
Bridge Status
The status of the bridge (ON-LINE, STAND BY, or DISABLED).
Bridge Name
The name of the bridge (e.g., NB30).
9030368 E9
Performance Views
6-13
Port Performance View
SNMP NB30 Local Port Performance View
Bridge Type
The type of bridge (e.g., CABLETRON REMOTE BRIDGE).
Bridge ID
The Ethernet (MMAC) address of the bridge.
Port Name
The user-defined name assigned to each local port. The default names are
PORT_1 and PORT_2.
Port Status
The status of each local port (ON-LINE, STAND BY, or DISABLED).
Port Type
The IEEE specification of each local port (e.g., 802.3).
Port Address
The Ethernet address of each local port.
Network Name
The name of the network segment connected to the port. The default names
are LAN-1 and LAN-2.
Max Retries
The maximum number of retries for the redundant port algorithm on the
NB30. Valid range is 2-99 retries.
Polling Interval
The time, in seconds, between SpectroSERVER polls of the network for a
specific model.
Polling Address
The polling address that will be used by the redundant port algorithm on the
NB30.
Redundancy Checking
The state of the Redundancy Enable Flag (Valid options are Enabled or
Disabled).
Active Local Port
The number of the port that is acting as the online Ethernet port on the NB30.
Default Local Port
The number of the port that is default Ethernet port on the NB30.
One additional button is available from the NB30 Local Port Configuration
View.
Topology Settings
The Topology Settings button accesses the Port Topology Settings View.
Table 6-2 provides a list of the Port Topology Settings View fields.
Performance Views
6-14
Cabletron SNMP Bridges
Management Module Guide
Port Performance View
SNMP NB30 Local Port Performance View
Table 6-2.
Port Topology Settings View Fields
Field
!
Description
Model Name
The user-defined name of the bridge model.
Bridge Name
The name of the NB30. Default is CABLETRON
REMOTE BRIDGE.
Bridge ID
The Ethernet address of the bridge.
Network Address
The Internet Protocol (IP) address of the SNMP
Bridge.
Bridge Type
The type of bridge (e.g., NB30).
Bridge Status
The status of the bridge (ON_LINE or STAND BY).
Port Priority
The part of the port identifier used with the spanning
tree algorithm in determining which port in a LAN
segment has priority.
Port State
The current state of the port. (Possible values are
DISABLED, LISTENING, LEARNING,
FORWARDING, and BLOCKING).
Port Path Cost
The contributory cost of the port to the total cost of the
path when the specific port is the root port. The
allowable range is from 1 to 65,535.
Designated Root
The bridge identifier of the bridge recorded as the root
in Configuration BPDUs transmitted by the
Designated Bridge for the segment to which this port is
attached. This value is used as the Root Identifier
parameter in all Bridge Configuration PDUs originated
by this node.
Designated Bridge
The Bridge ID of the bridge that is assumed to be the
root bridge on the network.
Designated Cost
The cost of the path of this port to the root bridge on
the network.
Designated Port
The SNMP Bridge port that is designated port for
communication with the LAN.
Topology Change ACK
A read-only indicator button displaying the value of the
topology change acknowledgment flag in the next
configuration BPDU to be transmitted on this port.
Do not use these controls if you have not configured the NB30 with redundant
port hardware. Enabling redundancy or changing the active port could cause
loss of contact with the bridge.
CAUTION
9030368 E9
Performance Views
6-15
Port Performance View
SNMP NB30 Remote Port Performance View
SNMP NB30 Remote Port Performance View
The NB30 Remote Port Performance View provides the following information:
Model Name
The user-defined name of the bridge model.
Network Address
The Internet Protocol (IP) address of the NB30.
Port Type
The type of remote port, (DSX-1, V35, or Rs449) and the current setting for
the Frame Format Switch (ESF or D4). For more information on setting the
Frame Format Switch, refer to the NB30 Remote Ethernet Bridge User’s
Manual.
Port Name
The user-defined name assigned to the port. The default name is REMOTE
PORT.
Port Status
The current port operating status. Status messages are as follows:
NO EXT CLOCK
DCE NOT READY / NO DM
DCE NOT READY / NO CTS
LINK OK / DCE READY
NET LOOP / RED ALARM
REM LOOP / RED ALARM
NORMAL / RED ALARM
NET LOOP / YELLOW ALARM
REM LOOP / YELLOW ALARM
NORMAL / YELLOW ALARM
NET LOOP / LINK OK
REM LOOP / LINK OK
NORMAL / LINK OK
NET LOOP / LINK LOST
REM LOOP / LINK LOST
NORMAL / LINK LOST
For definitions of status messages refer to the NB30 Remote Ethernet Bridge
User’s Manual.
Frames Received
This button accesses a rate graph displaying the number of received frames
over a given time frame. Gauges below the button indicate the number of
frames received by the specified port. This includes the total number of frames
received by this port since the bridge was initialized, and the difference in
frames received between the previous SpectroSERVER poll and the current
poll presented as both a total number and a dynamic horizontal bar gauge.
Performance Views
6-16
Cabletron SNMP Bridges
Management Module Guide
Port Performance View
SNMP NB30 Remote Port Performance View
Frames Forwarded
This button accesses a rate graph displaying the number of discarded frames
over a given time frame. Gauges below the button indicate the number of
frames received by the specified port but not discarded during the forwarding
process. This includes the total number of frames not discarded by this port
since the bridge was initialized, and the difference in frames discarded
between the previous SpectroSERVER poll and the current poll presented as
both a total number and a dynamic horizontal bar gauge.
Discarded – No Buffer
This button accesses a rate graph displaying the number of received frames
over a given time frame. Gauges below the button indicate the number of
frames discarded by the specified port due to a lack of buffer space. This
includes the total number of frames discarded by the port for lack of buffer
space since the bridge was initialized, and the difference in frames discarded
between the previous SpectroSERVER poll and the current poll presented as
both a total number and a dynamic horizontal bar gauge.
Discarded – Timeout
This button accesses a rate graph displaying the number of discarded frames
over a given time frame. Gauges below the button indicate the number of
frames that were intended for forwarding by the specified port but were
discarded because the maximum time allowed for transmission was exceeded.
This includes the total number of frames discarded by the port due to timeout
since the bridge was initialized, and the difference in frames discarded
between the previous SpectroSERVER poll and the current poll presented as
both a total number and a dynamic horizontal bar gauge.
Discarded – Framing
This button accesses a rate graph displaying the number of received frames
over a given time frame. Gauges below the button indicate the number of
frames discarded by the specified port due to a framing error. This includes
the total number of frames discarded by the port due to framing errors since
the bridge was initialized, and the difference in frames discarded between the
previous SpectroSERVER poll and the current poll presented as both a total
number and a dynamic horizontal bar gauge.
Discarded – CRC
This button accesses a rate graph displaying the number of received frames
over a given time frame. Gauges below the button indicate the number of
frames discarded by the specified port due to a Cyclical Redundancy Check
error. This includes the total number of frames discarded by the port due to
CRC errors since the bridge was initialized, and the difference in frames
discarded between the previous SpectroSERVER poll and the current poll
presented as both a total number and a dynamic horizontal bar gauge.
9030368 E9
Performance Views
6-17
Port Performance View
SNMP NB30 Remote Port Performance View
Two additional buttons are available from the NB30 Remote Port Performance
View, as follows:
Port Diagnostics
The Port Diagnostics button accesses the DSX-1 Loopback Test View. The
DSX-1 Loopback Test View provides the following information:
Bridge Name
The name of the NB30. Default is CABLETRON REMOTE BRIDGE.
Network Address
The Internet Protocol (IP) address of the NB30.
Bridge Status
The status of the bridge (ON_LINE or STAND BY).
Testing Status
The current port testing status (Not_Testing, Testing, Network, Passed, or
Failed).
Loop Up
Single-click on this button to enable this option. This starts a loop back test.
Loop Down
Single-click on this button to enable this option. This stops loop back testing
and returns the device to service.
Test Pattern
Select one of the valid parameters for this field, (Alternating_1/0s, All_1s,
All_0s, or Incrementing_Data) by clicking on this button and dragging to the
selection.
!
CAUTION
Enabling a loop back test on a remote NB30 will make the device nonresponsive to SNMP-Based commands, and you will lose contact. Loop back
testing should ONLY be enabled on LOCAL NB30 devices. You should always
be certain which NB30 is local and which is remote.
Port Configuration
The Port Configuration button accesses the DSX-1 Port Configuration View.
The DSX-1 Port Configuration View provides the following information:
Performance Views
6-18
Cabletron SNMP Bridges
Management Module Guide
Port Performance View
SNMP NB30 Remote Port Performance View
Port Name
The name of the NB30 port. The default name is REMOTE PORT.
Network Name
The name of the network segment connected to the port.
Port Type
The type of remote port, (DSX-1) and the current setting for the Frame
Format Switch (ESF or D4). For more information on setting the Frame
Format Switch refer to the NB30 Remote Ethernet Bridge User’s Manual.
Bridge Status
The status of the bridge (ON_LINE or STAND BY).
Port Status
The current port operating status. Status messages are as follows:
NO EXT CLOCK
DCE NOT READY / NO DM
DCE NOT READY / NO CTS
LINK OK / DCE READY
NET LOOP / RED ALARM
REM LOOP / RED ALARM
NORMAL / RED ALARM
NET LOOP / YELLOW ALARM
REM LOOP / YELLOW ALARM
NORMAL / YELLOW ALARM
NET LOOP / LINK OK
REM LOOP / LINK OK
NORMAL / LINK OK
NET LOOP / LINK LOST
REM LOOP / LINK LOST
NORMAL / LINK LOST
For definitions of status messages refer to the NB30 Remote Ethernet Bridge
User’s Manual.
Channel 1 through 24
Toggle this parameter to enable or disable the selected channel.
NOTE
9030368 E9
The Port Diagnostics and Port Configuration buttons are not available for the
V.35 and RS449 remote ports.
Performance Views
6-19
Port Performance View
SNMP NB30 Remote Port Performance View
!
CAUTION
Performance Views
6-20
Be certain that both NB30 bridges are configured to use the same channels.
When changing the channels used, always change the LOCAL NB30 first, and
then change the REMOTE NB30 to correspond to the new configuration for
the local device.
Cabletron SNMP Bridges
Management Module Guide
Management Module Guide for the Cabletron Systems SNMP Bridges
Chapter 7
Event and Alarm Messages
What is in this Chapter
This chapter describes the events and alarms that Cabletron SNMP Bridge
devices generate. Additionally, this appendix notes if an event is mapped to an
identical alarm message, and provides any probable cause messages
corresponding to these alarms.
The events and alarms generated by the model type designations listed below
are described in the sections that follow:
• SNMP NB20E
• SNMP NB25E
• NB30
Events and alarms originate as generic Simple Network Management
Protocol (SNMP) traps sent from the physical bridge device. SPECTRUM
translates these traps, or unsolicited messages, as events and displays them
in the Event Log. The EFDMIMdoes not support traps. For more information
on specific traps generated by each device, refer to RFC 1213 available
through the Internet system. Also refer to the Management Information Base
(MIB) documentation for each specific bridge device.
NOTE
9030368 E9
Each event/alarm listed below includes: the event code, the event/alarm
message, followed by a brief description of the event/alarm, an alarm
mapping indicator, and any probable cause message for the mapped alarm.
When variable data is inserted in a message, it is indicated by a {v}. Data in
parenthesis will be replaced by the named variable followed by a specific
value, without the parenthesis.
Event and Alarm Messages
7-1
NB20E, NB25E, and NB30 Events and Alarms
NB20E, NB25E, and NB30 Events and Alarms
Table 7-1 provides the events and alarms supported by SPECTRUM for the
SNMP NB20E, and SNMP NB25E bridge devices. For a specific list of events
that have been generated by a specific hub device, click on a bridge device
icon, select New View from the View menu, and select the Performance
option. When the Performance View appears, press the Events button to
bring up the Event View displaying all the events that have occurred on that
device. The event message files are located in the following directory:
/SPECTRUM Directory Path/SG-Support/CsEvFormat
The alarm message files are located in the following directory:
/SPECTRUM Directory Path/SG-Support/CsPCause
Table 7-1.
Events and Alarms
Event Message
00010203
Probable Cause Message
00010203
The model created is not the same type as The model created is not the same type
the device. Model type = {v}, Name = {v},
as the device. (This is a SPECTRUM
User = {v}.
Intelligence alarm and is supported by
the EFDMIM.)
00010306
00010306
A(n) {v} device, named {v}, has been cold
started.
Not Applicable.
00010307
00010307
A(n) {v} device, named {v}, has been warm Not Applicable.
started.
00010308
00010308
A(n) {v} device, named {v}, has detected a
Communication Link Down.
Communication link is down.
00010309
00010309
A(n) {v} device, named {v}, has detected a
Communication Link Up.
Not Applicable.
0001030a
0001030a
A(n) {v} device, named {v}, has detected an Authorization failure. Other user is
Authorization Failure.
trying to connect to device with an
invalid Community String.
Event and Alarm Messages
7-2
Cabletron SNMP Bridges
Management Module Guide
NB20E, NB25E, and NB30 Events and Alarms
Table 7-1.
Events and Alarms (Continued)
Event Message
0001030b
Probable Cause Message
0001030b
A(n) {v} device, named {v}, has detected an Lost contact with EGP Neighbor.
EGP Neighbor or Loss. EGP Neighbor IP
address is {0 1}.
00010401
00010401
Device {v} of type {v} is created with an IP DUPLICATE IP ADDRESS
address already used by another model.
The model has the same IP address as
that of some other Model. (This is a
SPECTRUM Intelligence alarm and is
supported by the EFDMIM.)
00010402
00010402
Device {v} of type {v} is created with a
physical (Mac) address already used by
another model.
DUPLICATE PHYSICAL ADDRESS
00010625
00010625
The model has the same Physical
address (Mac address) as that of some
other model. (This is a SPECTRUM
Intelligence alarm and is supported by
the EFDMIM.)
Network configuration changes reported Not Applicable.
by {v} (name - {v}). {v} (name - {v}) status is
now {v} (Instance ID {v}).
00010626
00010626
Device configuration change reported by
{v} (name - {v}). Acquired database of {v}
(name - {v}) is full.
Not Applicable.
00010701
00010701
Alarm number {v} generated for device {v} Not Applicable.
of type {v}. Current condition is {v}.
(This is a SPECTRUM Intelligence
alarm and is supported by the NB30.)
9030368 E9
Event and Alarm Messages
7-3
NB20E, NB25E, and NB30 Events and Alarms
Event and Alarm Messages
7-4
Cabletron SNMP Bridges
Management Module Guide
Index
A
Accessing 2-9
Accessing the
Configuration View 4-1
Device View 2-1
Performance View 6-1
Acquired
Database 3-4
Information View 3-7
Table Button 3-7
Entry 3-8, 3-9
Active Local Port 6-14
Actual Representation 2-9
Add
Entry 3-9
New Database Entry 3-5, 3-7, 3-9
Additional
Bridge Information Button 4-4
Bridge Information View 4-4
Configuration Button 4-9
Admin State 6-10
Alarm
Log 5-1
Messages 7-1
View 5-3, 5-4
Alarms 2-30, 2-31
Button 5-3, 5-4
Align_Errors 2-13, 2-14, 2-18, 2-19
Alignment Errors 6-8, 6-13
All_0s 6-18
All_1s 6-18
Alternating_1/0s 6-18
A-Ports 3-11
Application
View 2-31, 3-1
BdgCSINB30 1-1
BLOCKING 6-15
State 4-7
Board Name 2-12, 2-16
BPDU 4-4, 4-12, 6-9
B-Ports 3-11
Bridge
Address 4-9
Configuration 2-1
PDUs 6-15
ID 4-5, 6-14, 6-15
Location 4-4, 4-9
Mode 4-10
Name 4-3, 4-9, 5-2, 5-3, 6-2, 6-13, 6-15,
6-18
Port Table 5-4, 6-4
Priority 4-4, 4-5
Protocol Data Unit 4-4, 4-12
Restart 4-8
Settings 4-8
Setup
Information Button 4-5
Status 4-12, 6-2, 6-3, 6-11, 6-13, 6-15,
6-18, 6-19
Control 4-7, 4-12
Type 4-3, 5-2, 6-5, 6-7, 6-8, 6-11, 6-12,
6-14, 6-15
Uptime 4-9, 6-3, 6-11, 6-12
Bridge/Root Information
Button 4-4
View 4-4
Broadcasts 4-6
Bypass 4-12
Attached 4-10
Stuck 4-10
Bytes 2-13, 2-18
B
Bdg 1-1
Bdg_CSI
EFDMIM 1-2, 2-31
SNB20 1-1
9030368 E9
1
C
Cabletron
Enet-FDDI Bridge 4-9, 5-3
CABLETRON REMOTE 4-3
BRIDGE 5-2, 6-2, 6-14, 6-15, 6-18
Canonical
Format 4-10
Representation 3-11
CARRIER LOST 6-6
Case
#1 2-30
#2 2-30
CFM State 4-10
Changing
MIM Representations 2-25
On The Entire Hub 2-28
Using The Menu Bar 2-28
Using The Mouse 2-29
Channel 1 Through 24 6-19
Claim/Beacon Process 3-12, 4-10, 4-11
Clear 2-30, 2-31
To Send 2-7
Clearing Duplicate EFDMIM Address
Alarms 2-29
COL 2-23
Collision 2-24
Button 6-8, 6-13
Present 2-4, 2-8
Rate 2-23
Comments xiii
Community Name 4-3, 4-8
Concentrator 3-11
Configuration
BPDUs 4-7, 6-15
Changes 2-2, 2-5
Management State 4-10
View 2-31
Control Button 4-7, 4-12
Conventions xii
Copy 2-27
Cost Path 4-4
Counters 4-8, 4-13, 6-2
CP 2-4, 2-8
CRC 2-14, 2-18, 6-8, 6-13
Errors 2-13, 2-14, 2-18, 2-19, 6-8, 6-13
CsEvFormat 7-2
CSIBrdg_LPort $ 3-11
CSIBrdgPrtDSX 3-11
CSIBrdgPrtV35 $ 3-11
Index
2
CSIRptr Port 2-26
CsPCause 7-2
CTS 2-7
Current
Bridge Status 4-7
Entries 3-5
Operating Information 6-5
Cyclical Redundancy Checks 2-14, 2-18, 68, 6-13
D
D4 6-19
Frame Format 4-6
Data
Attributes 6-1
Field 3-10
Mode 2-7
Control Signal Switch 4-6
Path 4-4
Database
Entries 3-4, 3-5
Information 3-1
DCE 2-7
NOT READY / NO CTS 6-16, 6-19
NOT READY / NO DM 6-16, 6-19
DEC 4-5, 4-6
BPDU 4-12
LAN Bridge 100 Environment 4-5, 4-6
Default
Local Port 6-14
Settings 4-8
Delete
Filter 3-10
Special Database Filter View 3-10
Designated
Bridge 6-15
Cost 6-15
Port 6-15
Root 6-15
Destination Address 3-10
Detect 3-12, 4-11
Device
Actions 1-1
Associations 1-1
Attributes 1-1
Configuration 4-3, 4-9
Models 1-1
Type 2-15
View 2-1
Cabletron SNMP Bridges
Management Module Guide
D (continued)
Diagnostic 2-31
View 2-31
Diagnostics 4-12
Directed 3-12, 4-11
Beacons 3-12, 4-11
Disabled 3-10, 4-6, 4-7, 4-12, 5-2, 6-2, 6-3,
6-11, 6-13, 6-14, 6-15
Discarded
CRC Button 6-17
Framing Button 6-17
No Buffer Button 6-12, 6-17
Timeout Button 6-12, 6-17
Display
Logical MIMs 2-28
Physical MIMs 2-28
DM 2-7
Down 6-10
Downstream
MAC 4-10
Neighbor 4-10
DSX-1 6-19
Loopback Test View 6-18
Port Configuration View 6-18
Duplicate Address
Alarm 2-29
Dynamic 3-4, 3-7, 3-9
Entries 3-4
Entry Age Lmt 3-4
E
EFD_If_Port # 3-13
EFDMIM 1-2
Configuring in
an IRM2 or IRM3 2-26
Control View 4-12
Copying into Location or Topology
View 2-27
Generic Views 2-31
LEDs 2-22, 2-25
Logical MIM Representation 2-16
Physical MIM Representation 2-19
Port Performance View 3-13, 6-4
Enable/Disable Filter 3-10
Enabled 3-10, 4-6, 4-7, 6-14
Encapsulating Bridge 4-10, 4-12
Entry Type 3-7, 3-9
Erase 3-4, 3-5
9030368 E9
Error
Attribute 5-1
Count 4-13
Data 2-2, 2-5, 2-9
Pkts 5-4, 6-4, 6-10
ESF 6-19
Frame Format 4-6
Ethernet 1-2, 2-8, 4-4, 4-5, 4-9, 4-12, 5-4, 69, 6-14
Bridge 4-3, 5-2
Interface LEDs 2-23
Port 2-8, 2-26
Performance View 3-11
Event
Log 5-1, 5-3, 5-4, 7-1
Messages 7-1
Events
Button 5-3, 5-4
F
Failed 6-18
FALSE 4-10
FDDI 1-2, 4-9
Interface LEDs 2-22
Port 4-10, 5-4
Ring 2-22, 3-11, 4-11
Oscillation 4-9
Token 3-11
Filter 3-7, 3-9
by Data Field 3-10
by Type Field 3-10
Status 3-10
Filtering 3-5, 3-7, 3-9
Database 3-1
Information 3-9
Options 3-5, 3-7, 3-9
Firmware 4-4
Version 4-4, 4-5, 4-9
Fltr Pkts 6-4, 6-10
Forward
Broadcast 2-8
Delay 4-7
and Hello Information View 4-7
Parm 4-7
ForwardBroad 4-12
Forwarding 6-15
State 4-7
Index
3
F (continued)
I
Frame
Count 4-13
Format Switch 6-19
Rate 2-23
Type 3-10
Frames 2-13, 2-18, 2-24
Discarded Button 6-6
Discrd Timeout Button 6-7
Dscrd No Buff Button 6-7
Filtered Button 6-3, 6-11
Forwarded Button 6-3, 6-7, 6-11, 6-17
Received
Button 6-3, 6-6, 6-11, 6-16
Front Panels 2-4, 2-7
Fwd Dly & Hello Information Button 4-7
Fwrd Pkts 6-4, 6-10
Icon
Manager 2-2
Incrementing_Data 6-18
Internal
Loop Back Test 2-4, 2-7, 2-8
Port 2-26
Internet 7-1
Protocol 4-3, 4-8, 4-9, 5-3, 6-3, 6-5, 6-7,
6-8, 6-9, 6-11, 6-12, 6-13, 6-15,
6-16, 6-18
Introduction 1-1
IP 2-25, 4-3, 4-8, 4-9, 5-3, 6-3, 6-5, 6-7, 6-8,
6-9, 6-11, 6-12, 6-13, 6-15, 6-16, 6-18
IRBM 2-9
IRM 2-9
Cabletron Proprietary 2-23
IRM2 2-9
IRM3 2-9
Isolated 3-12, 4-10, 4-11
G
Gauge
Information 2-16, 2-26
Mode Button 2-19, 2-24
General LEDs 2-22
Generic
Views 2-2, 2-9
Getting Help xii
Giant Packets 2-14, 2-18, 6-8, 6-13
Giants 2-13, 2-14, 2-18, 2-19
Button 6-8, 6-13
Go
Back 2-26
Logical 2-28
H
Hardware Type 3-10
HASPART
Panel 3-3, 3-11, 3-13
Hello Time Parm 4-7
Help xiii
Hold Time 4-4
Horizontal Bar Gauge 2-15, 2-18, 2-23, 6-3,
6-6, 6-7, 6-10, 6-11, 6-16, 6-17
Hub Chassis 2-9
Index
4
J
Jumper Settings 4-12
L
LAN
Port 6-9
LAN-1 6-9, 6-14
LAN-2 6-9, 6-14
LANVIEW LEDs 2-22
Last Poll 5-3
LEARNING 6-15
State 4-7
LED Definitions 2-4, 2-7
Lin Button 2-23
Linear Scale 2-23
LINK
A/B 2-22
OK 2-7
OK / DCE READY 6-16, 6-19
LISTENING 6-15
State 4-7
Local 4-4, 4-9
NB30 2-7
Port 3-1
Location 2-15
Log Button 2-23
Cabletron SNMP Bridges
Management Module Guide
L (continued)
Logarithmic Scale 2-23
Logical
Connection Pipe 2-26
Gauges Button 2-18, 2-24
Representation 2-26
Loop
Back Test 6-18
Down 6-18
Up 6-18
Lost
Count 4-13
M
MAC Address 3-11
Management
Information Base 1-1, 7-1
Master
Phys 3-11
Ports 3-11
Max
Number of Filters 3-3
Retries 6-14
Maximum Entries 3-4, 3-5
Menu Bar Access 2-1
Message
DUPLICATE IP ADDRESS 2-30, 2-31
DUPLICATE-PHYSICAL ADDRESS 231
MIB 1-1, 7-1
MIM
Configuration View 2-25
Diagnostic View 2-30
Misaligned Packets 2-14, 2-18, 6-8, 6-13
MMAC 6-14
Backplane 2-23
Device
Panel 2-15
Statistics Panel 2-23
Interface LEDs 2-23
Mode 4-12
Model 1-1
Configuration 4-3, 4-8
Name 3-3, 3-7, 3-9, 3-11, 4-3, 4-4, 4-5,
4-6, 4-7, 4-8, 4-9, 4-12, 5-2, 5-3,
6-2, 6-3, 6-5, 6-7, 6-8, 6-9, 6-11,
6-12, 6-13, 6-15, 6-16
Type 3-3, 3-11
9030368 E9
Monitoring
Point 2-15
Multi-Attribute Line Graph 2-23
My Duplicate 3-12
N
Name 2-15
NB20E 1-1
NB25E 1-1
NB30
Front Panel Switches 2-8
LEDs 2-7
Local Port Performance View 6-11
Remote Port Performance View 6-16
T1 Remote Bridge 1-1
Net Address 2-15
NET LOOP
LINK
LOST 6-16, 6-19
OK 6-16, 6-19
RED ALARM 6-16, 6-19
YELLOW ALARM 6-16, 6-19
Network 6-18
Address 3-3, 3-11, 4-3, 4-8, 4-9, 4-12, 53, 6-3, 6-5, 6-7, 6-8, 6-9, 6-11, 612, 6-13, 6-15, 6-16, 6-18
Configuration 2-2, 2-5, 2-9
Information 4-1
Errors 5-1
Button 5-3, 5-4
Interface Chip 6-6
Manager 3-4
Name 6-14, 6-19
Protocol Traffic 3-1
Segment 3-3, 5-1, 6-1
Traffic 6-10
Networking Software 3-10
New
View 7-2
Next Available Filter 3-9
NLNK 2-12, 2-16
NO EXT CLOCK 6-16, 6-19
No Link 2-12, 2-16
Node 3-11
Class 3-11
Non
Op 3-12, 4-11
Dup 3-12, 4-11
NonMaster 3-11
Index
5
N (continued)
NORMAL
LINK
LOST 6-16, 6-19
OK 6-16, 6-19
RED ALARM 6-16, 6-19
YELLOW ALARM 6-16, 6-19
Not_Testing 6-18
Notice i
Number of
Filters 3-3
Ports 4-4
Restarts 4-5
O
OFF 2-12, 2-16, 6-6
OK/SQE
OFF 6-6
ON 6-6
ON 2-12, 2-16
NET 2-22
ON-LINE 2-4, 4-7, 4-12, 5-2, 6-2, 6-3, 6-11,
6-13, 6-14, 6-15, 6-18, 6-19
OOW Collisions 6-8, 6-13
Optical
Bypass 4-12
Switch 4-10
Signal 2-22
Oscillations 4-10
OutofWindow 2-13, 2-14, 2-18, 2-19
P
Packet
Breakdown Pie Chart 6-4
Passed 6-18
Paste 2-27
Percentages 2-19, 2-24
Performance 6-5, 7-2
View 2-31
Permanent
Database 3-5
Information View 3-6
Entry 3-6, 3-7
PHY
A 4-10
B 4-10
Physical
Index
6
Bridge Device 7-1
Features 2-19
Image 2-16
Representation 2-26
Status 2-2, 2-5, 2-9
Pie Chart 6-4, 6-10
POK 2-4, 2-7, 2-8, 2-23
Poll
Cycle 2-4, 2-7, 2-9
Log Ratio 4-3, 4-8
Polling 4-3
Address 6-14
Cycle 2-1, 4-1
Interval 4-3, 4-8, 6-14
Status 4-9
Port
1 Filter/Relay 3-10
2 Filter/Relay 3-10
Address 6-9, 6-14
Configuration
Button 6-8, 6-13, 6-18
View 6-8, 6-13
Connections Panel 6-5
Diagnostic
Button 6-7, 6-12
View 6-7, 6-12
Diagnostics Button 6-18
Information 2-16, 2-26
Name 6-6, 6-9, 6-14, 6-16, 6-19
Network Name 6-9
Number 2-12, 2-16, 6-8, 6-9
OK 2-4, 2-7, 2-8
Packet Breakdown Pie Chart 6-10
Path Cost 6-9, 6-15
Performance View 3-11, 5-4, 6-5
Priority 6-9, 6-15
Root Designator 6-9
State 6-15
Status 2-12, 2-16, 6-6, 6-10, 6-14, 6-16,
6-19
To Root Bridge Cost 6-9
Topology Settings View 6-14
Type 6-9, 6-14, 6-16, 6-19
PORT_1 6-6, 6-9, 6-14
PORT_2 6-6, 6-9, 6-14
Port1 Out 3-5, 3-7, 3-9
Port2 Out 3-5, 3-7, 3-9
Power 2-7
On 2-22
Up 2-4
Cabletron SNMP Bridges
Management Module Guide
P (continued)
Preface xi
Priority Comparisons 4-4
Probable Cause Messages 7-1
Protocol Max Age 4-4
Prt_Bdg_SEnet # 3-11
Prt1=Filter/Prt2=Filter 3-6, 3-8
Prt1=Filter/Prt2=Relay_Prt1 3-6, 3-8
Prt1=Relay_Prt2/Prt2=Relay_Prt1 3-6, 3-8
Q
Questions xiii
R
Rate 2-19, 2-24
Graph 5-3, 5-4, 6-3, 6-6, 6-7, 6-11, 6-16,
6-17
Interval 5-1
RCV 2-4, 2-8
Receive 2-4, 2-8
Clock 2-7
Packets 6-3, 6-10
Recv_Colls 2-13, 2-18
Red
Alarm 2-7
Redundancy
Checking 6-14
Enable Flag 6-14
Redundant Port
Algorithm 6-14
Reinitialized 3-10
Related Reading xii
Relay 3-7, 3-9
REM LOOP
LINK
LOST 6-16, 6-19
OK 6-16, 6-19
RED ALARM 6-16, 6-19
YELLOW ALARM 6-16, 6-19
Remote
DSX-1 Port 2-7
NB30 2-7
Port 2-7, 3-1, 6-16
Performance View 3-11
RS449 Port 2-7
V.35 Port 2-7
Restricted Rights Notice ii
9030368 E9
Ring 4-12
Duplicate 3-12
Interface 2-22
MACS 3-11
Network 2-22
Op 3-12, 4-11
Dup 3-12, 4-11
Oscillations 4-13
Table 3-11
Topology 3-11
Uptime 4-9
RMT State 4-10
Rollup
Conditions 4-3
Root 2-8, 4-6, 4-12
Brdg Max Age 4-4
Bridge 4-4, 6-9, 6-15
ID 4-4
Cost 4-4
Identifier 6-15
Port 4-4, 6-9
Switch 4-6
Runt 2-14, 2-18
Packets 2-14, 2-18
Runts 2-13, 2-19
RX 2-22, 2-23
S
Security
String 4-3, 4-8
SEG 2-12, 2-16
Segmented 2-12, 2-16
Select Filtering 3-5, 3-7
Self-Test 2-4, 2-22, 2-23, 3-12, 4-12
Set to Next Available Filter 3-9
Setup Information View 4-5
Signal Quality Error 6-6
Simple Network Management Protocol
Traps 7-1
SMI 3-10
Index
7
S (continued)
SNMP 1-1
Bridge
Acquired Database Table 3-7
Add an Entry View 3-9
Configuration View 4-3
Control View 4-7
Filter Selection View 3-5, 3-7
Special Database Filter Table 3-9
NB20E LEDs 2-4
NB25E LEDs 2-4
System Group View 3-10
Traps 7-1
Software
Operating System 3-10
Reset 4-8
Sort Button 6-4
Sorting Incrementally 6-4
Source Address 3-7, 3-9, 3-10
Tables 3-3
Spanning Tree 4-4
Algorithm 4-5, 4-6, 6-9, 6-15
Switch 4-6
Facilities 4-12
Root 4-12
SpannTree 4-12
Special Database 3-3
Information View 3-10
Table Button 3-9
S-Ports 3-11
STA Protocol 4-5, 4-6
STAND BY 2-4, 2-7, 2-22, 4-7, 4-12, 5-2, 62, 6-3, 6-11, 6-13, 6-14, 6-15, 6-18, 619
State Column 5-4
Static 3-4, 3-7, 3-9
Entries 3-4
Entry Age Lmt 3-4
Station 3-11
Statistic Colors 2-18
Statistical
Information 6-5
Status 5-2
Banner 2-15
Color 2-15
Structure of Management Information 3-10
Suggestions xiii
Support xiii
Switch
Index
8
1 4-6
2 4-6
3 4-6
4 4-6
Settings 4-5, 4-12
System
Descriptor 3-10
Object ID 3-10
OK 2-22
UpTime 2-15, 3-10
T
T1
Frame Format 4-6
Signal 2-7
Timing Mode Switch 4-6
TCP/IP Based Networks xii
Technical Support xiii
Template 1-1
Terminology xii
Test Pattern 6-18
Testing 6-10, 6-18
Status 6-18
Through
A 4-11
B 4-11
Time
Topology Change 4-6
TOKISD 2-22
Tools 2-30, 2-31
Topology 6-9
Change 4-7
ACK 6-15
Count 4-7
Flag 4-6
Information
Button 4-6
View 4-6
Topology Settings Button 6-14
Total 5-3
Entries 3-4
Errors 2-13, 2-18, 2-19
Interval 5-1
Trace 3-12, 4-11
Trademarks i
Traffic 6-1
Flow 2-2, 2-5, 2-9, 6-1
Trans_Colls 2-13, 2-18, 2-19
Translation Bridge 4-10, 4-12
Cabletron SNMP Bridges
Management Module Guide
T (continued)
Transmit 2-4, 2-8
Clock 2-7
Trap Type Obj ID 4-5
TRUE 4-10
TX 2-22, 2-23
Type of Filtering 4-5
U
UNA Duplicate 3-12
Unsolicited
Messages 7-1
UP 6-10
Up
Neighbor 3-11
Upstream Neighbor 3-11, 4-11
V
VarBinding 4-5
Virus Disclaimer i
W
WRAP 2-22
Wrap
A 4-10
AB 4-10
B 4-10
X
Xmit
Aborted 6-8, 6-13
Pkts 6-4, 6-10
XMT 2-4, 2-8
Y
Yellow
Alarm 2-7
9030368 E9
Index
9