1
User’s Manual Vol. 1
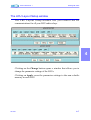
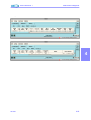
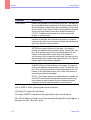
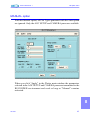
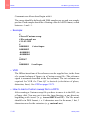
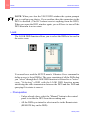
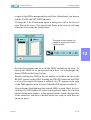
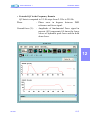
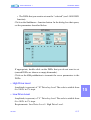
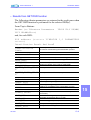
The Sequence Type Setup window
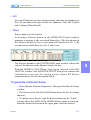
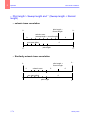
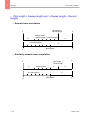
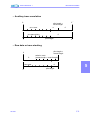
If the signal results from a correlation process then a Blackman window
is applied to the signal centred at zero.
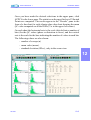
Phase & Distortion
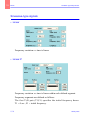
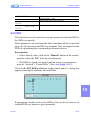
This option is used to plot the Phase- and/or Distortion-versus-time
curve. Use the “Analysis” buttons to select the Phase and/or Distortion
curve. You are allowed to select one or more signals.
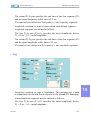
For the two types of analysis, you also have to choose a signal as
reference, using the "Reference" option button. The Phase and
Distortion are computed in relation to the Reference signal.
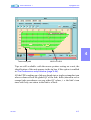
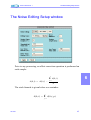
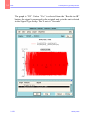
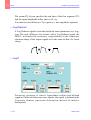
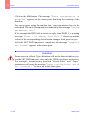
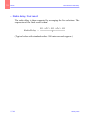
The graph is “2D”. The Y-axis is “Degrees” for the phase and “%” for
the Distortion, and the X-axis is “Seconds”.
0311401
14-29
14































































































































































































































![Final Report - [Almost] Daily Photos](http://vs1.manualzilla.com/store/data/005658230_1-ad9be13b69bd4f2e15f58148160b0f22-150x150.png)