1
Page 43
N. Sediment Thickness
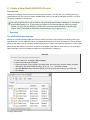
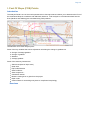
Introduction
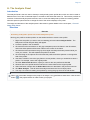
Aim of this tutorial:
1.
2.
3.
4.
Generate Sediment Profile from seismic interpretation
Import Sediment Thickness points from ASCII file
Import Sediment Thickness Grid
Compute Sediment points > 1% of distance to FOS
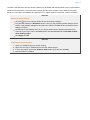
Exercises
Exercise
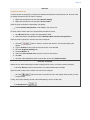
Generate a sediment profile
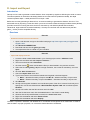
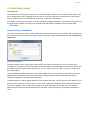
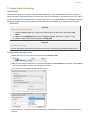
The velocity profile holds all the data necessary to do generate a sediment thickness. It holds both
the interpretations in time, and the interval velocities to use in the interval between the interpretations.
1.
2.
3.
4.
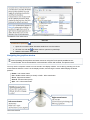
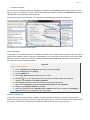
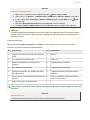
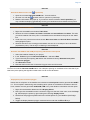
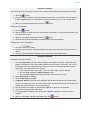
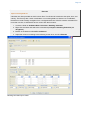
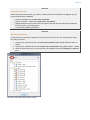
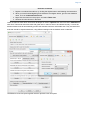
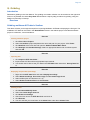
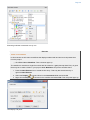
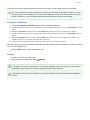
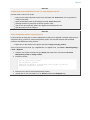
Right-click the a velocity profile, and select Calculate Sediment thickness
Make sure that Calculate Sediment Thickness as been selected.
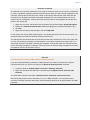
Click Execute. A new data set will be created in 3. Sediment Data / Sediment profiles.
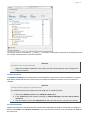
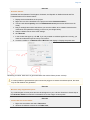
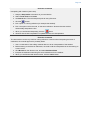
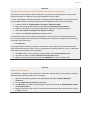
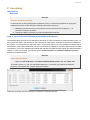
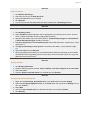
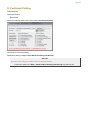
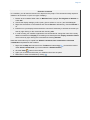
Right click the new data set, and select Table viewTable view
The x,y and z is the position and the sea depth at that point. The scalar value is the sediment
thickness. The Shot point column is the points corresponding shot point from the seismic line.
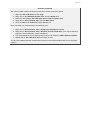
1. Click Close in order to close the Table View
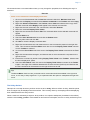
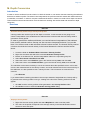
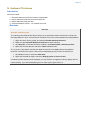
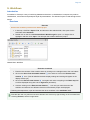
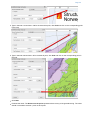
2. Right click the data set again, and select Display profile as cross section
A sediment profile should now be displayed, you may need to un-toggle the Velocity display and the
seismic display, if you are still displaying them in order to get a good view of it.