1
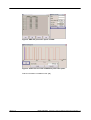
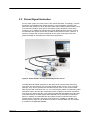
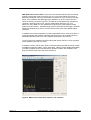
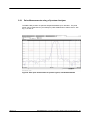
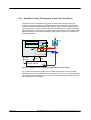
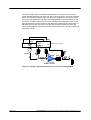
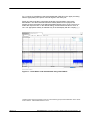
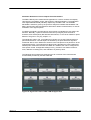
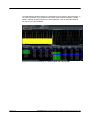
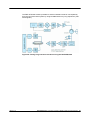
Overview of Tests on Radar
Systems and Components
Application Note
Products:
|
R&S SMU200A
|
R&S FSV
|
R&S SMF
|
R&S FSVR
|
R&S SMA100A
|
R&S FSW
|
R&S SMBV
|
R&S NRP
|
R&S FSU
|
R&S RTO
|
R&S ZVA
|
Dieter Bues, Roland Minihold
08_2012-1MA127_2e
Application Note
The scope of the subject “radar” has
expanded in the recent years in terms of
its technical evolution and spreading of
applications. This application note along
with its corresponding white paper
1MA207 show how to use the R&S radar
product portfolio to tackle test and
measurement tasks in modern radar
technology. Target groups are students
who want to become familiar with radar
issues as well as radar professionals who
want to solve certain test and
measurement tasks.
Table of Contents
1MA127_2e
1
Motivation ............................................................................... 4
2
Aerospace & Defense-Applications...................................... 5
2.1
Pulsed Signal Generation............................................................................5
2.2
Pulsed Signal Evaluation.............................................................................7
2.2.1
Pulse Measurements using a Spectrum Analyzer ..................................10
2.2.2
Amplifier Testing: S-Parameters under Pulse Conditions.....................12
2.2.3
Pulse-Profile Measurements .....................................................................14
2.3
Generation and Evaluation of more complex Radar Signals.................15
2.3.1
Software Tools to generate more complex Radar Signals ....................15
2.3.2
Measurement on more complex pulsed Radar Systems .......................16
3
Automotive Applications ..................................................... 21
4
Special Radar Measurements ............................................. 23
4.1
Measurement of Phase Noise in Local Oscillators .................................23
4.2
Automatic Noise Figure Measurements...................................................25
4.3
Measurements on Phased Array Systems...............................................26
4.4
Component and Subassembly Tests .......................................................29
5
Overview - R&S Radar related Products ............................ 39
6
R&S Instruments for Radar Applications........................... 43
7
Common Radar Abbreviations............................................ 59
8
References............................................................................ 62
Rohde & Schwarz Overview of Tests on Radar Systems and Components
2
List of Figures
Figure 1: A pulse radar system using R&S SMF100A.................................................... 5
Figure 2: SMF-K27 pulse train option on SMF ............................................................... 6
Figure 3: pulse train as result of SMF-K27 pulse train option ........................................ 6
Figure 4: Power Probes directly operated by means of a PC ........................................ 7
Figure 5: NRP Power Viewer Plus software, user interface ........................................... 8
Figure 6: NRP Power Viewer Plus, rise-time measurement........................................... 9
Figure 7: NRP Power Viewer Plus, pulse-width measurement ...................................... 9
Figure 8: Zero-span measurement on pulsed signals, standard bandwidth ................ 10
Figure 9: Zero-span measurement on pulsed signals 100ns and 50 ns ...................... 11
Figure 10: FSW zero-span measurement with extended I/Q demod. BW ................... 11
Figure 11: Sample circuit using a signal generator as pulse source ............................ 12
Figure 12: Testing L-band radar pulsed power transistor with R&S ZVA..................... 13
Figure 13: Pulse-profile technique within R&S ZVA ..................................................... 14
Figure 14: Parameters a1, b2 and s21 as result of ZVA's pulse-profile mode ............. 14
Figure 15: Loading data into the arbitrary waveform generator, three ways ................ 15
Figure 16: Characterizing a non-linear FM chirp radar transmitter............................... 16
Figure 17: 13-bit Barker code demodulated along with FSW-K7 ................................ 17
Figure 18: Signal flow chart of R&S FSW-K6 application............................................. 18
Figure 19: Pulse measurement on a linear FM chirped pulse signal ........................... 19
Figure 20: Pulse measurement of a pulsed signal with varying PRI ............................ 20
Figure 21: ZVA110 along with wafer probes and xy-positioning system...................... 22
Figure 22: Typical intrinsic phase noise produced by the spectrum analyzers ............ 23
Figure 23: Intrinsic phase noise of the R&S FSUP in the L band................................ 24
Figure 24: Frequency-converting DUT with R&S FS K30 ............................................ 25
Figure 25: Measurements results of R&S FS-K30 ...................................................... 25
Figure 26: Digital Phase Shifter MMIC ......................................................................... 26
Figure 27: Sample TRM with block diagram................................................................. 26
Figure 28: Test system for TRM evaluation.................................................................. 28
Figure 29: Typical block diagram for a single-antenna radar system........................... 29
Figure 30: radar X-band lowpass filter transfer characteristic with limit lines............... 30
Figure 31: Circulator symbol, scattering matrix and real world unit.............................. 31
Figure 32: ZVAX24 front and rear view ........................................................................ 33
Figure 33: ZVA / ZVAX24 mounted in a 19” portable rack ........................................... 34
Figure 34: Using the R&S SMA100A or R&S SMB100A as a substitute for STALO ... 35
Figure 35: R&S SMU200A as a substitute for an exciter ............................................. 36
Figure 36: R&S SMF100A up to 43.5 GHz as a substitute for an exciter..................... 36
Figure 37: Receiver testing using complex waveforms ................................................ 37
Figure 38: Testing long real-world scenarios using the R&S AFQ100A....................... 38
Figure 39: R&S radar product portfolio classification ................................................... 39
Figure 40: General test equipment for radar applications ............................................ 40
1MA127_2e
Rohde & Schwarz Overview of Tests on Radar Systems and Components
3
1 Motivation
The scope of the subject “radar” has expanded in the recent years in terms of its
technical evolution and spreading of applications. Main causes are that CAD / CAE
tools are enabling a quicker and more predictable design and that highly integrated
signals processors and post processing units are available for applications not possible
at a nominal budget in the past.
Related improvement in test & measurement devices prompted an update of the
former R&S radar Overview application note 1MA127, which has been separated into
two documents. The 1MA207 “White Paper” describes the general topics, not related
to the R&S product portfolio. This Application Note at hand is supplementary to the
“White Paper”.
The structure of this document now more directly addresses the target groups.
Automotive (FM-CW) radar engineers most likely are interested in different topics
compared to engineers from the Aerospace & Defense community, i.e. issues related
to pulse generation and evaluation. Hence, A&D subjects are organized into the main
chapter “Aerospace & Defense Applications”, while automotive topics are assembled in
the appropriate “Automotive” chapter. Subjects not fitting into any of these categories
or which are important for both can be found in chapter “Special radar measurements”.
Using this structure in conjunction with the complementing white paper, we hope to
provide information on radar –T&M in condensed and well organized form to the main
target groups
This application note closes with a short overview of core radar-related products from
Rohde & Schwarz and a classification of our large radar T&M product portfolio.
1MA127_2e
Rohde & Schwarz Overview of Tests on Radar Systems and Components
4
2 Aerospace & Defense-Applications
2.1 Pulsed Signal Generation
Pulse radar with a rotating antenna
Figure 1: A pulse radar system using R&S SMF100A
The R&S SMF100A can be used to simulate pulsed radar applications with a rotating
antenna. In this example (see Figure 1, the external pulse from the pulse generator is
applied to the external pulse input of the R&S SMF100A and is used as a trigger for
the internal pulse generator and modulator. You can delay this trigger in order to
perform range and direction simulations and check them on the radar equipment's
display.
The R&S SMF100A microwave signal generator can be equipped with the R&S SMFK27 pulse train option to generate pulse sequences containing jitter or even staggered
pulses (pulses with variable pulse pause lengths). This makes the R&S SMF100A ideal
for performing sensitivity tests on radar receivers or for simulating pulse radar signals
(without pulse compression). Pulse trains are created with an easy-to-use editor.
Lengths of up to 1023 individual pulses are possible.
1MA127_2e
Rohde & Schwarz Overview of Tests on Radar Systems and Components
5
Figure 2: SMF-K27 pulse train option on SMF
Figure 3: Pulse train as result of SMF-K27 pulse train option
Further information is available in Ref. [28]
1MA127_2e
Rohde & Schwarz Overview of Tests on Radar Systems and Components
6
2.2 Pulsed Signal Evaluation
For any radar system, the pulse power is the central parameter. Accordingly, we have
an interest in investigating the individual pulses. This is particularly important with
advanced radar systems in which the pulse width and the PRF are both variable. Here,
it is important to analyze pulse power and shaping (slope steepness, pulse droop,
overshoot, etc.). Suitable test instruments include wideband power sensors such as
the R&S NRP-Z81 power sensor with versatile measurement functions. However, a
spectrum analyzer with a wide IF bandwidth in zero span mode will provide even
greater flexibility for assessing the measurement parameters.
Figure 4: Power Probes directly operated by means of a PC
The R&S NRP-Z81/85/86 are based on the latest power measurement technology.
They offer all of the features of a conventional peak power meter in a very compact
package. They can be operated with the NRP2 power meter or (like all of the R&S
NRP sensors) with a Windows PC, e.g. as a cost-effective solution for performing radar
transmitter tests in the field. No compromises were accepted in the areas of measurement accuracy and functionality. This makes the R&S NRP-Z81/85/86 very well suited
for detailed analysis of radar signals with bandwidths of up to 30 MHz for individual
pulses. In addition, the R&S NRP-Z81 also allows precision measurements of the
average power of signals in the power level range from –60 dBm to +20 dBm. The
actual frequency range is from 50 MHz to 18 GHz for the R&S NRP-Z81 and 50 MHz
to 40 GHz for the R&S NRP-Z85/86.
1MA127_2e
Rohde & Schwarz Overview of Tests on Radar Systems and Components
7
R&S NRP Power Viewer Plus is easy-to-use test software that provides all internal
features of the power probe to the user just via a control PC without the need of a
dedicated instrument. This way measurement functions such as continuous average
power, trace, statistics and data logging are available. Up to four thermal sensors
which are directly connected to the PC via USB can be simultaneously evaluated in
continuous average power mode. Various mathematical functions (e.g. sum,
difference, ratio, SWR, etc.) are available for analyzing the measurement results
produced by the sensors. Versatile trigger function (internal/external trigger, definable
holdoff and dropout time) ensure correct measurements even under difficult trigger
conditions.
In addition to the manual operation of power probes NRP Power viewer plus offers a
scripting language which allows automatic test sequences to be created and being
operated without the need of an extra software development environment.
Power Viewer Plus software is delivered along with power probes it can be operated
under Windows, MAC OS X or Linux.
In addition to Power Viewer Plus, which is delivered along with NRP-Zx power probes,
an additional software “NRPV” can be purchased. NRPV provides additional flexibility
in handling multiple sensors simultaneously. Details on NRPV are available in Ref.
[23], see reference list at the end of this document.
Figure 5: NRP Power Viewer Plus software, user interface
1MA127_2e
Rohde & Schwarz Overview of Tests on Radar Systems and Components
8
For repetitive signals, the R&S NRP Power Viewer Plus software provides high time
resolution in conjunction with the R&S NRP-Z81, -Z85 and -Z86 power sensors to
enable display of time-domain behavior even for very steep-edged pulses. See Fig. 5
and 6 .This allows determination of all of the relevant pulse parameters with high
accuracy.
Figure 6: NRP Power Viewer Plus, rise-time measurement
Figure 7: NRP Power Viewer Plus, pulse-width measurement
1MA127_2e
Rohde & Schwarz Overview of Tests on Radar Systems and Components
9
2.2.1 Pulse Measurements using a Spectrum Analyzer
The R&S FSW provides an optional analysis bandwidth up to 160 MHz. The peak
power can be measured very accurately for pulse widths down to about 100 ns. See
Fig. 8, 9 and 10:
Figure 8: Zero-span measurement on pulsed signals, standard bandwidth
1MA127_2e
Rohde & Schwarz Overview of Tests on Radar Systems and Components
10
Figure 9: Zero-span measurement on pulsed signals 100ns and 50 ns
Zero-span measurement on a pulsed signal with RBW = 80 MHz and pulse widths of
100 ns and 200 ns. The peak power can be measured with little error for pulse widths
as low as 100 ns.
When equipped with the R&S FSW-B8 option and the R&S FSW-B160 I/Q
demodulation bandwidth extension, the R&S FSW can even deliver an I/Q
demodulation bandwidth of 160 MHz. This makes it possible to measure peak power
even for pulse widths < 30 ns; see Fig. 10.
Figure 10: FSW zero-span measurement with extended I/Q demod. BW
1MA127_2e
Rohde & Schwarz Overview of Tests on Radar Systems and Components
11
2.2.2 Amplifier Testing: S-Parameters under Pulse Conditions
Components such as amplifiers are typically characterized in terms of their gain,
frequency response, matching, and phase response by S-parameter measurements.
S-parameter measurements are generally performed with a vector network analyzer
using CW signals. However, this technique can be inadequate (or totally impractical)
with pulse radar components such as radar transmitter amplifiers. The amplifier might
behave differently in CW mode compared to pulse mode or might even be subject to
thermal overloading.
DUT
Meas. Receiver
Ref. Receiver
PORT 1
Generator
IEEE
LAN
Ref
Trg
Pulsed Source
Figure 11: Sample circuit using a signal generator as pulse source
Fig. 11 shows a schematic diagram with a pulsed signal source such as the R&S
SMF100A connected to a R&S ZVA vector network analyzer. Fig. 12 shows a detailed
block diagram as an example of a test setup for pulsed S-parameter measurement on
an L-band radar power amplifier.
1MA127_2e
Rohde & Schwarz Overview of Tests on Radar Systems and Components
12
The pulsed output signal of the SMF is amplified to the required drive power by a
power amplifier operating in linear mode. Part of the input power, and of the reflected
power of the amplifier module under test (DUT) is coupled by a bidirectional coupler
and reduced by attenuators (20 dB) to the levels suitable for the ZVA reference and
test inputs. The DUT output is connected to a 30 dB power attenuator. A part of the
attenuated output signal is coupled by the directional coupler and fed via another 10
dB attenuator to port 2 of the ZVA. This way the decoupled signals are fed to the
corresponding R&S ZVA receiver inputs for measurement of S11 and S21, details are
provided in ref. [5].
Figure 12: Testing L-band radar pulsed power transistor with R&S ZVA
1MA127_2e
Rohde & Schwarz Overview of Tests on Radar Systems and Components
13
2.2.3 Pulse-Profile Measurements
In pulse-profile mode, the R&S ZVA measures S-parameters vs. time. With its 30 MHz
maximum measurement bandwidth and 80 MHz sampling rate, it is possible to
determine the exact timing behavior of the S-parameters even when dealing with the
very short pulses that are commonly encountered in radar technology. In pulse-profile
mode, the R&S ZVA writes the raw data into its own RAM. Further signal processing
such as filtering is then handled by the instrument software.
Figure 13: Pulse-profile technique within R&S ZVA
Fig. 14 illustrates an S-parameter measurement made in this manner vs. pulse
duration on an L-band radar power transistor.
Trc5 S11 dB Mag 10 dB / Ref 0 dB
Cal
Trc6 a1 dB Mag 0.2 dB / Ref 30 dBm
30.6
30.4
30.2
30.0
M3
M4
M3
29.8
M4
29.6
Math
M1
M2
M3
M4
M1
M2
M3
M4
TRG
a1
30.8
M1
M1
20.0000
200.0000
260.0000
2.0000
20.0000
200.0000
260.0000
2.0000
2
Rs
Rs
ns
Rs
Rs
Rs
ns
Rs
-8.989 dB
-8.959 dB
-8.876 dB
-9.189 dB
29.776 dBm
29.789 dBm
29.721
M2 dBm
M2
29.615 dBm
29.4
29.2
Ch1 Profile Start -10 Rs
Trc7M3
S21 dB Mag 0.2 dB / Ref 20 dB
TRG
b2
M3
50.8
M4
M1
50.6
M1
M4
50.4
Freq 1.3 GHz Pwr 0 dBm
Cal
Trc8 b2 dB Mag 0.2 dB / Ref 50 dBm
Stop 220 Rs
Math
M1
M2
M3
M4
M1
M2
M3
M4
50.2
50.0
49.8
20.0000
200.0000
260.0000
2.0000
20.0000
200.0000
260.0000
2.0000
3
Rs
Rs
ns
Rs
Rs
Rs
ns
Rs
20.609 dB
20.373 dB
20.890 dB
M2
20.612 dB
M2 dBm
50.406
50.184 dBm
50.633 dBm
50.249 dBm
49.6
49.4
49.2
Ch1 Profile Start -10 Rs
Freq 1.3 GHz Pwr 0 dBm
Stop 220 Rs
2/1/2008, 11:14 AM
Figure 14: Parameters a1, b2 and s21 as result of ZVA's pulse-profile mode
1MA127_2e
Rohde & Schwarz Overview of Tests on Radar Systems and Components
14
2.3 Generation and Evaluation of more complex Radar
Signals
It need to be stressed that there is a difference between “pulse generation” in the basic
sense and generation of more complex baseband radar signals. For example basic
pulse on/off ratios can be created with simple analog signal generators; however more
complex radar signals require vector baseband signal creation. Trade-offs include
On/Off ratio of signal blanking in analog signal generator and dynamic range of
baseband system.
2.3.1 Software Tools to generate more complex Radar Signals
There are different ways of loading data into the ARB memory of a vector signal
generator or I/Q modulation generator as shown in Fig. 15:
1. The R&S (AFQ-/AMU-/SMx-)K6 pulse sequencer software simplifies generation of
pulsed signals with complex modulation and also handles the transfer of the
signals to the Rohde & Schwarz generators.
2. The ARB toolbox Plus (AN 1GP88) converts existing I/Q signals into the Rohde &
Schwarz waveform format and transfers them to the Rohde & Schwarz generators.
3. The Rohde & Schwarz Matlab transfer toolkit (AN 1GP60) loads I/Q signals
generated using MATLAB® directly into a Rohde & Schwarz signal generator via
GPIB or a TCP/IP connection.
K6 Pulse Sequencer
Generation of complex pulses and pulse
patterns. Custom pulse envelopes, apply
modulation or jitter as well as markers,
build sophisticated test patterns for radar
receiver tests. Proprietary modulation
schemes or envelopes can be applied.
ARB Toolbox Plus
Tool for creating or manipulating
waveforms for R&S vector signal
generators and baseband IQ modulation
generators
MATLAB ®
Use R&S MATLAB Transfer Toolbox
to interface with instrument
Figure 15: Loading data into the arbitrary waveform generator, three ways
1MA127_2e
Rohde & Schwarz Overview of Tests on Radar Systems and Components
15
2.3.2 Measurement on more complex pulsed Radar Systems
Zero Span Measurements
The R&S FSW can be used in conjunction with the R&S FSW-K7 AM/FM/PM
measurement demodulator to perform a functional check on pulse compression radar
systems. Thus radar transmitters which use linear or non-linear FM techniques can be
checked, see Fig. 16.
Figure 16: Characterizing a non-linear FM chirp radar transmitter
1MA127_2e
Rohde & Schwarz Overview of Tests on Radar Systems and Components
16
Fig. 17 shows a 13 bit Barker code demodulated with FSW-K7 in the upper part along
with the appropriate pulse power of the RF signal in the lower part.
Some care has to be taken concerning the phase synchronization of the pulse
demodulator. The ZERO PHASE REF POS softkey defines for this purpose the
position at which the phase of the PM-demodulated signal is set to 0 rad. The entry is
made with respect to time. In the default setting, the first measured value is set to 0
rad. The appropriate softkey is available only in the PM display with DC coupling. (*)
Figure 17: 13-bit Barker code demodulated along with FSW-K7
(*)FSW firmware versions issued before June 2012 need following pre-processed initialization via the remote
control interface: “SENS:ADEM:PM:RPO:X 10us”
1MA127_2e
Rohde & Schwarz Overview of Tests on Radar Systems and Components
17
Automatic Detection of more complex Pulse Parameters
The R&S FSW-K6 pulse measurement application is a tool to measure and display
various timing, amplitude, phase, and frequency related parameters. The application
uses digital baseband data (I/Q data) captured by the R&S FSW. The available
bandwidth is therefore given by the spectrum analyzers available I/Q bandwidth. I/Q
data is time domain data and therefore allows time domain measurements, as well as
evaluation of the signal’s phase.
A pulsed input signal is a signal whose carrier power is modulated by two states: ON
and OFF. Basically, a pulse is detected when the input signal power exceeds a
threshold, then subsequently falls below that threshold, or vice versa. Details on pulse
detection are given in ref. [34], chapter 4.2 .
The signal flow chart in Fig. 18 provides an overview on how the FSW-K6 performs
pulse measurements. The I/Q capture is followed by the pulse detection algorithm
mentioned above, which defines the sections in the I/Q capture to be passed on to the
measurement block. The measurement block finally calculates the pulse parameters.
Default pulse measurements follow the IEEE 181 standard, but can be configured for
user specific needs. Configurable settings are e.g. levels for rise-/fall-tim measurement, definition of settling time, and evaluation of pulse top level.
The following two measurement examples give an overview of the measurement
functionalities provided by the R&S FSW-K6.
Figure 18: Signal flow chart of R&S FSW-K6 application
1MA127_2e
Rohde & Schwarz Overview of Tests on Radar Systems and Components
18
Example 1: measurement of linear FM chirped pulses
The first measurement example described here is the verification of a linear FM
chirped pulse signal. In Fig. 19 the R&S FSW-K6 is configured to provide an overview
window (Magnitude Capture) allowing the user to verify his capture settings. The result
table is configured to show pulse width, chirp rate and frequency error. The numbers in
the table allow a quick verification of design parameters as well as a comparison of
one parameter over consecutive pulses. Fig. 19 also holds three intra-pulse displays,
showing frequency, phase and magnitude. The intra-pulse displays each show one
parameter over time for one selected pulse. Within the intra-pulse displays, unwanted
effects, such as e.g. the rise and fall of the magnitude during the pulse on-time can be
analyzed. The intra-pulse displays also allow manual marker measurements of e.g. the
chirp rate.
Figure 19: Pulse measurement on a linear FM chirped pulse signal
Example 2: measurement of varying PRI, pulse width and amplitude
This measurement example analyzes a signal with pulses varying in pulse repetition in
PRI, width and amplitude. In this case, the R&S FSW-K6 was configured to display the
result table along with a statistics table, the parameter trend for pulse width, and the
overview window. The statistics table shows the same parameters as the result table,
but calculates statistics, i.e. minimum, maximum, average, and standard deviation. The
statistic display is split into two parts. The first part contains the statistics calculated
over all pulses of the current capture buffer. This section is indicated with a green
background, referencing the indicators in the magnitude capture graph. The second
part displays the statistic numbers for all pulses, which were analyzed since the data
acquisition was started. This statistical numbers are called cumulative statistic. The
numbers in the two sections differ only, if the instrument is in continuous mode. In
single sweep mode, both sections show identical numbers. To allow the user a
comparison of pulse parameters over a large number of pulses, the result table can
hold up to 100,000 datasets. So no matter how many pulses are in the current capture
buffer, the table will fill up with the numerical results, if the instrument is in continuous
mode. The results of the table can either be analyzed on the instrument, or exported
into a file. The cumulative statistic as well as the table, capable of holding up to
100,000 dataset, is especially valuable when it comes to a measurement of very rare
events. This is also important for trending information to see things like the heating
effects running over long sequences and time.
1MA127_2e
Rohde & Schwarz Overview of Tests on Radar Systems and Components
19
The FSW-K6 also allows to display one parameter over all pulses in the I/Q memory. In
Fig. 20 the parameter trend is shown for the pulse width. The trend display is ideally
suited to identify repeating sequences, since signatures, such as the double peak in
Fig. 20, can be easily identified.
Figure 20: Pulse measurement of a pulsed signal with varying PRI
1MA127_2e
Rohde & Schwarz Overview of Tests on Radar Systems and Components
20
3 Automotive Applications
Today’s automotive radar applications are focusing following items:
•
•
•
•
speed surveillance
crash avoidance
parking assistance
pedestrian detection
Automotive radar applications are dealing with much shorter distances of surveillance
compare to Mil/Aero radar applications. While the latter are working in the range of
10ths of kilometres, the former are operated in the range from only a few centimeters
up to roughly 200 meters.
The much smaller distance to be covered in automotive radar is causing two important
technical differences in the appropriate systems:
•
•
the equipment can be operated at much higher frequencies
the radiated electric power can be smaller
Therefore, automotive radar works on operating bands such as 24..26 GHz or
76…77GHz and 77…81 GHz. In research and development, systems working at
frequencies up to 110 GHz are in focus. Due to the smaller radiated power there is no
mandatory need for pulsed transmission in automotive radar. To increase sensitivity,
automotive radar systems are mainly working with a continuous frequency modulated
signal, “FM-CW” in short.
As outlined in the White Paper 1MA207 test equipment for automotive radar systems
are more focused on lower radiated power at higher frequencies compared to mil-aero
radar test equipment.
While commercial last generation automotive radar systems still are working with
mechanical beam steering, there is a clear trend towards digital beamforming (DBF),
especially for 77 GHz systems where antenna arrays can be built on small footprints.
Therefore all information related to DBF as provided earlier in this document, can be
used for automotive radar systems in a similar way.
Signal generators SMB100A and SMF100A are ideal for automotive radar applications.
Both instruments can be operated in their base configuration with frequencies up in the
40 GHz range. By means of external multipliers from the SMZ family the frequency
range of SMF100A can be extended up to 110 GHz, thus covering the entire frequency
range of modern automotive radar systems. SMB as well as SMF can provide FM
modulated signals and therefore can be basically applied for automotive systems.
On the receiver side Signal and Spectrum Analyzers from the FSW family are best
fitting automotive radar requirements due to low phase noise for oscillator tests along
with the capability of analyzing short pulse rise and fall times.
Automotive radar systems as used along with cars are price-sensitive items of mass
production. The car industry therefore normally tries to avoid expensive test
1MA127_2e
Rohde & Schwarz Overview of Tests on Radar Systems and Components
21
procedures in their productions lines. On-chip integrated self-test functions are an
important measure for test cost reduction along with highly integrated MMIC devices.
Costs can additionally be reduced by using off-the-shelf preconfigured test equipment
in cases where integrated self-test functions are not suitable. A vector network
analyzer (VNA) is the best solution for this purpose, as shown in Fig. 21. Along with
wafer probes and x-y-wafer positioning systems entire wafers can be tested before
divided into their elements.
Figure 21: ZVA110 along with wafer probes and xy-positioning system
1MA127_2e
Rohde & Schwarz Overview of Tests on Radar Systems and Components
22
4 Special Radar Measurements
4.1 Measurement of Phase Noise in Local Oscillators
Making precision Doppler speed measurements requires testing of the phase noise of
the coherent oscillators (COHO) and stable local oscillators (STALO) involved. In
Doppler radar systems, excessive phase noise in the RF source and all of the other
oscillators that are used in the radar system can mask targets at low speeds. In FMCW
radar systems, targets in close proximity to the radar system can be masked.
The test instrument that is used for this measurement must meet very demanding
requirements for the phase noise. The spectrum analyzers in the R&S FSU/R&S FSQ
family from Rohde & Schwarz are well suited for such tests.
Figure 22: Typical intrinsic phase noise produced by the spectrum analyzers
The R&S FSUP signal source analyzer provides an extremely wide measurement
dynamic range along with very flexible test capabilities. When equipped with the R&S
FSUP-B60 option, the R&S FSUP signal source analyzer has two parallel receiving
paths. Due to the symmetrical structure that exists, cross-correlation between the two
paths is possible, allowing elimination of the uncorrelated intrinsic noise of the two
reference sources. This method can be used within the instruments full frequency
range from 10 MHz up to 50 GHz. The sensitivity is thus increased significantly and is
no longer limited by the phase noise of the internal references. An improvement of up
to 20 dB is possible depending on the number of averaging steps.
1MA127_2e
Rohde & Schwarz Overview of Tests on Radar Systems and Components
23
Figure 23: Intrinsic phase noise of the R&S FSUP in the L band
Fig. 23 shows phase noise measurement results with correlation using the R&S FSUPB60 option (green curve) and uncorrelated (blue curve).
The R&S FSUP signal source analyzer offers the following comprehensive test
capabilities for use in testing COHO/STALO:
1MA127_2e
X
Phase-noise measurement using the phase-detector method with internal
or external reference
X
Direct phase-noise measurement with the spectrum analyzer
X
Measurement of characteristic COHO/STALO oscillator parameters
X
Tuning characteristic with constant and variable supply voltage
Tuning sensitivity
Output power vs. frequency and supply voltage
Spurious frequencies and harmonics
Transient response when changing frequencies
Rohde & Schwarz Overview of Tests on Radar Systems and Components
24
4.2 Automatic Noise Figure Measurements
R&S spectrum analyzers are ideal for making automatic measurements of the noise
figure and gain due to their high sensitivity and power level accuracy in conjunction
with the switchable calibrated noise sources. The R&S FS-K30 application firmware
provides features for these high-performance analyzers which are otherwise available
only in conjunction with special noise measuring setups. The following parameters can
be measured with excellent precision at a defined frequency or across a selectable
frequency range:
X
X
X
Noise figure in dB
Noise temperature in K
Gain in dB
Besides LNAs, frequency converters can also be tested. The measurement results can
be displayed in either graphical or tabular format.
Figure 24: Frequency-converting DUT with R&S FS-K30
Figure 25: Measurements results of R&S FS-K30
1MA127_2e
Rohde & Schwarz Overview of Tests on Radar Systems and Components
25
4.3 Measurements on Phased Array Systems
As outlined in the White Paper 1MA207 electronic beamforming can be performed by
means of antenna phase arrays which are feed by phase-shifted signals. In today's
radar systems phase shifting is mainly achieved by electronic circuits, a typical
example is described in Ref. [33]
Figure 26: Digital Phase Shifter MMIC
Fig. 26 shows the appropriate block diagram. By means of a chain of six fixed-value
phase shifters a total amount of 360 degrees can be achieved in steps of 5.6 degrees.
The on-off-control signal of each shifting unit is digitally controlled, hence the term
"Digital BeamFormer" , "DBF" in short for this kind of device.
When combined with circulators, attenuators and switches we are talking about so
called "transmit-receive-modules", "TRM" in short.
Figure 27: Sample TRM with block diagram
1MA127_2e
Rohde & Schwarz Overview of Tests on Radar Systems and Components
26
Fig. 27 shows an appropriate sample which has been created by R&S for test and
demonstration purpose. In phased array radar systems such TRMs are used one for
each antenna element, however implemented on a fairly higher integration scale in
order to bring it into the top of a fighter plane for example.
Along with phase array radar systems multiple test scenarios have to be covered as
listed below:
• Testing complete systems including transmitter, antenna and receiver
(application area: R&D)
•
Single modules, either on PCB or chip basis (application area : QA)
•
Testing the integration into in the target system
(application area : QA and Production)
•
Diagnostics and calibration of entire systems
(application area : Service and Maintenance)
Hence along with phased array radar systems for nearly each point of the value chain
suitable test equipment is needed. R&S provides appropriate test solutions as listed
below:
•
Testing complete Phased Array systems: Vector network analyzers
(ZVA, ZNB families) or generator / analyzer combinations (ex.
SMB100A / FSW families)
•
Stimulation and evaluation of digital radar control signals: Control
Platform (OSP family) and digital oscilloscopes (RTO family)
•
Testing complete radar systems including test software: TRM radar
Test System (TS6710)
•
Entry level solutions for typical small budget areas, ex. Service and
Maintenance (Power Meter NRP-Z81)
When testing subsystems for instance as shown in Fig. 27 the vector network analyzer
(VNA) is the ideal instrument. The RF ports of the DUT can be directly connected to
the RF input and output port of the analyzer. Four independent output signals at the
USER CONTROL connector along with simple extension circuitry can be used to
control phase shifters and programmable attenuators as included in TRMs. Along with
its internal command sequence capability the VNA can be easily configured as an
automatic dedicated test device for TRM modules and appropriate radar systems.
1MA127_2e
Rohde & Schwarz Overview of Tests on Radar Systems and Components
27
For higher requirements R&S offers complete test systems for TRM modules, TS6710,
as shown in Fig. 28.
Figure 28: Test system for TRM evaluation
Along with its three main modules the test systems provides all tests needed for
complete TRM module evaluation:
•
ZVA24 for generating all incoming signals and evaluating all outputs in
terms of the TRM’s s-parameters.
•
OSP-TRM for switching all RF signals to / from the TRM
•
Compact TSVP for digital control of the TRMs, ex. Switching
attenuators and phase shifters
The highly configurable software as included in the test system provides complete testsequences as well as single tests for in detail evaluation. Along with worldwide
available field application engineers the test system is easily installed and brought to
operation nearly everywhere over the world.
1MA127_2e
Rohde & Schwarz Overview of Tests on Radar Systems and Components
28
4.4 Component and Subassembly Tests
Achieving optimum performance in an overall radar system requires analysis and
optimization of the individual functional groups and components. Looking to the block
diagram of a typical radar system, refer to Fig. 29, various functional groups can be
found as indicated by colors:
1.
2.
3.
4.
5.
Filters, phase shifters, switches and waveguide joints, indicated in blue
Multiport devices like mixers and circulators, in green
Non-linear active and passive devices like amplifiers and limiters, in red
Antennas at the right
Mixed signal analog / digital components A/D converts and pulse generators,
in yellow
6. Oscillators, so called “stable local oscillators” (STALOs), located close to the
two upper mixers in the diagram
Figure 29: Typical block diagram for a single-antenna radar system
Functional groups 1 – 4 can be tested in all parameters using a Vector Network
Analyzer (VNA). The best testing method for oscillators is by means of a phase noise
analyzer, ex. FSUP. The subsequent text will provide more details how to test radar
components using a VNA.
1MA127_2e
Rohde & Schwarz Overview of Tests on Radar Systems and Components
29
A VNA is highly suitable to test radar components
A VNA includes one or more independent RF transmitters and receivers. Each of the
transmitters and receivers is covering a wide range in frequency and power. By means
of individually controlling frequency and power of the VNA’s transmitters and receivers
the operating conditions of each block unit as shown in Fig. 29 can be simulated and
tested within its normal operating conditions and beyond, if needed. Additionally the
VNA is highly configurable in terms of additional components needed for tests, for
instance filters, combiners, amplifiers, pulse-modulators and high power directional
couplers. Finally the VNA is providing some important digital features as there are
digital interfaces like USB-ports, a user control-port and programming capabilities
which allow control programs to run directly on the machine without the need of an
external control computer.
All this will contribute to an affordable and highly flexible test system for radar
components as outlined in the upcoming text
VNA test scenarios specific to each of the functional groups 1- 5
(1) Standard two port components like filters, switches (blue group)
Testing filters, switches/attenuators and waveguides belongs to the standard tasks of a
VNA. Typical test parameters are reflection coefficients like S11 / S22 and
transmission coefficients like S21 / S12. Predefined limit lines simplify testing and
enable the user to evaluate the results in a reliable way, saving costs especially in the
service and production area, refer to Fig. 30
Figure 30: radar X-band lowpass filter transfer characteristic with limit lines
1MA127_2e
Rohde & Schwarz Overview of Tests on Radar Systems and Components
30
(2) Multiport devices like Mixers and Circulators (green group)
The R&S®ZVA8/24/40/50 four-port models along with the ZVA-K4 frequency
conversion option can directly measure mixer parameters like conversion gain,
isolation, matching, group delay and intermodulation products without the need of an
external generator. This configuration still needs access to the local oscillator input of
the DUT.
The R&S®ZVA offers a new technique for measuring the group delay and relative
phase of frequency converters without access to the embedded local oscillator or its
reference signal. This method requires a four-port R&S®ZVA with two sources, ex.
ZVA67, to apply a two-tone signal to the converter. The R&S®ZVA evaluates the group
delay by measuring the phase differences between both carriers at the
input and the output of the DUT.
radar receiver and transmitter systems require that the built-in mixers have wellcontrolled amplitude, phase, and group delay responses. The R&S®ZVA-K5 option
makes it possible to characterize all four complex S-parameters of a mixer with LO
access, including absolute phase and group delay of the conversion loss. This
measurement uses full two-port calibration, which yields high measurement accuracy.
Circulators in radar systems are three port devices which route outgoing and incoming
signals between the antenna, the transmitter and the receiver. Thus these nonreciprocal devices work as isolators, in which microwave power entering any port is
transmitted to the next port in clockwise rotation. All additional power flow is omitted
in the ideal case, refer to Fig. 31.
Figure 31: Circulator symbol, scattering matrix and real world unit
The appropriate s-matrix therefore consists of all zeros with the exception of S21, S32
and S13 as indicated in Fig. 31. This structure therefore can be easily measured using
a VNA with at least three test ports. The matrix in Fig. 31 shows the ideal circulator
structure only; however, by means of the VNA any deviation from this can be detected.
This can be caused by reflections S11, S22 or S33 or unwanted backward
transmissions, ex. S23.
1MA127_2e
Rohde & Schwarz Overview of Tests on Radar Systems and Components
31
(3) Non-linear active and passive devices like amplifiers and limiters
- Pulsed mode S-parameter measurements Components such as amplifiers are typically characterized in terms of their gain,
frequency response, matching, and phase response by S-parameter measurements.
S-parameter measurements are generally performed with a vector network analyzer
using CW signals. However, this technique can be impractical with pulse radar
components such as radar transmitter amplifiers which are designed for pulse mode
operation. CW mode testing of an amplifier designed for pulse mode might result in
thermal overloading and even may provide wrong test results.
Therefore the ZVA-K7 / B7 products have been created which allow S-parameter
measurements in pulse mode. ZVA-K7 provides measurements on pulsed signals,
pulse profile, recording time up to 3ms up to 30 MHz bandwidth for all ZVA and ZVT.
Along with option ZVA-B7, which includes option ZVA-K7, recording times up to 25 ms
are possible with the same bandwidth. Both options provide direct A/D-converter
access with direct RAM storage resulting in fast post processing and s-parameter
calculation. Further information on pulsed mode measurements is available
as follows:
1MA127_2e
X
Detailed description of the products ZVA-K7 and ZVA-B7 in the appropriate
product brochure Ref. [7], pg. 17
X
Article about the functionality of both options in Ref. [4]
X
Complete example of pulsed S-parameter measurements on a radar
L-Band power amplifier in Application Note 1MA126, Ref. [ 5]
X
General information about pulsed mode amplifier tests in the book
“Fundamentals of VNA”, pg. 208, Ref. [2]
Rohde & Schwarz Overview of Tests on Radar Systems and Components
32
- Hardware extensions using ZVAX24 Sometimes additional electronic components are needed beyond the network
analyzers and its options available. For this purpose the ZVAX24 extension unit has
been created.
Figure 32: ZVAX24 front and rear view
Located beneath the ZVA network analyzer it is easily connected via some few cables.
The extension unit is completely remotely controllable, and an appropriate Graphical
User Interface is available within ZVA firmware.
Following options are available to be built into the extension unit:
Hardware extensions available for ZVAX24
Function
Purpose
Option type
Combiner
Generation of 2-Tone signals for intermodulation
measurements
ZVAX-B211
Harmonic filters
For extended dynamic range and spurious testing
ZVAX-B25x
x = 1, 2, 3
Pulse modulators
Directional
couplers
1MA127_2e
To generate pulsed signals for pulsed mode measurements,
simple pulse trains can be generated from ZVA-K27, more
sophisticated ones can be fed in from external equipment
ZVAX-B27x
Power couplers up to 43 dBm as replacement for ZVA
internal couplers for high power S-parameter measurements
ZVAX-B29x
x = 1, 2, 3
x = 1, 2
Rohde & Schwarz Overview of Tests on Radar Systems and Components
33
Following additional information is available related to the hardware extension base
unit ZVAX24 and its options:
X
Detailed product description and order numbers of the products ZVAXB2xx in the product brochure of ZVA, Ref. [7], pg. 18 and 25
X
Article about the functionality of the extension unit, Ref. [6]
- Mechanical integration
Passive radar applications need outdoor measurements with car mounted equipment.
This is along with field test or signal collection applications. For this purpose it is useful
to put the instrument combination into a portable rack as shown in Fig. 33 before
mounting into a vehicle.
19 inch rack integration
(1 U = 1.75„“ )
4U
12 U
6U
2U
Figure 33: ZVA / ZVAX24 mounted in a 19” portable rack
The rack system as applied for the R&S UCS calibration system is available either via
http://www.knuerr.ch (“INCAS”-System) or ask your local R&S dealer for a quotation
on the R&S material-number 3522.1178.00 As shown in Fig. 33 there are still 4 Us
remaining at the top which can be used for instance to build in an external signal
generator or other special equipment.
By means of this configuration functional groups 1 to 4 of the radar system according
to Fig. 29 can be tested either in indoor or outdoor / field applications.
1MA127_2e
Rohde & Schwarz Overview of Tests on Radar Systems and Components
34
Substitution of a Signal Generator for radar Components
During development of radar systems, signal generators can be very useful for
detecting trouble spots in the system. A few applications are described in this section.
For example, one can replace the stable local oscillator (STALO) with a signal
generator featuring extremely low phase noise such as the R&S SMB100A (or even
better, the R&S SMA100A) in order to check to what extent the STALO has a negative
influence on the system performance due to its (presumably higher) phase noise, as
shown in Fig. 34. The signal generator can also be used for testing the entire receiver
part, i.e. when the exciter is not available.
Figure 34: Using the R&S SMA100A or R&S SMB100A as a substitute for STALO
The entire transmitter unit in a radar system (except for the power amplifier) can be
replaced with the R&S SMU200A vector signal generator capable of complex
modulation signal generation capability to determine whether there are any problems in
the signal processing, Fig. 35.
With pulse radar systems (without pulse compression) or when using linear FM chirp
modulation with frequency deviations up to a maximum of 40 MHz, the R&S SMF
microwave generator is suitable for use up to the highest RF frequencies (–43.5 GHz).
The frequency multipliers R&S SMZ75/90/110 increase the frequency range up to
75/90/110 GHz respectively.
1MA127_2e
Rohde & Schwarz Overview of Tests on Radar Systems and Components
35
Figure 35: R&S SMU200A as a substitute for an exciter
Figure 36: R&S SMF100A up to 43.5 GHz as a substitute for an exciter
The receiver unit in a radar system can be tested separately based on complex
receiving scenarios. Useful instruments here include the R&S AFQ100A I/Q
modulation generator in conjunction with the R&S SMU200A or R&S SMJ100A vector
signal generator, allowing generation of very broadband signals (up to 200 MHz RF
bandwidth) as well as very long signal sequences (up to 1 Gsample of memory) (Fig.
37).
1MA127_2e
Rohde & Schwarz Overview of Tests on Radar Systems and Components
36
Figure 37: Receiver testing using complex waveforms
1MA127_2e
Rohde & Schwarz Overview of Tests on Radar Systems and Components
37
The R&S AFQ100A makes it possible to test the baseband receiver unit separately
from the rest of the radar system by using broadband and very long sequences (realworld signals).
Figure 38: Testing long real-world scenarios using the R&S AFQ100A
1MA127_2e
Rohde & Schwarz Overview of Tests on Radar Systems and Components
38
5 Overview - R&S Radar related Products
Radar Test Requirement
General Tests
S-Parameter Tests
Signal Generation and Evaluation in
different products :
Signal Generation and Evaluation
combined in one product :
Signal Generation:
Vector Network Analyzer (ZVA..)
* analog
* 1-port to N-port
* vector-modulated
* frequency range
Signal Evaluation:
Hardware Extension (ZVAX24)
* power probe
* spectrum / signal analyzer
* Combiner
* oscilloscope (baseband-analysis)
* Pulse Modulation / Demod.
* Harmonic Filters
* Directional Couplers
Figure 39: R&S radar product portfolio classification
The R&S product portfolio can be generally subdivided into two main groups as
indicated in Fig. 39. The "General Test" group on the left is generators and receivers or
power probes. They are clearly targeted either for signal generation or for signal
evaluation. In contrast, Network analyzer-Products, shown on the right, always include
at least one generator and at least one receiver in a single box. This property of
combined generators and receivers makes them applicable for further radar
measurements beyond basic s-Parameter tests, for instance intermodulation or noise
figure measurements. In the upcoming paragraphs the products for "General Tests"
are discussed first, followed by network analyzer as applied for radar tests.
Additionally there is the RTO which can be used for UWB signal analysis, multichannel coherent testing applications, and multiband coherent analysis systems.
1MA127_2e
Rohde & Schwarz Overview of Tests on Radar Systems and Components
39
Radar Signal Generation
Radar Signal Evaluation
110 GHz
2.7 mm
75 GHz
75 GHz 4.0 mm
V
4.0 mm
60 GHz
50 GHz 6.0 mm
SMF, 43.5 GHz
FSU
using -B21
& FS-Z110,
110 GHz
W
Extension
SMZ
50-110 GHz
SMB100A, 40 GHz
FSU,
67 GHz
5.0 mm
Q
40 GHz
7.5 mm
FSV, 40 GHz
NRP-Z8x, 40 GHz
FSVR, 40 GHz
KA
27 GHz
1.11 cm
FSW,
26.5 GHz
K
18 GHz
1.67 cm
KU
SGS100A,
12.5 GHz
12 GHz
2.5 cm
3.75 cm
SMU, 6 GHz
15 cm
L
1 GHz
Realtime Spectrum Analysis
S
2 GHz
FSV-K7 + RTO
Phase Coherence (B90)
Pulse Sequencer (K6)
Phase Coherence (B90)
Pulse Sequencer (K6)
7.5 cm
Pulse Evaluation (NRPV)
C
4 GHz
Pulse Measurement Application (FSW-K6)
8 GHz
SMBV, 6 GHz
Phase Coherent Input/Output (K90)
Pulse Generation (K21, K22, K23, K27)
Pulse Train (K3, K23, K27)
X
30 cm
UHF
300 MHz
1m
Figure 40: General test equipment for radar applications
Fig. 40 provides an overview of important radar related products offered by R&S. The
figure consists of three different areas. The standard radar frequency bands are shown
in the center along with the appropriate frequencies and wavelengths. The grey
shaded area on the left includes important R&S products to generate radar signals.
The grey shaded area on the right shows products to evaluate radar signals. Each
product family is represented by a white vertical bar. The height of each bar is useful to
get the appropriate radar bands to be covered by the specific product family. By means
of the dashed lines, provided as reading aids, the radar bands covered by each
product family can be seen. For instance the FSV family can be used to evaluate radar
signals starting from the UHF band up to the KA-band ending at 40 GHz. For the sake
of clarity the height of the product bars shows the total frequency range of the specific
product family only.
The green and red colored vertical bars within the product families show the availability
of following important radar related features
1MA127_2e
•
pulse modulation capability either in generating or evaluating radar signals
(green bars
•
generating phase coherent signals (red bars)
•
Real-time spectrum analysis with spectrum tracking over time (blue bar)
Rohde & Schwarz Overview of Tests on Radar Systems and Components
40
Pulse modulation is needed for all radar applications in order to optimize signal-tonoise ratio, detailed information is provided in the white paper 1MA207. Phase
coherent signals are needed for steering antenna arrays as used in beamforming
applications within AESA radar systems, chapter 4.9 of this document provides more
details. The height of the green and red bars is indicating again the appropriate
frequency range and thus the radar band to be covered. Hence, the radar X-band,
important for defense applications, is covered by generator products SMF, SMB100A
and the SGS100) along with their pulse modulation capabilities. On the evaluation
side at the right of the diagram all three product families such as NRP-Z81, FSW and
FSV can cover the radar X-band along with the appropriate pulse evaluation capability.
In order to define a radar test configuration following three steps are recommended in
a first approach according to Fig. 40:
1. select the radar band to be covered using the vertical bar at the center of the
diagram
2. pick one of the 4 products from the left for radar signal generation, by selecting the
smallest possible frequency model
3. pick one of the 4 products from the right for radar signal evaluation, again selecting
smallest frequency
4. the risetime of the signal of interest dictates the vector bandwidth required on the
signal generation and analysis tools
Due to different technical concepts there are different investment costs in between the
various solutions. For instance NRP-Z81 is a power probe with pulse evaluation
capability. In contrast the two products FSW and FSV are spectrum analyzers are
based on frequency converting technologies, where a down-converted intermediate
frequency signal is post processed by fast DSPs after being A/D converted. Different
technologies also make different prices. When taking NRP-Z81 as price reference of 1,
we come to a price relationship of roughly 6:1 for FSW and roughly 5:1 for FSV
compared to NRP-Z8x. radar applications based on NRP-Z8x therefore can be
considered as lowest price entry point into radar test technology.
Beyond the so far mentioned radar flag-ship products, there are some additional
products available for special radar applications which are not shown in Fig. 40. For
instance when signal sources need to be tested in terms of phase noise the FSUP
family is highly suitable; refer to the product pages at the end of this application note.
For radar applications which always needs signal generation and evaluation at the
same time, Network Analyzers and Test Systems are available as outlined in the
subsequent text.
1MA127_2e
Rohde & Schwarz Overview of Tests on Radar Systems and Components
41
Vector Network Analyzers and Tests Systems for radar applications
Providing signal generation and evaluation at the same time is unique feature of radar
test solutions introduced in this chapter. Due to their independent generators and
receivers, Network Analyzers can be considered as small test systems, they provide
•
signal generation according to radar requirements in terms of level and
frequency range
•
signal evaluation
•
flexible in terms of hardware extension options
•
powerful software control capability either internal or external
In addition to standard test instruments R&S offers complete radar test system
solutions, providing the instrumentation hardware along with additional benefits as
follows
• Test software, provided either as user-extendable source code or fully
operational
•
support in terms of on-site-installation, training and hotline; extendable
by contract
•
User tailored application specific hardware
For application specific hardware various platforms such as TSVP and OSP are
available. Both are highly configurable and can be equipped either with standard
options or by user-specific hardware. In the latter case the user don't has to take care
four control interfaces, housing and power supply.
Currently there are two radar related test systems offered by R&S:
•
RF frontend tester TS6600
•
TRM module tester TS6710
Further details on both test systems are provided on the R&S homepage using the
search tags “TS6600” and “TS6710” (*)
(*) tested on http://www2.rohde-schwarz.com at June 21th, 2012
1MA127_2e
Rohde & Schwarz Overview of Tests on Radar Systems and Components
42
6 R&S Instruments for Radar Applications
R&S SMF100A Microwave Generator: Special Features for radar Applications
X
1 GHz to 22 GHz or 43.5 GHz
X
Extremely low phase noise and high rejection of harmonic and spurious
signals
X
Fast frequency and level setting times
X
RF output up to +16 dBm (optionally up to +25 dBm)
X
Flexible generation of single or double pulses and pulse trains
X
Optional pulse modulator has on/off ratio greater than 80 dB, rise/fall times
of <10 ns, and a minimum pulse width of 20 ns
http://www2.rohde-schwarz.com/product/SMF100A.html
1MA127_2e
Rohde & Schwarz Overview of Tests on Radar Systems and Components
43
R&S SMA100A Signal Generator: The Perfect Substitute for Local Oscillators
X
9 kHz to 3 GHz or 6 GHz
X
Lowest SSB phase noise up to 6 GHz (typ. –140 dBc/Hz at 1 GHz with 20
kHz offset)
X
Optional high-performance pulse generator and standard pulse modulator
offer better than 80 dB on/off ratio, 20 ns rise/fall time and 20 ns pulse
widths
http://www2.rohde-schwarz.com/product/SMA100A.html
1MA127_2e
Rohde & Schwarz Overview of Tests on Radar Systems and Components
44
R&S SMU200A Vector Signal Generator: Versatile Wideband Digital Modulation
X
RF up to 6 GHz
X
Optional second RF path up to 3 GHz
X
Up to two internal baseband generators
X
Versatile internal digital modulation
X
I/Q modulator with 200 MHz RF bandwidth
X
Pulse modulator
X
Very low SSB phase noise
X
Very high level repeatability of 0.05 dB
X
High output power up to +19 dBm (PEP), overrange +26 dBm
http://www2.rohde-schwarz.com/product/SMU200A.html
1MA127_2e
Rohde & Schwarz Overview of Tests on Radar Systems and Components
45
R&S SMBV100A Vector Signal Generator: Signals for today and tomorrow
X
RF up to 6 GHz
X
Maximum output level up to 18 dBm and up to 24 dBm in the overrange
X
Wide RF signal bandwidth of up to 120/500 MHz w. internal/external
generators
X
High flexibility in generating arbitrary signals
X
Phase coherence option (B90)
X
Pulse modulator / generator (K22/K23)
X
Pulse sequencer software (K6)
http://www2.rohde-schwarz.com/product/SMBV100A.html
1MA127_2e
Rohde & Schwarz Overview of Tests on Radar Systems and Components
46
R&S RTO Family of Digital Oscilloscopes
X
Bandwidth up to 4 GHz
X
Optional logic analysis extension with mixed signal capability
X
Digital trigger system operating in realtime
X
High trigger sensitivity at full bandwidth
X
Triggering and decoding of serial protocols
X
Generic I/Q-Interface for external signal analysis (K11)
X
Various types of probes:
- active probe up to 3 GHz
- active differential probe
- current probe
http://www2.rohde-schwarz.com/product/RTO.html
1MA127_2e
Rohde & Schwarz Overview of Tests on Radar Systems and Components
47
R&S SMU-K6 Pulse Sequencer Software
X
Standalone PC-based application
X
Intuitive user interface with integrated waveform display and analysis
X
Build pulse and sequence libraries
X
Set any pulse parameter and add modulation such as AM, FM, PM, digital
modulation, chirps
X
Independently vary pulse parameters by applying jitter
X
Plug-ins allow the user to add proprietary/classified pulse content
X
Batch build multiple sequences and assemble multi-segment waveforms
X
Transfer waveforms to instrument
X
Also available for R&S SMBV, R&S SMJ, R&S AMU and R&S AFQ
http://www2.rohdeschwarz.com/en/products/test_and_measurement/signal_generation/SMUK6.html
1MA127_2e
Rohde & Schwarz Overview of Tests on Radar Systems and Components
48
AFQ 100A Arbitrary Waveform Generators: Meeting New Challenges in radar
Baseband Signal Generation
X
Variable clock rate up to 300 MHz
X
Maximum I/Q bandwidth of up to 100 MHz for an RF bandwidth of 200
MHz
X
Ideal for generation of complex wideband radar signals with the R&S SMU
X
Long signal duration – 256 Msample or 1 Gsample
X
Analog I/Q outputs (balanced and unbalanced)
X
Optional digital outputs
http://www2.rohde-schwarz.com/product/AFQ100A.html
1MA127_2e
Rohde & Schwarz Overview of Tests on Radar Systems and Components
49
R&S NRP2 Power Meter: Handles up to Four Power Sensors
R&S NRP-Z51/55 Power Sensor: Thermoelectric Accuracy at Its Best
X
X
X
X
X
DC to 40/50 or 67 GHz
Measures average power with best possible accuracy
Measurement range 1 µW to 100 mW
correction to reduce matching errors
Operation of sensor directly from PC via USB interface
http://www2.rohdeschwarz.com/en/products/broadcasting/broadcasting_measurement/NRPZ51.html
1MA127_2e
Rohde & Schwarz Overview of Tests on Radar Systems and Components
50
R&S NRP-Z81/85/86 Power Sensor: The Sensor of Choice for Analysis of radar
Signals
•
Frequency range from 50 MHz to 18 or 40 GHz
•
Analysis of radar and communications signals up to 30 MHz RF bandwidth
(sensor rise time <13 ns)
•
Accurate continuous average power measurements on modulated and
unmodulated signals from –60 dBm to +20 dBm
•
Ultrafast statistical analysis (1 million point CCDF in 25 ms)
•
Operation of sensor directly from PC via USB interface
http://www2.rohdeschwarz.com/en/products/broadcasting/broadcasting_measurement/NRPZ81.html
1MA127_2e
Rohde & Schwarz Overview of Tests on Radar Systems and Components
51
R&S FSU Spectrum Analyzer Family: Models up to 67 GHz without External
Mixers
X
Models with upper frequency range of 3 GHz, 8 GHz, 26.5 GHz, 43 GHz,
46 GHz, 50 GHz, 67 GHz according to your needs
X
R&S FSU67 is the only spectrum analyzer to cover the frequency range up
to 67 GHz without external harmonic mixers and their inherent drawbacks
X
Instrument-controlled internal RF attenuator (0 dB to 75 dB in 5 dB steps)
eliminates the external, manually operated attenuator needed when
harmonic mixers are used
X
Reference level range (\130 dBm to +30 dBm) is much higher than
typically achievable with harmonic mixers
X
Unique choice for evaluating radar, electronic warfare, electronic
countermeasures and battle-field communications systems
X
Can make 80 measurements/s in manual mode and 70 measurements/s
including data transfer over IEC/IEEE 488 bus
X
Noise floor of –158 dBm at 1 GHz and –130 dBm at 65 GHz
X
Resolution bandwidth of 1 Hz to 50 MHz
X
Total measurement uncertainty <0.3 dB
X
Frequency resolution of 0.01 Hz
X
Low phase noise over entire measurement range
X
Can function as an RF power meter just by adding a sensor
X
Broad array of analysis options
http://www2.rohde-schwarz.com/product/FSU.html
1MA127_2e
Rohde & Schwarz Overview of Tests on Radar Systems and Components
52
R&S FSV40 Signal Analyzer: Vector Signal Analysis and Spectral Analysis in a
Single Instrument
X
Frequency range up to 3.6/7/13.6/30/40 GHz
X
40 MHz signal analysis bandwidth
X
0.4 dB level measurement uncertainty up to 7 GHz
X
–110 dBc (1 Hz) phase noise at 10 kHz frequency offset
X
Displayed average noise level (DANL) in 1 Hz bandwidth: –155 dBm at
1 GHz with R&S FSV-B24 preamplifier: – 162dBm at 30 GHz
®
X
+15 dBm third order intercept (TOI)
X
Removable hard drive for applications where security is a concern
X
Frequency range up to 110 GHz with external harmonics mixers
http://www2.rohde-schwarz.com/product/FSV.html
1MA127_2e
Rohde & Schwarz Overview of Tests on Radar Systems and Components
53
R&S FSW Signal and Spectrum Analyzer
Setting standards in RF performance and usability
X
Frequency range from 2 Hz to 8 GHz/13.6 GHz/26.5 GHz
X
Low phase noise of –137 dBc (1 Hz) at 10 kHz offset (1 GHz carrier)
X
–88 dB dynamic range (with noise cancellation) for WCDMA ACLR
measurements
X
Up to 160 MHz analysis bandwidth
X
< 0.4 dB total measurement uncertainty up to 8 GHz
X
High-resolution 12.1" (31 cm) touchscreen for convenient operation
X
Multiple measurement applications can be run and displayed in parallel
http://www2.rohde-schwarz.com/product/FSW.html
1MA127_2e
Rohde & Schwarz Overview of Tests on Radar Systems and Components
54
R&S FSVR40 Real Spectral Analysis and Spectrum Analysis in a Single
Instrument
X
Frequency range from 10 Hz to 7 GHz, 13.6 GHz, 30 GHz or 40 GHz
X
40 MHz real-time analysis bandwidth for:
- Spectrum with persistence function
- Spectrogram display
- Display of power versus time
X
Triggering on frequency masks
X
Measurement applications phase noise, noise figure, vector signal
analysis, etc.
X
Frequency range up to 110 GHz with external harmonics mixers
http://www2.rohde-schwarz.com/product/FSVR.html
1MA127_2e
Rohde & Schwarz Overview of Tests on Radar Systems and Components
55
R&S FSUP Signal Source Analyzer: Phase Noise Tester and High-End
Spectrum Analyzer in a Single Instrument
X
Frequency range up to 8/26.5/50 GHz
X
Up to 110 GHz with external mixers
X
Maximum flexibility in phase-noise measurements:
X
Phase-detector method
X
Phase-detector method with cross-correlation within full frequency rage
X
Spectrum analyzer method
X
Complete characterization of oscillators:
Phase noise
Transient response
Harmonics
X
Maximum sensitivity in phase-noise measurements
X
(e.g. at 1 GHz input frequency: –134 dBc (1 Hz) at 10 kHz offset)
http://www2.rohde-schwarz.com/product/FSUP.html
1MA127_2e
Rohde & Schwarz Overview of Tests on Radar Systems and Components
56
Vector Network Analyzers
The R&S ZVA series: Unparalleled measurement speed and accuracy
X
8, 24, 40, 50, 67, 80 or 110 GHz maximum measurement frequency
X
Up to four test ports
X
Industry-leading signal RF performance
X
Wide dynamic range for fast and accurate measurements
>135 dB at test port
>145 dB with direct receiver access
Segmented sweep increases speed, accuracy and dynamic range
X
X
Pulse profile measurement with 12.5 ns time resolution and up to 30 MHz
measurement bandwidth
X
Point in pulse measurements for pulse widths down to 450 ns
X
Parallel measurements up to four times faster
X
Two internal phase coherent sources for true differential measurements
X
Data transfer during sweeping
X
High-speed control of external components
X
Wide dynamic range and high sensitivity
>135 dB at test port, >145 dB with direct receiver access
<–115 dBm at test port, <–130 dBm with direct receiver access
The industry standard in pulse profile measurements
The R&S ZVA-K7 Pulsed Measurements option for the R&S ZVA and R&S ZVT
series VNAs employs wideband detection and fast data recording for pulse profile
measurements with high resolution at high speed.
http://www2.rohde-schwarz.com/product/ZVA.html
1MA127_2e
Rohde & Schwarz Overview of Tests on Radar Systems and Components
57
The R&S ZVT20: The first (and only) VNA with up to eight ports
X
300 kHz to 20 GHz
X
Up to eight ports
X
Dynamic range >120 dB
X
Output power >13 dBm on all ports
X
Power sweep range of –40 dBm to 13 dBm
X
Measurement speed of 8 ms for all ports
X
Simple configuration of multiport measurements
X
Unlimited number of channels and traces
X
Can simultaneously perform measurements on all ports of a device
http://www2.rohde-schwarz.com/product/ZVT20.html
1MA127_2e
Rohde & Schwarz Overview of Tests on Radar Systems and Components
58
7 Common Radar Abbreviations
Common radar Abbreviations
Abbreviation
Meaning
AESA
AEW
AFC
AGC
AM
APAR
ASR
ASR-S
Active Electronically Scanned Array
Airborne Early Warning
Automatic-Frequency-Control
Automatic Gain Control
Amplitude Modulation
Active Phase Array radar
Airport Surveillance radar
Airport Surveillance radar Mode-S (Mode S is an extension to
secondary radar. Mode S makes it possible to query additional
information, e.g. the speed of the aircraft.)
Air Traffic Control
Baseband radar Detection Sensor
Blind Spot Detection
Bandwidth (or Beamwidth)
Constant False Alarm Rate
Complementary Metal-Oxide Semiconductor
Coherent Local Oscillator
Digital Beam Forming
Direct Current ( or Discrete Circuit)
Direction of Arrival
Department of Defense
Digital Signal Processor
Digital Terrain Model
Device Under Test
Error Correcting Code
Electronic Counter-Countermeasures
Effective Isotropic Radiated power
Electronic Intelligence (electronic acquisition of radar parameters)
European Multifunction Phased Array radar
Electromagnetic Vulnerability
Electronically Steerable Array
Electronic Warfare Support Measures
Electronic Stability Program
Electronic Warfare
Fault Collection Unit
ATC
BARDS
BSD
BW
CFAR
CMOS
COHO
DBF
DC
DOA
DoD
DSP
DTM
DUT
ECC
ECCM
EIRP
ELINT
EMPAR
EMV
ESA
ESM
ESP
EW
FCC
1MA127_2e
Rohde & Schwarz Overview of Tests on Radar Systems and Components
59
Common radar Abbreviations
Abbreviation
Meaning
FCC
FCW
FFT
FMCW
FSK
FTLO
GaAs
GaN
GCA
HF
IF
LO
LO
LPI
LRR
LRU
MMIC
MTD
MW
NAFTA
NRIET
OTH
PA
PAR
PAR
PDF
PESA
PN
PRF
PRI
PRT
PSS
RADAR
RAM
Federal Communications Commission
Forward Collision Warning
Fast Fourier Transform
Frequency Modulated Continuous Wave
Frequency Shift Keying
Fast-Tracking Local Oscillator
Gallium Arsenide
Gallium-Nitride
Ground-Controlled Approach
High Frequency (3 - 30 MHz)
Intermediate Frequency
Local Oscillator
Low Observability
Low Probability of Intercept
Long Range radar
Line-Replaceable Unit
Microwave Monolithic Integrated Circuit
Moving Target Detection
Megawatt
North American market
Nanjing Research Institute of Electronic Technology
Over-The-Horizon
Power Amplifier
Phased-Array-radar
Precision Approach radar
Pulse Desensitization Factor
Passive Electronically Scanned Array
Pseudo-Noise
Pulse Repetition Rate or Frequency
Pulse Repetition Interval
Pulse Repetition Time
Predictive Safety System
Radio Detection and Ranging
Random Access Memory, radar Absorbing Material, Rolling
Airframe Missile, or Reliability, Availability and Maintainability
Resolution Bandwidth
radar Cross-Section
Range and Direction Finding
Ramp Slope
radar Warning Receiver
RBW
RCS
RDF
RS
RWR
1MA127_2e
Rohde & Schwarz Overview of Tests on Radar Systems and Components
60
Common radar Abbreviations
1MA127_2e
Abbreviation
Meaning
RX
SAM
SAR
SNR
SPI
SRR
SSPA
SSR
STALO
STAP
SWT
T/R
TBD
TRM
TWT
TX
UHF
ULA
UWB
VCO
VHF
VSA
Receive
Surface-to-Air Missile
Synthetic Aperture radar
Signal-to-Noise Ratio
Serial Peripheral Interface
Short Range radar
Solid-State Power-Amplifier
Secondary Surveillance radar
Stable Local Oscillator
Space-Time Adaptive Processing
Software-Timer
Transmit/Receive
Track-Before-Detect
Transmitter-Receiver Module
Traveling Wave Tube
Transmit
Ultra High Frequency
Uniform Linear Array
Ultra Wideband
Voltage Controlled Oscillator
Very High Frequency
Vector Signal Analyzer
Rohde & Schwarz Overview of Tests on Radar Systems and Components
61
8 References
Ref.Nr.
[1]
[2]
Bibliography / Sources
Merrill I. Skolnik (Editor in Chief), 1990, radar Handbook, Second Edition McGraw-Hill, ISBN
0-07-057913-X
Hiebel M., 2006, Fundamentals of Vector Network Analysis, Fourth Edition 2008,
ISBN 978-3-939837-06-0, PW 00002.6729.00
[3]
Rauscher C. , 2001, Fundamentals of Spectrum Analysis, First Edition,
PW 0002.6635.00
1MA127_2e
[4]
Bednorz, A Network Analyzer System for Pulse Profile Measurements,
http://www2.rohde-schwarz.com/file_3769/Pulse_profile_measurements_V2.pdf
[5]
Minihold, 2009, Pulsed radar power amplifiers, Rohde & Schwarz Application Note Nr.
1MA126, available from http://www2.rohde-schwarz.com
[6]
Henkel, 2010, Connect once and fully characterize active components, NEWS 200/10,
PD 5214.0718.72, pg. 18, available from http://www2.rohde-schwarz.com
[7]
R&S ZVA Vector Analyzer, High performance up to 110 GHz with up to four test ports,
Product Brochure, 09.00, Jan. 2011, PD 5213.5680.12,
available from http://www2.rohde-schwarz.com
[8]
Braunstorfinger, 2009, Phase Adjustment of Two MIMO Signal Sources, Rohde & Schwarz
Application Note Nr. 1GP67 along with Phase Tracker Software,
available from http://www2.rohde-schwarz.com
[9]
Friedrich N.(Editor in Chief),2011, Airborne radar, Microwaves & RF, June 2011, pg. 38 - 43
[10]
Browne J., 2011, Tracking The Evolution Of radar, Microwaves & RF, June 2011, pg. 52 - 56
[11]
Schneider M., 2005, Automotive radar – Status and Trends, GeMiC, 2005, pg. 144 – 147,
Robert Bosch GmbH, Corporate Research, PO box 77 77 77, D-31132 Hildesheim, GE
[12]
Reuter R., 2011, 77 GHz radar Solutions, FTF Freescale Technology Forum, Powering
Innovations June 2011
[13]
Makowitz R. and Reuter R., 2012, 77-GHz-radar-Sensorsysteme, Automotive, März/April
2012, pg. 20 - 23
[14]
Agilent Technologies, 2004 Fundamentals of RF Pulse Analysis using a Spectrum
Analyzers
[15]
Wikipedia.org, 2012, radar, available from http://en.wikipedia.org/wiki/radar sampled at May
14th, 2012
[16]
Wikipedia.org, 2012, Active Electronically Scanned Array, available from
http://en.wikipedia.org/wiki/Active_Electronically_Scanned_Array sampled at May 14th, 2012
[17]
Wikipedia.org, 2012, Stealth Technology, available from
http://en.wikipedia.org/wiki/Stealth_technology sampled at May 14th, 2012
Rohde & Schwarz Overview of Tests on Radar Systems and Components
62
Ref.Nr.
1MA127_2e
Bibliography / Sources
[18]
Wendler W., 2009, Signalquellenanalysator R&S FSUP mit neuen Messfunktionen, NEUES
199/09, pg. 40-41, PD 5214.0701.71 available from http://www2.rohde-schwarz.com
[19]
Wendler W., 2010, It detects everything: the R&S FSVR, NEWS 202/10, pg. 15 – 17, PD
5214.3775.72, available from http://www2.rohde-schwarz.com
[20]
Wendler W., 2011, The R&S FSVR real-time spectrum analyzer, NEWS 203/11, pg. 50 - 51
PD 5214.3781.72, available from http://www2.rohde-schwarz.com
[21]
Thümmler F.-W., 2011, R&S SMB100A generator, NEWS 203/11, pg. 42 – 43, PD
5214.3781.72, available from http://www2.rohde-schwarz.com
[22]
El Assir R. and Lörner M., 2011, RF generator, NEWS 204/11, pg. 33 – 35, PD
5214.3798.72, , available from http://www2.rohde-schwarz.com
[23]
Geltinger J., 2011, USB power sensors on the PC, NEWS 204/11, pg. 22 – 25, PD
5214.3798.72, , available from http://www2.rohde-schwarz.com
[24]
Thümmler F.-W., 2011, Frequency multiplier family, NEWS 204/11, pg. 36 – 37, PD
5214.3798.72, , available from http://www2.rohde-schwarz.com
[25]
Braunstorfinger T., 2009, HF-Signalgenerator R&S SMA100A, NEWS 199/09, pg. 48 – 49,
PD 5214.0701.71 available from http://www2.rohde-schwarz.com
[26]
Kraemer W., 2009, Signalgenerator R&S SMF100A, NEWS 199/09, pg. 42 – 43, PD
5214.0701.71 available from http://www2.rohde-schwarz.com
[27]
Wenzel S., 2010, modular broadband amplifiers, NEWS 201/10, pg. 28 – 31, PD
5214.3769.72 available from http://www2.rohde-schwarz.com
[28]
Leffel M, 2011, Pulse Train Master for SigGens, Rohde & Schwarz Application Note Nr.
1MA148 available from http://www2.rohde-schwarz.com
[29]
Breuer P. and Bin Rahim F., 2011, Aeronautical radio navigation meas. solutions, Rohde &
Schwarz Application Note Nr. 1MA193 available from http://www2.rohde-schwarz.com
[30]
Ramian Dr.F., 2011, Real Time Spectr. Analysis / White Paper, Rohde & Schwarz
Application Note Nr. 1EF77 available from http://www2.rohde-schwarz.com
[31]
Ramian Dr. F., 2010, External Mixers to extend freq. range, Rohde & Schwarz Application
Note Nr. 1EF75 available from http://www2.rohde-schwarz.com
[32]
Tröster C., 2010, Easy generation of wideband signals, Rohde & Schwarz Application Note
Nr. 1GP75 available from http://www2.rohde-schwarz.com
[33]
PDF-datasheet of product type “MAPS-010163”, downloaded from
https://www.macomtech.com at June 21th, 2012
[34]
R&S FSW-K6 Pulse Measurement Option, User Manual, 2012,
R&S order-nr 1173.9392.02 a 04
Rohde & Schwarz Overview of Tests on Radar Systems and Components
63
About Rohde & Schwarz
Rohde & Schwarz is an independent group
of companies specializing in electronics. It is
a leading supplier of solutions in the fields of
test and measurement, broadcasting,
radiomonitoring and radiolocation, as well as
secure communications. Established more
than 75 years ago, Rohde & Schwarz has a
global presence and a dedicated service
network in over 70 countries. Company
headquarters are in Munich, Germany.
Environmental commitment
X
Energy-efficient products
X
Continuous improvement in
environmental sustainability
X
ISO 14001-certified
environmental management system
Regional contact
Europe, Africa, Middle East
+49 89 4129 12345
[email protected]
North America
1-888-TEST-RSA (1-888-837-8772)
[email protected]
Latin America
+1-410-910-7988
[email protected]
Asia/Pacific
+65 65 13 04 88
[email protected]
China
+86-800-810-8228 /+86-400-650-5896
[email protected]
This application note and the supplied
programs may only be used subject to the
conditions of use set forth in the download
area of the Rohde & Schwarz website.
R&S® is a registered trademark of Rohde & Schwarz
GmbH & Co. KG; Trade names are trademarks of the
owners.
Rohde & Schwarz GmbH & Co. KG
Mühldorfstraße 15 | D - 81671 München
Phone + 49 89 4129 - 0 | Fax + 49 89 4129 – 13777
www.rohde-schwarz.com