1
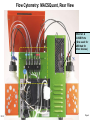
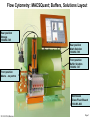
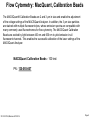
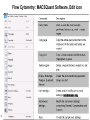
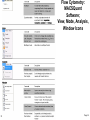
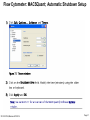
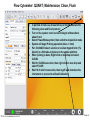
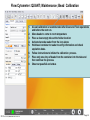
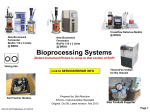
Logon: Admin/rewind (delete this banner before publishing) Link to Bio-Rad Bio-Plex 200 Array Reader/ Flow Cytometer Flow Cytometers Sorting/Analysis MACSQuant Analyzer at BRDG park Select instrument picture to jump to that section of the SOP Prepared by: Bob Morrison STLCC- Instrumentation Specialist Original Sep 10, Latest revision July 2012 STLCC-CPLS;Morrison 9/10/2014 autoMACS Pro Separator at BRDG park Page 1 Flow Cytometer: MACSQuant Analyzer If Standby LED is amber, device is “on”, touch screen to resume operations Master On/Off toggle switch The MACSQuant® Analyzer is a compact benchtop flow cytometer that is small in size but big in performance. The instrument can fit into confined laboratory spaces, including laminar flow cabinets. In spite of this extraordinary compact design (60 x 35 x 40 cm), the MACSQuant Analyzer offers many outstanding features, including: Stable optics: three robust lasers (violet, blue, red) are secured unto the optical bench Absolute cell counting: exact volumetric pipetting using the robotic arm Multiparameter flow analysis: seven fluorescence and two scatter channels Flexible: wide choice of fluorochromes may be used for multicolor cell characterization MACSQuant and autoSeparator @BRDG R126B Hotlink to MACSQuant technical sheet… pdf Lauren Handley, PhD (sales) [email protected] Robert Wegener (field service rep) [email protected] Hotlink to MACSQuant Software free 30-day trail … STLCC-CPLS;Morrison 9/10/2014 Page 2 Flow Cytometry: MACSQuant Manuals and QuickStart Guides Hotlink to MACSQuant User Manual ….. Pdf (18mb) Hotlink to MACSQuant Instrument Setup QuickStart Hotlink to MACSQuantify Version 2.4_2.5 Updates Hotlink to MACSQuantify Version 2.5 New Features ….. Pdf (1mb) ….. Pdf (1mb) ….. Pdf (1mb) Hotlink to MACSQuant Photomultiplier Tube Calibration QuickStart Hotlink to MACSQuant Icons and Edit Menu QuickStart ….. Pdf (<1mb) ….. Pdf (<1mb) Hotlink to MACSQuant Compensation of Spectral Overlap QuickStart ….. Pdf (<1mb) Hotlink to MACSQuant Setting Up an Experiment QuickStart ….. Pdf (<1mb) Hotlink to MACSQuant Automated Labeling and Multisample Quickstart…..pdf Hotlink to MACSQuant and autoMACS Separator Supply Inventory Database Hotlink to MACSQuant and Separator Maint Contract 2012 ($20K/yr) Fwd… pdf STLCC-CPLS;Morrison 9/10/2014 Page 3 Flow Cytometry: MACSQuant Specifications STLCC-CPLS;Morrison 9/10/2014 Page 4 Flow Cytometry: MACSQuant; Key Components If Standby LED is amber, device is “on”, touch screen to resume operations Barcode Reader On/Off Toggle STLCC-CPLS;Morrison 9/10/2014 Page 5 Flow Cytometry: MACSQuant, Rear View Ethernet & 2 USB Ports ( One used for USB hub for other devices) STLCC-CPLS;Morrison 9/10/2014 Page 6 Flow Cytometry: MACSQuant; Buffers, Solutions Layout Rear position Storage 130-092-748 Rear position Wash Solution 130-092-749 Front position Buffer Solution 130-092 -747 Front position Waste - no partno Not Shown Clean/Flush Bleach 130-093-663 STLCC-CPLS;Morrison 9/10/2014 Page 7 Flow Cytometer: MACSQuant; Buffers and Solutions STLCC-CPLS;Morrison 9/10/2014 Page 8 Flow Cytometry: MacQuant, Calibration Beads The MACSQuant® Calibration Beads are 2 and 3 μm in size and enable the adjustment of the voltage settings of the MACSQuant Analyzer. In addition, the 3 μm size particles are stained with multiple fluorescent dyes, whose emission spectra are compatible with many commonly used fluorochromes for flow cytometry. The MACSQuant Calibration Beads are excited by light between 400 nm and 650 nm to yield emission in all fluorescent channels. This enables the successful calibration of the laser settings of the MACSQuant Analyzer. MACSQuant Calibration Beads - 100 test PN : 130-093-607 STLCC-CPLS;Morrison 9/10/2014 Page 9 Flow Cytometry: Macquant, Columns The MACSQuant® Columns are specifically designed for the use with the MACS® Cell Enrichment Unit, which is integrated on the MACSQuant Analyzer. The MACSQuant Columns provide the ability to perform flow cytometric analysis of rare cell populations in a fraction of the time. Magnetically and fluorochrome labeled cells are preenriched in the MACSQuant Column when the magnet in the MACS Cell Enrichment Unit is activated immediately prior to cell analysis. The entire process of sample labeling, preenrichment and flow cytometry analysis is fully automated by the MACSQuantify™ Software. MACSQuant Columns Components - 2 MACSQuant Columns PN: 130-094-458 STLCC-CPLS;Morrison 9/10/2014 Page 10 Flow Cytometer: MACSQUANT; Top Menu Bar STLCC-CPLS;Morrison 9/10/2014 Page 11 Flow Cytometry: MACSQuant Software, Tool bar icons STLCC-CPLS;Morrison 9/10/2014 Page 12 Flow Cytometry: MACSQuant Software, File icon STLCC-CPLS;Morrison 9/10/2014 Page 13 Flow Cytometry: MACSQuant Software, Edit icon STLCC-CPLS;Morrison 9/10/2014 Page 14 Flow Cytometry: MACSQuant Software; View, Mode, Analysis, Window Icons STLCC-CPLS;Morrison 9/10/2014 Page 15 Flow Cytometer: MACSQuant; Manual Shutdown STLCC-CPLS;Morrison 9/10/2014 Page 16 Flow Cytometer: MACSQuant; Automatic Shutdown Setup STLCC-CPLS;Morrison 9/10/2014 Page 17 Flow Cytometer: QUANT; Maintenance; Clean, Flush 1. 2. 3. 4. 5. 6. 7. 8. STLCC-CPLS;Morrison 9/10/2014 In periods of non-use, at least once per month, execute the following clean and flush protocol Turn on the system, touch screen to begin software boot, about 3 min Select Power/Mode symbol, then switch to Acquisition mode System will begin Priming operation (takes < 3min) Put .5ml MACS bleach solution or sodium hypochlorite (1% bleach) in a 5ml tube and place on the uptake platform. When priming is done, Right click on teardrop and select CLEAN Wait for CLEAN execution, then right click on tear-drop and select FLUSH Wait 10-16 min for execution, then logoff and shutdown the instrument or proceed to a Bead Calibration Page 18 Flow Cytometer: QUANT; Maintenance; Bead Calibration 1. 2. 3. 4. 5. 6. 7. 8. STLCC-CPLS;Morrison 9/10/2014 A bead calibration is recommended after Clean and Flush operations and before the next run. Allow beads to come to room temperature Place a clean empty tube at the holder location Activate barcode reader from the icon above Hold bead container to reader to verify information and check expiration dates. Follow instructions to initiate the calibration process. Place only one drop of beads from the container into the tube and then continue the process. Observer pass/fail and status Page 19 Flow Cytometry: MACQUANT; Monthly Clean, Flush, Calibration Recommended Robert Wegener [email protected] sent Mon 4/25/2011 12:31 PM I don’t have a formal document, but my understanding is that a system that is only occasionally used should be turned on and run at least once a month to help minimize clogging. The run should at least include running of the calibration beads, which involves selecting Express from the Experiments tab and then Setup and Calibration. The result screen should have all green check marks, and no red Xs. After power up, a CLEAN should be run, and then a FLUSH after that. When that is done, run calibration beads, after that is completed, then select Instrument Off with the mouse. The system will shutdown properly. Not really a need to hit the on/off button on the side of the system. Just touch the screen to turn it on. I hope this email isn’t too convoluted. Basically once a month turn on the system and run CLEAN, then FLUSH, then Calibration Beads, then Instrument Off. Without the bar code reader, running the calibration beads has a few more steps in the process to prepare the sample tube with beads. You could pipette 1 ml of buffer into a sample tube, add a drop of beads and vortex them, and do Express, Setup, Calibration, or you could use the system to add buffer and mix the beads by following these instructions from the Help Menu on the system: Pages 56 and 57, Chapter 3.6.2 in the User Manual describes the manual calibration procedure too. Custom mode users and administrators can perform manual calibration. Note: Calibration beads must be pre-diluted and mixed before performing this procedure. The MACSQuant Analyzer can perform predilution and mixing of calibration beads. Setting the dilution and mixing of the calibration beads prior to calibration Dilution of the calibration beads can be performed by the MACSQuant Analyzer. 1) Select the Autolabel tab within the Experiment tab. 2) Click <add…>. This will introduce a Reagent dialog box. 3) Select S1 or S2 and prebuffer and adjust the dilution appropriately, for example, 10:1 with no incubation time. Click Apply. 4) Depending on the above settings, click the radio button Buffer A or Buffer B in the Autolabel menu. Manual calibration 1) In the Custom mode, select the Experiment tab on the left side of the screen. Figure 3.38 Setting-up calibration in Custom mode using the Express option (radio button). 2) 3) 4) Select the Settings tab in the lower section of the panel and click on the Express radio button. Click the Type pull-down list and select Setup. Similarly, choose Calibration from the Mode pull-down list. Click on the Start Measurement button, . This will start the calibration process. STLCC-CPLS;Morrison 9/10/2014 Page 20 Flow Cytometer: Quant, Maintenance, Oct 2012 From: Robert Wegener [mailto:[email protected]] Sent: Wednesday, October 10, 2012 7:33 PM To: Boedeker, Elizabeth D. Subject: RE: Automacs Pro serial number 785 ETA Update Hello Betsy, Here is the report on the recently completed annual preventive maintenance protocol for your Automacs Pro serial number 0785. Due to the low number of separations on this unit for the past year, many parts did not need to be replaced. These new parts that did not need to be put into the system, belong to you, and were put in the Automacs drawer by the system. During this coming year, on the rare occasion this system encounters an error, these parts will be accessible for you to use if necessary. The system passed all the protocol tests, now has the latest software, and continues to run within our quality control specifications. I will look forward to the next visit in the near future, when it will be time for the preventive maintenance protocol to be done on the MacsQuant. Thanks for having me in your lab,. See you again in the near future. Thanks. Kind Regards, Robert Wegener Field Service Engineer Instrument Service Hot Line: 866-426-1194 Instrument Service Email: [email protected] Miltenyi Biotec, Inc. 2303 Lindbergh Street Auburn, CA 95602 Hotlink to MACSQuant Service report for this period. www.miltenyibiotec.com STLCC-CPLS;Morrison 9/10/2014 Page 21 Flow Cytometry: MACQuant; Real time Hardware Monitor (access via View menu) STLCC-CPLS;Morrison 9/10/2014 Page 22 Flow Cytometry: autoMACS Pro Separator, Magnetic The Cell Sorting autoMACS® Pro Separator is a benchtop instrument for high-speed automated magnetic cell sorting of multiple samples under standardized conditions. Designed for the selection of target cells in a fully automated, walk-away fashion. It combines all the benefits of the proven autoMACS Technology with novel features such as automated magnetic labeling and the sensorcontrolled processing of multiple samples. The instrument is operated via touchscreen and intuitive screen menus. At the click of a button, multisample labeling and cell separation is performed, minimizing hands-on time. Sample integrity is also maintained by use of MACS Cooling Tube Racks that allow for cooling of samples and eluated fractions. With its compact size, the autoMACS Pro Separator easily fits into a standard laminar flow hood or safety cabinet. Autolabeling – fully automated magnetic labeling of samples. Multisample processing – up to 6 samples can be processed in a single batch. Versatile – compatible with more than 250 MACS® Cell Separation Reagents. Gentle – MACS Technology and Cooling Tube Racks sustain cell viability. Advanced – sensor-controlled process for safe operation and easy monitoring of the instrument status, even from a distance. STLCC-CPLS;Morrison 9/10/2014 MACS® MiniSampler, MACS Chill Rack 15, and MACS Reagent Rack 4 Page 23 Flow Cytometry: autoMACS Pro Separator, Magnetic Cell Sorting, User Manuals and Guide Hotlink to autoMACS Pro Separator User Manual ….. Pdf (5mb) Hotlink to autoMACS Pro Separtor QuickStart STLCC-CPLS;Morrison 9/10/2014 ….. Pdf (<1mb) Page 24 Flow Cytometry: autoMACS Separator Solutions STLCC-CPLS;Morrison 9/10/2014 Page 25 Flow Cytometer: autoMACS Pro Service Report Oct 2011 Hotlink to autoMACS Pro Service Protocol Report 5 pgs. Oct 2011 STLCC-CPLS;Morrison 9/10/2014 Page 26 Flow Cytometer: Quant, Maintenance Contract 2012 From: Noah Keefer [mailto:[email protected]] Sent: Tuesday, June 05, 2012 3:27 PM To: Lauren Handley; Boedeker, Elizabeth D. Subject: RE: MACSQuant Stuff Dear Elizabeth Boedeker, Miltenyi Biotec Inc. is pleased to provide you with a quote for Premium service agreements covering your autoMACS Pro unit #0785 and MACSquant unit #2255. The current service agreements for your units are set to expire on 12/31/2012. This agreement will provide you with planned maintenance and technical support that will ensure reliability, productivity, and consistency when utilizing your Miltenyi Biotec instrument. The attached quote was prepared for you at the request of your technical sales consultant, Lauren Handley, if you have any questions please feel free to contact us. With kind regards, Noah Keefer Field Service Support 1.866.426.1194 [email protected] From: Lauren Handley Sent: Tuesday, June 05, 2012 10:44 AM To: Boedeker, Elizabeth D. Cc: Noah Keefer Subject: Re: MACSQuant Stuff Hotlink to MACSQuant and Separator Maintenance Contract 2012 Fwd… pdf STLCC-CPLS;Morrison 9/10/2014 Page 27 Flow Cytometer: Misc Reference Info Follows STLCC-CPLS;Morrison 9/10/2014 Page 28 Flow Cytometry: Education; Example; Quantifying Data, Frequency vs. Intensity FACS data collected by the computer can be displayed in two different ways. What we want to know is how many cells of each color were sorted. In the first example we see the intensity of the green or red fluorescence is plotted on the X-axis and the number of cells with each level of flourescence is plotted on the Y-axis. In this example, there were twice as many red cells sorted as green or unlabeled cells, but the level of light was greater from the green cells than the red cells. This method is best if all cells are either green, red or unlabeled and no cells are labeled both colors. Quantifying FACS data. This graph shows the number of cells (X-axis) and the level of fluorescence emitted (Yaxis) by the labeled cells. Many different colors can be plotted on this graph, but cells should not be labeled by more than one color. STLCC-CPLS;Morrison 9/10/2014 Page 29 Flow Cytometry: Education; FACS (Fluorescence-activated cell sorting) Description of Method In multicellular organisms, all the cells are identical in their DNA but the proteins vary tremendously. Therefore, it would be very useful if we could separate cells that are phenotypically different from each other. In addition, it would be great to know how many cells expressed proteins of interest, and how much of this protein they expressed. The process begins by placing the cells into a flask and forcing the cells to enter a small nozzle one at a time . The cells travel down the nozzle which is vibrated at an optimal frequency to produce drops at fixed distance from the nozzle. As the cells flow down the stream of liquid, they are scanned by a laser (blue light in figure 1). Some of the laser light is scattered (red cone emanating from the red cell) by the cells and this is used to count the cells. This scattered light can also be used to measure the size of the cells. If you wanted to separate a subpopulation of cells, you could do so by tagging those of interest with an antibody linked to a fluorescent dye. The antibody is bound to a protein that is uniquely expressed in the cells you want to separate. The laser light excites the dye which emits a color of light that is detected by the photomultiplier tube, or light detector. By collecting the information from the light (scatter and fluorescence) a computer can determine which cells are to be separated and collected. STLCC-CPLS;Morrison 9/10/2014 The final step is sorting the cells which is accomplished by electrical charge. The computer determines how the cells will be sorted before the drop forms at the end of the stream. As the drop forms, an electrical charge is applied to the stream and the newly formed drop will form with a charge. This charged drop is then deflected left or right by charged electrodes and into waiting sample tubes. Drops that contain no cells are sent into the waste tube. The end result is htree tubes with pure subpopulations of cells. The number of cells is each tube is known and the level of fluorescence is also recorded for each Page 30 cell. Flow Cytometry: Education; FACS, Quantifying Data; Comparing Intensity of Types The X-axis plots the intensity of green fluorescence while the Y-axis plots the intensity of red fluorescence. The individual black dots represent individual cells and we are not supposed to count the dots but just look at the relative density of dots in each quadrant. From this graph, we can see there were no cells labeled both red and green (top right) and many cells that were unlabeled (bottom left). The number of greenlabeled cells (bottom right) is about the same as the number of unlabeled cells, but the number of redlabeled cells (top left) is about twice that of the other two categories of cells. Again, we can see that the level of fluorescence was higher in the green cells than the red ones. This method of graphing the data is especially useful if cells are present that have been labeled both red and green. STLCC-CPLS;Morrison 9/10/2014 Page 31 Flow Cytometry: Educational Info, Videos Hotlink to Flow Cytometry Core Facility Biomedical Instrumentation Center, Uniformed Services University… pdf Hotlink to Invitrogen Tutorial Web Site ; Narrated Powerpoint Slide Shows Introduction to Flow Cytometry STLCC-CPLS;Morrison 9/10/2014 Page 32 Flow Cytometry: MACSQuant and autoMACS Separator MACSQuant Analyzer and autoMACS pro-separator located in the Instrumentation Room at BRDG Park The MACSQuant® Analyzer is a compact bench-top flow cytometer that is fully automated in all phases from setup and analysis to maintenance. Flow cytometry is the latest technology for cell, protein, and molecular detection and analysis and is based on optical and electrical detection in a very narrow nozzle of fluid flow. The MACSQuant analyzer performs absolute cell counting, multi-parameter, and rare cell analysis using three different lasers and is capable of detecting up to seven different fluorescent signals in the flow stream. The MACSQuantify™ Software interprets the signals from the flow and aids the user in further comprehensive analysis. Other unique features of this instrument include automated adding of reagents prior to sampling and auto-sampling of many samples. The autoMACS Pro Separator unit is used to attach magnetic beads to surface proteins on cultured cells. The culture can thus be enhanced and sorted to contain a much higher percentage of surface protein positive cells for further propagation or analysis using the MACSQuant analyzer. STLCC-CPLS;Morrison 9/10/2014 Page 33