1
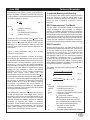
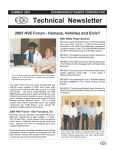
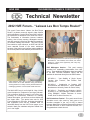
JUNE 2002
ENGINEERING DYNAMICS CORPORATION
Technical Newsletter
2002 HVE Forum - “Laissez Les Bon Temps Rouler!”
This year’s Forum theme “Laissez Les Bon Temps
Rouler!” (a phrase commonly heard in New Orleans
which translates to “Let the Good Times Roll!”), reflects
the experience of attendees to the 2002 HVE Forum.
The combination of informative lectures, hands-on
training, User’s Group meeting, Whitepaper session,
and each evening’s social hour provided an energized,
yet relaxed, learning environment. This year’s Forum
also marked a major milestone, as HVE and HVE-2D
users attended several of the same workshops
because of the similar user interface made possible by
the common platform now shared by HVE and HVE-2D.
HVE Whitepaper Session Presenters (from left to right)
Bill Dickinson, Jim Sneddon, Dan Fittanto, Jim Sobek
posing for a quick photo opportunity with Terry Day,
President of EDC.
HVE Whitepaper Session - This year’s session
provided four outstanding presentations from HVE
users. Three additional whitepapers have been added
to the EDC Technical Reference Library and are
available for download directly from the EDC website:
Kelley Adamson sits in the “hot seat” as a contestant in
“Who wants to be a HVE Jillionare” during the Monday
evening Social Hour. Kelley correctly answered all seven
challenging questions and won $500 credit from EDC.
The 2003 HVE Forum is set for April 28 - May 2, 2003,
at the Hampton Inn Tropicana in Las Vegas, Nevada.
This conference facility is located ¼ mile off the strip,
providing an environment conducive for learning
without interruption, yet still close to the activities that
Las Vegas offers. The special room rate for HVE
Forum attendees is $75/night. Workshop descriptions
and registration forms will be available soon for
download directly from the HVE Forum pages on our
website. Mark your calendars and plan to attend! See
you in Las Vegas!
WP-2002-1 - “Yaw Stability of Single Versus
Tandem Axle Tractors”, Dan Fittanto, Ruhl
Forensic, Inc.
WP-2002-2 - “Introduction to Creating HVE
Environments with Rhinoceros”, James Sneddon,
Northwestern University Center for Public Safety
WP-2002-3 - “Predicting and Analyzing Vehicle
Dynamics in a Train-Passenger Vehicle Collision
Using EDSMAC”, William Dickinson & James
Sobek, Wolf Technical Services, Inc.
HVE Simulations Festival - This year’s award for the
simulation movie clips voted by their peers to be
excellent examples of the use of HVE is shared
between Matt Weber of Design Research Engineering
and Bill Dickinson of Wolf Technical Services, Inc.
Congratulations to both winners!
Technical Newsletter
Technical Session
One of the important results of simulating a vehicle
maneuver is the presence or absence of tire skidmarks.
This Technical Session describes how tire skidmarks
are produced and displayed by HVE.
HVE displays the skidmarks for each tire. However, it is
the physics program (e.g., EDSMAC4, SIMON) that is
responsible for telling HVE when, where and how to
display the skidmarks.
HVE’s Role
HVE can display a skidmark for each tire on the vehicle.
The width of the skidmark is equal to the nominal width
of the tire, as defined by the tire size string. For
example, the skidmark for a P225/60R15 tire will be 225
mm wide. The skidmark will be drawn in segments from
the tire’s earth-fixed X,Y,Z contact patch coordinates
during the previous simulation output timestep to the
X,Y,Z coordinates at the current simulation timestep.
As a result of using the simulation output time interval,
the skidmarks may have greater detail if the simulation
output interval is reduced.
Each skidmark segment is actually a rectangle drawn
slightly above the road surface (the exact elevation is
user-editable; see the User Preferences dialog) in order
to ensure that the skidmark is visible and not blended
into the road surface geometry. (Note that the same can
be said of lane striping. If your skidmark disappears
beneath a lane stripe, it means that the lane stripe’s
elevation above the terrain is greater than the
skidmark’s elevation above the terrain. In this case, you
should either reduce the elevation of the lane stripe or
increase the elevation of the skidmarks.)
Physics Program’s Role
The physics program is responsible for creating the
skidmark information and passing it along to HVE. At
each simulation output timestep, the physics program
sends the following data (along with a lot of other data)
via the output tracks to HVE:
X,Y,Z Coordinates – These are earth-fixed
coordinates of the tire contact patch. These coordinates
provide the start and end points for each segment of the
skidmark.
Skid Flag – This value determines the visibility of the
skidmark. A value of 0.0 means no skidmark is visible; a
value of 1.0 means the skidmark is an opaque black
line.
2
June 2002
The current values for the tire’s X,Y,Z contact patch
coordinates are computed directly from the vehicle’s
current earth-fixed position and orientation and the
vehicle’s dimensions. The values are actually returned
by the simulation’s tire model using GetSurfaceInfo()
(a lot has been written about GetSurfaceInfo(),
e.g.,HVE User’s Manual, SAE Paper No. 970958).
Setting the current value of the skid flag is a complex
modeling issue. For example, the skid flag needs to be
set when a brake is locked. It also needs to be set when
the brake is off and the vehicle is cornering at an
excessive rate. If the brakes are partially applied while
the vehicle is cornering, the skid flag needs to be set at
a different (and lower) cornering rate. Such issues
consume the entire careers of engineering specialists
at Goodyear and Michelin. As you might expect, each
simulation program (more specifically, the simulation
program’s tire model) is responsible for determining the
criteria used for setting the skid flag. The various
methods employed by EDC’s simulations are described
below.
Straight-line Braking
In general, a non-steered tire begins to skid when the
attempted longitudinal tire force from braking exceeds
the available friction force. The resulting unstable
condition quickly leads to wheel lock-up and associated
tire skidding (at least on a non-ABS-equipped vehicle).
For 2-D simulations (e.g., EDSVS, EDVTS, EDSMAC,
EDSMAC4), this condition is as follows:
FX Attempted > µFZ
(eq. 1)
Figure 1 (see Page 4) shows skidmarks from a
straight-line braking simulation using EDSMAC4.
3-D simulations that employ a spin degree of freedom
at each wheel can compare the current longitudinal tire
slip with the characteristics of the tire’s mu-slip curve
(refer to Figure 1 in the December 2001 Technical
Newsletter for a description of a mu-slip curve). A tire
begins to skid when the current tire slip exceeds the slip
at µp.
Steering Without Braking
It is not so simple to determine the point at which a
steered tire begins to skid (technically, when the tire
has a slip angle the term is scuff, not skid). Whereas
skidding from heavy braking tends to occur quickly and
predictably (see above), lateral tire scuffing tends to
occur gradually; there exists no simple mechanism that
leads to tire scuffing. The most common criteria used to
determine the presence of a tire scuff is
non-dimensional sideslip, α. This parameter is
June 2002
Technical Newsletter
fundamental to the Fiala tire model used by EDSVS,
EDVTS, EDSMAC, EDSMAC4 and EDVSM (EDVSM,
a 3-D simulation, uses a somewhat extended version of
the Fiala tire model). In general,
α=
where
Ca
α
µ
Fz
Ca α
µF Z
(eq. 2)
= Cornering Stiffness
= Slip Angle
= Tire-Road Friction Coefficient
= Vertical Tire Load
According to the Fiala tire model, when α equals 3.0 the
tire is saturated (i.e., it cannot generate any greater side
force). Thus, if α exceeds 3.0, the tire model sets the
skid flag to 1.0 and a skidmark is drawn by HVE (note
that HVE does not distinguish between skidmarks and
scuffmarks).
Figure 2 shows scuffmarks from a hi-G steering
maneuver using EDSVS.
Close inspection of equation 2 reveals an anomaly:
Since Fz is in the denominator, using the Fiala model
predicts that a lightly loaded tire is more likely to leave a
skidmark than a heavily loaded tire (given the same
values for Ca, α and µ). Thus, for a vehicle negotiating a
high-speed turn, the Fiala model predicts an inside tire
will leave a tire mark before an outside (more heavily
loaded) tire. This condition is visible in the EDSVS
simulation in Figure 2. This is contrary to experience;
outside tires usually leave marks first. This
simplification means that most tire models using α to
set the skid flag will tend to over-predict the presence of
a tire mark. Therefore EDC recommends against using
the presence or absence of skidmarks produced by
these models as the basis for drawing important
conclusions. The skidmarks are useful, however, for
revealing tires that have lost traction (i.e., the attempted
steering or braking force has exceeded the available
force at the tire-road interface).
The problem with using Fiala’s α parameter directly to
set the skid flag is that, even though the tire may be
saturated, it may not have enough vertical load on it to
leave a black mark on the road. EDC’s 3-D models
(EDVSM, EDVDS and SIMON) provide an additional
parameter to improve the fidelity of skidmark
simulation. These models include the minimum vertical
tire force required to cause a skidmark. Thus, the more
lightly loaded (inside) tire will not leave a skidmark
unless it also has sufficient vertical load on it.
Combined Braking and Steering
All of the above tire models employ either the friction
circle (or ellipse) or a slip vs. roll-off table in the
presence of combined braking and steering to further
reduce the level of sideforce required to cause a
skidmark.
EDC Semi-empirical Tire Model
This tire model, an extended version of the HSRI tire
model developed at the University of Michigan,
employs a completely different scheme to determine
the presence of tire saturation. This model computes
the percentage of the tire contact patch that is no longer
adhering to the road surface. When the percentage falls
below a threshold value (typically 25 percent) and the
vertical tire load is sufficient, the skid flag is turned on.
The EDVDS model uses this method to set the skid flag.
ABS Tiremarks
With the introduction of the new ABS model, EDC has
developed a new skidmark model as well. A key feature
of the new model is that the skidmark is no longer
simply OFF (i.e., 0.0) or ON (i.e., 1.0). Instead, the skid
flag can vary continuously between 0.0 and 1.0 – and
the skidmark’s opacity can vary continuously between
0.0 (completely transparent) and 1.0 (completely
opaque). By varying the opacity, the characteristics of
the tire marks become very realistic. Figures 3 and 4
show SIMON simulations of straight-line braking and a
hi-G steering maneuver, respectively.
The opacity of the tire mark is determined by a 3rd-order
polynomial:
x=
y=
C4 LongSkid 2 + C 5 LatSkid 2
2.0
min(Fz, FzMin)
where
LongSkid
LatSkid
Fz
FzMin
C
x
y
FzMin
(C
1
+ C2 x + C3 x 2
(eq. 3)
)
(eq. 4)
= Longitudinal skid criterion (%)
= Lateral skid criterion (%)
= Current vertical tire load
= Minimum Fz required for 100% opacity
= Coefficient matrix
C1 = Polynomial constant
C2 = Polynomial linear coefficient
C3 = Polynomial quadratic coefficient
C4 = Longitudinal skid weighting factor
C5 = Lateral skid weighting factor
= Weighted tire mark criterion
(independent variable)
= Tire mark opacity (dependent variable)
3
Technical Newsletter
June 2002
Figure 1 - Skidmarks from straight-line braking using
EDSMAC4.
Figure 2 - Skidmarks from a hi-G turn using EDSVS.
Figure 3 - Skidmarks from straight-line braking using
SIMON (ABS is turned off).
Figure 4 - Skidmarks from a hi-G turn using SIMON.
Figure 5 - Straight-line braking of an ABS-equipped
vehicle using SIMON. Do you see any tire marks?
They’re there!
Figure 6 - Same as Figure 5, except the pavement
texture has been removed, revealing the faint tire marks
left by the ABS-equipped vehicle
4
June 2002
Technical Newsletter
and
C4 + C5 = 2.0
It is the responsibility of the simulation program to
determine the values for LongSkid and LatSkid. These
are included in the simulation’s tire model. In addition,
Fz is also computed by the simulation program. FzMin
is assigned using the Vehicle Editor, Tire Physical Data
dialog.
Simulations that use the HVE ABS model may also
incorporate this new skidmark model. At this time,
SIMON is the only simulation that uses the ABS model.
Figures 5 and 6 show a SIMON simulation involving
heavy braking of an ABS-equipped vehicle.
Graphics Card
Performance Testing
Collision Engineering Associates recently completed a
study to benchmark the performance of running HVE on
computers with various graphics cards. A series of
events involving a vehicle traveling over a highly
detailed 3D environment model (including texture maps
for grass, asphalt, etc.) were set up. The camera was
attached to the vehicle and the events were executed.
The length of time required to complete each run was
recorded. Additionally, the effect of increasing the
anti-aliasing setting on the same event was also
studied. Results that clearly show the differences in
performance of several of the cards involved in the
study are discussed below.
The graphics cards chosen for this test were those
identified in Hardware Profiles by the majority of HVE
and HVE-2D users. The two brands most commonly
present in users computers were ATI and nVIDIA.
Comparisons were only made between time to
complete a run, not between quality of graphic image,
“speed” of manipulation of viewer (demonstrating
memory caching ability of the card) or for stability of the
graphics card.
Under normal use settings, there was relatively
comparable performance from the newer graphics
cards. With anti-aliasing increased to 3, a dramatic
difference was evident as shown in Figures 7 and 8.
Recommendation - If your budget (and computer
configuration) can support it, the ATI Fire GL series
provide the fastest graphics performance for using
Poor Performer - Configurations using the ATI Radeon
8500 card provided extremely slow performance for
HVE/HVE-2D use and as shown in the Benchmark 2
test results, it did not even provide results within an
acceptable timeframe and was eliminated from the
study.
Rendered Frames / sec
C1 + C2 + C3 = 1.0
HVE. At this time, the retail price for the GL8700 is
$299, the GL8800 is $599 and the GL2 is $859. You
can visit your local computer shop, or visit the ATI
website at www.ati.com for more information about
these graphics cards.
10.0
9.0
8.0
7.0
6.0
5.0
4.0
3.0
2.0
1.0
0.0
A
B
C
D
E
F
G
H
I
J
Configuration
Figure 7 - Benchmark Test 1 with anti-aliasing set to 3
Rendered Frames / sec
The coefficients, C, are selected such that
10.0
9.0
8.0
7.0
6.0
5.0
4.0
3.0
2.0
1.0
0.0
A
B
C
D
E
F
G
H
I
J
Configuration
Figure 8 - Benchmark Test 2 with anti-aliasing set to 3
Configuration
Graphics
OS
A
Savage S3
W2000
B
Diam ond GL2
W2000
C
ATI Radeon 8500
W2000
D
GeForce 4
W2000
E
Diam ond GL2
W2000
F
ATI FireGL 8700
W2000
G
ATI FireGL 8800
W2000
H
Els a Synergy Force
WinNT
I
NeoMagic
W98 SE
J
O2
Irix 6.3
5
Technical Newsletter
2002 HVE Forum
Top 10 Wish List
Every year at the HVE Forum, attendees to the User’s
Group meetings develop a “Wish List” of additional
functionality or enhancements for HVE and HVE-2D
that they would like to have EDC implement over the
next 12 months. The groups suggestions are then
narrowed down by voting for their “Top 10” choices.
Here are the lists from this years Forum:
HVE Users’ Top 10 Wish List*
Ø Dynamic payload shift during a simulation
Ø Add a tire model that addresses sidewall
Ø
Ø
Ø
Ø
Ø
Ø
Ø
Ø
Ø
Ø
contact with terrain/curbs
Capability to accelerate a vehicle from zero
velocity
Save or assign camera views
Add vehicle to existing event
Change Hierarchy for Friction Zone
Extend HVE suspension model to include air
suspensions for trucks
Elliptical-shaped occupant airbags
More event set-up target positions
Display key results in Playback Window
Assign fixed camera view to follow target
Visualize fifth wheel and kingpin locations
*This list contains more than 10 due to a tie vote
HVE-2D Users’ Top 10 Wish List
Ø Ability to specify skidmark color by vehicle
Ø Add normal “Tab Key” behavior to Driver
Controls input tables
Ø Undo
Ø Create EDSMAC event input from EDCRASH
event output
Ø Enable storage option in trajectory simulation
Ø Add vehicle specifications item to CG sphere
Ø
Ø
Ø
Ø
in Vehicle Editor
Print all Playback reports with a single click
Set-up menu items accessible with right
mouse click over vehicle in Event Editor
Clear All Variables button in Key Results and
Variable Output selection dialog
Ability to move or delete columns in Variable
Output report
6
June 2002
User Hints and Tips
This section contain useful hints and tips to help HVE
and HVE-2D Users make the most of their software.
Ø Reversing surface normals in the 3D-Editor can
be very difficult when you can’t see the individual
polygons making up the surface. To solve the
problem Right click in the viewer, Go to Draw
Style, and Click on Wireframe. This allows you to
view your drawing in wireframe mode thus
making it easier to reverse individual polygon
surface normals.
Ø The latest release of HVE and HVE-2D, Version
4.30, now includes functionality for “flipping” and
scaling imported DXF files (scene drawings)
from CAD programs. Many users report this
saves them several extra steps from the usual
procedure for preparing their drawings for import
into HVE. Refer to the Environment Editor
section of your User’s Manual for more
information.
Ø If you need to study additional variations of your
event set-up in order to conduct a sensitivity
analysis, make a copy of your event and work
with the copy rather than the original. It’s simple
to do; simply have the event you want to copy
displayed in the Event Editor, then select Edit,
Copy on the menu bar. You will be prompted to
name the copy of the event and then you’re ready
to start working with the copy.
Vehicle Dynamics Course
and “Group Race Day”
The next EDC Theoretical and Applied Vehicle
Dynamics Course will be held October 1 - 3, 2002, in
Indianapolis, Indiana. In conjunction with this course, a
“group day” at the local race car driver training facility,
Track Attack, is being offered by Wolf Technical
Services, Inc., on October 4, 2002. To learn more
about these events, please contact EDC Customer
Service or visit the Training pages of the EDC website.
The course, instructed by Dan Metz, provides three full
days of lectures and labs. For the labs, attendees will
be divided into small groups and assigned specific
problems requiring computer simulations to solve. HVE
software and computers will be available to each group.
A brief presentation will be given by each group at the
end of each lab exercise.
Space is limited, so register early to guarantee your
seat in the course and in your race car!
June 2002
Technical Newsletter
This section contains answers to frequently asked
questions submitted to our Technical Support staff by
HVE and HVE-2D users.
Q: I am trying to create an EDSMAC4 event involving a
vehicle towing a trailer. I am getting an error message
indicating that the connect heights are not compatible
between the vehicles. How do I overcome this error
message?
Q: I am setting up an EDSMAC4 crash simulation that
involves a tractor-trailer. I can input braking values for
the 3 axles of the tractor, but how do I input braking
values for the 3 axles of the trailer?
A: With the release of HVE v4.30, EDSMAC4 now
requires that the connection elevations relative to the
ground to be within 1 inch of each other for connected
vehicles. Here are some helpful steps to quickly check
and edit inter-vehicle connection heights:
A: The trailer is considered a “child” of the tractor
“parent” vehicle. To enter braking values for the trailer
axles in EDSMAC4, you will need to place the mouse
cursor in Pick Mode and click on the trailer. You will see
the manipulator appear on the trailer and when you
choose Set-up, Driver Controls, you will see the Brake
Table for the trailer displayed. When you are finished
entering your values of braking for the trailer, you can
add accelerometers, wheel displacements and other
event-related parameters for the trailer.
1. Display the tow vehicle in the Vehicle Editor.
Click on its CG and select Move CG on the pop-up
menu. Note the CG Height displayed at the bottom
of the Move CG dialog. Close the dialog.
Q: I notice that when I enter in values in the brake table
for a 3 axle vehicle, that the values for Axle 2 are
automatically applied to Axle 3. I would like to be able to
simulate a situation involving only the 3rd axle braking,
such as an emergency or parking brake being applied
to only the 3rd axle. Can I do this?
3. Subtract the connection z coordinate from the
CG height of the vehicle.
(BE CAREFUL!
Subtracting a negative number is the same as
adding a positive number.) The resulting value is
the connection height relative to the ground.
HVE and HVE-2D F.A.Q.
A: The answer is yes, but what you have just noticed
about the brake table is a temporary problem. The
value you are entering for Axle 2 should not be applied
automatically to, or overwrite your inputs for Axle 3.
This is a bug and will be fixed in the next update.
Q: I am editing the exterior dimensions of a vehicle
from the EDVDB vehicle database and I do not see the
geometry file scaling to match the new positions of the
red spheres indicating the exterior dimensions of the
vehicle. Why?
A: The exterior geometry of a vehicle from the EDVDB
database is an exact 3D model of an actual vehicle
made by physically recording the vehicle using a
digitizer. This geometry is not resizable and cannot be
edited within the Vehicle Editor, except for changing the
color of the vehicle. When you edit the exterior
dimensions of the vehicle by clicking on the red spheres
and changing the values, you are changing the values
of the dataset for the vehicle, but you are not editing the
geometry mesh. If you edit the exterior dimensions of a
Generic vehicle, you will see that the generic geometry
does scale to match your new dimensions. This is
because the generic vehicle body is drawn by HVE.
2. Click on the tow vehicle’s CG again and select
Connections. Note the z coordinate for the rear
connection. Remember, a negative z coordinate for
the connection actually places the connection
above the CG of the vehicle because of the SAE
coordinate system.
4. Repeat the above steps for the trailer to
determine the connection height relative to the
ground for the front connection of the trailer.
5. Edit the connection z coordinate of the vehicle(s)
to bring them into within 1 inch of each other.
6. Repeat this proceed for each set of connected
vehicles.
Now you will be able to create and run your EDSMAC4
event with vehicles that are properly connected!
Q: I remember back in the EDVAP days that the
manual said to select the smaller vehicle first for an
EDSMAC event. Does this still hold true for the latest
versions of EDSMAC and EDSMAC4?
A: The answer is yes. When the collision algorithm is
initialized, a temporary coordinate system is
established from the first vehicle viewing the second
vehicle. This “view” establishes the total possible
damage width on the first vehicle, and therefore, the
total number of collision (”RHO”) vectors. More RHO
vectors means better resolution is possible in the
collision algorithm, and the need for increasing the
number of RHO vectors later in the collision is
lessened. These RHO vectors are ultimately used to
calculate the forces and moments on the vehicle, as
well as to define the damage profile.
7
Technical Newsletter
EDC Training Courses
EDC Reconstruction & EDC Simulations
EDC offers an excellent training course on the use of
the EDC reconstruction program, EDCRASH. Both
new and long-time users of EDCRASH agree that the
EDC Reconstruction course is extremely beneficial and
challenging.
EDC also offers an excellent training course on the use
of EDC simulation programs, such as EDSMAC,
EDSMAC4, EDSVS and EDVTS.
The EDC
Simulations course offers the fastest way to learn what
you really need to know – how to efficiently use the
program and get the right results.
These one-week courses are designed to fully
investigate the program’s inner workings. Lectures are
full of helpful hints gained from years of experience.
During the course, students will use the programs (e.g.
EDCRASH, EDSMAC4) in either the HVE or HVE-2D
simulation environment to complete several workshops
highlighting the capabilities of the programs.
HVE Forum
The HVE Forum is an excellent opportunity for HVE and
HVE-2D users to jump to a new level of ability. By
participating in workshops, attendees brush up on their
present skills, learn new techniques, and learn how to
use the latest advancements in the software. The HVE
Forum also presents a great opportunity to meet other
users and expand your network of resources.
Engineering Dynamics Corporation
Training Course Schedule
EDC Simulations
June 2002
Vehicle Dynamics
Theoretical and Applied Vehicle Dynamics extends the
theory of the basic SAE course and includes direct
applications using several vehicle simulation programs
(e.g. SIMON, EDVSM) within the HVE simulation
environment, as well as a solid theoretical background
for such simulations. The course is focused towards
vehicle design engineers and safety researchers with
an interest in a greater understanding of vehicle
dynamics
and
automotive
chassis
systems
development.
Hands-on Training
Intensive hands-on training on how to use your HVE or
HVE-2D system software, physics programs and
databases is available.
Contact EDC Customer
Service for more information about bringing this
two-day on-site course to your office.
Course Registration
You may register for a course by contacting EDC
Customer Service at 503.644.4500, or by email to
[email protected].
You can also visit the
Education & Training pages on our website and
download a course registration form. All courses are
eligible for Continuing Education and ACTAR credits.
See you at our next course!
Related Training Courses
Northwestern University Center for Public Safety
(NUCPS) is no longer actively scheduling the
COMPTAR and MATAR courses which used
EDCRASH and EDSMAC. The material previously
covered in these courses is available in the EDC
Reconstruction and EDC Simulations courses. If you
are interested in hosting one of these courses at your
location, please contact EDC Customer Service at
503.644.4500.
Los Angeles, CA . . . . . . . . . . January 20 - 24, 2003
Miami, FL . . . . . . . . . . . . . . . . . November, 2003
EDC Reconstruction
Los Angeles, CA . . . . . . . . . . . . . January, 2004
Miami, FL . . . . . . . . . . . . . . November 11 - 15, 2002
Theoretical & Applied Vehicle Dynamics
Engineering Dynamics Corporation
8625 SW Cascade Blvd, Suite 200
Beaverton, Oregon 97008-7100 USA
Phone 503.644.4500 / FAX 503.526.0905
Email: [email protected]
Website: www.edccorp.com
Indianapolis, IN . . . . . . . . . . . . . October 1 - 3, 2002
EDVAP, EDCRASH, EDSMAC, EDSMAC4, EDCAD, EDSVS, EDVTS, EDHIS, EDVSM,
2003 HVE FORUM
EDVDS, EDGEN, EDVDB, HVE, HVE-2D, HVE Brake Designer and GetSurfaceInfo() are
Las Vegas, NV . . . . . . . . . . . April 28 - May 2, 2003
SIMON and DyMESH (Patent number 6,195,625) are registered trademarks of Engineering
trademarks of Engineering Dynamics Corporation.
Dynamics Corporation.
All Rights Reserved.
All Rights Reserved.
GATB is a trademark of Collision Engineering Associates, Inc.
8