1
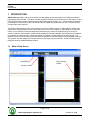
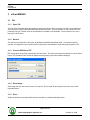
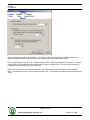
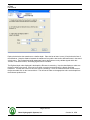
Odom eChart
USER MANUAL
Version: 0.4
Odom Hydrographic Systems, Inc.
1450 Seaboard Avenue
Baton Rouge, Louisiana
USA
70810-6261
Telephone: (225) 769-3051
Fax: (225) 766-5122
[email protected]
http://www.odomhydrographic.com
Number of pages: 28
Date: October 24, 2008
eChart
User Manual
Revision History
Version
0.1
0.2
0.2
0.4
Date
12-13-2007
01-31-2008
04-18-2008
10-24-2008
Author
S. Apsey
R. Byrd
S. Apsey
S. Apsey
Remarks
Initial version – draft
First Edits
Software version 1.1.12 update
Software version 1.3 update
© ODOM HYDROGRAPHIC SYSTEMS, INC. 2008
All rights are reserved. Reproduction in whole or in part is prohibited without the prior written consent of the copyright owner.
The information presented in this document does not form part of any quotation or contract, is believed to be
accurate and reliable and may be subject to change without notice. The publisher will not accept any liability for
any consequence of its use. Publication thereof does not convey nor imply any license under patent- or other
industrial or intellectual property rights.
Page 2 of 28
Odom Hydrographic Systems, Inc.
October 24, 2008
eChart
User Manual
CONTENTS
1 Introduction ...................................................................................................................................................... 5 1.1 1.2 1.3 1.4 2 Installation ........................................................................................................................................................ 9 2.1 3 Main eChart Screen .................................................................................................................................... 5 Purpose ....................................................................................................................................................... 6 Scope .......................................................................................................................................................... 6 Glossary ...................................................................................................................................................... 7 Software Installation .................................................................................................................................... 9 eChart Menus ................................................................................................................................................. 10 3.1 File............................................................................................................................................................. 10 3.1.1 Open File ........................................................................................................................................... 10 3.1.2 Record................................................................................................................................................ 10 3.1.3 Convert DSO file to XTF .................................................................................................................... 10 3.1.4 Save Image… .................................................................................................................................... 10 3.1.5 Print… ................................................................................................................................................ 10 3.1.5.1 Channel to print .......................................................................................................................... 11 3.1.5.2 Current Viewport ......................................................................................................................... 11 3.1.5.3 Entire Record .............................................................................................................................. 12 3.1.6 Connect to Sounder/Disconnect from Sounder ................................................................................. 14 3.2 Settings ..................................................................................................................................................... 15 3.2.1 Device Settings… .............................................................................................................................. 15 3.2.2 Bar Check… ....................................................................................................................................... 16 3.2.3 Display… ............................................................................................................................................ 21 3.2.3.1 Color Scale ................................................................................................................................. 22 3.2.3.2 Digitzer ........................................................................................................................................ 22 3.2.3.3 Show Digitized Depth in Scope .................................................................................................. 23 3.2.3.4 Track Bottom when Zoomed In .................................................................................................. 23 3.2.3.5 Scale Offset ................................................................................................................................ 23 3.2.3.6 Combined View........................................................................................................................... 24 3.2.3.7 Preferences ................................................................................................................................ 25 3.2.4 Preferences ........................................................................................................................................ 26 3.2.4.1 File Recording............................................................................................................................. 26 3.2.4.2 Connection .................................................................................................................................. 26 3.3 View........................................................................................................................................................... 26 3.3.1 Channel 1 ........................................................................................................................................... 26 3.3.2 Channel 2 ........................................................................................................................................... 26 3.3.3 Channel 3 ........................................................................................................................................... 26 3.3.4 Combined View .................................................................................................................................. 26 3.3.5 Tile Horizontally ................................................................................................................................. 26 3.3.6 Tile Vertically ...................................................................................................................................... 26 3.3.7 Device Control Only ........................................................................................................................... 26 3.4 Help ........................................................................................................................................................... 27 3.4.1 About… .............................................................................................................................................. 27 4 Features .......................................................................................................................................................... 28 4.1 Zooming .................................................................................................................................................... 28 Page 3 of 28
Odom Hydrographic Systems, Inc.
October 24, 2008
eChart
User Manual
Page 4 of 28
Odom Hydrographic Systems, Inc.
October 24, 2008
eChart
User Manual
1 INTRODUCTION
Odom eChart (hereafter referred to as eChart) is a data display and control program for the Echotrac family of
hydrographic echo sounders. That family includes the MKIII, Echotrac CV100, Echotrac CV2, Echotrac CV3, and
Echotrac CVM echo sounders manufactured by Odom Hydrographic Systems, Inc.. eChart utilizes the Ethernet
port available on these units to send commands to and to display and log data from the entire “Echotrac Family”
of single beam echo sounders.
The Ethernet data output by these echo sounders are 1600 or 3200 time series of 16bit amplitude values of the
water column, digitized each time the sounder transmits a pulse to the transducer. Depending on the Echotrac
model, up to 3 channels of data are sampled simultaneously up to maximum repetition rate of 20 times per
second. Collection of that amount of data is made possible by the wide bandwidth of the Ethernet link compared
to an RS232 link tasked similarly. eChart also allows the operator to replay data that has been logged. The
software has zoom in/zoom out functions that allow the operator to view the entire file or a small portion of the file.
The operator can also display all of the parameters for any single ping in the data file. eCHart also has printing
facilities that utilize standard Windows printers.
1.1
Main eChart Screen
Depth Display
Signal (Scope)
Display
“Analog” controls
Page 5 of 28
Odom Hydrographic Systems, Inc.
October 24, 2008
eChart
User Manual
1.2
Purpose
The purpose of this document is to explain the features and operation of eChart software.
1.3
Scope
The scope and content of this document is focused on providing useful information to the end-user.
Page 6 of 28
Odom Hydrographic Systems, Inc.
October 24, 2008
eChart
User Manual
1.4
Glossary
DGPS
NMEA
VDC
Differential Global Positioning System
National Marine Electronics Association
Volts Direct Current
Page 7 of 28
Odom Hydrographic Systems, Inc.
October 24, 2008
eChart
User Manual
Page 8 of 28
Odom Hydrographic Systems, Inc.
October 24, 2008
eChart
User Manual
2 INSTALLATION
2.1
Software Installation
There are two versions of the eChart software, the complete version with graphical display and a control only
version that will run on a computer that does not meet the minimum specification below.
The minimum requirements for a personal computer to install and run only the ES3 software are:
• Windows 2000, XP or Vista
• 512 MB of RAM
• 2 Gigabytes of free hard drive space
• Direct-X 7 compatible video system with 64MB Video memory and current driver
• Pentium-IV, running at 2 GHz
• One Ethernet port
Double-Click the provided setup file to start the installation process. An Install Shield wizard will guide you
through the rest of setup process. eChart is available from Start->Programs->Odom. There is a short cut to the
complete version of eChart and the device control version.
Page 9 of 28
Odom Hydrographic Systems, Inc.
October 24, 2008
eChart
User Manual
3 eChart MENUS
3.1
3.1.1
File
Open File
The File Open command allows the operator to open files that have been previously recorded. All recorded files
are stored in the install_folder\Odom\eChart\Recorded Data folder. Files are stored in a *.dso format which is a
proprietary file type. Details of the file specification are available in the Appendix. There is also an icon on the
tool tray for this function.
3.1.2
Record
This will start recording files to the install_folder\Odom\eChart\Recorded Data folder. It is important that the
operator not change the units of measure as this will produce unpredictable results when playing back the file.
3.1.3
Convert DSO file to XTF
EChart logs all its file to Odom’s proprietary DSO file format. This menu item allows the operator to convert these
files to XTF(extended Triton Format) for playback and processing with other software packages.
3.1.4
Save Image…
Save Image will save the current screen to a .bmp file. This is useful for archiving a bar check or some other
important feature.
3.1.5
Print…
Allows the operator to print data that has been recorded on a standard Windows printer.
Page 10 of 28
Odom Hydrographic Systems, Inc.
October 24, 2008
eChart
User Manual
3.1.5.1 Channel to print
Channel to print selects which channel data to print.
3.1.5.2
Current Viewport
The Current Viewport will print only the current zoom level and data that is displayed on the screen.
Page 11 of 28
Odom Hydrographic Systems, Inc.
October 24, 2008
eChart
User Manual
3.1.5.3
Entire Record
The selecting the Entire Record command results in the printing of the record at the Zoom Level selected.
Page 12 of 28
Odom Hydrographic Systems, Inc.
October 24, 2008
eChart
User Manual
Page 13 of 28
Odom Hydrographic Systems, Inc.
October 24, 2008
eChart
User Manual
3.1.6
Connect to Sounder/Disconnect from Sounder
This will connect the eChart software to an Echotrac sounder through the Ethernet port. If connecting directly
between the Echotrac and eChart computer ensure a cross over CAT5 cable is used. Make sure the computer
has acquired a network connection to the sounder first otherwise a connection cannot be established. There is
also an icon on the tool tray for this function.
Page 14 of 28
Odom Hydrographic Systems, Inc.
October 24, 2008
eChart
User Manual
3.2
3.2.1
Settings
Device Settings…
The Device Settings controls all the parameters for the Echotrac. If the Echotrac model that is connected to
eChart does not support a certain feature, that feature will appear “greyed out” and will not be accessible to the
operator.
Page 15 of 28
Odom Hydrographic Systems, Inc.
October 24, 2008
eChart
User Manual
3.2.2
Bar Check…
The bar check is the hydrographic survey industry’s most widely accepted method of calibrating single beam echo
sounders. The procedure involves deploying a plate or bar that is suspended by cables or chains at accurately
measured distances below the transducer. The “Bar Check Wizard” streamlines the bar check procedure for
calibration. The result of the Wizard is an echo sounder that is calibrated for draft, sound velocity and index
offsets. The Bar Check Wizard also generates a text file containing the values associated with each calibration
factor.
The three parameters the Echotrac needs to determine the depth accurately are Draft, Sound Velocity and Index.
Draft is the distance from the water surface to the face of the transducer. Sound Velocity is the average speed of
sound in the water column. Index errors are any delays caused by the transducer elements and analog filters in
receiver of the echo sounder. Draft and Index errors are best determined when the bar is placed close to the face
of the transducer, and sound velocity is best determined when the bar is at its deepest.
Before starting the bar check, make sure the TX Power, RX Gain, Pulse Width, TVG curves, Threshold and
Bandwidth parameters are set to values which are appropriate for the survey to be performed. Changing any of
these parameters will impact the calibration of the Echotrac as it will any echo sounder.
Enter which channels you would like to calibrate. Channel 1(high frequency) is normally used to calibrate the
sound velocity unless only calibrating channel 2 is selected.
Page 16 of 28
Odom Hydrographic Systems, Inc.
October 24, 2008
eChart
User Manual
Enter the deepest planned bar check depth. The deeper the bar check the better the calibration will turn out.
Make sure there is at least 1 meter(3ft) between the deepest bar check depth and the bottom.
Enter the initial speed of sound. This is usually determined with a sound velocity probe like a Digibar. If a sound
velocity probe is not available enter an approximation or leave the default value. The bar check procedure will
produce the correct sound velocity as an end result.
Enter the measured draft (how deep the transducer is as measured from the water surface to the transducer
face). If the transducer is hull mounted enter the known value. The calibration procedure will determine the exact
offset.
Page 17 of 28
Odom Hydrographic Systems, Inc.
October 24, 2008
eChart
User Manual
Deploy the bar below the transducer to a shallow depth. Place the bar at least 1 meter (3 feet) below the face of
the transducer. Keep the distance between the transducer face and the bar small to eliminate errors in the sound
velocity entry. The bar depth and width parameters instruct the Echotrac to only validate signals within this
“window” in the water column, eliminating signals from the seabed.
The Digitized depth value displayed is the depth the Echotrac is measuring. Use the chart display to make sure
the bar is visible in the record. If the bar is not visible, move the bar around until it is directly under the
transducer. In areas with current or wind, this can be a challenge. Once the measurements of the Echotrac on
the bar are stable click on the Auto set button. This will set the Index to the appropriate value so the depth from
the Echotrac equals the bar.
Page 18 of 28
Odom Hydrographic Systems, Inc.
October 24, 2008
eChart
User Manual
Set the bar to the deepest possible depth and then enter the depth of the bar. Getting the bar directly under the
transducer can be a challenge, but it is essential for a good bar check. Once the Echotrac is measuring the bar
click on the Auto Set button and the wizard will change the Speed of Sound until the measurement is correct. The
sound velocity required to measure the bar depth should agree closely with the sound velocity from the sound
velocity probe. If it does not, then there is a problem with either the draft and index measurement or sound
velocity calibration. Most often this is caused by improperly accepting the depth of the bar check when the bar is
not directly under the transducer.
Page 19 of 28
Odom Hydrographic Systems, Inc.
October 24, 2008
eChart
User Manual
The next step in the bar check wizard is to confirm the measurement of the shallow water bar check since the
measurement might change if the sound velocity initially entered was not accurate. If the measurement agrees
with the bar the procedure is finished otherwise keep repeating the shallow water deepwater measurements until
both agree. If calibrating more than one channel, Channel one (or the highest frequency channel available) is
used to determine the sound velocity. The low channel (s) need only to be employed to arrive at the appropriate
draft and index figures for each since the sound velocity is common for all channels.
The confirm Completion screen give the operator a chance to repeat the calibration of complete the calibration.
The biggest source of error when bar checking and echo sounder is ensuring the bar is directly under the
transducer when accepting the measurement. Do not increase the gain in an attempt to compensate for the bar
not being directly under the transducer.
Page 20 of 28
Odom Hydrographic Systems, Inc.
October 24, 2008
eChart
User Manual
The final step of the bar check wizard is a summary of the parameters changed and a text file is created of the bar
check. This file is placed in the install_directory\Odom\BarChecks folder.
3.2.3
Display…
This menu sets the attributes such as colors and other preferences for each channel. There are up to a maximum
of three channels in an Echotrac, so there are three tabs for selecting properties for displaying the data.
Page 21 of 28
Odom Hydrographic Systems, Inc.
October 24, 2008
eChart
User Manual
3.2.3.1
Color Scale
eChart offers four different color scales. The rainbow color is usually the best for bathymetry data. The grey is
the more traditional record and it has a familiar look for both bathymetry or side scan data. Amber is usually the
reserved for side scan data. The Linear/Exponential drop down box employs the slider to the right of the box. In
the Linear mode the slider affects the linear offset of the color scale. In Exponential mode the slider can add
more emphasis to the either the lower amplitude data or higher amplitude data. Exponential mode is good for
highlighting objects in side scan data or bring out layers in sub bottom bathymetry data.
3.2.3.2
Digitzer
The Digitizer box lets the operator select which items are displayed on the screen and whether they are displayed
using dots or lines and what colors are used.
3.2.3.2.1
Display Tracking Gate
Echotrac sounders maintain a dynamic tracking window around the seabed, so that any objects (acoustic
reflectors) appearing outside of the window are ignored once a valid bottom is determined. This window is called
the tracking gate. This menu item determines whether the gate is displayed or not and how it is displayed.
Please note that the gate is always displayed as a dark shade of green on the signal display.
3.2.3.2.2
Display Digitzer Line
The Digitized Depth is the depth the Echotrac has determined to be the bottom. This feature allows the operator
to plot the line that represents that depth on the screen. This feature is designed to help the operator visualize
what the echo sounder has picked as the seabed.
3.2.3.2.3
Display Heave Line
The heave line is used when a motion reference unit is connected to the Echotrac. Displaying the heave line is
useful in determining how well the heave compensation instrument is correcting for the vertical displacement of
the transducer resulting from wave action.
Page 22 of 28
Odom Hydrographic Systems, Inc.
October 24, 2008
eChart
User Manual
Heave Line
Tracking Gate
Digitizer Line
3.2.3.3
Show Digitized Depth in Scope
This check box determines whether the digitised depth from the Echotrac is displayed in the oscilloscope window
(to the right of the scrolling data).
3.2.3.4
Track Bottom when Zoomed In
When zooming in on a particular part of a record, enabling this feature will keep the data corresponding to the
Echotrac’s bottom pick in the viewing area regardless of the zoom power used.
3.2.3.5
Scale Offset
This feature enables the operator to add a small voltage offset to the data before displaying it on the screen. The
feature is only useful for Echotrac units that can display the Full AC waveform data (the units must be equipped
with the 31RD Low Frequency Transceiver Card). Compensating for small differences in the DC offset serves to
Page 23 of 28
Odom Hydrographic Systems, Inc.
October 24, 2008
eChart
User Manual
keep the AC waveform data (Wiggle display) centered in the color range and leads to a more easily interpreted
record.
3.2.3.6
Combined View
The Combined View tab sets the display properties for the Combined View window. This window allows the
operator to select two or more channels to overlay or display on top of each other (viewed simultaneously in one
Window).
3.2.3.6.1
Opacity
This display function fades the data for the channel selected in and out. The capability to change Opacity is
useful when comparing dual frequency records where the high and low frequency returns are plotted at very
nearly the same depth.
3.2.3.6.2 Per-Pixel Transparency
Again with two channels plotted simultaneously in one Window, selecting Per-Pixel Transparency results in the
pixel with the highest intensity being displayed regardless of which channel is plotted as the top layer.
3.2.3.6.3
Show Digitized Depth
This function turns on the display of the selected channel’s depth in the signal window.
3.2.3.6.4
Orientation
This feature determines the plot orientation of the data in the combined view. Horizontal scrolling is usual for
bathymetry data while vertical scrolling is normal for side scan data.
Page 24 of 28
Odom Hydrographic Systems, Inc.
October 24, 2008
eChart
User Manual
3.2.3.7
Preferences
This tab sets the preferences that affect all the windows
3.2.3.7.1
Grid Lines
The grid lines box allows the operator to customize the scale lines on the scrolling chart. The operator can select
the color of the major and minor scale lines and how far apart the lines are. The transparency slider allows the
operator to set how transparent the scale lines are.
3.2.3.7.2
Horizontal Scaling
Changes the rate at which data is scrolled horizontally across the screen.
3.2.3.7.3
Auto Zoom Mode
Auto Zoom Mode determines how the Reset Zoom icon on the tool bar will work. If “Zoom to display all previous
data” is selected and the operator clicks on the Reset Zoom icon, the vertical scale will zoom to encompass all the
previous since eChart was connected to the Echotrac. If “Zoom to current chart width” is selected and the Reset
Zoom icon is clicked, the vertical scale will change to the scale width set by the Echotrac. “Auto Zoom Disabled”
de-activates the Reset Zoom icon.
3.2.3.7.4
Lock views together when zooming and panning
This check box will lock all the displays to zoom and pan together.
Page 25 of 28
Odom Hydrographic Systems, Inc.
October 24, 2008
eChart
User Manual
3.2.4
Preferences
3.2.4.1
File Recording
Sets the maximum file size for recording data. If a file is larger than the number entered and new file will be
created.
3.2.4.2
Connection
Sets the UDP port to connect to the Echotrac. Normally this should always be left at 1600. In the Echotrac MKIII
this can be changed through the front panel menu. In the Echotrac CV’s a special modification is needed on the
board to change the port number.
3.3
View
Selects which views are turned on.
3.3.1
Channel 1
Normally the high frequency channel in an Echotrac.
3.3.2
Channel 2
Normally the low frequency channel in an Echotrac
3.3.3
Channel 3
The only Echotrac that supports three channels is the Echotrac CV3. In most cases, the third channel is a second
high frequency channel or a side scan channel.
3.3.4
Combined View
Turns on the combined view window. Go to Settings->Display to select which channels to display on this window.
3.3.5
Tile Horizontally
Tiles the active windows horizontally.
3.3.6
Tile Vertically
Tiles the active windows vertically.
3.3.7
Device Control Only
If Device Control Only is checked, eChart will only display the menu along with the depth and gain adjustment
displays. The chart windows will be eliminated.
Page 26 of 28
Odom Hydrographic Systems, Inc.
October 24, 2008
eChart
User Manual
3.4
3.4.1
Help
About…
The About menu lists information about Odom Hydrographic Systems, Inc. and eChart version.
Page 27 of 28
Odom Hydrographic Systems, Inc.
October 24, 2008
eChart
User Manual
4 FEATURES
This section covers some of the features and helpful control of eChart.
4.1
Zooming
To zoom in or out of the data in one of the channel windows, click on the window to make it active, then either roll
the mouse button or use the + and – keys to zoom. If the check box in Settings->Display->Preferences->Lock
view together is checked all the windows will zoom together. If the operator clicks on a channel window to pan
backward in time, eChart will stop displaying real time data. However, it will continue saving incoming data. To
start displaying real time data again, either click on the reset zoom icon on the tool bar or click on the lower right
had arrow in the channel window.
Page 28 of 28
Odom Hydrographic Systems, Inc.
October 24, 2008