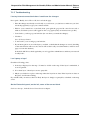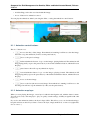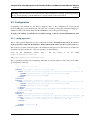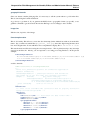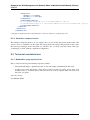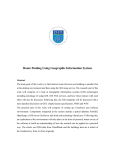
1
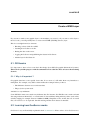
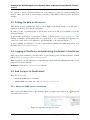
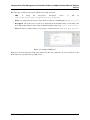
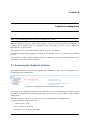
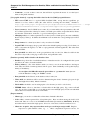
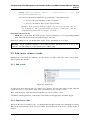
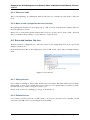
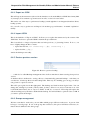
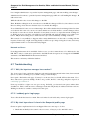
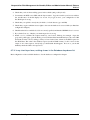
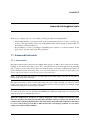
Geoportal for Risk Management for
Gambia, Editor and Administrator
Manual
Release 2.10.3-1
Jean Pommier
December 01, 2014
Contents
1
Introduction
1.1 Geoportal for Risk Management in Gambia and GeoNetwork . . . . . . . . . . . . . .
1.2 Geoportal for Risk Management in Gambia and GeoServer . . . . . . . . . . . . . . . .
3
3
3
2
User profiles
2.1 User profiles in GeoNetwork . . . . . . . . . . . . . . . . . . . . . . . . . . . . . . . .
2.2 User profiles in GeoServer . . . . . . . . . . . . . . . . . . . . . . . . . . . . . . . . .
5
5
6
3
Users management
3.1 Groups . . . . . . . . . . . . . . . . . . . . . . . . . . . . . . . . . . . . . . . . . . .
3.2 User Profiles . . . . . . . . . . . . . . . . . . . . . . . . . . . . . . . . . . . . . . . .
3.3 Ownership and privileges . . . . . . . . . . . . . . . . . . . . . . . . . . . . . . . . .
7
7
7
9
4
Metadata workflow
4.1 Edit an existing metadata .
4.2 Create a new metadata . .
4.3 Publish a metadata . . . .
4.4 Using Templates . . . . .
5
6
7
.
.
.
.
.
.
.
.
.
.
.
.
.
.
.
.
.
.
.
.
.
.
.
.
.
.
.
.
.
.
.
.
.
.
.
.
.
.
.
.
.
.
.
.
.
.
.
.
.
.
.
.
.
.
.
.
11
11
12
12
14
Create a WMS Layer
5.1 GIS basics . . . . . . . . . . . . . . . . . . . . . . . . . . . .
5.2 Learning how GeoServer works . . . . . . . . . . . . . . . . .
5.3 Putting the data on the server . . . . . . . . . . . . . . . . . .
5.4 Logging in GeoServer and publishing the dataset in GeoServer .
5.5 Add the layer in GeoNetwork . . . . . . . . . . . . . . . . . .
.
.
.
.
.
.
.
.
.
.
.
.
.
.
.
.
.
.
.
.
.
.
.
.
.
.
.
.
.
.
.
.
.
.
.
.
.
.
.
.
.
.
.
.
.
.
.
.
.
.
.
.
.
.
.
.
.
.
.
.
.
.
.
.
.
15
15
15
16
16
16
Layertree management
6.1 Accessing the Graphical Interface . .
6.2 Editing a node . . . . . . . . . . . .
6.3 Add, move, remove a node . . . . . .
6.4 Save and restore the tree . . . . . . .
6.5 Database configuration for charts . .
6.6 Security and technical considerations
6.7 Troubleshooting . . . . . . . . . . .
.
.
.
.
.
.
.
.
.
.
.
.
.
.
.
.
.
.
.
.
.
.
.
.
.
.
.
.
.
.
.
.
.
.
.
.
.
.
.
.
.
.
.
.
.
.
.
.
.
.
.
.
.
.
.
.
.
.
.
.
.
.
.
.
.
.
.
.
.
.
.
.
.
.
.
.
.
.
.
.
.
.
.
.
.
.
.
.
.
.
.
19
19
20
25
26
28
29
30
.
.
.
.
.
.
.
.
.
.
.
.
.
.
.
.
.
.
.
.
.
.
.
.
.
.
.
.
.
.
.
.
.
.
.
.
.
.
.
.
.
.
.
.
.
.
.
.
.
.
.
.
.
.
.
.
.
.
.
.
.
.
.
.
.
.
.
.
.
.
.
.
.
.
.
.
.
.
.
.
.
.
.
.
.
.
.
.
.
.
.
.
.
.
.
.
.
.
.
.
.
.
.
.
.
.
.
.
.
.
.
.
.
.
.
.
.
.
.
.
.
.
.
.
.
.
.
.
.
.
.
.
.
.
.
.
.
.
.
.
.
.
.
.
.
.
.
.
.
.
.
.
.
.
.
.
.
.
.
.
.
.
.
.
.
.
.
.
.
.
.
.
.
.
Avanced Interrogation tools
33
7.1 AdvancedFeatureInfo . . . . . . . . . . . . . . . . . . . . . . . . . . . . . . . . . . . 33
i
8
Avanced Interrogation tools, part 2
41
8.1 PolygonalQuery . . . . . . . . . . . . . . . . . . . . . . . . . . . . . . . . . . . . . . 41
9
Animations tool
45
9.1 Public interface . . . . . . . . . . . . . . . . . . . . . . . . . . . . . . . . . . . . . . . 45
9.2 Configuration . . . . . . . . . . . . . . . . . . . . . . . . . . . . . . . . . . . . . . . . 47
9.3 Technical considerations . . . . . . . . . . . . . . . . . . . . . . . . . . . . . . . . . . 50
ii
Geoportal for Risk Management for Gambia, Editor and Administrator Manual, Release
2.10.3-1
Editor & Administrator Manual
This is the editor & administrator documentation for the Geoportal for Risk Management
in Gambia.
Last update: December 01, 2014
Author : Jean Pommier, pi-Geosolutions
[email protected]
http://www.pi-geosolutions.fr
Contents
1
Geoportal for Risk Management for Gambia, Editor and Administrator Manual, Release
2.10.3-1
2
Contents
CHAPTER 1
Introduction
The Geoportal for Risk Management in Gambia application is actually an extension over GeoNetwork
OpenSource, a metadata catalog project, focusing on mapping features, backed by GeoServer map server
software.
This documentation will thus intensively refer to GeoNetwork documentation, when dealing with metadata management, and to GeoServer documentation when dealing about cartographic layers management.
1.1 Geoportal for Risk Management in Gambia and GeoNetwork
GeoNetwork is a metadata catalog server application, offering limited mapping features. It has been
recently enhanced with a widget capacity. This is a means to plug custom public interfaces on top of
GeoNetwork standard features.
The Geoportal for Risk Management in Gambia makes use of this capacity and is build as a GeoNetwork
widget, extending the mapping capacity.
While the public interface is totally specific to the Geoportal for Risk Management in Gambia project,
and properly documented in its User Manual, the editor and administration parts are massively native
GeoNetwork software (and GeoServer software as for the cartographic layers conception).
The main administration panel is thus the same as standard GeoNetwork, except for the layertree management parts.
1.2 Geoportal for Risk Management in Gambia and GeoServer
As told before, GeoNetwork deals with metadata management (and data cataloging), eand GeoServer
deals with the cartographic layers creation. The layertree (part of this project’s developments) makes the
link.
GeoServer is the piece of software that takes GIs data as input, and outputs them in an internet-usable
format. It also processes legend and query requests, and some more complicated requests, as used in the
Polygon Query tool.
3
Geoportal for Risk Management for Gambia, Editor and Administrator Manual, Release
2.10.3-1
4
Chapter 1. Introduction
CHAPTER 2
User profiles
In the following chapters, we will call user someone registered, with any credential level (editor, administrator, etc)
Credentials are dealt with separately for each server application: a user that is expected to manage both
GeoNetwork and GeoServer content must be registered both in GeoNetwork and GeoServer. His login
and passwords will not necessarily be identical.
2.1 User profiles in GeoNetwork
Figure 2.1: User profiles inheritance
There are several profile levels:
• Plain user, unregistered, cannot log in. He has only access to what is described in the User
Manual.
• Registered User has access to some restricted metadata and data.
• Editor has some limited rights: can create some metadata but not make them public (must be
validated by higher rank), mostly.
• Reviewer is same than Editor, except he can make metadata public
• Users Administrator is some kind of moderator over some groups of people.
5
Geoportal for Risk Management for Gambia, Editor and Administrator Manual, Release
2.10.3-1
• Administrator has all rights.
Note: It is not necessary to have people at each level. As a first start, one or two Administrators and
several Reviewers may be fine. Then as people get in, they should start as Editor (they will be harmless)
and when they prove trustworthy, be promoted to Reviewer.
If the scale grows larger, it may become interesting to dispatch the moderating functions over each
involved Organization: give each Organization a Users Administrator that will be able to manage his
own people.
It is not advised to multiply the number of Administrators, since as they have all rights, everything could
quickly get complicated.
2.1.1 Logging in
Figure 2.2: Logging in the portal
To log in the portal, enter your username and password in the login form, in the top-right corner and
press Sign in.
If your credentials are correct, the form will be replaced by your name. Place the mouse over the name,
it will open a menu. The Administration entry will lead to the main administration page. Most of the
other entries are some shortcuts to some menus in the administration page.
Note: being logged in will also have other effects, depending on your user profile: it will add some
entries in several menus, add some fields in the advanced search form and even add some available layers
in the layertree (Select tab)
2.2 User profiles in GeoServer
The Users management in GeoServer is much more open. See Geoserver Documentation, section Security.
Note: Having a profile in GeoServer is only needed for those who want to create new layers for the
layertree.
6
Chapter 2. User profiles
CHAPTER 3
Users management
Users management is a pure GeoNetwork native function, except for GeoServer usage (see User profiles
in GeoServer).
GeoNetwork uses the concept of Users, Groups and User Profiles.
• A User can be part of one or more Groups.
• A User has a User Profile.
• A User can only have one User Profile associated.
The combination of User Profile and Group defines what tasks the User can perform on the system or
on specific metadata records.
3.1 Groups
Note: To be able to edit and create new groups, one must have an Administrator profile.
Groups are used to gather people by affinity. Usually in a geocatalog, people will be grouped by organization or administrative structure. Groups allow to categorize the data and the access rights. For
example, a data that is internal to NDMA may not be rendered public, even to other Government agencies. It may be decided to give access to only the metadata sheet (but not the data itself) to other
Government agencies, in order to advertise that the data exists and whom to contact to know more ; but
to keep it secret from public, unauthorized users.
This is what groups are made for.
See the groups documentation on GeoNetwork documentation.
3.2 User Profiles
Note: To be able to manager Users profiles, one must have at least a Users Administrator profile.
Users profiles are an extension of this principle: a given User has a unique User profile, that will define
his credential level for each of the groups defined for the catalog.
A given User may be registered, for instance, as a User Administrator profile for the GBOS group, but
as mere Reviewer for the NDMA group. This allows for fine access and edition control.
7
Geoportal for Risk Management for Gambia, Editor and Administrator Manual, Release
2.10.3-1
Figure 3.1: Fake Jean Pommier user’s profile.
8
Chapter 3. Users management
Geoportal for Risk Management for Gambia, Editor and Administrator Manual, Release
2.10.3-1
See the User Profiles documentation on GeoNetwork documentation.
3.3 Ownership and privileges
3.3.1 Ownership
The original creator of a metadata is set as its owner. The owner is consider the referent person about
this metadata.
The owner can be changed by transferring the ownership on one or more metadata.
3.3.2 Transfer Ownership
This may happen mostly when someone quits his job: the metadata he used to manage must be cared
by someone else. In order for this to be properly conducted, it is necessary to transfer the ownership on
these metadata to the new caretaker.
Note: ownership transfer is available at the Users Administrator level or above
See the ownership transfer on GeoNetwork documentation.
3.3.3 Privileges
Privileges are the reason behind the Groups structure: it is possible, for a given metadata, to give different
access rights to each group.
See the privileges on GeoNetwork documentation.
Note: The privileges on a metadata can be set either by the owner of this metadata, by any Reviewer or
Users Administrator on the group the metadata belongs to, or any Administrator.
3.3. Ownership and privileges
9
Geoportal for Risk Management for Gambia, Editor and Administrator Manual, Release
2.10.3-1
10
Chapter 3. Users management
CHAPTER 4
Metadata workflow
As a preliminary about Metadata, please read Viewing and Analysing the Data in GeoNetwork documentation.
4.1 Edit an existing metadata
To be able to edit a metadata, you must have the rights to. Meaning you must be logged in (see Logging
in), and be
• either its owner (see Ownership)
• or have a Reviewer or Users Administrator profile on the group the metadata belongs to
• or be an Administrator.
Figure 4.1: Open the metadata in Edit mode
Usually, one would want to edit an existing metadata because some information are missing or incorrect.
This means you already have a link to the metadata sheet, either by performing a search on the Geocatalog or by asking for the metadata from a cartographic layer (Organize tab).
In the metadata sheet, on the top toolbar, there is an Action menu. If you are logged and have edition
rights, the first entry in the menu will be Edit. Click it, it will open the metadata in Edition Mode.
11
Geoportal for Risk Management for Gambia, Editor and Administrator Manual, Release
2.10.3-1
Then, the edition is the same than when creating a new Metadata, except the fields are already filled up
(at least some of them).
4.2 Create a new metadata
Figure 4.2: Create a new metadata
To create a new Metadata, you need to be logged in (see Logging in), will an Editor profile or higher.
1. Open your personal menu (let the mouse over the User name in the top-right corner), in the menu,
a New metadata entry should be there. Click it.
It will open a window called “Create a metadata by choosing a template and selecting one group.”
2. In this window, select the template from which the metadata will be created.
3. Then on the bottom on this same window, don’t forget to select the group the metadata will belong
to.
4. Press Create. It will open the new metadata sheet in Edit mode.
Then,
for
the
edition,
see
‘the
corresponding
section
<geonetworkopensource.org/manuals/2.10.3/eng/users/quickstartguide/new_metadata/index.html>‘_ in GeoNetwork
documentation.
4.3 Publish a metadata
Once the metadata has been created, it is available in the catalog, but only to people belonging to the
group selected on the metadata creation (see above).
12
Chapter 4. Metadata workflow
Geoportal for Risk Management for Gambia, Editor and Administrator Manual, Release
2.10.3-1
To make it fully available, you still have to set the privileges associated to the metadata, meaning the
access rights.
Figure 4.3: Open the Privileges window
A user with Editor profile will have only restricted possibilities. A Reviewer and above will have all
control on the privileges table.
Best way to find the newly created metadata is to open the personal menu and select Last update entry.
It will perform a search over your owned metadata, order by update date, so the first metadata should be
the one.
When letting the mouse over the metadata title, an Action menu should appear. Click on Action, it will
open the menu. Then go to Other actions → Privileges. It will open the Privileges table.
Figure 4.4: Setting the privileges
Below is a brief description for each privilege to help you identify which ones you should assign to
which group(s).
Publish: Users in the specified group/s are able to view the metadata eg. if it matches search criteria
entered by such a user.
Download: Users in the specified group/s are able to download the data.
Interactive Map: Users in the specified group/s are able to get an interactive map. The interactive
map has to be created separately using a Web Map Server such as GeoServer, which is distributed with
GeoNetwork.
Featured: When randomly selected by GeoNetwork, the metadata record can appear in the Featured
section of the GeoNetwork home page. *Not used in the Geoportal interface.
Notify: Users in the specified group receive notification if data attached to the metadata record is downloaded.
4.3. Publish a metadata
13
Geoportal for Risk Management for Gambia, Editor and Administrator Manual, Release
2.10.3-1
4.4 Using Templates
For a description of the Templates as used in GeoNetwork, see the corresponding Templates section.
Templates can be very useful to gain some time when creating several quite similar metadata: create
a template will all those metadata will have in common (points of contact, extent, common keywords,
etc), and then create your metadata using this template, at the creation time.
To create a template is as simple as creating a new metadata: you go as if creating a new metadata,
select an origin template, a group, go to the Edit form, edit the content, and then, in the top-left corner,
Record type button, select Template in place of Metadata. Save and close. It’s done, your new template
is created. Set the privileges accordingly to the use you want to make of this template: you can keep it
private or share it.
Actually, Templates are just some special metadata sheets, not visible when searching for metadata.
14
Chapter 4. Metadata workflow
CHAPTER 5
Create a WMS Layer
If you want to attach a cartographic layer to the metadata you created, or if you want to add a layer to
the Select tab, you will probably have to create a new WMS (Web Map Service) layer.
This is not straightforward, as it means:
• Knowing at least a little about GIS.
• Learning how GeoServer works.
• Putting the data on the server.
• Logging in GeoServer and publishing the dataset in GeoServer.
• Add the layer in GeoNetwork
5.1 GIS basics
It is important to have at least some basic knowledge about GIS (Geographic Information Systems).
This is far beyond the purpose of this documentation. It is advised to have at least a short training
about it.
5.1.1 Why is it important ?
Geographic data have some specific issues that, if not aware of, will make them very hazardous to
manipulate. For example, every GIS software makes the assumption that you know:
• The difference between vector and raster data
• The projection system used.
And this is a very minimum.
Some GIS file formats can contain very different data. For instance, GeoTiff files can contain one-band
data ranged between 0 and 255, or several bands of data with data taking arbitrary values (real values,
actually, ranging, for example, between -2300 and +4000). Shapefiles are not one file, but a set of several
files, can should never be separated. One file missing and the whole dataset is unusable.
5.2 Learning how GeoServer works
GeoServer is very well and fully explained in their documentation. Please refer to it for GeoServer use.
15
Geoportal for Risk Management for Gambia, Editor and Administrator Manual, Release
2.10.3-1
It is advised to install a GeoServer instance on your computer, to train, test, and first publish your
datasets. Then, when done on your computer, you will go and publish on the Geoportal’s GeoServer
instance.
5.3 Putting the data on the server
After having properly published the data on your computer’s GeoServer instance, you will want to
publish it on the Geoportal’s GeoServer instance.
In order to do this, you will first have to put the data on the server and get a credential to log in the
GeoServer instance.
To put the data on the server, you will have to address to the Geoportal’s System Administrator. Depending on whether you will publish data on a regular basis or very occasionally, he will grant you a
write access on the server or you will have to give him the data, so he can put it himself.
To get a credential, you will have too to ask to someone having administrator rights in GeoServer. You
may ask to the System Administrator too.
5.4 Logging in GeoServer and publishing the dataset in GeoServer
After you get your credentials, you will be able to log into the Geoportal’s GeoServer instance. Current
address is http://gm-risk.pigeo.fr/geoserver-prod/web/.
While logged in, you will simply have to repeat the steps taken when first publishing the data on your
computer’s GeoServer instance.
Remember: GeoServer documentation is your friend !
5.5 Add the layer in GeoNetwork
There are two use cases:
• Attach the WMS layer to a metadata.
• Add the WMS layer in the Select tab (see Layertree management).
5.5.1 Attach the WMS layer to a metadata
This is done in the Edition form of the metadata. In the top-right‘corner, click on the
select Add online resource.
button and
Figure 5.1: Open the ‘new resource’ form
16
Chapter 5. Create a WMS Layer
Geoportal for Risk Management for Gambia, Editor and Administrator Manual, Release
2.10.3-1
This will open a window with a form. Check Link a URL and enter:
• URL:
if
using
the
Geoportal’s
GeoServer
server,
http://gm-risk.pigeo.fr/geoserver-prod/gm/wms?
it
will
be
• Name: you will put the GeoServer‘s layer name. It will look something like gm:gm_4c_soils
• Description: this is the text you want to be displayed in the metadata sheet, for the link to this
layer. This will usually be layer’s name in human-readable terms. E.g. Soils association
• Protocol: unless you know what you are doing, you will select OGC-WMS Web Map Service
Figure 5.2: Adding a WMS layer
Then press the Upload button (improperly named for this case) and that’s all. It should show in the
Related Resources panel in the top-right corner.
5.5. Add the layer in GeoNetwork
17
Geoportal for Risk Management for Gambia, Editor and Administrator Manual, Release
2.10.3-1
18
Chapter 5. Create a WMS Layer
CHAPTER 6
Layertree management
Note: Layertree Management in reserved to Administrator profiles.
What we call here Layertree is the tree-like structure, on the Select tab, in the Geoportal interface. It
organizes the cartographic layers in a hierarchical way, just as files are stored on your computer, in
hierarchically organized folders.
This structure is now stored in the database, which opens new possibilities.
It is administered through a graphical user interface, which makes it easier to manage for non-technical
people.
It now allows to define per-layer visibility privileges, which allows to fully customize accessible data,
depending on the groups the user belongs to.
6.1 Accessing the Graphical Interface
The Graphical Interface is accessible through the main administration page. Its access is granted only to
people registered as Administrator.
Figure 6.1: Opening the Layertree Administration page.
A new entry in the administration interface has been added : Geoportal configuration. It will regroup all
the additional administration tasks developed in the Geoportal scope. For now, there is only Layertree
management.
“Manage Layertree” will show up only if you are properly identified as an Administrator.
It opens an interface composed of 4 parts :
• a menu on the top-left
• the tree structure on the left
• an empty (for now) panel on the right
19
Geoportal for Risk Management for Gambia, Editor and Administrator Manual, Release
2.10.3-1
Figure 6.2: The page’s layout
• a “console” panel on the bottom.
6.1.1 Menu
The menu lists almost all the actions you can perform on the structure : Save/restore/export the tree,
Add, remove or duplicate a layer/folder. Those actions will be described further in this documentation.
6.1.2 Tree
The structure is exactly the same as what will be available in the public interface. An open folder, will
result in a open folder in the public interface. A closed one will be closed. A checked layer will be
checked on the public interface (i.e. visible).
6.1.3 Right-panel
This is where the edition panels will be placed. It’s content will depend on the pending action. We will
explain each of them further down.
6.1.4 Console
The console logs some information about the performed actions. Keeping an eye on it will ensure you
that all performs smoothly
6.1.5 Conventions
In the following chapters, for convenience, we will call ‘node’ a tree node, i.e. a layer or a folder.
6.2 Editing a node
This is quite easy. Just click on a node, on the tree. A form will show on the right-panel, listing the
node’s attributes.
20
Chapter 6. Layertree management
Geoportal for Risk Management for Gambia, Editor and Administrator Manual, Release
2.10.3-1
The 2 first nodes are grayed, meaning you can’t edit them. They are here for mere information.
A few (not much) fields in the form are common to all kinds of nodes. Most of them are specific.
At the bottom of the form, two buttons allow you to either cancel the changes (resets the form to previous
values) or apply the changes (applies to the Layertree). If you don’t Apply, the changes won’t be kept.
6.2.1 Common fields
• ID: unique ID attributed to the node. Non-editable (used internally in the database & code).
• Type: kind of node. Takes one of the following values : folder, wms, chart. Non-editable (used
internally in the database & code).
• Text: this is what will be displayed in the layertree, the node’s label.
• CSS class: it is meant for easy-extending the features. For now, only 2 values are available:
important (writes the name in bold) and grey (greys the name). Adding some more
classes is easy for someone who know CSS styling : just edit the apps/geoportal/css/gnjp.css
file and add some entries of the following form: .x-tree-node .important
{font-weight:bold;} where you replace .important by the name you want, and
the content of the {} by the css style.
• Extensions: it is meant for easy-extending the features. For now, we leave it blank.
• Groups visibility: it lists all the groups available (as defined in the Geonetwork administration
interface. Groups are a way of organizing people and giving them rights depending on the
groups they belong to).
By default, all groups are checked, meaning the node is visible to everybody.
See Groups management chapter for more details.
6.2.2 Folder nodes
Figure 6.3: Folder nodes form
Folder nodes have nothing more. They are just here for organizing the layer nodes.
Note: The folded/expanded state is stored too. Not in this form, but when you save the tree to database.
Don’t forget it when saving !
Specific folder node: the first node of the tree, ‘Base layer’ is in fact a folder node, despite its different
icon. You shouldn’t move or remove it, it stores the basic background layers (Bing data, Open Street
Map, etc), automatically. Still, you can change its name if you want.
6.2. Editing a node
21
Geoportal for Risk Management for Gambia, Editor and Administrator Manual, Release
2.10.3-1
Figure 6.4: WMS node
6.2.3 WMS nodes
There are some more fields for a WMS node :
[General features block]
• Opacity: Opacity of the layer. Ranges from 0 to 1 (1 is fully opaque, 0 is invisible). Default is 1.
• Comments: you can set here some text, that will show up when the mouse is over the layer’s
name, in the public interface.
[WMS features block]
• WMS server URL: this is the URL of the WMS server. It depends on the map server
(GeoServer, MapServer, etc) you are using for this layer, and its location. Default is
http://gm-risk.pigeo.fr/geoserver-prod/gm/wms?
• Layer(s) name(s): you put here the layer’s name, as defined in the map server. A list of layer
names should work too, resulting in a combination of the layers.
• Image format: PNG is the default. It’s fine, usually. You can also chose JPG.
• TILED: default is checked, and it is fine. You will uncheck it for data that you don’t want to store
in cache, e.g. live data that will change on a regular basis.
• Legend URL: if left empty, the geoportal will use the default legend processing. Use it when you
want to customize the legend, or to link to a pre-generated, external legend file. The value must
be a valid URL.
[Metadata reference block]
• UUID: here you can enter the uuid (Unique Universal Identifier) of a corresponding metadata
sheet. This links the Geonetwork metadata entry to the node.
6.2.4 Chart nodes
The General features section is similar to WMS nodes. The rest is much larger.
A chart node is a very specific kind of data, requiring to know the underlying data quite well. It combines
one or several GeoJSON WFS layers, giving the geospatial data, with some database tables, containing
the corresponding data.
GeoJSON WFS layer and database tables are linked by pair. Several GeoJSON layers (and their corresponding DB table) can be used to set different representations depending on the map scale, e.g. regional,
22
Chapter 6. Layertree management
Geoportal for Risk Management for Gambia, Editor and Administrator Manual, Release
2.10.3-1
district and ward levels. It is also possible to use only one representation level : you will then set only
one GeoJSON layer, and one DB table.
Preparing the data
Figure 6.5: Preparing the data : collecting info
To perform a join between the GeoJSON layer and the database table, both need a common identifier, on
which the join will be made. The identifier’s name need not to be identically named, although it helps
recognizing the relationship between the geospatial data and the associated dataset (DB table).
As shown in the previous figure (Land Use data example), for a given join ID, the database table will
display several rows: 1 row per value that you will want to represent in the chart.
Both the fields present in the geospatial data and in the DB table will be available in the definition of the
chart’s size (see below).
Please be careful with the naming of the fields (geospatial data fields AND database fields): avoid blank
spaces, special characters, accentuated characters. Are fully supported : alphanumeric chars, and “_-”.
Others than that are not advised not guarantied.
Note: In the following form, be careful not to leave unrelevant blank spaces or quotes: it may break the
configuration.
Chart nodes form fields
Figure 6.6: Chart node form field
[General features block]
• Opacity: Opacity of the layer. Ranges from 0 to 1 (1 is fully opaque, 0 is invisible). Default is 1.
6.2. Editing a node
23
Geoportal for Risk Management for Gambia, Editor and Administrator Manual, Release
2.10.3-1
• Comments: you can set here some text, that will show up when the mouse is over the layer’s
name, in the public interface.
[Geographic features]: regroups the fields related to the GeoJSON geospatial dataset
• WFS server URL: this is a typical WFS GeoJSON URL, except that the typeName parameter is set last, with no value (the value will be set using the next field). Default is:
http://gm-risk.pigeo.fr/geoserver-prod/gm/ows?service=WFS&version=1.0.0&requ
GetFeature&maxFeatures=500&outputFormat=application/json&typeName=
• Layer(s) name(s): the GeoJSON layer’s name. If you want multi-scale representation, this will
be a comma-separated list of the layers’ names. No blank space will be accepted in the list. Please
note that the order matters, in the list : is goes from the largest to the closest.
• Changing scale(s): a comma-separated list of values (leave no blank space), the same cardinality
than in layer(s) name(s). It defines the minimum scale at which the corresponding layer will be
visible.
• Image format: for a chart layer, there is only one value: GeoJSON.
• Legend URL: if left empty, the geoportal will use the default legend processing. Use it when you
want to customize the legend, or to link to a pre-generated, external legend file. The value must
be a valid URL.
• Data join field: the field used, on the geospatial data side, for the join. Must be visible in the
Geoserver’s layer editor, first page on the bottom, and spelled the same.
[Database params]: fields related to the database data
• Database: drop-down list of available databases. A database needs to be configured in the system
(see below) in order to be made available.
• Table(s) name(s): a list of the database tables (or views) to use, from the smallest to the largest
scale. They should be comma-separated, with no space. Same cardinality as Geospatial layer(s)
name(s) is mandatory.
Access right to the DB tables must be given either to ‘‘geonetwork‘‘ user (the user
set in the Databases config), or ‘‘Public‘‘ access.
• Data join field: the field used, on the database side, for the join.
• Values field: the field that will be used for dimensioning the chart’s elements (pie parts in pie
chart, bar height in bar chart). Must be numeric.
• Labels fields: the field to use in setting up the color scheme (see Color codes below)
• WHERE clause: allows to introduce a selective filter in the SQL query. E.g. remove all null
rows. It is an slice of pure SQL, as you would put it in a normal SQL query. It can even take field
values that are not listed in the above form entries.
[Representation]
• Chart type: you can choose either Pie or Bar charts. Default is Pie chart.
• Color codes: comma-separated list of key/value pairs. Keys are taken among the Label fields
entries and Value is a color as set in HTML hexadecimal representation (#RRGGBB). Both key
and value must be encased in single quotes. If not set or incorrect, it will use random colors.
• Chart size: in pixels. Any expression that can be processed in javascript is OK. Simplest
expression is plain numeric value, e.g. 30. More complicated expression can be, for
24
Chapter 6. Layertree management
Geoportal for Risk Management for Gambia, Editor and Administrator Manual, Release
2.10.3-1
example, Math.round(Math.sqrt(100 + d.data.area* 100000)).
javascript built-in Math functions.
See
You can access the data from either the geospatial data, or the database data:
– to access to the geospatial data, use the geo variable
– to access to the database data, use the d.data variable.
Example: in the previous Land use scheme, you can access the area value using ‘‘d.data.area‘‘. The ocsol value will be accessed at ‘‘d.data.ocsol‘‘. And the
geospatial name field will be accessed as ‘‘geo.name‘‘.
[Metadata reference block]
• UUID: here you can enter the UUID (Unique Universal Identifier) of a corresponding metadata
sheet. This links the Geonetwork metadata entry to the node.
When done editing a node, one should make ‘Apply’. If not, the changes won’t be kept.
Warning: Apply submits the changes to the working layertree, but doesn’t save it at once to the
database. You will still have to ask to Save the tree to DB, for this.
6.3 Add, move, remove a node
Editing nodes if obviously not sufficient. You also have to be able to add some nodes, remove others,
and reorganize the structure.
6.3.1 Add a node
Figure 6.7: Add a node
To add a node, first select the place you want it to be created. You can select either a folder (that will
contain the node) or a layer that is at the same level than the node you want to create.
Then, in the menu bar, click Add and select the kind of node you want to create.
And finally, edit the parameters of the newly created node, in the right-panel, and make ‘Apply’.
6.3.2 Duplicate a node
This is another way of creating a node : you duplicate the currently selected node, and change its setting.
This can be faster when the nodes are very similar. You can then move the node to another folder, if
needed.
6.3. Add, move, remove a node
25
Geoportal for Risk Management for Gambia, Editor and Administrator Manual, Release
2.10.3-1
6.3.3 Remove a node
This is self-explaining. A confirmation window will ask you to confirm you really want to delete the
node.
6.3.4 Move a node (reorganize the tree structure)
Reorganizing the structure is done by drag’n’drop : click on a node, keep the mouse clicked, and move
the node wherever you want.
Please note you can practice all this without risk as long as you don’t ask for “Save to DB”. And even
then, you still have the possibility to restore the tree to a previous state.
6.4 Save and restore the tree
We have seen how to change the tree : add nodes, remove some, change them. Now, how to persist the
changes we have done ?
In the menu bar, first entry is Tree input/ouput : Save to DB, reload, export, import, backups management.
Figure 6.8: Save the tree
6.4.1 Saving the tree
It is as simple as clicking on “Save to DB”. It will ask you for a name. This name will be use for backups
management, to allow you to identify this version of the tree. Use explicit names as much as possible.
Or code it the way you like, as long as it’s clear to you.
Check on the console, if something goes wrong, it should tell you.
6.4.2 Reload the tree
Let’s assume you removed a node you didn’t want to. As long as you haven’t save to the DB, you still
can revert to the DB version, by reloading the tree (from DB).
26
Chapter 6. Layertree management
Geoportal for Risk Management for Gambia, Editor and Administrator Manual, Release
2.10.3-1
6.4.3 Export as JSON
This will export the current tree (the one in the interface, not from the DB) in a JSON data format (kind
of javascript). You can then copy it and save it in a file, or view it in a text editor.
This can be one of the ways to perform tree backup (even though there is an integrated, database driven,
backup system).
It is over all a way to get the tree and import it in another geoportal instance. A manual ‘replication’
facility.
6.4.4 Import JSON
This is the backside of “Export as JSON”. It allows you to replace the current tree by the content of the
JSON data. You have to paste the JSON content in the provided form.
This is useful also to import a layertree that was in the previous, .js (javascript) format. To do so, one
has to slightly change the file’s content :
• replace the first line, var treeConfig = [ by { treeConfig = [
• replace last line, ]; by ]}
And it should import smoothly.
6.4.5 Restore previous version
Figure 6.9: Restore a previous backup
. . . could also be called Backups management since it allows much more than restoring from previous
version.
A database table is dedicated to storing a history of automatically generated backups : each time you
save the tree, is backs up the tree in the backup table. This way, if something goes wrong, you always
can go back to a previous version.
This will open a grid view in the right-panel. The backups are listed in chronological order. You can
change the ordering if you want (order by name, by date). Select a row, and you can remove it, view
it (in JSON data format, just as “export to JSON” would do) or restore it. Restoring will replace the
current working tree by the data contained in the backup. You will still have to perform ‘Save to DB’ if
you want to persist the changes.
6.4.6 Groups management
We have seen that for each node, you can define which groups will have read-access. A person often
belongs to several groups. If one of the groups has read-access, this person will have read-access, no
matter what is defined for his other groups.
6.4. Save and restore the tree
27
Geoportal for Risk Management for Gambia, Editor and Administrator Manual, Release
2.10.3-1
Figure 6.10: Groups management
This is also true about the ‘all’ group. This is internal system group. every visitor, registered or not,
belongs to the ‘all’ group. Thus, if the ‘all’ group is checked, whatever you o to other checkboxes,
everybody will see the node.
The 2 first groups (GUEST and intranet) are some system-specific groups, and you can forget about
them. They will probably be filtered out in the next version.
Please note that if a user is not allowed to see a folder node. This folder’s child nodes too, won’t be
visible to this person. For example say ‘Food Security’ is set such that only GBOS users can see it
(check only GBOS group checkbox). Then only GBOS users will be able to see its subfolders and
contained layers, no matter what groups are checked in those subfolders. You have “cut access” to the
Food security folder and child nodes.
Of course, even GBOS users will need to login to the geoportal in order to see this folder : if not, the
geoportal systme won’t know they’re GBOS.
For now, in the public interface, the layertree is not live-updated when you login : once logged in, you
have to reload the page in order to have the layertree updated with your group-specific settings.
6.5 Database configuration for charts
In order to enable a database to be used for the charts, it must have been properly configured in the
application. This is low-level configuration. You should probably ask to the system administrator.
If you are the system administrator, here is how to proceed :
1. edit WEB-INF/config-override-prod.xml and add the following block under the last </resource>
tag :
<resource enabled="true">
<name>gm_census</name>
<provider>jeeves.resources.dbms.ApacheDBCPool</provider>
<config>
<user>${charts-db.user}</user>
<password>${charts-db.pass}</password>
<driver>org.postgis.DriverWrapper</driver>
<url>jdbc:postgresql://localhost:5432/gm_census</url>
<poolSize>10</poolSize>
<validationQuery>SELECT 1</validationQuery>
</config>
</resource>
This is the block code for a postgresql table.
INF/config.xml what to adjust.
To use other databases see in WEB-
You may change some of the parameters :
• user and password. In the above code block, we’re using the variables defined at the
top of the override file. You can replace them with plain values (without the $ and the
accolades, though) or create new variables. Or use already defined variables.
28
Chapter 6. Layertree management
Geoportal for Risk Management for Gambia, Editor and Administrator Manual, Release
2.10.3-1
• url: it tells the system where to look for the database. You will want to change the
database name (here, gm_census ), and possibly the host ( localhost ) and port ( 5432
).
2. in WEB-INF/config-pigeo-charts.xml, add the following block just above the </DBs> tag :
<db>
<id>gm_census</id>
<label>gm_census</label>
</db>
The id value must match the database’s name as defined in the config-overrides-prod.xml
file.
The name value is the text that will be displayed in the drop-down list, in the Layertree
Manager.
3. Reload the geoportal app (server reload, not browser reload) : either reload it in Tomcat, or reload
Tomcat.
4. Check if it works.
6.6 Security and technical considerations
The layertree management has been transferred to database services because of that need to filter nodes
visibility depending on the groups a user belongs to. Since groups are managed in the database, the best
and cleanest way was to put the tree in the database too. It also eased adding a Graphical Interface to
manage the nodes, backups, etc.
6.6.1 Security considerations
The recovered tree when requesting the DB is not exactly the same depending whether you ask it from
administration interface or from public interface. If from administration, you must be an administrator,
so we don’t have to hide information from you.
But from public interface, we have security in mind : aa anonymous user shouldn’t know the list of the
existing groups names. Thus, when accessing anonymously to the public interface, the layertree sent by
the server is purged from any groups information, to avoid a hacker sniffing some hidden information.
When someone logs in, the layertree is request once more to the server, and the layertree sent by the
server is built corresponding to these new rights, the identified user’s rights. For now, the interface has
to reload, in order to apply the new layertree. This is not done automatically, since ongoing work could
be lost. So, you have to manually reload the page to effectively update the layertree.
This is not optimally fluent. But it s a secure way to ensure one does not have access to information he
shouldn’t.
6.6.2 Database technical considerations
Concurrent access
A common issue when editing databases on the web is when two or more users modify the database at
the same time. Consulting is no problem, but committing is.
6.6. Security and technical considerations
29
Geoportal for Risk Management for Gambia, Editor and Administrator Manual, Release
2.10.3-1
Let’s imagine administrator A opens the layertree management page, and starts making some changes.
Administrator B connects, opens the layertree management page while A is still making his changes. B
adds a new node.
While B edits his node, A saves his changes to the DB.
Then, B finishes editing his node, saves the tree to the DB. A’s changes will be lost, since the tree version
B was working on was the tree structure before A commits his changes.
To avoid this kind of issues, we use a timestamp to know if the database has been changed since last time
we loaded it. If it is the case, an error is issued, and the user is made unable to save his changes, unless
he decides to force the save action. Instead, b est way then, for now, is to export the current working tree
as JSON, put it in a text editor, reload the tree from the DB, and apply the changes you couldn’t save
before. Maybe after waiting a bit, to make sure nobody is still concurrently working on the tree.
This scenario is very unlikely to happen, unless many administrators are devoted to working with the
layertree. If necessary, a light versioning facility could be set up to help solving those issues, but it may
required much work for a case that will rarely happen.
Network resilience
It can happen that network is unreliable. In those case, you don’t want the tree to be half-saved to the
DB. This is why, for each action performed to the DB, the whole requests set is wrapped in COMMIT
statements, with ROLLBACK if the transaction failed.
This ensures consistency within the database.
6.7 Troubleshooting
6.7.1 Wait, the layertree manager has crashed !
Yes, it can occur. Some consistency check are performed on the data entered in the forms, but not much
(this is very time-consuming to try to thinks of any possible mishaps).
Don’t panic ! Reload the web page. You may loose the tree, but you should still have the menu. Go to
Tree, and restore a previous backup. If this is not possible, then it’s a true bug, and please report it at
[email protected]
Next step would be to figure out was goes wrong. Probably, you inserted some quotes where there
shouldn’t be. This is a known cause of manager crash, and will prbably be addressed in later versions.
Waiting for the fix, be careful to strictly follow the specs.
6.7.2 I suddenly get a Login page
Your coffee-break has lasted too much. The session has closed itself, and you must login again.
6.7.3 My chart layer doesn’t show in the Geoportal public page
Charts are quite complicated and a lot can happen. Here are some steps to look at:
1. Check that cardinality is the same for Layers names , Changing scales and Table names .
30
Chapter 6. Layertree management
Geoportal for Risk Management for Gambia, Editor and Administrator Manual, Release
2.10.3-1
2. Check that you don’t have trailing spaces in those fields (and possibly in all)
3. Concatenate the WFS server URL and the Layers names. Copy the result in your browser address
bar, and hit enter. It should display lots of text. If you get an error, your configuration of the
GeoJSON part is wrong.
4. Check that you spelled correctly the join fields , for both datasets (geo and DB)
5. Check that you gave sufficient access rights to the user the database is accessed with (see Database
configuration Chapter)
6. Check that the Values and Labels fields are correctly spelled, and that the WHERE clause is correct.
7. Try a fixed Chart size . Maybe your math expression is wrong.
8. Install a tool to examine the requests made by your bowser, Firebug for example. Open the
geoportal’s public page, open the firebug console and check the incriminated layer. Two new URL
should show in the console, telling you they’ve been loaded. One of them is the WFS request for
GeoJSON data. The other is the database request (result in JSON format). Look for errors in the
output of one of the requests, it may help you understand what happens. If no error, you should
definitely check the Chart size expression.
6.7.4 In my chart layer form, nothing shows in the Database drop-down list
Bad configuration of the available databases. See the databases configuration chapter
6.7. Troubleshooting
31
Geoportal for Risk Management for Gambia, Editor and Administrator Manual, Release
2.10.3-1
32
Chapter 6. Layertree management
CHAPTER 7
Avanced Interrogation tools
In the scope of this project, two tools related to interrogation have been implemented:
• AdvancedFeatureInfo is an improvement of the standard interrogation tool (the i tool in the top
toolbar of the map) aiming mostly at providing human-fancy labels instead of database-IDs, for
the attributes of the queried layers.
• PolygonalQuery is a new tool aiming at calculating basic statistics on a selected surface. It will
apply only to specific raster layers like population.
7.1 AdvancedFeatureInfo
7.1.1 Presentation
This improvement replaces the previous standard interrogation tool. This is the tool that can be used by
clicking on the i button in the map’s top toolbar : it triggers the mouse in interrogation mode, meaning
that, as long as you are in this mode, when you click on a place on the map, it will perform a query on
each of the layers shown on the map. Thus, to use the interrogation tool, you have to check some of the
layers, and click on a place covered by at least one queryable layer.
Note: To quit the interrogation mode, you may click on the ‘hand’ button on its left. It will put you
back in ‘pan’ mode (move the map).
The query will return a result for each entity under the mouse click, meaning you can have several
returns for a single layer: if you click on the boundary between several polygons, for example, it will
return all the polygons concerned by this boundary.
Note: An important thing to note is that it will only query layers that are made queryable. This is not
set on the geoportal’s side, it is defined in the WMS layer’s definition, in the map server (GeoServer if
using the geoportal ‘s standard map server).
While the standard tool, in answer to a query, displayed a table of fields represented as pairs
ID/value, the IDs being often plain, hardly understandable character strings, the advanced tools
returns a table with the pairs label/value. The labels being entered through an interface that allows
to set, for each of these previous IDs, a different label for each language available. It even allows
setting some of these fields as hidden.
33
Geoportal for Risk Management for Gambia, Editor and Administrator Manual, Release
2.10.3-1
Figure 7.1: How the interrogation works
Figure 7.2: Comparative output. Left: standard tool raw output. Right: advanced tool formatted output.
7.1.2 Features
Queryable layers
Figure 7.3: Setting a layer as queryable, in GeoServer.
Nothing changed regarding this aspect, but it may be important to clarify how it works: the tool can get
information only from layers that are made queryable. This is not configured by the geoportal itself,
but rather on the map serves that are used. If using the standard GeoServer instance shipped with the
geoportal, it is set on GeoServer, when defining the layer’s configuration. By default, GeoServer sets its
layers as queryable.
Chart layers, being some complex, composite layers, are not queryable.
34
Chapter 7. Avanced Interrogation tools
Geoportal for Risk Management for Gambia, Editor and Administrator Manual, Release
2.10.3-1
Translation
Labels translation is the main purpose of this tool. First kind of translation is from computer-readable
labels (database-friendly IDs) to human-readable labels. Second consideration is matching the user’s
language.
The tool allows to translate the content to any of its supported languages. Since for now it supports
English and French, those 2 languages are the only ones available.
Labels translation is set independently for each language. You can for example translate to nice labels in
English only, but leave it raw for French version. Or hide different elements depending on the language
used.
Hiding some fields
It is indeed possible to hide some fields: when GIS people generate a geographic data, some of the
attribute may be destined only to specific usage, and have no interest for end-users.
Hiding a field is as simple as setting its translation to #hide#.
7.1.3 Managing the fields
Figure 7.4: Accessing to the Fields Manager.
For now, we have presented the results, but not the way to do it. Let us see how to proceed.
• First, you need to be logged in the geoportal with an Administrator profile.
• Then, you simply perform an interrogation, as would do a simple user (see illustration in Presentation chapter).
You will notice a button that is not present when acting as unprivileged, simple user : on the
top-right corner, a button called Manage fields . Clicking it will open the Fields Manager for the
currently displayed layer (layer selected on the left part of the window).
• In the Fields Manager window, first select the language (defaults to english), then start editing the
fields translations: on the left is the default field label (its ID), on the right is the label. Click on
the label to start editing it. Press enter when done.
7.1. AdvancedFeatureInfo
35
Geoportal for Risk Management for Gambia, Editor and Administrator Manual, Release
2.10.3-1
Figure 7.5: Managing the fields.
Fields formatting
Changing a label is as simple as clicking it, typing the text and pressing enter when done.
But you can also perform some simple formatting, using basic HTML tags :
• bold: enclose the text between <b> and </b> tags
• italic: enclose the text between <i> and </i> tags
• underline: enclose the text between <u> and </u> tags
• colored text: enclose the text between <font color="red"> and </font> tags to make it
red (for example)
Figure 7.6: Some examples of fields HTML formatting
36
Chapter 7. Avanced Interrogation tools
Geoportal for Risk Management for Gambia, Editor and Administrator Manual, Release
2.10.3-1
Hiding a field
Figure 7.7: Hiding fields.
Hiding a field is as simple as entering #hide# as its label. It is done independently for each language.
Live (non-persistent) testing
You can easily test the result before saving:
• Make your changes
• Move the Fields manager on one side, of close it
• Click somewhere on your map to perform a new interrogation. The output should take into account
your changes.
• Adjust your labels, if they didn’t suit your needs
• Perform a new interrogation to check
• etc.
• When you’re done, save your changes.
Warning: Until you save the changes, are your work is non-persistent: it is updated ‘live’ on your
browser, but now saved on the server. Meaning that if you reload the page, you will loose any unsaved
changes.
Please note that it is also the way to cancel your changes: no need for a reset button: simply reload
the page in your browser...
Saving
On the bottom of the Fields Manager are two Save buttons. You can either:
• save on a per-layer basis: you make your changes, then save, just the changes for this layer
• save on a per-session basis: since all your changes are stored in your browser, you can choose to
work on several layers, and save the whole at the end. For this, you will use the Save all changes
button.
7.1. AdvancedFeatureInfo
37
Geoportal for Risk Management for Gambia, Editor and Administrator Manual, Release
2.10.3-1
7.1.4 Technical Considerations
Database concurrent access
As explained in the Layertree Management tool’s documentation, database concurrent write-access can
be trouble.
Every tool storing data on a database is prone to concurrent write-access. Sometimes, it is a critical issue,
like in the Layertree Management tool, since it could result in loosing some sensitive configuration work.
In this tool, however, not much could be lost. And since database concurrent write-access is something
quite unlikely (the tool is available only for Administrator profiles, translating is a one-shot operation
and is quite straight-forward), we estimated is was not worth the time and efforts necessary to deal with
it.
Network resilience
This is much more sensible : since network happens to be unreliable, network resilience had to be
addressed. It is, in two ways:
• when writing to the database: by wrapping the SQL request in a COMMIT statement, every
transaction is stored in a unique bunch, making the whole data to be stored, or nothing at all in
case of a failure. This ensures we don’t break anything in case a failure happens in the middle of
the process.
• Suppose you loose internet connection while you are working on the translations. You didn’t get
time to save your changes. Since the changes are already stored locally on your browser, you just
have to make sure you don’t reload the page until you get your connection back. Then, you will
be able to save all the changes, by clicking this Save all changes button. See the Troubleshooting
section for more details on this scenario.
Known issues
Layer groups
Due to the way layer groups are handled in GeoServer, there is no way to get pretty-print with them:
when performing an interrogation for a layer group, the result is given for each underlying layer, with no
information about the layer group itself. And on the client side, we have no information of which layers
the layer group is composed of.
As a consequence, making the layer groups compliant would require performing several requests to
match the names, and result in a huge payload in terms of internet bandwidth consumption.
Bandwidth being on of the main preoccupations in the background, we decided not to work on layer
groups interrogation: it will be kept as it was with the basic interrogation tool. Layer groups are quite
rare, and mostly regroup information also available in separate layers, so it should not be problematic.
A s it is, if querying a layer group, the query tool will load and display raw results from the underlying
layers. If you don’t want this to happen, a workaround is to compose the layergroup from layers that are
not made queryable: as a consequence, the layer group will not be queryable.
38
Chapter 7. Avanced Interrogation tools
Geoportal for Risk Management for Gambia, Editor and Administrator Manual, Release
2.10.3-1
7.1.5 Troubleshooting
I lost my internet connection before I could save the changes
Don’t panic ! Really, don’t. First of all, don’t reload the page.
• Since the changes are already stored locally on your browser, you just have to make sure you don’t
reload the page until you get your connection back.
• Wait for your connection to come back, then open again the geoportal in a new browser tab or
window, and check your are still logged in. If not, log again (with your Administrator profile).
• Come back to you first geoportal window (the one where you made the changes).
• C lick th e
Save all changes button.
• C ome back to your second geoportal window.
• Try an interrogation on one of the layers you edited, to check that the changes are saved. (checking
on the same window will not work, since it will use the locally stored information, on the browser
page, not from the database).
It should be OK. If not, check again that you are logged in as administrator, and that your network
is really back...
I can’t query a layer !
Check the following points:
1. Is the layer displayed on the map ? It must be visible on the map. If the layer is unchecked, it
won’t be queried.
2. Is it a chart layer ? chart layers are not queryable.
3. Maybe you clicked on a place on the map where the layer has no data. If the layer has no data on
this place, it will return nothing.
If you didn’t find your answer, then it is likely the layer is simply not queryable, as defined on the map
server.
On the FeatureInfo panel, on the left, some of the row are blank
See Layer Groups , in the Technical Considerations chapter.
7.1. AdvancedFeatureInfo
39
Geoportal for Risk Management for Gambia, Editor and Administrator Manual, Release
2.10.3-1
40
Chapter 7. Avanced Interrogation tools
CHAPTER 8
Avanced Interrogation tools, part 2
8.1 PolygonalQuery
8.1.1 Presentation
The AdvancedFeatureInfo tool, as well as the basic FeatureInfo tool before, only allows to perform
punctual queries. While this satisfies many needs, there are some cases when you want to collect some
information on a surface rather than on punctual locations. Say, for example, you need to know how
many people live in a given area at risk. Or, you want to know the lowest, or the highest elevation in this
area. You will not do this using punctual queries. You will use this new polygonal queries tool.
This tool will be available for only specific layers. You will just have to select a layer, draw on the map
the polygon defining the area you want to query, and get the results.
8.1.2 Activate the tool
From the Organize tab (left panel), select a layer PolygonQuery-enabled (see picture above). The button
in the toolbar will be made active. Click then on the button, and draw your polygon.
8.1.3 Limitations
The Polygon Query is only available for specific layers. They needs to comply to those criteria:
41
Geoportal for Risk Management for Gambia, Editor and Administrator Manual, Release
2.10.3-1
• be raster layers
• be served by a map server that supports WPS (Web Processing Services). For more information
about this, see Technical Considerations .
• be properly configured in the Layertree Manager (see Configuration ).
8.1.4 Features
Collect statistics
The Polygon Query tool collects statistics on a pre-configured band of the raster layer. The available
statistics are:
• Number of enclosed pixels (source raster data pixels)
• Total sum of the values of the pixels (e.g. for population data, total population counted on this
area)
• Min value
• Max value
• Average value
• Standard deviation
It is possible, in the configuration, to choose to hide some of these fields. For example, the Sum fields
will not be relevant when dealing with elevation data.
Round values
The calculated values are calculated with full-precision. It is often irrelevant ; it is thus possible to set
the rounding level (number of decimals).
Set the header
Figure 8.1: Custom header.
The results display is quite simple : a header, followed by a pair name/values for each displayed statistic.
A default header is provided (“Collected statistics”), but you can set one of your own during the configuration.
If only one statistic is retained, the statistic name will not be displayed, assuming you will use the custom
header to label the result.
42
Chapter 8. Avanced Interrogation tools, part 2
Geoportal for Risk Management for Gambia, Editor and Administrator Manual, Release
2.10.3-1
Figure 8.2: Standard results display.
8.1.5 Configuration
The configuration is done in the Layertree Manager administration, on the bottom of the form dedicated
to any WMS layer (not available for Chart layers).
A checkbox “Enable Polygon Query ?” is unchecked, by default. If you want to activate the Polygon
Query for this layer, you’ll have to:
• check the checkbox, of course
• set the layer name to query. It is not necessarily the same name than the WMS one. For example,
elevation layer may be, in WMS, a combination of elevation and hillshades. This combination
will not be queryable, and you will want to query the source data, meaning the pure elevation
data. In this example, the WMS layer may be called gm:gm_1b1_srtmhill, but you will set the
single gm:gm_1b1_srtm layer for Polygon Query.
If the layer field is left empty, the Polygon Query feature will be kept disabled.
• Set the band number. It tells the system which band to query, on the raster data. Default is 0. If
this is a single band raster, it is fine. If not, you may want to choose another band. Use the band
number, not its label( if there is).
• Set the header if you want it customized. If not, default header (“Collected Statistics”) will be
displayed.
• Choose the stats to compute. As said before, some of the values may be irrelevant depending on
the kind of data you are dealing with.
• Set the round level (number of decimals kept). Default is 0, which means integer values.
8.1. PolygonalQuery
43
Geoportal for Risk Management for Gambia, Editor and Administrator Manual, Release
2.10.3-1
• Apply the configuration for this layer (click button Apply ).
• Save the Layertree configuration (menu Tree → Save to DB. See Layertree Manager documentation for more information).
8.1.6 Technical Considerations
WPS
To be able to use the Polygon Query tool on a layer, WPS (Web Processing Services) protocol must be
available for this layer.
This happens on the map server level. The standard geoserver used for the Geoportal has been set up
with WPS support. External servers may not.
WPS allows to execute advanced processings on a layer. On of them extracts statistics from
a raster dataset, based on a polygonal area.
this is the process used for this tool.
In
GeoServer, the corresponding service is called ras:RasterZonalStatistics ( http://pigeo.fr/geoserverprod/web/?wicket:bookmarkablePage=:org.geoserver.wps.web.WPSRequestBuilder ).
The available WPS processes can be listed using the GetCapabilities command
(http://pigeo.fr/geoserver-prod/ows?service=wps&version=1.0.0&request=GetCapabilities)
8.1.7 Troubleshooting
When I draw the polygon on the map, how do I close it ?
The polygon closes on a double-click. Be careful not to move the mouse during the double-click.
The Polygon Query window hides the layers’ list
Yes, it opens by default on top of the lateral panel, to leave the map area free, for the drawings. But
you can freely move it to any place you want. You can even close it, it will open again when some
information gets updated.
I get an Error trying to retrieve the stats. You may be experiencing network failures. If
this error persists, please contact the portal’s administrator message
If instead of the results you get this message, it is most likely that the layer is not properly configured.
I get weird statistics / negative values when I shouldn’t
It is likely you have an issue with Nodata values for this layer: the places where there is no data are coded
differently from a raster to another. Some put highly negative values. For example, AFRIPOP Nodata
value is -9999. Therefore, if your query includes some pixels with nodata values, it will completely false
your results.
A workaround, on the GIS level, would be to change the nodata values to 0 instead of -9999 for example.
44
Chapter 8. Avanced Interrogation tools, part 2
CHAPTER 9
Animations tool
Some data are meaningful only if one can browse them in their temporal dimension. The Temporal
Profiles tool gives one way of exploring these data. Another way is to play animations. Like it is usually
done with cloud weather data.
A “player” has been implemented for such use: the animations tool.
Each dataset that can be used with this tool is configured by an administrator. The simple user can select
the dataset to animate, load it, and play the animation, either backward or forward, or step-by-step.
9.1 Public interface
One can activate the tool by clicking the button on the right of the Temporal Profiles tool (map top
toolbar).
A window pops up. You first have to choose the dataset you want to animate and then load it (click on
the Load button).
A progress bar will keep you informed on the loading status: all data have to be loaded before you can
start playing the animation. This allows for more fluidity afterwards.
If you load the dataset for the first time, it may take some sime. Afterwards, it should be quite straightforward, since the data are cached in the browser.
When the dataset has finished loading, the second half of the window gets accessible: the player part,
composed of:
• A slider, telling you where you are on the dataset. It starts on the last image (for meteo data, the
current meteo).
45
Geoportal for Risk Management for Gambia, Editor and Administrator Manual, Release
2.10.3-1
• A field telling you the date associated with this image.
• A row of buttons for animation control.
You can play the animation, either by moving the slider, or using the animation control buttons.
9.1.1 Animation control buttons
This is a 7 buttons row:
•
•
•
•
•
•
•
moves to the first (oldest) image. If an animation is running, it will move to the first image,
but will not stop the animation (for this, use the pause button).
moves to the previous image.
backward animation button: loops over the images, playing backward. The animation will
keep playing until you press the pause button (or the forward animation button, which will revert
the play).
pause button: this will stop any animations in play.
forward animation button: loops over the images, playing forward. The animation will
keep playing until you press the pause button (or the backward animation button, which will revert
the play).
moves to the next image.
moves to the last (the more recent) image. If an animation is running, it will move to the
last image, but will not stop the animation (for this, use the pause button).
9.1.2 Animation map layer
When you start playing the images, a new layer is added in the Organize tab, with the dataset’s name.
You can use it as any other map layer : play on opacity, curtain settings, visibility,reorganize with other
layers, etc.
If you close the animation window, the layer is kept visible. This allows you to use it without having to
keep this window around. If you want to remove the layer, simply unckeck it, or remove it (right-click,
choose remove ).
46
Chapter 9. Animations tool
Geoportal for Risk Management for Gambia, Editor and Administrator Manual, Release
2.10.3-1
Warning: Be aware that if you close the window while an animation is playing, it will keep playing.
To stop it from playing, open the animation tool again, and press the pause button.
9.2 Configuration
Configuring a new animation is not likely to happens often, so the configuration is server-side and
need reloading the geoportal afterwards. Two files are concerned: config-pigeo.xml and config-pigeoanimations.xml, both of them situated in the WEB-INF folder of the geoportal webapp.
To apply your settings, you will have to reload the webapp, so this is a System Administrator task.
9.2.1 config-pigeo.xml
This is where general animations services configuration resides. Normally, it has only to be set once,
at the geoportal’s setup and should not be changed afterwards, unless you have good reasons to !
This is where you must set the base path to the animations data (please note that it must be common for
all animations data) and the files’ extension (usually it would be PNGs).
Look for the Animations services
pigeo.animations.listfiles
area.
the
two
service
to
set
are
called
and pigeo.animations.listfiles.json
The ext parameter should not need adjusting : PNG files is probably what you want, since you wouldn’t
get transparency otherway.
<!-- - - - - - - - - - - - - - - - - - - - - - - - - - - - - - - - -->
<!-- Animation services
-->
<!-- - - - - - - - - - - - - - - - - - - - - - - - - - - - - - - - -->
<service name="pigeo.animations.listfiles">
<class name="fr.pigeosolutions.geoportal.services.animations.ListFiles">
<param name="basePath" value="geoportal/animations/"/>
<param name="ext" value="png"/>
</class>
</service>
<service name="pigeo.animations.listfiles.json">
<class name="fr.pigeosolutions.geoportal.services.animations.ListFiles">
<param name="basePath" value="geoportal/animations/"/>
<param name="ext" value="png"/>
</class>
<output sheet="pigeo/geoportal/tojson.xsl" contentType="application/json;
charset=UTF-8"/>
</service>
<service name="pigeo.animations.getimage">
<class name="fr.pigeosolutions.geoportal.services.animations.GetImage" />
<error id="file-not-found" sheet="error-embedded.xsl" statusCode="404">
<xml name="error" file="xml/file-not-found-error.xml" />
</error>
<output file="true" />
</service>
9.2. Configuration
47
Geoportal for Risk Management for Gambia, Editor and Administrator Manual, Release
2.10.3-1
<service name="pigeo.animations.list">
<output sheet="pigeo/geoportal/listAnimations.xsl" contentType="text/xml;
charset=UTF-8">
<xml name="animations" file="WEB-INF/config-pigeo-animations.xml"
localized="false" />
</output>
</service>
The Animation services configuration in config-pigeo.xml
Setting the basePath parameter
The basePath parameter may need some change, to make it fit with the server’s organization.
This is the place where the datasets’ folders for animation will be placed.
It can be either relative or absolute path:
• <param name="basePath" value="geoportal/animations/"/>
will
relate to your Geonetwork data directory.
Say the Geonetwork data directory is
~/tomcat7/data/gm-risk-gn2_10-datadir, the basePath will them point to
~/tomcat7/data/gm-risk-gn2_10-datadir/geoportal/animations/, meaning you will place the datasets folders in there.
• <param name="basePath" value="/home/large/geoportal/animations/"/>
on the other way, starts with a /, and then is an absolute path.
9.2.2 config-pigeo-animations.xml
This is where you set the datasets that will be made available for the animations tool.
To add a new dataset, you have to add a new <dataset> block. The best way is to copy an existing block
and adjust the values.
Here are the XML tags to fill:
<id>
This is the folder’s name, as you will find it in the basePath folder (see config-pigeo.xml). If it doesn’t
match, the dataset won’t be found. It is better to use plain filesystem names, with no special chars nor
space.
label
This is the label that will be shown in the datasets’ list, in the Animation tool window. It will also be
used to name the layer in the Organize tab, when the tool is activated. Any string is accepted.
SRS
This says the coordinate system used for the bounds (see next)
48
Chapter 9. Animations tool
Geoportal for Risk Management for Gambia, Editor and Administrator Manual, Release
2.10.3-1
geographicbounds
Since our dataset contains plain png files, it is necessary to tell the system where to position the files.
This is done using the bounds declaration.
A good way to get them is, if you generate the PNGs from a geographic format (say geotiff), to use
gdalinfo command to get the bounds. Be sure the SRS tag is set accordingly to these bounds.
imagesize
Tells the size, in pixels, of the image.
timestampformatter
This is a bit tricky. This allows to create the date timestamp (in the Animations window) from the files
names. Say your files are named like mpe_141121_0432.png, the 6 first digits being the date, the 4
last ones being the time. You would like a more comprehensive display, like 2014-11-21 T 04:32.
This transformation will be done using the timestampformatter . This is plain javascript. Any javascript
expression should work. Mostly, you are expected to use string processing functions. In the present
example,
<timestampformatter>
"20"+filename.substr(4,2)+"-"+filename.substr(6,2)+"-"+filename.substr(8,2)
+" T "+filename.substr(11,2)+":"+filename.substr(13,2)
</timestampformatter>
would to the trick.
<?xml version="1.0" encoding="UTF-8"?>
<!-Define here parameters specific for animations application
(weather animations)
<timestampformatter> : javascript function that builds the
time stamp out of the file name (use variable ’filename’)
example :
filename
mpe_140917-1402.png
timestampformatter "20"+filename.substr(4,2)+"-"
+filename.substr(6,2)+"-"+filename.substr(8,2)
+" T "+filename.substr(11,2)+":"+filename.substr(13,2)
gives timestamp
2014-09-17 T 14:02
-->
<animations>
<!-- List of the available DBs (connection must be properly defined in
config-override-dev/prod.xml -->
<datasets>
<dataset>
<id>eumetsat</id> <!-- must match the data folder name-->
<label>Eumetsat meteo</label>
<SRS>EPSG:4326</SRS>
<geographicbounds>
<minlon>-30.0093561</minlon>
<minlat>-35.0062377</minlat>
<maxlon>54.9937605</maxlon>
<maxlat>36.0168419</maxlat>
</geographicbounds>
9.2. Configuration
49
Geoportal for Risk Management for Gambia, Editor and Administrator Manual, Release
2.10.3-1
<imagesize>
<width>1514</width>
<height>1265</height>
</imagesize>
<timestampformatter>
"20"+filename.substr(4,2)+"-"+filename.substr(6,2)+"-"
+filename.substr(8,2)+" T "+filename.substr(11,2)+":"+filename.substr(13,2)
</timestampformatter>
</dataset>
</datasets>
</animations>
config-pigeo-animations.xml configuration file. Only one dataset is configured for now.
9.2.3 Animation temporal extent
The animation temporal extent is set very simply: the tool uses all the data present in the folder. The
extent is thus set externally, in the scripts that will generate the images and put them in the folder.
By removing old images at the same time you add new ones, you keep your time extent. This way,
everything is possible, without complicated configuration.
9.3 Technical considerations
9.3.1 Bandwidth usage optimisation
This tool has been developed with that perspective in mind:
• using dedicated images, optimized in terms of size and weight, it minimized the first load.
• u sing browser cache, the images, when already loaded, are kept in storage, and re-used. You
should not have to load them twice, unless the browser cache is emptied. Thus, the next loads
shloud be very quick.
Other documents:
User Manual (PDF)
50
Chapter 9. Animations tool