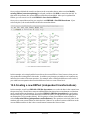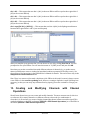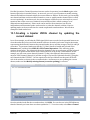
1
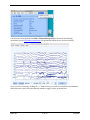
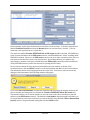
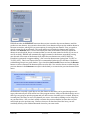
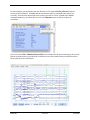
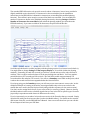
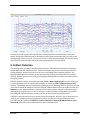
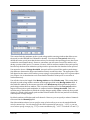
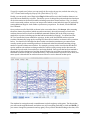
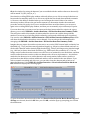
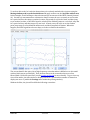
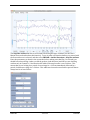
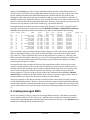
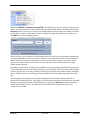
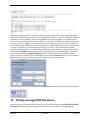
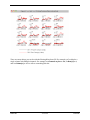
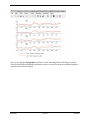
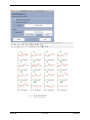
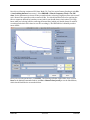
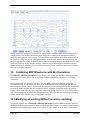
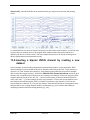
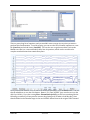
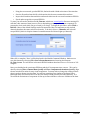
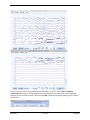
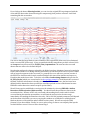
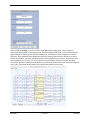
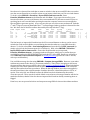
After you click Accept, you will see in the command window that this routine found artifacts on 12.8% of trials. If you look at the scrolling data window that pops up, you will see that some of the epochs with these artifacts also had blink artifacts that were detected with the peak-‐to-‐peak amplitude routine that was previously run with these data (e.g., epoch 44 indicates a rejection of the HEOG channel by drawing this channel in red, and the data from several other channels are also drawn in red from the peak-‐to-‐peak artifact detection). However, other epochs were rejected solely because of the step function in the HEOG channel (e.g., epochs 208 and 209). Information about the artifacts can also be found in the EventList. To see this, save the EventList from the current dataset in a text file by selecting ERPLAB > EventList > Export EEG EventList to Text File. Now open the text file in a text editor. You will see something like the following. #item # 157 158 159 160 161 162 163 164 165 166 167 bepoch ecode 79 0 80 0 81 0 82 0 83 0 84 22 9 22 9 12 9 22 9 22 9 12 label Frequent_Digit Corr_Resp Frequent_Digit Corr_Resp Rare_Letter Corr_Resp Frequent_Digit Corr_Resp Frequent_Digit Corr_Resp Rare_Letter onset diff dura (sec) (sec) (msec) 117.5840 0.3800 0.0 118.2980 0.7140 0.0 118.7840 0.4860 0.0 119.7060 0.9220 0.0 151.0400 31.3340 0.0 151.4560 0.4160 0.0 152.2140 0.7580 0.0 152.6720 0.4580 0.0 153.4380 0.7660 0.0 153.8940 0.4560 0.0 154.8120 0.9180 0.0 b_flags (binary) 00000000 00000000 00000000 00000000 00000000 00000000 00000000 00000000 00000000 00000000 00000000 a_flags (binary) 00001001 00000000 00000101 00000000 00000000 00000000 00000000 00000000 00000000 00000000 00001101 enable 1 1 1 1 1 1 1 1 1 1 1 If you look at the column of artifact rejection flags (a_flags), you will see that every rejected trial has flag 1 set (the rightmost flag). Some of the events have flag 4 set from the peak-‐to-‐peak routine (e.g., item 157). Other events have flag 3 set from the step function routine (e.g., item 159), and other events have both flags 3 and 4 set (e.g., item 167), indicating that both types of artifacts were detected. This information can be useful if you want to perform behavioral analyses excluding trials with specific types of artifacts. Note that the left column in this text file shows the original item number of the event, from the original continuous dataset. The second column shows the bin epoch (bepoch) number, which is the item number after epoching. These numbers will be different when some event codes are not used as time-‐locking events when the data are epoched (e.g., the response event codes in the current example). If you are trying to find an event in the continuous data with Plot > Channel data (scroll), you should use the item number (first column). If you are trying to find an event in the epoched data, you should use the bepoch number (second column). Note for programmers: The flags are shown in a binary format in the text file (to make it easier to see the individual flag values). However, they are stored in a single variable, and Matlab ordinarily uses decimal numbers to enter and print the value of a variable. For example: If you set flags 1 and 5 in an artifact detection tool, and you print out the value of the flag variable, you will see a value of 17. 9. Creating Averaged ERPs We are now (finally!) ready to create a set of averaged ERP waveforms. First make sure that the correct dataset is active (“S1_EEG_elist_be_ar”, which has been epoched and scanned for artifacts with the Moving Window peak-‐to-‐peak threshold artifact detection function). Your Datasets menu should look something like the screenshot below. ERPLAB 25 of 55 Tutorial bin [ [ [ [ [ [ [ [ [ [ [ 1] ] 1] ] 2] ] 1] ] 1] ] 2]