1
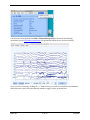
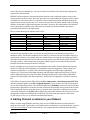
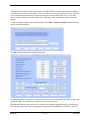
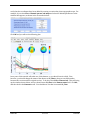
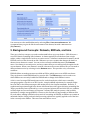
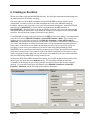
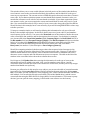
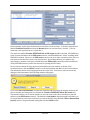
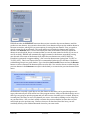
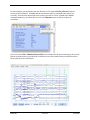
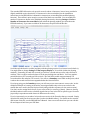
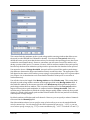
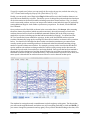
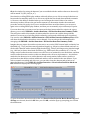
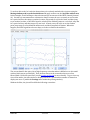
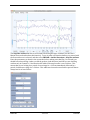
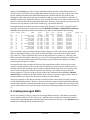
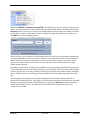
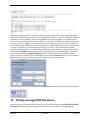
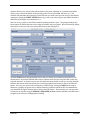
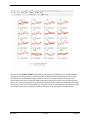
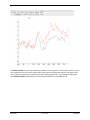
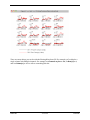
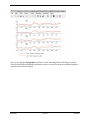
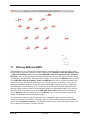
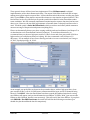
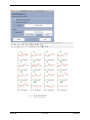
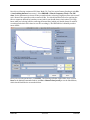
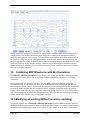
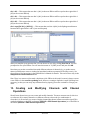
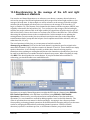
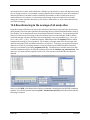
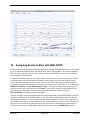
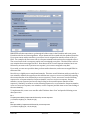
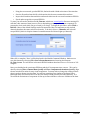
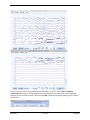
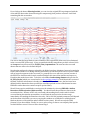
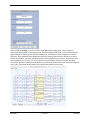
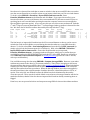
Three general classes of filters have been implemented. First, IIR Butterworth is a digital implementation of the classic Butterworth filter. The output of this filter feeds back into its input, making it an infinite impulse response filter. It filters the data in both directions, avoiding any phase shift. Second, FIR is a finite impulse response filter that uses a sinc impulse response function. This kind of filter can be very efficient but can produce artificial oscillations in the filtered data under some conditions. We will eventually implement Gaussian impulse response functions but have not done so yet. However, the sinc filter approximates a Gaussian when a relatively low filter order is used. The third option is Parks McClellan Notch, which provides a notch filter (which attenuates one narrow range of frequencies and passes everything else). Filters can dramatically distort your data, creating artificial peaks and oscillations (see Chapter 5 in An Introduction to the Event-Related Potential Technique). To avoid these distortions, we recommend that you choose a high-‐pass cutoff of 0.1 Hz or lower and a low-‐pass cutoff of 20 Hz or higher unless you really know what you’re doing. We also recommend a roll-‐off slope of 12 dB/octave. For an example of how severe filtering can lead to incorrect conclusions, see Yeung et al., 2007, Psychophysiology, 44, 39-‐49. As an example, set up the filter as shown in the screenshot above, with no high-‐pass filter, a low-‐ pass cutoff at 30 Hz, a roll-‐of of 12 dB/octave, a Butterworth filter type, and all 16 channels being filtered. Click APPLY. After the filtered data have been created, the standard window for saving new ERPsets will appear, and you should name the new ERPset “S1_ERPs_30Hz” (you can save the ERPset to disk if desired, but this is not necessary). This will now be the active ERPset. If you plot it with ERPLAB > Plot ERP Waveforms, the result will look like the following screenshots (you should also plot the unfiltered data for comparison). ERPLAB 34 of 55 Tutorial