1
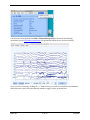
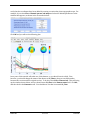
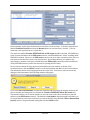
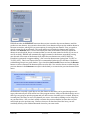
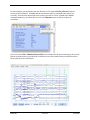
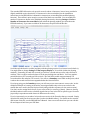
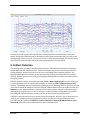
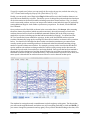
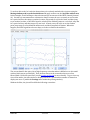
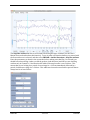
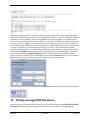
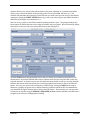
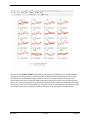
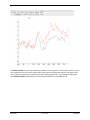
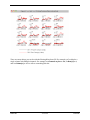
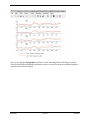
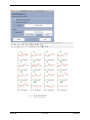
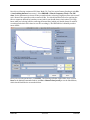
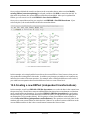
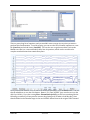
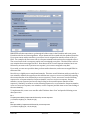
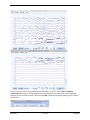
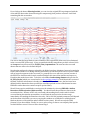
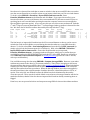
Note that, when Include Toolbar is checked in the plotting GUI, ERPLAB uses a standard Matlab plotting routine that provides a set of menus and a toolbar in the plotting window. Play around with it and you should be able to figure out how it works. Perhaps the most useful tool is the measurement tool (the icon with the small plus mark), which allows you to click on the waveform and see the X and Y values (time and voltage) at that point on the waveform. In addition, this mode allows you to click on one of the panels (e.g., the panel for the Cz electrode site), which will pop up a new window showing an expanded version of that panel, as shown in the screenshot below. ERPLAB 29 of 55 Tutorial