1
Chapter 5
Filters
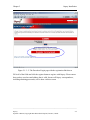
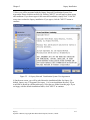
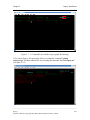
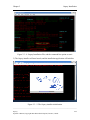
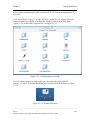
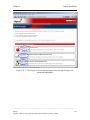
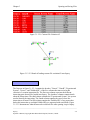
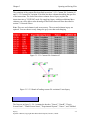
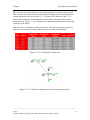
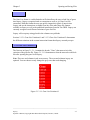
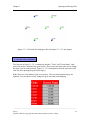
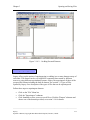
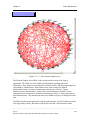
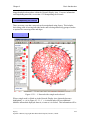
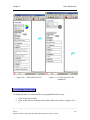
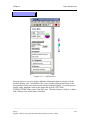
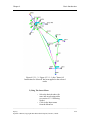
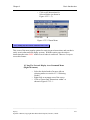
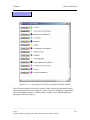
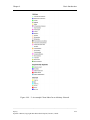
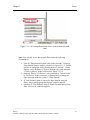
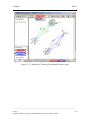
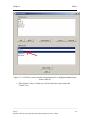
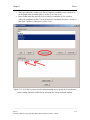
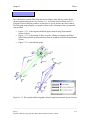
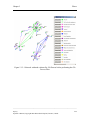
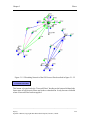
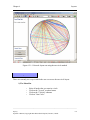
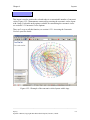
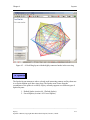
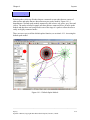
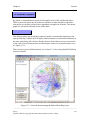
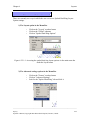
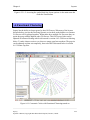
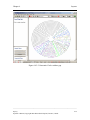
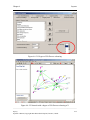
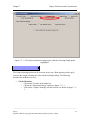
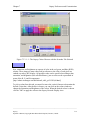
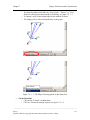
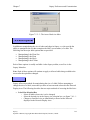
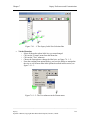
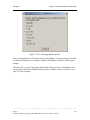
Figure 5.1.4-1 Original unfiltered graph with edges coloured by source. The source
colours are defined in the bottom right.
______________________________________________________________________________________
Osprey
Operator’s Manual, Copyright 2002 Mount Sinai Hospital, Toronto, Canada
5-19