1
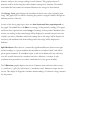
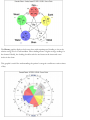
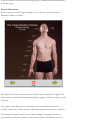
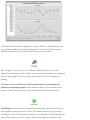
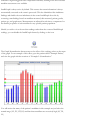
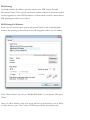
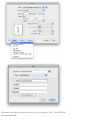
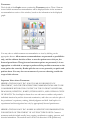
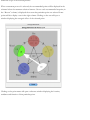
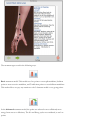
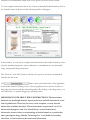
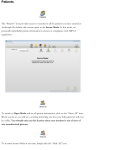
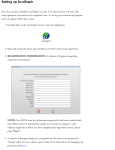
Graphs
In the “Graphs” window, you can view and print patient exam results. The interface
looks like this:
This interface allows you to look at exam results in a variety of ways. There are 8
different graph displays, as well as an information section.
Each of the buttons at the right side of the window displays a different view of the exam
results. For information about any of the graph displays, simply click on the “?” symbol
in the upper right corner of the graph display.
The Baseline graph is the traditional, Ryodoraku-style graph used in meridian graphing.
Meridians are displayed with arm yin meridians first, followed by arm yang, then leg yin
and leg yang.
The Yin/Yang graph displays all the yin meridians on the left half and the yang
meridians on the right half. It also gives the average reading for yin and yang, allowing
comparison of the patient’s yin/yang balance.
The By Element graph displays the exam results as coupled meridians within each
element, and gives the average reading for each element. This graph promotes 5elements analysis by showing the relative balance among the 5 elements. The shaded
area behind the bars within each element illustrates the average for that element.
The Energy Cycle graph displays the meridians in their horary order, beginning with
Lung. This graph style is useful for analyzing the patient’s energetic balance throughout
different periods of the day.
In each of the above graph types, there are three horizontal lines superimposed on
the graph. The middle line is theMean, or average, of that patient’s readings. The upper
and lower lines represent the normal range of readings for that patient. Meridians with
at least one reading in this normal range will be displayed as normal (except in the case
of splits; see below.) Meridians with both readings above this range will be displayed as
excessive, and meridians with both readings below this range will be displayed as
deficient.
Split Meridians: When there is a statistically significant difference between the right
and left readings on a given meridian, that meridian is considered “Split” and will be
given special treatment. If a meridian is split, it will not be displayed in any other way,
even if it would otherwise be considered excessive, deficient, or normal. A split
condition takes precedence over other considerations for any given meridian.
The 5 Elements graphic displays the classic 5-elements chart with the relative excess
(+), deficient (-), split (X), and normal (=) meridians noted. Element averages are also
shown. This display is designed to facilitate understanding of 5-elements energy transfers
for this patient.
The Horary graphic displays the horary chart with superimposed shading to show the
relative energy level of each meridian. More shading means a higher average reading for
the channel. Ideally, the shading should reach the area between the inner and outer
circles in the chart.
This graphic is useful for understanding the patient’s energetic condition at various times
of day.
The Ratios display gives information about the patient’s relative energy balance.
This display shows several categories of energetic analysis. On the left is the Chi
Energy Level. This is a representation of the patient’s overall energetic level. Note that
it is possible for the patient to be too low or too high in energy, and the ideal reading
level is in the green area toward the center of the vertical display bar.
The bottom center shows the Yin/Yang Balance for the patient, with the yin/yang
tendency noted.
The right side of the display shows the patient’s Chi Energy Stability. This is
determined by analyzing the highest and lowest readings in the exam, in relative
comparison to the mean. Patients with a wider range of readings from high to low will
have lower relative energy stability. The green area towards the top of the display
represents the best balance.
You may want to think of stability as the opposite of variability. A graph with high
variability scores low for stability, and a graph with low variability scores high for
stability.
The center of the display shows the Right/Left and Upper/Lower balance
superimposed on a human figure. The right/left balance reflects the relative balance
between readings on the right and left sides of the body, and the upper/lower balance
reflects the balance between the readings on the hands and the feet.
Interpretation of these ratios categories is provided in the “Information” display. See
below.
The P.I.E. Graph stands for Personal Integrated Energetics graph. This graph
provides a snapshot of the patient’s overall meridian balance in a simplified, patientfriendly format.
Within this graph, each meridian is represented by a color-coded slice of the pie.
Energetically healthy meridians extend fully to the edge of the circle and are colored
green. Energetically unhealthy meridians do not extend fully to the edge of the circle.
The smaller the shaded section of the pie slice, the lower the health level of the
meridian. Additionally, meridians are color-coded according to imbalance, with red for
excess, blue for deficiency and purple for split.
The P.I.E. score stands for Personal Integrated Energetic score, and this single number
comprises a complete picture of your patient’s meridian balance. The higher the score,
the better the balance. Statistical analysis methods are used to include all facets of
meridian health in the score calculation. The purpose of the score is to provide a fast,
easy method of graph comparison for your patient, who may not understand graph
analysis, but will understand a single-number score. Remember, the P.I.E. scale is 0-100
and the scores may be anywhere within that range. The scale on the left gives an idea of
the typical degree of imbalance for any score.
The Information display gives written information about meridian functions, observed
imbalances, potential symptom associations, and energetic balance categories for this
exam. It is written on the level of the average patient to facilitate understanding without
confusing jargon.
Channel Illustrations:
While viewing any bar-style graph, clicking on any of the bars opens the channel
illustration window as follows:
This window shows the meridian channel of the bar that was clicked in the graph. The
arrows will move forward and backward through the graph, as will the arrow keys on the
keyboard.
The purpose of this illustration is to demonstrate the anatomical area where the
meridian channel runs. This is useful for explaining symptoms and locations to patients.
The channel in the picture will be color coded according to the graph bar colors to
demonstrate the energetic condition of the channel, whether it is deficient, excessive,
split or normal.
Icon Functions:
The “Begin Treatment” icon displays the acupoints of the selected treatment in order.
This function is designed to serve as a treatment guide to the practitioner during
treatment.
The arrow keys advance from point to point during treatment dispay.
These icons show the previous and next graphs in the database for this patient. In the
event that there is not a previous or next graph for this patient, one or both of these
icons is grayed out.
Using the previous and next icons is a convenient and quick way to view previous and
current treatments for the patient and to track patient progress.
The “History” icon displays the “Historical Trends” window as follows:
The Historical Trends window displays the trends in PIE score, element history, and
most common imbalances for the selected patient. To choose how many exams are
included in the history, use the slider at the bottom left of the screen.
The “Compare” icon takes you to the “Patients” window with the list of exams
displayed for that patient. In this window, you can select specific graphs for comparison.
Select as many graphs as you care to from the patient’s history for comparison or
printing.
It is best to wait at least 24 hours after treatment before re-examining your
patient for comparison purposes. Re-examination directly after treatment will not
produce a valid result because Chi energy will still be in flux from the treatment.
IntelliGraph is a revolutionary new technology developed by Miridia Technology Inc.
that completely changes the state of the art for meridian analysis by using statistical
modeling to correct exam information and reveal true imbalances, while eliminating the
false positives that may otherwise appear. This method builds on and improves Dr.
Nakatani’s original staggered-scale compensation method, resulting in the most accurate
meridian assessments ever available.
IntelliGraph is always active by default. This ensures that exam information is always
automatically corrected as the exam is processed. This also diminishes false imbalance
findings and clarifies the true imbalances in the exam. IntelliGraph does this by
correcting exam findings based on meridian measured, side measured, patient gender,
patient age, and graph mean. Measurements are adjusted in real time to compensate for
the distinct properties of each meridian for any specific patient population.
Should you wish to view the raw data readings rather than the corrected IntelliGraph
readings, you can disable the IntelliGraph feature by clicking on the icon.
The Graph Normalization feature removes the effect of the outlying values on the mean
of the graph. For an example of this effect, open the patient called “Example Patient,”
and view the graph with the notation of “Example 2: Normalization.”
You will notice that many of the patient’s meridians in this example are just below the
normal range (LU, PC, HT, KI) and that three meridians are excessively high (SI, TE,
LI.)
The effect of the three high meridians is to raise the mean to the point that many of the
borderline meridians appear low when they really aren’t deficient.
By clicking the Normalize icon, you will eliminate the effect of the 3 excessively high
meridians on the mean, and the 2 of the deficient meridians will be automatically recategorized into their correct category of “Normal.” The treatment protocol goes from
requiring stimulation of 14 points in the basic protocol to only 10 points (basic) and 6
points (advanced). Thus, normalization prevents over-treatment of the patient.
Note that normalization does NOT remove the outliers (excessively high or
excessively low meridians) from the treatment protocol. It only removes them from
the calculation to prevent artificially skewing the results. The outlying meridians are still
treated and corrected.
It is, of course, up to the practitioner to decide whether normalization is appropriate for
each particular patient on a case-by-case basis. If normalization is selected, it will remain
selected on all patients and all graphs until it is deselected.
The “Edit Graph” icon allows changes to the recorded values after the graph has been
displayed. The changes can be made by manually entering new values, or by taking
readings with the probe. Click in the box for the reading you wish to change, and type a
new number or use the probe to take a new reading. NOTE: to preserve the integrity of
your patient records, AcuGraph only allows you to manually edit graph values up to 8
hours after the exam.
The “New Note” icon opens a window where the user may record notes relevant to the
patient’s case. This is a useful place to record symptoms, progress, treatment method,
etc. The first part of each note recorded will appear next to its associated graph in the
records list. Notes may be recorded in any length and contain any text you choose. You
may also paste text into the notes window from another application.
The “Insert Template” pull-down menu inserts a pre-formatted template in your note.
This is useful if you have a typical notes template you usually use, such as the S. O. A. P.
note format. You can add new custom templates to this menu in the “Notes” window of
the “Preferences” section.
The “Print” icon opens the “Printing Options” window, where custom reports can be
defined and printed.
The main part of the Printing Options window is divided into three sections: The
“Graphs” section on the left controls which graphs will be printed in the report. The
“Information” section in the center controls what text information will be included.
The “Treatment” section on the right selects what treatment information will be
included in the report.
The “Brief Report for File” item provides a one-page summary report including the
Baseline graph and any treatment recommendations selected under the “Treatment”
section. This report is useful as a quick reference and for paper files because it is brief
and contains only the essential information.
The “Screening Report” is only available to those who have purchased the AcuGraph
Screening Module add on. This one-page report is designed for use at public screening
events to quickly and easily demonstrate the patient’s energetic condition and help them
take the next steps toward receiving care. The screening report can be customized with
your practice information in the “Printing” window of the Preferences section.
Under Treatments, you may choose which treatments to print, and whether to print
only lists of recommended points, or full reference illustrations and information.
The other selectable items will be printed in the full report. The report will only contain
those items selected in the Printing Options window, allowing you to customize your
reports to your exact desires.
The Report Language selector is used to determine which language will be used in
your printed reports. This option is only available if you have purchased additional
language packs.
The Printing Favorites section allows you to save printing preferences for specific
types of reports. For example, if you print a specific type of report on a first visit, you
can define the report and save it as a preset.
To do so, first click on the + sign to add a new report. Name it and save it. Then select
the contents of the report in the printing window and when you are satisfied, click save.
The presets you selected will be saved to the currently shown Favorite.
The Cover Pages section lets you choose the cover page or pages for the printed
report. The following two options are available:
Report Explanation: This cover includes simple explanations of the purpose and
meaning of the AcuGraph report.
Custom Cover Page: This option attaches your own custom cover page to your report.
You can make your cover page as simple or complex as you wish, and it can be more
than one page if desired.
To create a custom cover page, simply create a document in any word processing or
page layout program you choose. You may include pictures, text, formatting and design
elements. When you have finished creating your cover page, save it as a PDF. For more
information on how to create a PDF, please see PDF printing, below.
When you have saved your cover page as a PDF, visit the “Printing” window of the
“Preferences” section of AcuGraph. There, you can select your PDF document to
import it into AcuGraph as your custom cover page.
For more information on importing a cover page, please see the Preferences section of
this manual.
AcuGraph includes the ability to email a patient report. To use this feature, first select
the options you wish to include in the report from the Printing Options window. Then
click the “Email” icon. The following window will appear:
If the Patient’s email address is already in your patient database, the address will appear
in the box. If you don’t already have the patient’s email address, you can type it into the
box. You will then have the option to save the email address you typed as part of the
patient’s record for future use. Once you have selected or entered the email address,
click the “Email” icon to send the patient’s report.
PDF Printing
AcuGraph includes the ability to produce reports in the PDF format (Portable
Document Format.) These reports can then be emailed, attached to electronic medical
records, appended to other PDF documents, or electronically stored for later retrieval.
PDF printing procedures are as follows.
PDF Printing For Windows:
After you have selected report options and pressed "Print" in the AcuGraph print
window, the operating system will show the following print window (or one similar):
In the "Select Printer" area, choose "Miridia PDF Maker" as your printer. Then press
"Print."
Next, you will be asked to name your report and choose the location to save it. When
you have done so, press "Save" and your PDF report will be created and saved.
PDF Printing For Macintosh:
After you have selected report options and pressed "Print" in the AcuGraph print
window, the operating system will show the following screen:
From the PDF drop-down menu at the bottom left of the screen, select "Save as
PDF..."
Then name your report, choose the location to save it, and press "Save". Your PDF will
be created and saved.
Treatments
The left side of the Graphs screen contains the Treatment section. These 9 buttons
control which treatment recommendations will be displayed below in the treatment
recommendations section of the window, based on the information in the displayed
graph.
You may choose which treatment recommendation to view by clicking on the
appropriate button. All treatment recommendations are presented as possibilities
only, and the ultimate decision of how to treat the patient rests with you, the
licensed practitioner. Though several treatment options are presented, it is not
appropriate or advisable to attempt to perform all the possible treatments on the
same patient the same day. Rather pick the one or two protocols you prefer and
perform them. You may also use treatments of your own choosing outside the
scope of this software.
Important Notes about Treatments:
MIRIDIA TECHNOLOGY INC. IS NOT LIABLE FOR RESULTS OF
TREATMENT, AND THE TREATMENT RECOMMENDATIONS ARE TO BE
CONSIDERED WITHIN THE CONTEXT OF THE PATIENT’S SYMPTOMS,
DIAGNOSIS, LIFESTYLE, HABITS, FITNESS LEVEL, AND OVERALL STATE
OF HEALTH. The AcuGraph software does not and cannot consider each patient’s
individual situation beyond the electronic examination, and it does not take the place of
the practitioner’s experience, training, clinical judgment and skill. AcuGraph is for
experimental and investigational use only by appropriately licensed practitioners.
MIRIDIA TECHNOLOGY INC. MAKES NO SPECIFIC RECOMMENDATION
FOR METHOD OF TREATMENT OF ACUPUNCTURE POINTS. Common
treatment methods include needle, laser, cupping, moxibustion, tapping, pressure, and
electrical stimulation. The method used is at the sole discretion of the practitioner,
within the scope of the licensed practice.
When a treatment protocol is selected, the recommended points will be displayed in the
columns below the treatment selection buttons. Next to each recommended acupoint, in
the “Reason” column, is displayed the reason that particular point was selected. Some
points will also display a star in the right column. Clicking on the star will open a
window displaying the energetic effect of the selected point:
Clicking on the point name will open a reference window displaying the location,
attributes and function of that particular point:
The treatment types work in the following ways:
Basic treatment model: This model uses Luo points to treat split meridians, Sedation
points to treat excessive meridians, and Tonification points to treat deficient meridians.
This method does not pay any attention to the 5-elements model or use group points.
In the Advanced treatment model, the points are selected to most efficiently move
energy from excess to deficiency. The Ko and Sheng cycles are considered, as are Luo
points.
The Advanced treatment model considers all possible combinations of points and makes
a recommendation based on use of the fewest points possible. It also considers
musculo-tendino points for global and specific effects. See “Example 3” in the graphs of
“Example Patient” for an example of how this type of intelligent processing reduces the
number of recommended points from 22 points to 4 points.
The Expert treatment protocol goes beyond basic and advanced treatment to a whole
new level of effectiveness. This model considers patient history, types and severity of
imbalances, and treatment type comparison before recommending a complete treatment
regimen including points, herbs, auricular, custom applications and home care.
If two exam types are performed on the same day (for example Source and Jing well) the
Expert protocol will compare both exams and synthesize a treatment that will address all
imbalances noted.
The Expert protocol also considers imbalances that have appeared repeatedly in the
patient’s recent exam history and provide special enhanced treatment to these persistent
imbalances.
Auricular treatment model: This model uses master auricular points for overall systemic
balance, and specific meridian points for tonification and split meridians.
Back-Shu treatment model: This model uses the Back Shu points specific to the
meridian imbalances noted.
Divergent Channels treatment model: This model is only available on Tsing (Jing-well)
point exams. This model treats 3 specific divergences: Left-Right divergences (Splits)
are treated using Back-Shu points, Top-Bottom divergences are treated using
Extraordinary Vessels, and Front-Back (Yin-Yang) divergences are treated using He-sea
and master points. Notice that the recommended treatment points are color coded.
Points in red should be tonified, or treated with (+) current. Points in blue should be
sedated, or treated with (-) current.
Spinal Subluxation treatment model: This model shows the areas of potential spinal
subluxation based on the exam findings. Only practitioners properly trained and licensed
in spinal manipulation or body work should use these recommendations.
AcuHerb treatment model: This model recommends traditional Chinese herbal
formulas for treatment of the energetic imbalances shown in the graph. These
recommendations should only be used by practitioners properly licensed and trained to
dispense herbal supplements.
Though a graph may generate a number of potential herbal recommendations, no more
than two formulas should be given to the patient at the same time. For this reason,
AcuGraph limits prescriptions to only up to two formulas per exam.
The formula recommendations are listed in order based on a scoring system. The higher
the score, the more strongly recommended is the formula. To view the reasons the
formula was recommended, simply click on the green text in the reason column.
To view complete information about any of the recommended herbal formulas, click on
the formula's name in the list and the following window will appear:
In this window, you can access complete information about the herbal formula you have
selected, including therapeutic actions, indications, contraindications, recommended
usage, and potential drug interactions.
The “Previous” and “Next” buttons will show the previous and next recommended
formulas for this exam.
The
button opens a hierarchical list of the ingredients
in the herbal formula. Clicking on any of these ingredients shows the list of classes of
drugs that may interact with the selected ingredient. By clicking on the drug classes, you
can “drill down” to specific drug groups and drug names.
IMPORTANT NOTE ABOUT DRUG INTERACTIONS: The interactions
built into the AcuGraph database represent the best available information at the
time of publication. There may be newer, more complete, or more relevant
information available elsewhere. These interactions are presented “as-is” for
informational purposes only. You should always consult authoritative
information sources before recommending an herbal formula to a patient that
takes prescription drugs. Miridia Technology Inc. is not liable for mistakes,
omissions, or inaccuracies in the interaction information.
To return to the herbal information screen, simply click on
The
name of each formula.
button provides spoken pronunciation of the Chinese
To prescribe a formula, simply select the number of bottles to prescribe from the
bottom of the window. A note will be created and appended to the graph, noting the
formula prescribed. Additionally, the prescribed number of bottles will automatically be
added to your AcuHerb shopping cart for ease in reordering.
To view other AcuHerb formulas, you can choose the element family and formula from
the lists at the top of the window. If you prescribe one of the formulas that was not on
the recommended formula list, it will be added to the list.
For more details about the AcuHerb supplements, please visit www.acuherb.com.
Custom treatments: This model displays user- defined custom treatments tailored to the
exam results. Custom treatments may be defined in the Reference tab.