Download D4.3 - Prototype Software (Documentation)
Transcript
D4.3 Prototype Software (Documentation) 2nd Reporting period WP4 Agent Based Social Simulation Responsible Partner: SURREY Due date of the deliverable: M36 (January 31st 2015) Actual submission date: M36 (January 31st 2015) Dissemination level: PU TELL ME - Transparent communication in Epidemics: Learning Lessons from experience, delivering effective Messages, providing Evidence. Project co-funded by the European Commission within the 7th Framework Programme – HEALTH theme Programme – HEALTH theme D4.3 Prototype Software (Documentation) TELL ME project – GA: 278723 Document Management PROJECT FULL TITLE Transparent communication in Epidemics: Learning Lessons from experience, delivering effective Messages, providing Evidence. PROJECT ACRONYM TELL ME Collaborative Project funded under Theme HEALTH.2011.2.3.3-3 “Development of an evidence-based behavioural and communication package to respond to major epidemics outbreaks” GRANT AGREEMENT 278723 STARTING DATE 01/02/2012 DURATION 36 months D4.3 “Prototype Software” Task: 4.3 Leader: SURREY – Other contributors: none 2 D4.3 Prototype Software (Documentation) TELL ME project – GA: 278723 Table of Contents EXECUTIVE SUMMARY........................................................................................................................................4 1 2 3 4 Introduction ................................................................................................................................................5 1.1 Advancing modelling of behaviour during epidemics ....................................................................... 5 1.2 Model overview ................................................................................................................................. 6 1.3 How we envisage you will use the simulation ................................................................................... 7 User Guide ..................................................................................................................................................8 2.1 Modelling environment ..................................................................................................................... 8 2.2 Quick start guide................................................................................................................................ 9 2.3 Learning to use the simulation ........................................................................................................ 13 2.4 Scenario management ..................................................................................................................... 18 2.5 Understanding the results of the simulation................................................................................... 23 Default Values for Parameters .................................................................................................................27 3.1 Epidemic parameters....................................................................................................................... 27 3.2 Communications plan scenarios ...................................................................................................... 27 3.3 Population structure parameters .................................................................................................... 28 3.4 Behaviour decision parameters ....................................................................................................... 28 3.5 Customising default parameter values............................................................................................ 28 Technical Reference .................................................................................................................................29 4.1 Running your own systematic experiments .................................................................................... 29 4.2 Changing the simulation .................................................................................................................. 31 BIBLIOGRAPHY ..................................................................................................................................................34 3 D4.3 Prototype Software (Documentation) TELL ME project – GA: 278723 EXECUTIVE SUMMARY The agent-based social simulation component of the TELL ME project (WP4) developed prototype software to assist communications planners to understand the complex relationships between communication, personal protective behaviour and epidemic spread. Using the simulation, planners can enter different potential communications plans, and see their simulated effect on attitudes, behaviour and the consequent effect on an influenza epidemic. The model and the software to run the model are both freely available (see section 2.2.1 for instructions on how to obtain the relevant files). This report provides the documentation for the prototype software. The major component is the user guide (Section 2). This provides instructions on how to set up the software, some training scenarios to become familiar with the model operation and use, and details about the model controls and output. The model contains many parameters. Default values and their source are described at Section 3. These are unlikely to be suitable for all countries, and may also need to be changed as new research is conducted. Instructions for how to customise these values are also included (see section 3.5). The final technical reference contains two parts. The first is a guide for advanced users who wish to run multiple simulations and analyse the results (section 4.1). The second is to orient programmers who wish to adapt or extend the simulation model (section 4.2). This material is not suitable for general users. 4 D4.3 Prototype Software (Documentation) TELL ME project – GA: 278723 1 Introduction The TELL ME project developed an evidence-based communication package to respond to major infectious disease outbreaks, notably influenza epidemics. The project was intended to assist health agencies to develop plans to communicate before, during and after any outbreak in an effective way, so as to encourage appropriate population behaviour and minimise the impact of an epidemic. One of the tools developed is prototype software: an agent-based social simulation to assist with planning decisions about communication. The simulation is intended to provide decision support for health agencies (and other official information providers), assisting relevant officials to understand the complex problem of communicating effectively before, during and after an influenza epidemic. More specifically, it is to allow comparison of options for communication plans, with the user to enter a communication plan and explore some of the key effects on behaviour and consequently on the progress of the epidemic (see section 1.3 for some potential model uses). The basic question for the model is, given a specific communication plan and epidemic parameters: What proportion of the population adopt protective behaviour? What proportion of the population is infected over the duration of the epidemic? 1.1 Advancing modelling of behaviour during epidemics The TELL ME project relies on the connection between protective behaviour and epidemic transmission. That is, personal voluntary decisions to be vaccinated or adopt hand hygiene and social distancing measures are expected to reduce the impact of an influenza epidemic. Without such a connection, there would be no value in communication encouraging such behaviour. However, these decisions are influenced by the person’s situation, which includes proximity to, and other features of, the epidemic. The connection between communication and behaviour should be consistent with both the relevant psychological theories and any empirical data. In order to provide a realistic simulation for planning purposes, there are five requirements for the model design: Communication affects behaviour; Behaviour is based on appropriate psychological models; Heterogeneity of behaviour response and situational awareness; Two-way dynamic influence of epidemic on behaviour and behaviour on epidemic; and Parameterisation with empirical data, where available. A recent review (Funk et al., 2010) identified 25 theoretical studies that considered the mutual influences of personal behaviour and epidemiology of infectious disease (the fourth requirement). Almost all the models reviewed were compartment models, which is the standard mathematical approach to modelling epidemics, using differential equations. This approach creates nominal compartments for people of different epidemic status such as ‘susceptible’ or ‘infected’, and models the rates at which people move between compartments. Behaviour is added by increasing the number of compartments and adjusting rates. For example, the ‘susceptible’ may be split into ‘susceptible, good hand hygiene’ and ‘susceptible, poor hand hygiene’ and the rate of infection for the former would be lower than the latter. However, these models are unable to deal with the heterogeneity requirements of TELL ME. Compartment divisions would be needed not just for behaviour choices, but also factors that contribute to behaviour, such as different levels of perceived risk, geographic proximity to the outbreak, exposure to 5 D4.3 Prototype Software (Documentation) TELL ME project – GA: 278723 communication, and relevant demographic features. The most appropriate modelling methodology to meet the requirements of the TELL ME prototype simulation is agent-based modelling (ABM) because it allows heterogeneous individuals to make decisions based on their own characteristics and situation, and for the actions of these individuals to change their environment (Gilbert, 2008). The most relevant published model is an ABM of facemask use during the 2003 SARS outbreak in Hong Kong (Durham and Casman, 2012). The authors present this model as the “first demonstration of a quantitative HBM [Health Belief Model] suitable for incorporation in agent-based epidemic simulation” (Durham and Casman, 2012). The modelled facemask adoption occurs in response to dynamic epidemic information about prevalence and deaths, but there is no influence of facemask use on the progress of the epidemic. The authors explicit recognise the model’s limitations but also the need to compromise realism to achieve model feasibility. The TELL ME model is ambitious, advancing modelling about health behaviour during influenza epidemics in several ways simultaneously. By including communication and mutual influence, however abstractly, the TELL ME model is a substantial step to extend and generalise modelling of protective behaviour and epidemic progress. 1.2 Model overview The TELL ME model is a two-layer simulation. One layer consists of simulated individuals that receive communication messages, adjust their attitudes accordingly, perceive their situation and make decisions about whether to adopt (or cease) protective behaviour. This behaviour is founded on a hybrid psychological model that includes attitudes, subjective norms and perceived threat. Each simulated person calculates a weighted average of their own attitude (a value between 0 and1), the proportion of nearby people who have adopted the behaviour (a proxy for norms) and a threat score which is high near the epidemic frontier and lower elsewhere. That risk score is the discounted cumulative local incidence; that is, it increases as new cases occur, but yesterday’s new cases count more than the previous day’s and so on. If the weighted average of these three components exceeds some threshold, the person adopts the relevant behaviour. The other layer is a spatial epidemic simulation. Mathematical equations are used to estimate the number of newly infected people in a region in the next time step, based on the existing number of infected and susceptible people. The layers interact, with outputs from each layer influencing behaviour in the other layer. One of the three elements in an individual’s behaviour decision is based on the number of recent nearby new infections. In the other direction, the adoption of protective behaviour by the individuals in a region affects the spread of the epidemic in that region. These model rules are fully described in report D4.2. While some details were changed as the model was constructed, the general approach has not been altered. Updated design details are not available at January 2015 (the end of the TELL ME project) but will be available in the academic literature. The broad logic of the simulation is detailed in Figure 1. The key entities within the simulation are communication plans, individuals and regions. The figure describes major properties of these entities, which are grouped by entity. The arrows identify the pattern of influences between properties of entities. For example, the protective behaviour adopted by individuals affects the regions’ force of infection used in 6 
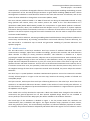
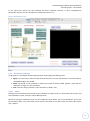
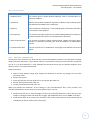
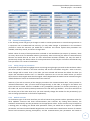
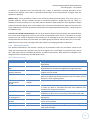
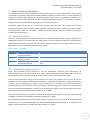
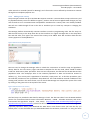
D4.3 Prototype Software (Documentation) TELL ME project – GA: 278723 the epidemic model. The arrows in this logic diagram therefore indicate the main interactions for which rules have been constructed. Figure 1: Broad simulation logic The outcome of these model rules depends on specific characteristics of the simulated individual and their situation. For example, individuals will also have access to different information and communication based on their access to media channels. Those information differences contribute to different behaviour. 1.3 How we envisage you will use the simulation The TELL ME model was built as a prototype decision tool. But it can also be used for other purposes. At least four important uses have been identified during stakeholder discussions. Exploring and comparing scenarios: perhaps the most intuitive use of the simulation is to run different scenarios and compare the outputs. Once you understand the different scenarios that can be simulated, you may wish to run those you consider to be of interest, and explore the difference in outcomes. The most obvious scenarios are the differing communication plans, however you may also wish to consider different individual behaviour, epidemic parameters, or policy contexts. Formal thought experiment: the simulation is based on existing theory from the psychology and health literatures. It therefore represents a formal thought experiment on the implications of these theories, and allows users to track the effects and outcomes of the various theoretical assumptions. If you find results in the simulation you disagree with, it could be useful to explore what is causing the result, and seeking to understand what specific effect it is that produces this result and thus consider what it is that you disagree or agree with from the literature or simulation. Informing data collection: the simulation has many parameters that are necessary to connect the theoretical understanding into practical output. While some of these parameters are calibrated with real world data, there are many others for which data were not available. The simulation can help identify what 7 D4.3 Prototype Software (Documentation) TELL ME project – GA: 278723 parameters strongly affect the results and would therefore be useful to collect data about in the future. The parameters associated with the effect of government communication on an individual’s behaviour are a prime example. Discussion and training tool: it is most likely that all of the above uses will be most beneficial when conducted with colleagues and other stakeholders. In this group format, the simulation becomes a discussion tool which can help identify areas of consensus and disagreement, and develop a shared understanding of the effect of communication and improve decision making capability. 2 User Guide This guide is intended for all users of the TELL ME simulation, regardless of prior experience with using models. No programming is required to use the simulation, it is operated simply by entering parameter values and pressing buttons. The user guide contains three parts: a quick start guide, which describes installation of the required software and an orientation to the interface, including a description of the key input parameters and simulation output; a guided set of scenarios to assist users to learn how to input their own scenarios; and a detailed examination of simulation outputs. 2.1 Modelling environment The simulation is developed in NetLogo (Wilensky, 1999), a specialist ABM software application with its own programming language. The TELL ME simulation enables users to input communication plans and also to manipulate other parameters that are relevant for planning, such as the country to be considered and the infectivity of the disease. A basic NetLogo simulation has three components. The ‘Interface’ component provides tools to allow the user to manipulate key parameters and run the simulation, and charts and other information to monitor the simulation during the run. The ‘Info’ component is to allow accessible documentation to be packaged with the simulation; this gives only very basic information. The ‘Code’ component sets out agent properties, interaction rules and data. That is, this provides the programming to implement the simulation. While the code is available to the model user, the user does not need to do any coding. The TELL ME simulation uses an extended version of NetLogo to provide additional ‘Interface’ components. This means that the main ‘Interface’ component contains only the most important variables that a user may wish to access. The additional interfaces allow more detailed control of communications plans, epidemic management policies, and parameters that are internal to the simulation. As well as providing the structure and tools for building an agent-based model, NetLogo also provides tools for analysing the results of simulations. For example, the BehaviorSpace tool provides scenario management capabilities, so that results from multiple simulation runs can be exported for analysis. 8 D4.3 Prototype Software (Documentation) TELL ME project – GA: 278723 2.2 Quick start guide 2.2.1 Installation Installing the TELL ME simulation is relatively simple but does require several steps. Briefly, these are: Download and install the NetLogo software; Download and install the eXtraWidgets NetLogo extension; and Download and save the TELL ME model file and supporting GIS data. You must first download and install NetLogo on your machine. NetLogo is freely available under a GPL (GNU General Public License) license at https://ccl.northwestern.edu/netlogo/. Go to this website and follow the on-screen instructions to download and install the most recent version (5.1.0 or later) for your operating system (Windows, OS X or Linux). The TELL ME simulation takes advantage of the eXtraWidgets NetLogo extension developed during the project. Before you open the simulation in NetLogo, you will need to download this, and save the files in the appropriate folder. To do so, go to https://github.com/CRESS-Surrey (the link is also available from the TELL ME and CRESS websites) and follow the link to the eXtraWidgets page. Once you have downloaded the extension, place the unzipped folder and its contents in the ‘extensions’ folder inside the ‘NetLogo’ folder (the location of the NetLogo folder will depend on where you saved it during installation, see Figure 2). More detailed instructions on how to install the extension are available from the github site. Figure 2: Saving the eXtraWidgets Extension Download the TELL ME simulation zip file from either the TELL ME (http://www.tellmeproject.eu) or CRESS (http://cress.soc.surrey.ac.uk/web/home) website and save it on your computer. Note the unzipped folder contains both the NetLogo model file (TELL ME model.nlogo) and a folder with geographic information system (GIS) data. These must be unzipped to the same location, with the GIS data in a folder name GISdata, and that folder in the same folder as the model file. You can now open the model file, either by double clicking it (you may have to tell your operating system that NetLogo is the program to open this type of file) or by using File > Open from within NetLogo itself. 2.2.2 Basic simulation control Once you have opened the simulation, you should see a window like that shown in Figure 3. This shows the main interface of the simulation. The screen has several elements to control the simulation and display the output. In addition, there are general controls for the NetLogo software, which are the same for any NetLogo model. 9 D4.3 Prototype Software (Documentation) TELL ME project – GA: 278723 In this quick start section we will introduce the basic simulation controls. A more comprehensive description of how to use the simulation is presented in Section 2.3. Figure 3: Initial simulation view 2.2.3 Orientation to NetLogo At this point it is worthwhile introducing some basic terminology that NetLogo uses: Agent: an entity that is able to make decisions based on its own characteristics and environment, simulated people in this model. Patch: the ‘world’ in the simulation is made up of a grid of squares called ‘patches’, these are also referred to as regions in this simulation. Tick: each time step or advance in the simulation is called a ‘tick’. 2.2.3.1 Menus NetLogo has the common menus found in most software, File, Edit, Tools, etc. These allow you to open and save simulations, zoom, and open various NetLogo tools. Note that saving the simulation saves only the model file, which allows you to run simulations. If you save the simulation after a run, the results are not saved. If you wish to save the results, you must export them (File > Export). 10 D4.3 Prototype Software (Documentation) TELL ME project – GA: 278723 2.2.3.2 Simulation speed At the top of the screen you will see a slider with ‘normal speed’ written below it. By moving this slider you can slow down or speed up the simulation. It is advised you move this all the way to the right to speed up the simulation as it will otherwise take several minutes to run. However, speeding up the simulation will also mean that the screen is not updated every tick. 2.2.3.3 Tabs At the top of the window you will notice six tabs: ‘Interface’, ‘Communications Plan’, ‘Policy Context’, ‘Advanced Parameters’, ‘Info’, and ‘Code’. The user can access different screens by clicking on the relevant tab. All NetLogo simulations have the ‘Interface’, ‘Info’ and ‘Code’ tabs, but their content is specific to the particular model. ‘Interface’ displays the basic inputs, controls, and outputs of the simulation. ‘Communications Plan’ displays the set of messages and their characteristics you are about to simulate. ‘Policy Context’ and ‘Advanced Parameters’ allow you to view and set various more advanced parameters that allow finer control of the scenario to be modelled. The ‘Info’ tab contains some basic info on the simulation in text form, and the ‘Code’ tab contains the simulation code; that is, the program that runs the model. 2.2.4 Orientation to the TELL ME model input controls The simulation can be run entirely from the ‘Interface’ screen. The controls and other elements on this screen are described below. 2.2.4.1 Buttons The most basic controls are buttons. In the TELL ME simulation, the two most important are ‘setup’ and ‘go’; found in the top of the interface, just to the right of centre. The ‘setup’ button initialises the simulation scenario, and the ‘go’ button runs the simulation. Other buttons at the bottom of the interface are used to clear changes that have been made by the user or to select predefined scenarios, described in section 2.4. A button on the interface is associated with a section of code in the simulation code tab. By pressing the button, we are instructing NetLogo to run that code. Buttons can either be a ‘once button’ or a ‘forever’ button. ‘Once buttons’ run that code once and then stop. ‘Forever buttons’ run that code repeatedly forever, until some condition is met which tells the simulation to stop, or you press it again. The ‘setup’ button is a ‘once button’, and the ‘go’ button is a ‘forever button’. 2.2.4.2 Drop-down boxes There is only one drop-down box on the interface, the country selector, found underneath the ‘Localisation’ heading. By clicking on the icon, we are able to select which country you would like to simulate. Note that selecting a country does not automatically load it, we have to press ‘setup’ for this to happen. 2.2.4.3 Sliders Beneath the three red headings, ‘Behaviour’, Epidemiology’ and ‘Localisation’, you will notice eleven sliders. These sliders are used to tell NetLogo what numbers you want to use for the parameters named on the sliders. You can change the value simply by clicking and holding on the coral coloured marker and moving it to the value you wish, or by clicking on the slider image next to the marker, which will move it up or down incrementally. The value of the slider’s parameter (or where the marker is located) is displayed in the bottom right corner of the slider. 11 D4.3 Prototype Software (Documentation) TELL ME project – GA: 278723 The model simulates two types of behaviour: vaccination (V) and other protective nonvaccination behaviours such as hand washing (NV). The four ‘Behaviour’ sliders denote the efficacy and threshold for each of these behaviours. Efficacy is the reduction in epidemic infectivity if the behaviour is adopted, so a higher value will result in a smaller epidemic (if people adopt the behaviour). The threshold is the behaviour score which must be reached for a person to adopt the behaviour, so a higher value will make it harder to reach the required score and lead to a smaller number of people adopting the behaviour. The ‘Epidemiology’ sliders denote the R0 (basic reproductive ratio), latency period, and recovery period of the disease being simulated. The ‘Localisation’ sliders give the values for proportion of the population using social media, in the ‘target group’, against vaccination, and the number of healthcare workers per 1000 population. At the bottom of the screen, there is also a slider for ‘num-messages’ which controls the maximum number of messages available in the Communications Plan tab (see section 2.4.2). 2.2.5 Orientation to the TELL ME simulation outputs The main outputs of the simulation are all found in the interface tab. This section explains what outputs there are, with more detail on interpreting results in section 2.5. 2.2.5.1 World The most immediately eye-catching output is the map view. Once you have clicked ‘setup’ this shows the country that is currently being simulated. The view is split into small squares called patches. The map view is updated during the simulation and, at any point of simulated time, will provide broad information about the epidemic status of regions and protective behaviour adopted by simulated people within each region. The colour of patches indicates epidemic progress (red for ‘active’, blue for ‘not yet reached’ and green for ‘post epidemic’). When blue or green, the darker the shade of the patch the higher the population. When red, the shade indicates whether the prevalence is high or low. Each patch also has a small circle which indicates whether the majority of simulated people in the region have (purple) or have not (white) adopted protective behaviour. 2.2.5.2 Plots Next, there are the ‘Attitude’ and ‘Behaviour’ plots (on the left of the screen underneath the ‘Behaviour’ sliders), split by Vaccination (V) and other protective behaviours such as hand washing or wearing masks (NV). The attitude for each agent (simulated person) is scored between 0 and 1 for each behaviour type, and the display shows the average attitude score over all agents towards the categories of behaviour. The behaviour plot shows the proportion of the population who have adopted each behaviour, with an extra plot (in red) for the proportion of those ‘Exposed’ and ‘Infected’ that have adopted other protective behaviours. To the right, there is the ‘Epidemic Rates’ plot, which shows the incidence and prevalence of the epidemic in each time step. All three plots show the outputs over time, you will see new points plotted as the simulation runs. 12 D4.3 Prototype Software (Documentation) TELL ME project – GA: 278723 2.2.5.3 Monitors Below the ‘Epidemic rates’ plot are seven monitors. Monitors display the value of some calculation. The epidemic monitors show: Impact: the proportion of the population that are, or have been, infected during the epidemic; Regions: the proportion of regions (patches) in the simulation in which more than 5% of the population have been, or are, infected during the epidemic; Incidence: the total number of people from the population who have been newly infected during the current time step (tick); Max I: the highest incidence during the current simulation; When: during which time step the highest incidence occurred; Max P: the highest prevalence during the current simulation; and When: during which time step the highest prevalence occurred. Finally, at the top right of the screen we see ‘When Declared’ which displays when the epidemic in the current simulation was declared; the time step at which the prevalence reaches a predefined level. 2.2.6 Saving the simulation input values Any changes you make to the inputs on the main interface (for example the country selected) can be saved by simply saving the simulation. When it is next opened, it will have those different values selected. The buttons along the bottom allow some of these changes to be reversed by restoring the default values that are included in the original model file. 2.3 Learning to use the simulation The easiest way to learn how to use the simulation is to play with it. Run it, make a small number of changes and run it again to see what happens. If you want to create a separate copy of the model to play with, open the model and then save it under a different name (File > Save As…) and then open the file with the new name. If you make any changes you want to undo, but can’t, simply close and reopen the simulation without saving. Even if you have saved some unwanted changes, you can return the simulation to default parameter values and then save it again. This section provides some guided play, with a series of scenarios that gradually build complexity to assist you to learn to manipulate the simulation and understand outputs. These are unrealistic scenarios designed to demonstrate how the simulation works and allow users to build a solid foundation of familiarity before they use it fully. We shall now ‘walk through’ the six scenarios (summarise in Table 1). These instructions will begin with plenty of text to explain things, but will become more succinct as you go through. You may need to refer to Section 2.4 for a description of each new parameter as it is used. If possible, keep a note of the various outputs to compare results of the different scenarios; if you are very unsure how to interpret the outputs of the simulation, refer to Section 2.5. The scenarios only take a few minutes each, but should be run in one session as they are incremental. That is, changes to parameters in each scenario assume that the changes already made in previous scenarios are still in effect. 13 D4.3 Prototype Software (Documentation) TELL ME project – GA: 278723 Table 1: Learning scenarios Scenario Description 1 – Epidemic Curve This scenario gives a random baseline epidemic, with no communication or behaviour adoption. 2 – Ineffective With the same baseline epidemic, behaviour is added to the simulation (with low behaviour thresholds) but is ineffective. 3 – Effective Next, the efficacy of behaviour is raised and adoption of behaviour therefore has an effect on the epidemic. 4 – Unresponsive This scenario has higher behaviour thresholds making adoption less likely (to provide a comparison base for the communications scenarios). 5 – Basic Communication This scenario introduces simple communication: Regular messages about benefits of vaccination (attitude) plus once-off emphasis of responsibility (norms). 6 – Communication Plan The final scenario has a combination of messages with different media and effects. 2.3.1 Scenario 1 – Epidemic curve The purpose of this scenario is to show the way in which the epidemic spreads in the simulation if nobody adopts protective behaviour. It uses default values for all parameters except that the behaviour thresholds are set to 1 (so that behaviour is never adopted) and increases R0 (so that an epidemic happens more quickly). There is no communication plan. Setup instructions: Open (or close without saving, then reopen) the simulation to remove any changes you may have previously made. Choose any country. Set up the infection to have an R0 of 3 by moving the ‘R0’ slider to 3. Set the ‘protectV-threshold’ slider to 1 set the ‘protectNV-threshold’ slider to 1 When you opened the simulation, all the settings in the ‘Communications Plan’, Policy Context’ and ‘Advanced Parameters’ screens were set to their default values. You can: Confirm that that are no active messages: Click on the ‘Communications Plan’ tab at the top of the window to change screens and check that ‘Trigger’ (left dropdown box) is set to ‘NONE’ for all lines. Confirm that there are no active policy scenarios: Click on the ‘Policy Context’ tab and notice that all checkboxes (at the left of the screen) are empty. 14 D4.3 Prototype Software (Documentation) TELL ME project – GA: 278723 Run the simulation: Click the ‘setup’ button: This transfers all the settings on the sliders to the internal model variables and creates a small number of infections to start the epidemic. You will see the correct country map displayed, with a small light red patch to show where the epidemic is starting. Click the ‘go’ button. Initially let the simulation run at normal speed, but move the slider to the fastest speed so that the run does not take too long to complete. The simulation will take a few minutes to run (and may take a long time to really get going or even die out if you have too low a value for R0). The simulation will stop when the epidemic has finished, or when you click ‘go’ again. Observe the simulation. For this scenario, there is no communication so attitude should not change. This is visible in the attitude plot, with all lines horizontal because nothing changes over time. Furthermore, the thresholds for behaviour adoption have been set to their maximum and agents can’t adopt protective behaviour. This is visible in the behaviour plot, with everything at 0 for the entire run. However, there should be a curve in the epidemic plot, as the epidemic spreads and infects more people but then dies out when most people have become immune. Record the details of the epidemic for comparison with later scenarios: ‘Impact’, ‘Max I’ and its associated ‘When’, and ‘Max P’ and its associated ‘When’. 2.3.2 Scenario 2 – Ineffective The purpose of the second scenario is to show adoption of behaviour, returning the threshold parameters to their default values. The behaviour is ineffective, so it should not influence the epidemic. We also take advantage of the capacity to repeat a simulation (by using the same random seed or sequence of random numbers) with different parameters. Setup instructions: Uncheck the ‘randomise?’ checkbox (on the ‘Advanced parameters’ screen). This makes the simulation use whichever random seed is currently in place (which was randomly generated during the first scenario). Set ‘protectV-threshold’ to 0.3 Set ‘protectNV-threshold’ to 0.25 Set ‘efficacy-vaccine’ to 0. Set ‘efficacy-protect’ to 0. Run the simulation (that is, press the ‘setup’ button and then the ‘go’ button). While the model is running, observe the world view (map). You should see the white dots becoming purple, particularly near the most active epidemic areas. The purple dot indicates that at least half of the agents on the patch have adopted protective behaviour. Observe the attitude plot – it should again be horizontal lines as there is no communication to change people’s attitudes. On the other hand, the behaviour plot should show some patterns. Most likely the blue line increases sharply at the beginning of the simulation, settles for a while then increases during the active epidemic and decreases again as the epidemic dies away. This is people reacting to the epidemic by adopting nonvaccination protective behaviour. The black line (probably) increases much later and then stays at the higher level. This maintenance is because people who seek vaccination are vaccinated and 15 D4.3 Prototype Software (Documentation) TELL ME project – GA: 278723 cannot later become unvaccinated. The red line is extremely volatile as it is based on the behaviour of the small number of agents who are currently infected. Observe the epidemic plot and the results in the various epidemic monitors. These should be identical to the first scenario epidemic results. Why? Because, despite people adopting protective behaviour, the protective behaviour doesn’t provide any protection and therefore has no impact on the epidemic spread. 2.3.3 Scenario 3 – Effective The purpose of the third scenario is to isolate the effect of protective behaviour on the spread of an epidemic. The same settings will be used as in the previous scenario, except that the efficacy of the behaviour is more realistic (returned to their default values). As before, the ‘randomise?’ checkbox is unchecked so the same epidemic is being run. Setup instructions: Set ‘efficacy-vaccine’ to 0.7. Set ‘efficacy-protect’ to 0.25. Run the simulation (remember to press ‘setup’ first). The epidemic should be both smaller (lower impact value, lower maximum incidence and maximum prevalence) and later (higher values for ‘when’) than in the previous scenario. That is, the protective behaviour is helping to control the epidemic. In addition, you may be able to observe that the maximum behaviour adoption (high points on the blue and black curves) are lower than in the previous scenario. This is because a smaller epidemic also reduces the incentive to adopt protective behaviour. This result demonstrates the importance of modelling the two-way feedback between the epidemic and the behaviour and the difficult of understanding the complexity of the feedback without a simulation. 2.3.4 Scenario 4 – Unresponsive The purpose of the fourth scenario is to set up some space to see the effect of communication. Behaviour thresholds are increased so that behaviour is less likely to be adopted. The following two scenarios will then show how communication can lead to reaching those higher thresholds and greater adoption. Setup instructions: Set ‘protectV-threshold’ to 0.35 Set ‘protectNV-threshold’ to 0.35 Run the simulation (remember to press ‘setup’ first). The results should have lower (or even no) behaviour adoption compared to scenario 3, and therefore less control of the epidemic. 2.3.5 Scenario 5 – Basic communication This scenario introduces communication. Two messages are included: one that affects attitude (and hence behaviour), and another that affects behaviour more directly. This latter message adds a bonus to one of the inputs to the behaviour score, increasing the score and making it more likely to exceed the threshold. 16 D4.3 Prototype Software (Documentation) TELL ME project – GA: 278723 Setup instructions: Switch to the ‘Communications Plan’ screen For message 1 (that is, the top line): Set ‘Trigger m1’ to Regular, ‘Day / Level m1’ to 10, ‘Target group m1’ to All, ‘Media channel m1’ to Mass media, ‘Content m1’ to Promote Benefits, and ‘Behaviour type m1’ to Other Protective. For message 2 (the second line): Set ‘Trigger m2’ to National Prevalence, ‘Day / Level m2’ to 0.01, ‘Target group m2’ to All, ‘Media channel m2’ to Social media, ‘Content m2’ to Emphasise Responsibility, and ‘Behaviour type m2’ to Vaccination. Switch to the ‘Advanced parameters’ screen and increase the ‘Bonus for vaccination’ to 0.5 (its maximum). Run the simulation, can you see the changes in attitude? There should be a bump in the attitude plot (blue line) every 10 time steps. There should also be an increase in the proportion adopting vaccination and that adoption starts when prevalence reached 1% of the population. What else has happened? Overall, behaviour levels should be higher than the levels that occurred in scenario 3 because the communications plan has partially overcome the high thresholds for behaviour change. The message 1 parameters mean that a message is broadcast with mass media every 10 days (after the epidemic is declared). That message is intended for everyone and promotes the benefits (that is, increase attitude toward) of nonvaccination behaviour. The message 2 parameters mean that a message is broadcast once using mass media when the proportion of the population infected reaches 1%. That message is intended for everyone and emphasises a person’s responsibility (that is, applies a bonus to the calculation of the behaviour score) for becoming vaccinated. 2.3.6 Scenario 6 – Communication plan The final scenario has multiple communication messages. Also, as was done for scenario 5, the effect of communication is exaggerated (by altering some of the advanced parameters) to make the results more visible. Setup instructions: Clear existing message by pressing the ‘clear messages’ button (bottom left of main interface) Create the Communications Plan in Figure 4: Exaggerate the effect of communication in the ‘Advanced parameters’ screen: bonus for vaccination and bonus for other protective behaviour to 0.5, triple all the values for the four ‘Change’ parameters (eg ‘Change mass media’ from its default of 0.05 to a value of 0.15). Run the scenario. There should be higher levels of behaviour adoption and therefore a lower epidemic impact than in the previous scenario. You have now completed the teaching scenarios, intended to prepare you to run your own experiments. You should be: familiar with how to set up and run the simulation model; able to change many of the parameters in the simulation; and understand and explain the main outputs of the simulation. Close the simulation (without saving) and reopen it to return parameters to their default values. 17 D4.3 Prototype Software (Documentation) TELL ME project – GA: 278723 Figure 4: Scenario 6 Communications Plan 2.4 Scenario management In the learning section we gave you changes to make to various parameters to create learning scenarios. It is important now to understand how and why you may make changes to parameters in the simulation yourself to create the scenarios you would like to simulate. This section explain what parameters are available, what they control, and how to change them. Default values for many of these parameters are based on real world data (see section 3). However, there are many others that are somewhat arbitrary (particularly those concerning the effect of communication) because real world data do not exist. As more information becomes available, you may also wish to permanently change the default values for some parameters so that they do not need to be altered every time you wish to run a series of simulations. 2.4.1 Saving changes to parameters At this point it is important to highlight issues concerning saving changes you make to the simulation. When you move a slider or selector in the main interface, and save the simulation using File > Save or Save As, these changes will be saved. That is, the value you have selected will become the default for when you reopen the simulation another time. It is therefore important not to save the model unless you intend those values to be changed. Note that the original values shipped with the model can be retrieved using the ‘default-behaviour’ button at the bottom left of the interface. However, if you wish to save any of the changes you make to the ‘Communications Plan’, ‘Policy Context’ or ‘Advanced Parameters’ tabs, you must make changes directly to the code, as changes in the sliders and inputs will not be saved. These are available in the ‘gui-defaults’ procedure. To find this procedure, go to the ‘Code’ tab, and use the drop-down procedures menu and select ‘gui-defaults’. Your cursor will move to the correct part of the code. Once here, you must manually change the number for the parameter(s) you wish to change (see Section 3.5 for further explanation). 2.4.2 Default scenarios At the bottom right of the main interface you will six buttons that generate realistic parameter values for three epidemic scenarios and three communications plan scenarios. By clicking these buttons, the simulation automatically sets the parameters to the appropriate values. These scenarios may be helpful as a starting point in helping you decide what parameter values you would like to explore. The epidemic parameters are based on World Health Organisation and United States United States Centers for Disease Control and Prevention planning assumptions, and the communications plan parameters are based on 18 D4.3 Prototype Software (Documentation) TELL ME project – GA: 278723 government reports and discussions with communications experts from the United Kingdom. Table 2 details what the scenario buttons do. Table 2: Scenario buttons Scenario Button Action Changes the Epidemic Parameters to: R0 = 1.4, latency-period = 2, recovery-period = 5. Does not change any other parameters. Changes the Epidemic Parameters to: R0 = 2, latency-period = 1, recovery-period = 5. Does not change any other parameters. Changes the Epidemic Parameters to: R0 = 6, latency-period = 7, recovery-period = 21. Does not change any other parameters. Changes the communications plan to a ‘low activity’ plan. View the Communications Plan tab to view the settings for the messages. Changes the communications plan to a ‘medium activity’ plan. View the Communications Plan tab to view the settings for the messages. Changes the communications plan to a ‘high activity’ plan (NB: this plan has no vaccination). View the Communications Plan tab to view the settings for the messages. There are also three buttons at the bottom left of the interface. ‘default-behaviour’ resets the behaviour parameters to those when the simulation is first opened. The ‘clear messages’ and ‘clear-contexts’ buttons clear the Communications Plan and Policy Context tabs respectively. 2.4.3 Communications plan Comparing the effect of different communications plans is the main function of the TELL ME simulation. Therefore, communications plans are likely to be one of the key scenario elements you would like to change. From using the learning scenarios you should now understand how to change communication plans, so we shall now explain how communications plans are defined in the simulation. A plan is made up of a group of messages. Each message has six parameters and occupies one row in the ‘Communications Plan’ screen. The messages that make up a plan are described in the simulation using the six parameters detailed in Table 3. Table 3: Communications plan message parameters Parameter Trigger Values Before Start Day National prevalence After Regular Description This parameter, in combination with the Day / Level (below), identifies when a message will occur, or be triggered. Messages can begin: (i) before the start of an epidemic (actually when prevalence reaches half the level at which an epidemic is declared) and is intended to represent preparatory communications – Day / Level gives the number of messages that occur before the epidemic, (ii) at the start of the epidemic, (iii) on a particular day after the start of the epidemic – Day / Level gives the day, (iv) when the epidemic reaches a certain national prevalence – Day / Level sets the proportion prevalence, (v) after the peak of an epidemic – Day / Level sets the relative prevalence compared to the epidemic peak (vi) repeated at regular intervals once the epidemic has started – Day / Level gives the number of days between repeated messages. 19 D4.3 Prototype Software (Documentation) TELL ME project – GA: 278723 Parameter Day / Level Values User number input Target Group All High risk Health-care workers Infected Anti-vaccination Mass media Social media Health media Health profession Epidemic status Promote benefits Emphasise responsibility Recommend adoption Media Channel Content Behaviour Type Vaccination Both Other protective Description Gives the number of days or proportion level to be used by the trigger - see above. This parameter identifies to whom messages are targeted (and thus who they reach). They can be targeted at: (i) all of the population, (ii) only high risk groups (e.g., old, young, frail), (iii) health-care workers, (iv) people currently infected, or (v) people with anti-vaccination views. This parameter denotes the medium through which messages are delivered to the target group. They can be channelled via: (i) the mass media, (ii) social media, (iii) the health media (to health-care workers), or (iv) by health professionals (to the public). This parameter describes the content of the message. This can be: (i) to provide information on the current state of the epidemic (which increases trust), (ii) to explain the benefits of adopting a protective behaviour (which increases attitudes), (iii) to emphasise that people have a responsibility to help combat the epidemic by changing their behaviour (which temporarily adds a bonus to the behaviour score), or (iv) to raise awareness of the risk of the epidemic (which temporarily makes people reassess the threat they perceive as if they were close to the epidemic front). This parameter identifies which behaviour ‘type’ is the subject of the message. This can be: (i) related to vaccination only, (ii) related to other protective behaviours only (e.g., handwashing), or (iii) related to both of the above. The simulation will not check that you have created a ‘sensible’ message or plan (for example, you could create a message intended for everyone (target of All) but delivered in specialist health publications (media channel of Health media). You should take the time to verify that each message and the overall plan you create make conceptual sense. You can set the number of messages by choosing how many are active (a message is inactive when the trigger is set to NONE). If you wish to have more than 10 messages, use the ‘num-messages’ slider on the interface, you will need to press ‘clear messages’ and then ‘setup’ to create the extra message slots. As this will also clear whatever message information you have already entered, it should be done before defining the communications plan. 2.4.4 Behaviour parameters There are four basic behaviour parameters (parameters associated with individuals’ protective behaviour) that you may wish to change (see Figure 5). These were used during the learning scenarios, they are: Figure 5: Behaviour parameters efficacy-protect: this gives the proportional reduction in risk to self and others if non-vaccination behaviour adopted. protectNV-threshold: this gives the value (for attitude, norms and incidence combination) required to induce protective behaviour. efficacy-vaccine: this gives the proportional reduction in risk to self and others if vaccinated. protectV-threshold: this gives the value (for attitude, norms and incidence combination) at which agents seek vaccination. 20 D4.3 Prototype Software (Documentation) TELL ME project – GA: 278723 2.4.5 Epidemiology parameters There are three basic epidemiology parameters that determine the underlying characteristics of the disease that you may wish to change (see Figure 6). They are found on the main interface: Figure 6: Epidemiology parameters R0: the basic reproduction ratio (this can be thought of as the number of cases one case generates on average over the course of its infectious period). latency-period: the average number of days after exposure before people are infectious. recovery-period: the average number of days that people remain infectious. 2.4.6 Localisation parameters There are five basic localisation parameters that you may wish to change (see Figure 7). They are: Figure 7: Localisation parameters country: to select the country that is simulated. prop-social-media: which gives the proportion of the population that have access to and use social media. prop-in-target: which gives the proportion of the population that receive messages that are in the high risk group used in messages (e.g. elderly, poor health status). popn-hcw: which gives the proportion of the population that are health-care workers. prop-antivax: which gives the proportion of the population that have strong anti-vaccination views. 2.4.7 Policy context parameters The ‘Policy Context’ screen contains a set of parameters that provide further situational characteristics for the simulation. These do not relate directly to the behaviour of individuals, or the disease characteristics, but provide further depth and context to the simulation if desired. These situations were identified as important contextual elements by stakeholders during the development of the simulation model. Five different policy scenarios are available in the simulation, each with the own set of user controllable parameters. Isolation: this set of parameters relates to the inclusion of the possibility of compulsory or voluntary self-isolation of individuals who are infected. There is a checkbox to turn this context on or off; a slider to show the proportion reduction in travel resulting from isolation; a slider to show the proportion reduction in contacts in an individual’s home region; a number input to determine at what national prevalence percentage the isolation context becomes active; and a slider to determine how long the isolation policy operates after it has become active (this is not the period that a person remains isolated). Restrictions on access to vaccination: these parameters allow for a delay in access to a vaccine (e.g. it takes time to be developed) or restrictions in eligibility for an available vaccine. There is a checkbox to turn this context on or off; a selector box to choose which type of individuals the restriction applies to; and a slider to pick how long the delay occurs. Misperception of risk: these parameters allow for an error in individuals’ perception of the risk the epidemic poses. There is a checkbox to turn this context on or off; a slider to determine the perceived risk 21 D4.3 Prototype Software (Documentation) TELL ME project – GA: 278723 of infection (as opposed to the real observed risk); a slider to determine increased perception of the severity of the disease; and a slider to determine the duration of the misperception (it begins when the epidemic is declared). Media frenzy: these parameters relate to the commonly observed media frenzy that occurs early in a possible epidemic, and the resultant increase in protective behaviour, despite low real risk. There is a checkbox to turn this context on or off; and a slider to determine what proportion of the population adopts protective behaviour based solely on the media frenzy instead of calculating their behaviour based on the usual combination of attitude, proportion nearby who have adopted protective behaviour, and proximity to the epidemic front. Loss of trust in health communication: this set of parameters allows for the possibility that individuals have lost trust in the messages they receive as part of the communications plan. There is a checkbox to turn this context on or off; a slider to determine the average trust in messages at the start of the epidemic; a slider to determine the trust level once recovered; and a slider giving the time for which it takes trust to ‘recover’. While the loss of trust exists, messages will be less effective in changing attitudes or behaviour. 2.4.8 Advanced parameters The ‘Advanced Parameters’ tab contains a further set of parameters used in the simulation. These are set using real world data where possible. They can be changed, but it is envisaged only advanced users will do this. Table 4 describes the available parameters and their interpretation. More details are available in the design documents (particularly TELL ME Report D4.2). Table 4: Advanced parameters Parameter Travel rate Values 0-1 Travel proportion short Prevalence at which epidemic declared See distance 0-1 Population represented by person Randomise? 1000, 2000, 5000, or 10000 Random seed value User input / monitor 0 – 0.3 Initial attitude bonus for target group Daily return to initial attitude See mass media See social media User number input 1-5 ON or OFF 0 – 10% 0–1 0–1 Description The proportion of an individual’s contacts outside of their region/patch The proportion of an individual’s contacts outside of their region/patch that are with the neighbouring regions/patches The national prevalence at which the simulation considers the epidemic to have started Radius for scope of ‘vision’ for individuals to perceive whether agents have adopted protective behaviour and the number of new infections in other regions/patches. The number of people represented by one agent in the simulation. Turns on or off the random number generator, this should be left on unless you wish to reproduce the exact same epidemic and behaviours for comparison purposes. Reports the current random seed value, and can be used (if Randomise? Is off) to enter a previously used random seed value. The difference in initial attitude between those in and out of the target group. The percent decay per time step to return to initial attitude if no further communication. The probability of a person receiving a mass media message. The probability of a person with access to social media receiving a social media message. 22 D4.3 Prototype Software (Documentation) TELL ME project – GA: 278723 Parameter Healthcare worker sees health media Go to doctor during campaign Latitude of acceptance Effectiveness of repeat message Change: mass media Values 0–1 Change: social media 0–1 Change: media for healthcare workers Change: healthcare advisor Trust bonus from information Duration of norms bonus Bonus for vaccination 0–1 Bonus for other protective behaviour 0 – 0.4 Daily discount for past incidence Threat perception multiplier Vaccination: attitude weight Vaccination: norms weight Nonvaccination: attitude weight Nonvaccination: norms weight 0 – 0.2 Description The probability of healthcare worker responding to messages delivered through the health media. The probability of a member of the public receiving a message delivered by healthcare workers. The distance from their own attitude that a message will not be immediately ignored. The relative effect of repeated messages, to allow later messages to have a lesser effect than earlier messages. The amount that a person’s attitude will change due to mass media messages. The amount that a person’s attitude will change due to social media messages. The amount that a healthcare worker’s attitude will change due to messages in specialist health media. The amount that a person’s attitude will change if they receive information from a healthcare worker. Increase in trust due to provision of information about epidemic status. The number of days for heightened awareness of norms or recommendation after message emphasising responsibility. Additional norms score (above the proportion of nearby people who have adopted behaviour) for vaccination. Additional norms score (above the proportion of nearby people who have adopted behaviour) for nonvaccination protective behaviour. The discount per time step for epidemic history in risk calculations. 1–5 Multiplier for threat perception compared to H1N1. 0–1 Weight of own attitude in seeking vaccination. 0–1 Weight of norms (proportion of nearby people who have adopted behaviour) in seeking vaccination behaviour calculation. Weight of own attitude in adopting nonvaccination protective behaviours Weight of norms (proportion of nearby people who have adopted behaviour) in calculation for other protective behaviour. 0–1 0 – 0.5 0–1 0–1 0–1 0 – 0.2 0 – 30 days 0 – 0.5 0–1 0-1 2.5 Understanding the results of the simulation Now we have described all of the parameters and scenarios in the simulation – essentially the inputs – we should consider how to use the outputs or results of the simulation. This section will present the three plots, map view, and monitors that make up the outputs of the simulation in the interface, and compare two differing scenarios for each to demonstrate what the outputs show. The two scenarios used are exactly the same except that one has only a very small communications plan of one regular mass media message, whereas the other has a more complete communications plan made up of a range of different messages. It is also possible to compare many different scenarios, repeat scenarios and take averages, and use more quantitative analysis techniques. NetLogo provides a tool to do this, called BehaviorSpace. See section 4.1 for details. 23 D4.3 Prototype Software (Documentation) TELL ME project – GA: 278723 2.5.1 Attitude plot The attitude plot shows, over time, the average (black and mid-blue) and plus and minus (light-blue and grey) one standard deviation values for individuals’ attitudes towards vaccination and nonvaccination protective behaviours. Figure 8: Attitude Plot with Complete Comms Plan Figure 9: Attitude Plot with One Msg Comms Plan We can see in Figure 8 and Figure 9 that the average attitude toward nonvaccination protection starts slightly higher than that towards vaccination. There is no change in the attitude figures until the epidemic is officially declared at tick 54. This is because none of the messages were active before the start of the epidemic. Once the epidemic has begun we see an increase in attitude as the messages have an effect, but then a decay as time passes after the messages. There is no clear difference in attitudes between the two scenarios, suggesting the regular mass media message common to both scenarios is the most important component of the more complex communications plan with respect to effect on attitudes. 2.5.2 Behaviour plot The behaviour plot shows the proportion of the population adopting vaccination and nonvaccination protective behaviours through time. Figure 11: Behaviour Plot – Complete Comms Plan Figure 10: Behaviour Plot – One Msg Comms Plan 24 D4.3 Prototype Software (Documentation) TELL ME project – GA: 278723 We can see in Figure 10 and Figure 11 that the proportion of those exposed and infected adopting nonvaccination protective behaviours (red line) stays at zero until the epidemic begins, then rises in both scenarios, though higher in the more complete communications plan scenario. Then after dropping a little, rises to one, and stays there until it drops to zero at the end of the epidemic – this occurs later in the more complete communications plan scenario. The proportion of the total population adopting nonvaccination protective behaviours (blue) follows a similar path, though with less ‘noise’, and does not drop off to zero at the end, showing these behaviours have endured post-epidemic. Finally, the black line, showing the proportion of the population that adopts vaccination shows clearly different results between the two scenarios. In the complete communications plan scenario we see a jump after the start of the epidemic, but in the one message scenario we see vaccination rates barely rising above zero. 2.5.3 Epidemic rate plot The epidemic rates plot shows the incidence (proportion newly infected people this time step in pink) and the prevalence (total proportion infected in red). We can see in Figure 13 and Figure 12 that the two scenarios give very different curves, suggesting the different communications plans have had differing effects on the epidemic. The more complete plan scenario shows an overall lower level of incidence and prevalence. Note that the NetLogo software automatically scales the plots, so the left hand plot has a much lower peak prevalence (about 1% compared to 3%) even though the peaks are of similar heights. Figure 13: Epidemic Plot: Complete Comms Plan Figure 12: Epidemic Plot: One Msg Comms Plan This lower peak is because the messages were successful in encouraging vaccination (previous plots) and vaccination is effective in controlling the epidemic. This is visible by comparing the timing, with the large jump in vaccination (black line) occurring at the same time as the sharp break in the epidemic curves. 2.5.4 Map view The map view shows the country being simulated, broken into patches or regions. Recall, the colour of patch indicates epidemic progress (red for ‘active’, blue for ‘not yet reached’ and green for immune or ‘post epidemic’). When blue or green, the darker the shade of the patch the higher the population. When red, the shade indicates whether the prevalence is high or low. Each patch also has a small circle that indicates whether the majority of simulated people in the region have (purple) or have not (white) adopted protective behaviour. For the Complete Comms Plan scenario, we can see from Figure 14 that at tick (time step) 416 the epidemic has not spread (blue) over the whole of the country (United Kingdom), but there are small areas of green where the epidemic did infect more than half the population but has now passed. 25 D4.3 Prototype Software (Documentation) TELL ME project – GA: 278723 Figure 14: Map view – Complete Comms Plan 2.5.5 Monitors Recall, the monitors show: Impact: the proportion of the population that are, or have been, infected during the epidemic; Regions: the proportion of regions (patches) in the simulation in which more than 5% of the population have been, or are, infected during the epidemic; Incidence: the total number of people who have become infected during the current time step (tick); Max I: the highest incidence during the current simulation (proportion of population); When: during which time step (tick) the highest incidence occurred; Max P: the highest prevalence during the current simulation; and When: during which time step (tick) the highest prevalence occurred. Figure 15: Monitors – Complete Comms Plan Figure 16: Monitors – One Msg Comms Plan We can see from Figure 15 and Figure 16 that the impact and region monitors were higher in the one message plan, as were the Max I and Max P. That is, the complete communications plan was more effective in controlling the epidemic by encouraging protective behaviour. 26 D4.3 Prototype Software (Documentation) TELL ME project – GA: 278723 3 Default Values for Parameters It is likely that the ‘real’ value for parameters in the model is country or even region specific. The simulation is intended as a prototype and there is limited availability of data to set these values, so there has been no attempt to provide locally appropriate default parameter values. The only localisation included in the simulation is the GIS information that provides a map and population density for each country. Instead, a single data source was used (where available) to set a ‘reasonable’ value. The default values for parameters set with sliders or other controls on the main interface can be easily changed. The current value is saved with the simulation. However, parameter values in the other interface screens will revert when the simulation is reopened, and their defaults must be changed by editing the model code (see section 3.5). 3.1 Epidemic parameters Users can easily change the parameters related to the underlying nature of the epidemic, but are three predefined scenarios in the simulation (see Table 5) that can be retrieved by clicking the relevant button. Default behaviour efficacy values are set at 0.7 for vaccination (Jefferson et al., 2010; Valenciano et al., 2011) and 0.25 for nonvaccination (Jefferson et al., 2011). Table 5: Epidemic scenarios data Scenario Weak flu Strong flu Extreme Values R0 = 1.4, latency-period = 2, recovery-period = 5 R0 = 2, latency-period = 1, recovery-period = 5 R0 = 6, latency-period = 7, recovery-period = 20 Data sources WHO Pandemic flu guidelines (WHO, 2013) WHO Pandemic flu guidelines (WHO, 2013) Based on Rubella (Centers for Disease Control and Prevention, 2012). 3.2 Communications plan scenarios There were insufficient data available to set the parameters concerning the effectiveness of communication (Lin et al., 2014; Odone et al., 2014). These parameters control model rules such as the amount that a person’s attitude changes in response when they receive a relevant message. Some of these parameters are set so that they have no effect (for example, trust is set to 1), but are available for users to adjust to enable experimentation or customisation following new research. Others are arbitrary, but are coherent with respect to other parameters. For example, each media channel has a parameter that controls how much a message recipient’s attitude changes (in the ‘Effect of communication’ section of the Advanced Parameters screen), and the values were chosen so that the stronger effect occurs with the more trusted information sources (Maurer et al., 2010). The values for accessing various media channels are entirely arbitrary. However, the ‘Go to doctor during campaign’ parameter is informed by the literature (Rubin et al., 2010). The predefined communications plans scenarios ‘high’, ‘medium’ and ‘low’ are based on discussions with project partners and other stakeholders of a draft developed from literature (Rubin et al., 2010; Lam and McGeer, 2011; Department of Health (UK), 2012; Crosier et al., 2014). 27 D4.3 Prototype Software (Documentation) TELL ME project – GA: 278723 3.3 Population structure parameters Travel parameters are used to estimate the proportion of new cases created by a patch that should be created in neighbouring and distant patches. The parameter values of 0.25 (travel rate) and 0.6 (travel proportion short) are based on United Kingdom distance to work data (National Centre for Social Research, 2012). As well as differences in travel rates between countries, these values are affected the size of the country being modelled, because that influences how much area each patch represents. If the travel rate is high and the travel proportion short is low, an epidemic with low R0 can easily die out before getting started because new infections are created in many new places and there is no central pool of infected people to provide a critical mass. Therefore, it is important to assess the realism of the spatial spread of the epidemic when adjusting these parameters rather than simply relying on data. Three parameters are used to define the proportion of the population in specific categories. Those with access to social media (Prop-social-media) is set at 0.7, a moderate value for European countries (Eurostat, 2014; We Are Social, 2014). The number of healthcare workers per thousand population (popn-hcw) is set at 10 (International Labour Organisation, 2014; Trading Economics, 2015). The proportion with antivaccination views was set at 0.1 (ME, 2012). All of these parameters are on the main interface and therefore able to be altered permanently by saving the simulation with the sliders set to the desired default values. 3.4 Behaviour decision parameters A calibration process was used to choose appropriate values for the behaviour parameter values, based on behaviour during the 2009 H1N1 epidemic. These parameters are the weights for different components (attitude, proportion already adopted), the discount that applies to earlier cases in assessing threat and the threshold that must be met for the behaviour to be adopted. The calibration used Hong Kong hand washing data (Cowling et al., 2010) for nonvaccination, and French (Vaux et al., 2011) and Italian (Ferrante et al., 2011) vaccination data. 3.5 Customising default parameter values The parameter values set by sliders and other controls on the main interface are saved with the simulation. That is, if you wish to use different default values, simply change to the values you prefer and save the model. The controls will be set to those values when you open it again. However, if you wish to change the values that are automatically set in the ‘Advanced Parameters’ screen (or the ‘Policy Context’) when the simulation is opened, you will need to make changes in the NetLogo code. To do this: Click on the ‘Code’ tab to switch to the code screen. Click on the ‘Procedures’ dropdown box and select ‘gui-defaults’ from the list of procedures. This will move the cursor to the correct part of the code. Each parameter has a line in the code that is in the form ‘set <name> <value>’ where <name> is the name of the parameter and <value> is the default value that is provided for the control (such as a slider) when the simulation is opened. Identify the parameter whose value you wish to change and edit the number to your preferred value. Save the simulation. Close it and then open it. Check if the parameter is now set to the appropriate value. 28 D4.3 Prototype Software (Documentation) TELL ME project – GA: 278723 4 Technical Reference This section of the documentation is not required for general users of the TELL simulation model. Instead, it is intended for advanced users who wish to use the simulation scientifically or for programmers who wish to modify the model. The reference will: describe how to set up your own experiments and access the results; introduce the general approach to changing the code behind the simulation; and show a simple example of modifying the model: adding another country to be simulated. 4.1 Running your own systematic experiments The NetLogo platform includes a tool called BehaviorSpace, which allows users to run multiple simulations. This manual provides a general introduction, with detailed information available from the NetLogo website at http://ccl.northwestern.edu/netlogo/docs/– use the link on the left to BehaviorSpace. BehaviorSpace can only be used to vary parameters on the main interface. If you wish to vary Communications Plans, Policy Context, and/or Advanced Parameters you will need to consult the documentation at https://github.com/CRESS-Surrey/eXtraWidgets/wiki/Using-the-extension-withBehaviorSpace. This is only suitable for advanced users with NetLogo coding skills. The basic premise of BehaviorSpace is that it performs multiple runs of the simulation, with different parameter values (and thus scenarios) chosen by the user, records the outputs of the simulation, and saves all of this in a csv (comma-separated values) formatted file. These are then available for further analysis with spreadsheet (e.g. Excel) or statistical (e.g. R) software. This provides a way to systematically examine the effect of different parameter values on the simulation behaviour (Lorscheid et al., 2011; Railsback and Grimm, 2012). 4.1.1 Creating an experiment To use BehaviorSpace, select Tools > BehaviorSpace and select ‘New’. This opens a new experiment window. You can give the experiment a name at the top of the window. In the second box you can specify which parameters you wish to vary. NetLogo automatically lists all of the parameters on the interface, you just need to list (or give a start, increment and end point) to specify the values you wish to run (see notes underneath the box). BehaviorSpace will run every combination of values you specify so beware of creating a very large number of values as this will be very time consuming to simulate. The repetitions box denotes how many times each set of parameters will be run – think of this as repeating the same experiment to get a sense of the variability in the simulation. The next box is where you specify what outputs you wish to record in the simulation. The main outputs of interest are likely to be the following (enter the italic text in the ‘Measure runs using these reporters’ box to include these outputs in the experiments): Attitude to nonvaccination protective behaviour: mean [attitudeNV-current] of people Attitude to vaccination: mean [attitudeV-current] of people Proportion of population adopting nonvaccination protective behaviour: count people with [behaveprotect?] / count people Proportion of population adopting vaccination: count people with [behave-vaccinate?] / count people 29 D4.3 Prototype Software (Documentation) TELL ME project – GA: 278723 Proportion of infected adopting nonvaccination protective behaviour: if count people with [infected?] != 0 [count people with [infected? and behave-protect?] / count people with [infected?]] Incidence (proportion newly infected this tick): incidence Prevalence (total infected proportion of the population): prevalence Impact: sum [num-infected + num-immune] of live-patches / sum [popn] of live-patches Regions affected by the epidemic: count live-patches with [num-susceptible < 0.95 * popn] / count live-patches Max I: max-incidence When: when-max-incidence Max P: max-prevalence When: when-max-prevalence If you wish, you can also export the map view as an image file at the end of each run by adding the following code to the 'final commands' box on the experiment window: export-view (word “view_from_run_number” behaviorspace-run-number “.png”) Next, you select whether you wish to measure these outputs at every time step or just at the end of the simulation. You can normally leave the remaining options as they are. Press OK. Now select your experiment, and hit RUN. At the next window select ‘Table output’ only, and hit OK. Next, choose where to save the csv file. Finally, you can speed up the experiments by moving the speed slider to the right, and unchecking the two updates boxes. 4.1.2 Analysis BehaviorSpace generates a results file in csv (comma separated values) format. Part of an example is shown at Figure 17. These files may be very large. For example, an experiment that tests the effect of four inputs with three values each and 20 repetitions of each parameter combination would have 1,620 separate runs (3x3x3x3x20). If each of these has 200 time steps and you set up the BehaviorSpace to record values each time step, there would be 324,000 lines of output. Figure 17: Example BehaviorSpace csv Output The first six rows describe the BehaviourSpace experiment: what the file is, the simulation that produced the results, the experiment name, the time and date, and the size of the map view. These are typically not of interest for analysis, though may be kept for future reference. Below this is the main data you are going to use to analyse the results. There is a separate column for each variable: input (parameter) or output (value calculated during the run). 30 D4.3 Prototype Software (Documentation) TELL ME project – GA: 278723 The first column is a NetLogo generated run number, which is different for each repetition of each parameter combination. NetLogo will run simulations in parallel depending on how many processors you have, so many runs may be occurring simultaneously and will therefore have their results interleaved in the csv file. This run number is followed by the columns for inputs. In the screen shot you can see the run number and the first four columns of the input parameters. The next column is called [step] and is the time step or tick. If you set up the experiment to record results only at the end of each simulation, there will be one row for each repetition of each parameter combination (that is, each experiment or run). In this case, [step] is the tick at which the simulation ended. If you set up the experiment to record results at each time step, there will be multiple lines for each experiment and [step] indicates the tick for which the data applies. The following columns contain the output. These are the results of the simulation to be analysed. You may wish to perform some 'tidying' of the csv file, but the file can be used without such processing. The data can be directly analysed with spreadsheet software or imported to any data analysis software (e.g., SPSS, Stata, R). 4.1.3 Running ‘headless’ NetLogo also allows you to run BehaviorSpace experiments ‘headless’, i.e., from the command line on your operating system. This means you won't use the graphical user interface, and thus won't see the map view at all. This is useful for automating runs on a single machine or a cluster of machines. Whilst familiarity with using the command line is of course helpful, it is possible to use this feature without prior experience. Guidance can be found at https://ccl.northwestern.edu/netlogo/docs/, by going to the BehaviorSpace page, and scrolling to the section on running headless. 4.2 Changing the simulation NetLogo is an accessible programming language. While the TELL ME model is relatively complicated, there are some changes that could be made by inexperienced coders. This section is intended to: introduce the reader to NetLogo code, and identify some available support resources; and provide an example of a simple change, adding another country to the simulation options. 4.2.1 Resources for NetLogo coding Simulations built in NetLogo are mostly built by writing programming code in the ‘Code’ tab of the modelling environment. The interface is also used to create some inputs and outputs such as sliders and plots. NetLogo code is very naturalistic allowing for beginners to get to grips with the code quickly. The NetLogo website (https://ccl.northwestern.edu/netlogo/) has many resources that will be invaluable: The User Manual – this contains a huge amount of information about all aspects of NetLogo, including guides and a dictionary of NetLogo commands. Resources page – this is an excellent place to start looking for discussion boards, model libraries and other resources relating to NetLogo. Tutorials – these are located in the User Manual pages. There are several books about agent-based modelling that contain NetLogo examples and gradually develop models (Vidal, 2009; Teahan, 2010; Railsback and Grimm, 2012). Other learning resources include 31 D4.3 Prototype Software (Documentation) TELL ME project – GA: 278723 video tutorials on Youtube (search for NetLogo) and a free online course offered by the Santa Fe Institute through their Complexity Explorer site. 4.2.2 Adding a new country The prototype has been set up to simulate 28 European countries. It uses GIS data to map each country and its population density across the different regions / patches. One of most straightforward changes you may wish to make is to run a communication and epidemic simulation for a country that is not already included. We will use a walk-through of how to do this to introduce you to some key concepts in changing the simulation. The NetLogo platform automatically connects interface controls to programming code. The first step is to add the new country to the drop down box on the interface as in Figure 18. Right-click on the drop-down box and click ‘edit’, then type in the name of the country to be added. Click ‘OK’ and then check that the country appears in the dropdown list. Figure 18: New Country Drop-down Box Now we need to change the NetLogo code to include the instructions to load the map and population density data for the new country. Figure 18 shows a template for the new code, which should be added inside the ‘load-country-data’ procedure. There are two components, the filename for the GIS data and the population value. The total-popn value is the estimate population in 2015 and should be entered in millions, e.g., for a country with a population of 10 million, simply enter ‘10’. To find this procedure, open the code tab, and then use the ‘procedures’ drop-down box. The code should be inserted in addition to the existing code, and be in the same format. You can check that NetLogo has accepted the syntax of the code by clicking on the green tick at the top left of the screen. Figure 19: New code for new country The final step is to provide the GIS data for NetLogo to load. The data was taken from the SEDAC website (Center for International Earth Science Information Network - CIESIN - Columbia University and Centro Internacional de Agricultura Tropical - CIAT, 2013). (http://sedac.ciesin.columbia.edu/data/set/gpw-v3population-density-future-estimates), which has data available for all countries. You should find the gridded projected population density and download the 2015 data in ascii format. Once you have the file, you should place it in the GIS folder that you downloaded with the simulation, and name it in using the same 32 D4.3 Prototype Software (Documentation) TELL ME project – GA: 278723 convention as the other files present, i.e., “Popn density ‘new country’ 2015.asc”. If necessary, trim the data to exclude islands or other distant features (using GIS software such as the open source Quantum GIS) so that only the regions you want displayed are included in the data. Test the new country by selecting it and then pressing the ‘setup’ button. The map should appear. If this is successful, save the NetLogo file. 33 D4.3 Prototype Software (Documentation) TELL ME project – GA: 278723 BIBLIOGRAPHY Ajelli, M., Gonçalves, B., Balcan, D., Colizza, V., Hu, H., Ramasco, J.J., Merler, S., Vespignani, A., 2010. Comparing large-scale computational approaches to epidemic modeling: Agent-based versus structured metapopulation models. BMC Infectious Diseases 10, 190. Bauch, C.T., Lloyd-Smith, J.O., Coffee, M.P., Galvani, A.P., 2005. Dynamically Modeling SARS and Other Newly Emerging Respiratory Illnesses: Past, Present, and Future. Epidemiology 16, 791–801. Center for International Earth Science Information Network - CIESIN - Columbia University, Centro Internacional de Agricultura Tropical - CIAT, 2013. Gridded Population of the World, Version 3 (GPWv3): Population Density Grid, Future Estimates (2015). Centers for Disease Control, Prevention, 2012. Epidemiology and Prevention of Vaccine-Preventable Diseases. Centers for Disease Control and Prevention. Cowling, B.J., Ng, D.M., Ip, D.K., Liao, Q., Lam, W.W., Wu, J.T., Lau, J.T., Griffiths, S.M., Fielding, R., 2010. Community psychological and behavioral responses through the first wave of the 2009 influenza A (H1N1) pandemic in Hong Kong. Journal of Infectious Diseases 202, 867–876. Crosier, A., McVey, D., French, J., 2014. By failing to prepare you are preparing to fail“: lessons from the 2009 H1N1 ”swine flu‘ pandemic. The European Journal of Public Health. Department of Health (UK), 2012. UK Pandemic Influenza Communications Strategy 2012. Department of Health (UK). Durham, D.P., Casman, E.A., 2012. Incorporating individual health-protective decisions into disease transmission models: a mathematical framework. Journal of The Royal Society Interface 9, 562– 570. Eurostat, 2014. Households - level of internet access. Eurostat. Ferrante, G., Baldissera, S., Moghadam, P.F., Carrozzi, G., Trinito, M.O., Salmaso, S., 2011. Surveillance of perceptions, knowledge, attitudes and behaviors of the Italian adult population (18–69 years) during the 2009–2010 A/H1N1 influenza pandemic. European journal of epidemiology 26, 211–219. Funk, S., Gilad, E., Watkins, C., Jansen, V.A.A., 2009. The spread of awareness and its impact on epidemic outbreaks. Proceedings of the National Academy of Sciences 106, 6872–6877. Funk, S., Salathé, M., Jansen, V.A.A., 2010. Modelling the influence of human behaviour on the spread of infectious diseases: a review. Journal of The Royal Society Interface 7, 1247–1256. Gilbert, N., 2008. Agent-Based Models. SAGE Publications, London, United Kingdom. International Labour Organisation, 2014. SEGREGAT - Employment for detailed occupational groups by sex. International Labour Organisation. Jefferson, T., Del Mar, C.B., Dooley, L., Ferroni, E., Al-Ansary, L.A., Bawazeer, G.A., Driel, M.L. van, Nair, S., Jones, M.A., Thorning, S., Conly, J., 2011. Physical interventions to interrupt or reduce the spread of respiratory viruses. Cochrane Database of Systematic Reviews 2011 CD006207. Jefferson, T., Di Pietrantonj, C., Rivetti, A., Bawazeer, G.A., Al-Ansary, L.A., Ferroni, E., 2010. Vaccines for preventing influenza in healthy adults. Cochrane Database of Systematic Reviews 2013. Keeling, M.J., Eames, K.T., 2005. Networks and epidemic models. Journal of the Royal Society Interface 2, 295–307. Kiss, I.Z., Cassell, J., Recker, M., Simon, P.L., 2010. The impact of information transmission on epidemic outbreaks. Mathematical Biosciences 225, 1–10. Lam, P.-P., McGeer, A., 2011. Communications Strategies for the 2009 Influenza A (H1N1) Pandemic. National Collaborating Centre for Infectious Diseases. Lin, L., Savoia, E., Agboola, F., Viswanath, K., 2014. What have we learned about communication inequalities during the H1N1 pandemic: a systematic review of the literature. BMC Public Health 14, 484. Lorscheid, I., Heine, B., Meyer, M., 2011. Opening the “black box” of simulations: increased transparency and effective communication through the systematic design of experiments. Computational and Mathematical Organization Theory 18, 22–62. 34 D4.3 Prototype Software (Documentation) TELL ME project – GA: 278723 Maurer, J., Uscher-Pines, L., Harris, K.M., 2010. Perceived seriousness of seasonal and A (H1N1) influenzas, attitudes toward vaccination, and vaccine uptake among US adults: does the source of information matter? Preventive medicine 51, 185–187. ME, T., 2012. D1.1 Systematic Review Report. TELL ME Project. National Centre for Social Research, 2012. National Travel Survey, 2002-2012. Department for Transport. Odone, A., Ferrari, A., Spagnoli, F., Visciarelli, S., Shefer, A., Pasquarella, C., Signorelli, C., 2014. Effectiveness of interventions that apply new media to improve vaccine uptake and vaccine coverage. Human Vaccines & Immunotherapeutics 11, e34313. Perra, N., Balcan, D., Gonçalves, B., Vespignani, A., 2011. Towards a Characterization of Behavior-Disease Models. PLoS ONE 6, e23084. Railsback, S.F., Grimm, V., 2012. Agent-based and individual-based modeling: a practical introduction. Princeton University Press. Rubin, G., Potts, H., Michie, S., 2010. The impact of communications about swine flu (influenza A H1N1v) on public responses to the outbreak: results from 36 national telephone surveys in the UK. Health Technology Assessment 14, 183–266. Teahan, W., 2010. Artificial Intelligence—Agents and Environments. Bookboon. Trading Economics, 2015. Population Data. Trading Economics. Valenciano, M., Kissling, E., Cohen, J.-M., Oroszi, B., Barret, A.-S., Rizzo, C., Nunes, B., Pitigoi, D., Cámara, A.L., Mosnier, A., others, 2011. Estimates of pandemic influenza vaccine effectiveness in Europe, 2009–2010: results of Influenza Monitoring Vaccine Effectiveness in Europe (I-MOVE) multicentre case-control study. PLoS medicine 8, e1000388. Vaux, S., Van Cauteren, D., Guthmann, J.-P., Le Strat, Y., Vaillant, V., Valk, H. de, Lévy-Bruhl, D., 2011. Influenza vaccination coverage against seasonal and pandemic influenza and their determinants in France: a cross-sectional survey. BMC Public Health 11, 30. Vidal, J., 2009. Fundamentals of Multiagent Systems with NetLogo Examples. Scribd. We Are Social, 2014. Social, Digital & Mobile Around The World. We Are Social. WHO, 2013. Pandemic Influenza Risk Management: WHO Interim Guidance. World Health Organization. Wilensky, U., 1999. NetLogo. 35