1
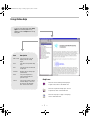
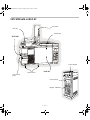
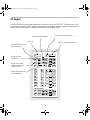
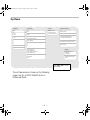
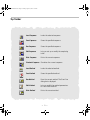
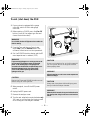
73NQuickReference.fm Page 1 Tuesday, August 12, 2003 1:26 PM
Agilent G1701DA
MSD ChemStation
5973 MSD / ChemStation
Quick Reference
Agilent Technologies
73NQuickReference.fm Page 2 Tuesday, August 12, 2003 1:26 PM
What’s New in Revision D.01.00
• A new toolbar has been added to the Top view
and an expanded set of toolbars have been
added to Data Analysis. Moving the cursor of
the mouse over a toolbar will display tool tips
(quick descriptions) for each of the buttons.
• The sequence user interface or sample log
table has been transformed into a
spreadsheet user interface.
• During sequencing the ABORT button in the
status panel has been changed to Pause.
When this is selected, the sequence will pause
immediately. When the sequence is started, it
will restart the sequence from where it was
paused.
• Long files names are supported. Data file and
method paths can be up to 100 characters
long. The names of individual data files and
methods can be up to 50 characters long.
• The method has been expanded to permit
printers other than the default printer to be
used for reports generated during Run
Method.
• Headers in Data Analysis reports are now
configurable for the reports generated by Run
Method.
• An improved BOOTP service has replaced the
previous BOOTP program. The new BOOTP
service will not interfere with shutting down or
logging off the computer.
• The SICL drivers have been updated to version
L.02.01 . Version M.01.01 is on the software
CD and is for GPIB support.
Online Help
• User Interfaces for selecting or saving files
and directories have been enhanced with
browse buttons.
• Support for 5973A and 6890A instruments
using GPIB has been restored.
• It is now possible to disable Method
Resolution for most changes in the 6890
configuration.
• The Manual Tune and Diagnostics / Vacuum
Control views have be merged into a single
view, Tune and Vacuum Control.
• A Tune Wizard has been provided to simplify
the modification of criteria (tune limits,
target ratios) used by the tuning algorithms.
• Loading data files in Data Analysis will now
preview the chromatogram.
— 2 —
Use the online help to learn about these
new features as well as to learn about
instrument control, data acquisition, data
analysis, methods, sequencing, tuning, and
how to use system commands and
variables. Troubleshooting the MSD is
included to help you diagnose problems.
73NQuickReference.fm Page 3 Tuesday, August 12, 2003 1:26 PM
Using Online Help
To access the online help, select Help
Topics from the Help menu in any
window, or click the Help button on any
dialog box.
Item
Description
Hide / Show
Lets you turn on or off the
display of the list of help
topics.
Back
Goes back to the previous help
topic.
Print
Lets you print the current book
or help topic.
Contents
Displays the list of help topics
(shown above).
Index
Lets you use keywords to
search the help index for a
particular topic.
Search
Lets you type a word or phrase
and then displays a list of all
the topics in the online help
that contain those words.
Help Icons
Indicates a book containing more help topics.
To open a book, select it then double-click.
Indicates an open book of help topics. To close
an open book, select it then double-click.
Indicates a help topic. To jump to a help topic,
select it then double-click.
— 3 —
73NQuickReference.fm Page 4 Tuesday, August 12, 2003 1:26 PM
5973 MSD with a 6890 GC
ALS tower
ALS tray
Column oven
5973 MSD
Status display
Local control
panel
On/off switch
6890 GC
Status board
Keypad
— 4 —
73NQuickReference.fm Page 5 Tuesday, August 12, 2003 1:26 PM
GC Keypad
The MSD ChemStation software provides instrument control for the 6890 GC. This allows you to use
the software, instead of the GC keypad, to program the instrument. However, there are times when you
may want to use the keypad to quickly perform one of the following tasks.
Display column information
Stop a run
Prepare a run (manual injection)
Start a run (manual injection)
Display the front injection
port temperature
Display the oven
temperature
Display the GC/MSD
interface temperature
(Thermal Aux 2)
Display the rear injection
port temperature
— 5 —
73NQuickReference.fm Page 6 Tuesday, August 12, 2003 1:26 PM
Instrument Control View
The Instrument Control view is displayed when you start up
the MSD ChemStation. This is where you set and monitor
instrument parameters. If you are in a different view, select
View / Instrument Control when you are ready to set up the
system for data acquisition.
See the online help for more details
on the menus, buttons, or windows
used in the software.
Acquisition Status Lets you tell at a glance the status of the current
instrument or run (if any).
Start Button Lets you start a run. When a run is not in progress, the
arrow is green. To start a run, click the green arrow, fill in the Sample
Information, and click Start Run. When a run is in progress, the arrow
is gray.
This button also shows the current data file name, sample information
(if any), and the vial number (1 if no ALS).
— 6 —
73NQuickReference.fm Page 7 Tuesday, August 12, 2003 1:26 PM
Run Time Clock Shows the elapsed time since the beginning of the
run if a run is in progress. The scheduled run time is shown below
the digital clock. When a run is not in progress, the Run Time clock
shows the elapsed time since the last run.
Stop Button Lets you stop the system when it is in Pre-Run,
Run, or Post-Run mode. The stop sign is red when a run is in
progress and gray when a run is not in progress.
Logbook Button Displays a menu where you can choose to view,
open, clear, save, or print a particular logbook.
Help Button Displays a menu where you can select an online help
topic for the Instrument Control view. Choose Help Topics to go to
the online help for the entire system.
Injector Button Lets you set parameters for the injector when
you have configured your system with an ALS.
Inlets Button Lets you set parameters for the GC inlet (injection
port) that is configured on your system.
Columns Button Lets you configure columns and set up ramped
flow and pressure programs.
Oven Button Displays a menu that lets you edit GC oven
parameters or GC monitor parameters. When the GC is ready, the
small square in the upper right corner is green. When the GC is not
ready, the square is red.
Aux Button Lets you set the temperature of the GC/MSD
interface (usually Thermal Aux 2).
MS Button Displays a menu that lets you edit MS acquisition
parameters, select another tune file, or edit MS monitors.
Monitor Each monitor displays one instrument parameter. See
the online help for a description of the instrument monitors.
— 7 —
73NQuickReference.fm Page 8 Tuesday, August 12, 2003 1:26 PM
Top Menus
Method
Sequence
View
Secured Control
Run...
Run...
Enable Security...
Load...
Save...
Load...
Save...
Top
Instrument Control
Data Analysis (offline)
Edit Entire Method...
Print
Edit Sample Log Table...
1
2
3
4
Set New Default Paths...
Exit
Start Secured Control...
Select Methods for Secured Control...
Set/Change Startup Method <...>
Set Change Standby Method <...>
Load and Run Sequence...
Print Sequence...
Assign Sample Names to Method...
Use Sample-centric Secured Control...
1
2
3
4
Report Manager password...
Edit Accounts...
Simulate Sequence
Position and Run...
View Sequence Log...
View Sequence Quality Log
Print Sequence Log
Help
Help Topics
Using Help
Import Sequence Information from CSV file...
Batch Mode...
More...
View Revision Readme File
Review Revision History...
About
Select View / Top to access
these menus.
The software menus shown on the following
pages are for an MSD ChemStation in
Enhanced Mode.
— 8 —
73NQuickReference.fm Page 9 Tuesday, August 12, 2003 1:26 PM
Top Toolbar
Load Sequence
Loads the selected sequence.
Save Sequence
Saves the specified sequence.
Run Sequence
Saves the specified sequence.
Edit Sequence
Lets you set up or modify the sample log
table.
Print Sequence
Prints the current sequence.
Simulate Sequence
Simulates the current sequence.
Load Method
Loads the selected method.
Save Method
Saves the specified method.
Run Method
Runs the current method. The Start Run
dialog box is displayed.
Edit Method
Lets you modify the method parameters
for the current method.
Print Method
Prints the current method.
— 9 —
73NQuickReference.fm Page 10 Tuesday, August 12, 2003 1:26 PM
Instrument Control Menus
Method
Instrument
View
Abort
Run...
Inlet/Injection Types
Abort
Load...
Save...
GC Edit Parameters...
GC Plot...
GC Monitors...
Top
Instrument Control
Data Analysis (offline)
Edit Entire Method...
Additional Method Information...
Print
1
2
3
4
Exit
Tune and Vacuum Control...
Acquire RTLock Calibration Data...
Unlock Method...
Disable Method Resolution
Select MS Tune File...
MS SIM/Scan Parameters...
Change MSD Temperatures...
MS Monitors...
Edit MS Tune Parameters...
Perform MS Autotune...
EMF Utilities...
Window
Qualify
Help
Cascade
Tile Horizontal
Tile Vertical
Arrange Icons
Arrange Plots and Monitors
Checkout Tune
Tune Evaluation
View Tunes...
Sensitivity Check
Software Validation
Installation Checklist
Familiarization Checklist
Help Topics
Using Help
1
2
3
4
Review Revision History...
View Revision Readme File
About
Select View / Instrument Control to
access these menus.
— 10 —
73NQuickReference.fm Page 11 Tuesday, August 12, 2003 1:26 PM
Tune and Vacuum Control Menus
File
Tune
Vacuum
Execute
Reset to Defaults
Load Tune Values...
Save Tune Values...
Tune MSD
QuickTune
Vacuum Status...
MS ON
MS OFF
Trace on
View Trace...
Instrument Trace...
Print
Printer Orientation...
Generate Report...
View Tunes...
Set View Tunes Report Options...
Autotune (Atune.U)
Low Mass Autotune (Lomass.U)
Standard Spectra Tune (Stune.U)
DFTPP Tune (DFTPP.U)
BFB Tune (BFB.U)
Tune Wizard...
Pump Down...
Vent...
Purge Calibrant Valve
Power-on Temperatures
Initialize MS Interface
Profile scan
Repeat profile
Detailed profile
Ramp Lenses
Spectrum scan
Find mass...
Air and Water Check
Tune Evaluation
Determine Mass Axis Correction Factors
Optimize Quadrupole Frequency
Restore Previous Tune(s)...
Exit
Calibrate
Parameters
Status
View
Mass axis
Manual Tune...
Mass #2 widths
Mass #3 widths
Peakwidth Linearity
Edit
Edit
Edit
Edit
MS Status
MS I/O Test
MS Temperature Controller Status
Top
Instrument Control
Data Analysis (offline)
Adjust Abundances
Ramp Repeller
Ramp Ion Focus
Ramp Entrance Lens
Ramp Entrance Lens Offset
Tune and Display Parameters...
MS Temperatures...
Ramp Parameters...
Dynamically Ramped Parameters...
Maximize Sensitivity
View Instrument Macro Log...
View Tune Log...
Clear Instrument Macro Log...
Clear Tune Log...
MS Error Codes...
Logbook/Sequence Log Error Codes...
Abort
Help
Abort
Help Topics
Troubleshooting
Using Help
About
Select View / Tune and Vacuum
Control from Instrument Control to
access these menus.
— 11 —
73NQuickReference.fm Page 12 Tuesday, August 12, 2003 1:26 PM
Data Analysis Menus
File
Method
Chromatogram
Spectrum
Load Data File...
Next Data File
List Header...
Edit File Info...
Take Snapshot
Subtract Background (BSB)
Run Method...
Run CustomAnalysis
Chromatogram Scaling...
Draw Chromatogram - No Labels
Draw Chromatogram With Labels
Select Chromatogram Labels...
Add
Subtract
Tabulate
Select Library...
Edit Strategy...
Edit Library...
Select Signals...
Select Printer...
Printer Setup...
Print
Abort
Export Data to CSV File...
Export Data to AIA format...
Import AIA Raw Data Files...
Load Method...
Save Method...
Edit Method...
Edit CustomAnalysis...
Generate AutoSIM Method...
1
2
3
Extract Ion Chromatograms
Display Ion Chromatograms in Merged Format
Select Integrator
MS Signal Integration Parameters...
GC Signal Integration Parameters...
AutoIntegrate
Integrate
Integration Results...
Percent Report
Library Search Report
Change Spectral Display...
Find Mass Spectrum
Batch Mode...
1
2
3
Exit
Calibrate
Quantitate
Tools
View
Set Up Quantitation...
AutoQuant Setup
Edit Compounds...
Update...
List...
Clear...
Calculate
Generate Report
DOLIST...
DOSCAN...
Process Scan List
EasyID
QEdit Quant Result
Edit Non Target Peaks
Parametric Retrieval
Align GC
Review Peak Purity
Use Classic Reports
Report Options...
Report Non Target Peaks...
Use Method Aligned GC trace
Trace Mode Quant...
Custom Reports...
Print Report
Update Database
Select Template/Database
Select View / Data Analysis (offline) to
access these menus.
The View menu in Data Analysis lets you
access other Data Analysis modes
(shown on the following pages).
Export 3-D Data...
Locate A Compound...
Locate All Compounds...
Set Overlay Parameters...
Overlay Chromatograms...
Results Screener
RTLock Setup
Signal to Noise check...
Change Data State...
Options...
Configure Report Headers...
Generate Screen Results for Current File
Generate Screen Report for Current File
Generate/Print Screen Report for Current File
Generate/Print Screen Report for Multiple Files...
Specify Method Screen Database...
Change Screen Database Parameters...
List Screen Database...
Exclude Zero Qualifiers
Copy Window...
Reset Windows...
— 12 —
Help
Help Topics
Using Help
Review Revision History...
View Revision Readme file
About
73NQuickReference.fm Page 13 Tuesday, August 12, 2003 1:26 PM
EasyID Menus
EasyID
Spectrum
Integrate
Co Next Compound
Goto Compound #
Xpand Chromatographic Window +/- 2 minutes
Original Chromatographic Window
Graphics Report to the Printer
Draw Next
Draw Previous
Tabulate
Integration Parameters
Save compound specific integration parameters
Remove compound specific integration parameters
Add
Subtract
Integrate
Restart Quick QEdit
Set Extract Window Start
Set Extract Window Stop
Abort Changes and Exit
Exit and Save Changes
Select Library...
Edit Strategy...
Edit Library...
ChromEval
View
Display Reference Spectra
Evaluate Resolution
Evaluate Tailing
Evaluate Degradation
Data Analysis
Update Reference Spectrum
Select View / EasyID in Data
Analysis to access these menus.
QEdit Menus
QEdit
CO Next Compound
Goto Compound
Xpand Chromatographic Window
Original Chromatographic Window
Graphics Report to the Printer
QDEL Compound
Next File
Load Data File...
Restart Quick QEdit
Abort Changes and Exit
Exit and Save Changes
Spectrum
ChromEval
Display
View
Draw Next
Draw Previous
Tabulate
Evaluate Resolution
Evaluate Tailing
Evaluate Degradation
Normal
Qualifiers
Data Analysis
Add
Subtract
Select Library...
Edit Strategy...
Edit Library...
Display Reference Spectra
Select View / QEdit Quant Result in
Data Analysis to access these menus.
— 13 —
73NQuickReference.fm Page 14 Tuesday, August 12, 2003 1:26 PM
Parametric Retrieval Menus
File
Spectrum
Library
Retrieve
Load...
List Header
Take Snapshot
Subtract Background (BSB)
Draw Next
Draw Previous
Select Library...
Edit Strategy...
Edit Library...
Set Parameters...
Select Library...
Print Current View
Add
Normalized Subtract
Tabulate
Library Search Report...
Continue Results
Read JCAMP File...
Write JCAMP File...
Save Parameters
Abort
Exit
Subset Library...
Add Current Entry
Structures
Options
View
Help
Select Structure Database...
Set Structure Parameters...
Select Normalization Ion
Extend Database Headers...
Command Line
Stack
Manual Integration
Standard Menu
Help Topics
Library Entry Only
TIC and Library Entry
Unknown and Library Entry
Unknown, Library Entry, and Difference
About
Copy Window...
Reset Windows
Select View / Parametric Retrieval in
Data Analysis to access these menus.
Align GC Menus
Alignment
View
Show Current Method Alignment Points
Perform Alignment
Restore Alignment Chromatograms
Data Analysis
Abort
Exit/Save
Select View / Align GC in Data
Analysis to access these menus.
— 14 —
73NQuickReference.fm Page 15 Tuesday, August 12, 2003 1:26 PM
Review Peak Purity Menus
PkPurity
Spectrum
Help
Next Peak
Previous Peak
Select Peak...
Print Selected Window...
Return to DA
Add
Subtract
Tabulate
Help Topics
Peak Purity
Using Help
Select View / Review Peak Purity in
Data Analysis to access these menus.
Quick Screener Menus
Screener
Spectrum
ChromEval
Display
View
CO Next Compound
Goto Compound
Xpand Chromatographic Window
Original Chromatographic Window
Graphics Report to the Printer
Draw Next
Draw Previous
Tabulate
Evaluate Resolution
Evaluate Tailing
Evaluate Degradation
Normal
Qualifiers
Data Analysis
QDEL Compound
Next File
Load Data File...
Restart Quick Screener
ReRun Screen
Add
Subtract
Select Library...
Edit Strategy...
Edit Library...
Display Reference Spectra
Abort Changes and Exit
Exit and Save Changes
Select View / Results Screener in
Data Analysis to access these menus.
RTLock Menus
RTLock
View Current Method Setpoints
Calculate New Curve from Selected Peaks
Restore Nominal Chromatogram
.
Report RTLock Calibration...
Print...
View
Help
Data Analysis
Help...
Relock Method...
Use AutoRelock
Unlock Method...
Select View / RTLock Setup in
Data Analysis to access these menus.
— 15 —
73NQuickReference.fm Page 16 Tuesday, August 12, 2003 1:26 PM
Data Analysis Toolbar Buttons
Load Data File Loads the selected data
(.D) file and displays the total ion
chromatogram (TIC) for that file.
Close Screen Reports Closes the currently
displayed screen reports.
Load Method Loads the selected method
(.M) file.
EasyID Lets you update expected
retention times and ion ratios for MS data
in an existing quantitation database on a
compound-by-compound basis.
Save Method Saves any changes made to
the current method.
Take Snapshot Displays the data that
has been acquired up to the time the
snapshot is activated. GC/MS data only.
Print Lets you print the selected window,
the TIC and spectrum, or the current
method.
Copy Window Lets you copy the selected
window to the clipboard.
Reset Windows Rearranges the graphics
windows to their default positions.
Execute Command Executes the command
that is typed into the command line.
QEdit Quant Result Lets you review and
edit quantitation results once a data file
has been quantitated.
Generate Signal-to-Noise Report Lets
you perform a signal-to-noise check and
then display or print the report.
Review Peak Purity Helps you detect
overlapping peaks (multiple-component
peaks) in your chromatogram.
Retention Time Locking Accesses the
RTLock Setup view which is used for
retention time locking tasks.
CUSTOMTOOL1 Lets you run a
user-created macro. This macro must first
be created and then named CUSTOMTOOL1.
See the online help for Using and Writing
Macros, and Data Analysis Commands.
CUSTOMTOOL2 Lets you run a
user-created macro. This macro must first
be created and then named CUSTOMTOOL2.
See the online help for Using and Writing
Macros, and Data Analysis Commands.
Abort Stops a command or macro.
Toggle Command Line Turns the display of
the command line on or off.
Edit Colors Lets you adjust the colors of
various display items in Data Analysis.
Toggle Graphics Lets you minimize or
maximize the displayed graphics.
— 16 —
CUSTOMTOOL3 Lets you run a
user-created macro. This macro must first
be created and then named CUSTOMTOOL3.
See the online help for Using and Writing
Macros, and Data Analysis Commands.
73NQuickReference.fm Page 17 Tuesday, August 12, 2003 1:26 PM
Draw Chromatogram Redraws the original
chromatogram of the current data file
without labels or integration marks.
Scale Chromatogram Scales the selected
chromatogram by the specified scale
factors.
Extract Ion Chromatogram Extracts and
displays extracted ion chromatograms
(EICs) from the total ion chromatogram
(TIC) of the current data file.
Set Up Quantitation Lets you set up a
quantitation database by specifying
quantitation database globals and entering
compounds into the database.
AutoQuant Setup Provides a semiautomated way to create a quantitation
database.
Edit Compounds Lets you review and edit
information in the quantitation database
compound-by-compound.
Merged Format Causes extracted ion
chromatograms to be displayed overlaid on
each other.
Update Calibration Lets you add, delete,
or update a calibration level in the current
quantitation database.
Overlay Chromatograms Lets you select
multiple chromatograms to be displayed
superimposed on each other.
Calculate Quant Report Quantitates the
current file and generates a quantitation
report.
AutoIntegrate Tries to find the best
integration parameters for the current
chromatogram and then integrates the
chromatogram.
Generate Quant Report Generates a
quantitation report for a file that has
already been quantitated.
Print Quant Report Prints the
quantitation report.
Integrate Integrates the current
chromatogram using parameters set for
the current integrator.
Subtract Spectrum Subtracts one
spectrum from another and displays the
difference.
Custom Reports Starts the Custom
Reports software. If the method does not
have a quantitation database, or no data
file is loaded, you can use default values.
Select Library Lets you select the libraries
that will be used for PBM searches of the
currently selected spectrum.
Print Custom Report Prints the custom
report template specified by the method
using the current data file.
Library Search Report Integrates the
current TIC, searches the current library,
and generates a report.
Online Help Displays the MSD
ChemStation online help.
— 17 —
73NQuickReference.fm Page 18 Tuesday, August 12, 2003 1:26 PM
To vent (shut down) the MSD
1 If your system is equipped with a gauge
controller, switch off the triode gauge
controller.
2 Before venting a CI MSD, press the Gas Off
button (turns off the reagent gas flow and
closes the isolation valve.)
WA R N I N G
On a CI MSD, the Gas Off light must be on when the
MSD is venting.
3 From the Tune and Vacuum Control view,
select Vent from the Vacuum menu in the
software. Follow the instructions presented.
4 Set the GC/MSD interface heater and the GC
oven temperatures to ambient (25°C).
WA R N I N G
If you are using hydrogen as a carrier gas, the carrier
gas flow must be off before turning off the MSD
power. If the foreline pump is off, hydrogen will
accumulate in the MSD and an explosion may occur.
Read the Hydrogen Carrier Gas Safety Guide
(5955-5398) before operating the MSD with
hydrogen carrier gas.
CAUT IO N
Do not turn the knob too far, or the O-ring may fall
out of its groove. Be sure to retighten the knob
before pumping down.
WA R N IN G
Allow the analyzer to cool to near room temperature
before touching it.
CAUT IO N
Be sure the GC oven and GC/MSD interface are cool
before turning off carrier gas flow.
5 When prompted, turn off the MSD power
switch.
CAUT IO N
Always wear clean gloves while handling any parts
that go inside the analyzer chamber.
WA R N IN G
6 Unplug the MSD power cord.
7 Remove the analyzer cover.
8 Turn the vent valve knob counterclockwise only
3/4 turns or until you hear the hissing sound
of air flowing into the analyzer chamber.
When the MSD is vented, do not put the ChemStation
into the Top view. Doing so will turn on the interface
heater.
— 18 —
73NQuickReference.fm Page 19 Tuesday, August 12, 2003 1:26 PM
To pump down (start up) the MSD
1 Make sure your system meets all of the
following conditions before you pump down:
5 Press lightly on the side board to ensure a
correct seal.
The rough pump will make a gurgling noise.
This noise should stop within a minute. If the
noise continues, there is a large air leak in
your system, probably at the side plate seal,
the interface column nut, or the vent valve.
o The vent valve is closed (the knob is turned
all the way clockwise.)
o All other vacuum seals and fittings are in
place and fastened correctly. (The front
side plate screw should not be tightened
unless hazardous carrier or reagent
gases are being used.)
o The MSD is connected to a grounded power
source.
o The GC/MSD interface extends into the
GC oven.
o A conditioned capillary column is installed in
the GC inlet and in the GC/MSD interface.
o The GC is on, but the heated zones for the
GC/MSD interface, the injection port, and
the oven are off.
o Carrier gas of at least 99.999% purity is
plumbed to the GC with the recommended
traps.
o If hydrogen is used as carrier gas, carrier
gas flow is off and the front sideplate
thumbscrew is loosely fastened.
o The foreline pump exhaust is properly
vented.
CAUT IO N
If these conditions are not met, the foreline pump
will be shut off. You must then power cycle the MSD.
If the MSD does not pump down correctly, see the
online help for information on troubleshooting air
leaks and other vacuum problems.
7 When prompted, turn on the GC/MSD
interface heater and GC oven. Click OK when
you have done so. The software will turn on
the ion source and mass filter (quad) heaters.
The temperature setpoints are stored in the
current autotune (*.u) file.
CAUT IO N
WA R N I N G
Make sure your MSD meets ALL the conditions listed
above. Failure to do so can result in personal injury.
2 Select Tune and Vacuum Control from the
View menu.
6 Once communication with the PC is
established, click OK. Within 10 to 15 minutes
the diffusion pump should be hot, or the turbo
pump speed up to 80%. The turbo pump
should eventually reach 95%.
Do not turn on any GC heated zones until carrier
gas flow is on. Heating a column with no carrier gas
flow will damage the column.
8 After the message Ok to run appears, wait
two hours for the MSD to reach thermal
equilibrium.
3 Select Pump Down from the Vacuum menu.
CAUT IO N
4 When prompted, switch on the MSD.
Data acquired before the MSD has reached thermal
equilibrium might not be reproducible.
— 19 —
73NQuickReference.fm Page 20 Tuesday, August 12, 2003 1:26 PM
To tune your MSD
You should tune the MSD periodically to maintain
its optimum performance. Tuning is the process
of adjusting MSD parameters so the instrument
meets certain performance criteria. How often
you should tune is determined by the number and
type of samples you are running, as well as the
overall condition of your system.
Note Always tune the MSD with the same GC
oven temperature and column flow, and the same
analyzer temperature that will be used for data
acquisition.
Keep the Tune reports in a notebook so that
successive reports can be easily compared.
To use Autotune
1 From the Instrument Control view, select
Perform MS Autotune from the Instrument
menu.
2 Select one of the following options, depending
on the instrument performance required by
your application, then click OK.
To use Manual Tune
Manual tuning lets you interactively set the MSD
parameters, such as lens voltages and tuning
masses, to values that meet the needs of your
particular analysis. You can often obtain greater
sensitivity than you can with autotune.
Manual tuning allows you to ramp individual
parameters and to specify the range and step
size for the ramp. The results of the ramp are
displayed visually with the optimum value for the
parameter clearly marked on the plot.
You can acquire two types of data in manual
tune: profile scans (plots the abundance and
peak shape of the tune masses) and spectrum
scans (scans plot response across the entire
mass range).
See the online help for more details about manual
tuning.
o Autotune
Results in maximum sensitivity over the full
scan range.
o Low Mass Autotune
Tunes for the low-mass range.
o Standard Spectra Tune
Results in a standard response over the
full scan range. This option may reduce
sensitivity.
o QuickTune
Adjusts the peak width, mass assignment,
and abundance without changing ion ratios.
3 Review the Tune report.
4 To view the history of tune results, select View
Tunes from the Qualify menu.
— 20 —
73NQuickReference.fm Page 21 Tuesday, August 12, 2003 1:26 PM
To acquire data
To set up the GC for use with the MSD
To inject a sample manually
1 Select Instrument / Inlet/Injection Types.
Select the appropriate injection source and
select the Use MS checkbox. Click OK.
1 Select Manual as the injection source on the
Inlet and Injection Parameters box.
2 Click the Aux button. Verify that you are using
auxiliary channel 2, the heater is on and set
to the desired temperature, and that MSD is
selected as the Type. Click OK.
3 Click the Columns button. Verify that the
detector is MSD and that Vacuum is selected
for Outlet psi. Click OK.
2 Press the Prep Run key on the GC keypad. This
cancels the gas saver flow, brings the inlet
flow to its setpoint value, and closes the
purge valve (for splitless injection only).
3 Select Run from the Method menu from the
Top or Instrument Control view.
4 When the Start Run box appears, specify the
sample information as described below:
To inject a sample with the autosampler
o Specify a unique data file name for the
sample.
1 Place the autosampler vial containing the
sample into the autosampler tray.
o (optional) Fill in the Operator Name,
Sample Name, and Misc Info fields to
document the injection.
2 Select Run from the Method menu in the
Top or Instrument Control view.
o Make sure that the Data Acquisition option
is selected.
3 When the Start Run box appears, specify the
sample information:
o (optional) Select the Data Analysis option
if you want to generate any Data Analysis
reports specified in the method.
o Specify a unique data file name for the
sample.
o Enter the position number of the sample vial
in the Vial field (1 – 100).
o (optional) Fill in the Operator Name,
Sample Name, and Misc Info fields to
document the injection.
o Make sure that the Data Acquisition
option is selected. Select the Data Analysis
option if you want to generate any of the
reports specified in the method.
4 Click Run Method to initiate the run.
5 Click Run Method to initiate the run. If the
temperatures are stable, the Prepare To Inject
box appears. Otherwise, the message Waiting
for GC ready is displayed.
6 When the GC temperatures have stabilized
(the Pre Run light on the GC is steady), inject
the sample and press Start on the GC.
CAUT IO N
Do not inject before the GC is ready. This will cause
inconsistent results.
CAUT IO N
Do not use the Start button on the GC to start a
run when using the autosampler.
— 21 —
73NQuickReference.fm Page 22 Tuesday, August 12, 2003 1:26 PM
To analyze MS data
To load a data file
To average spectra
1
In Data Analysis, select Load from the File menu.
1
2
Select a data file (double-click on a file name or
type a name and click OK). The chromatogram for
the data file is loaded and displayed in window [2].
Position the pointer in the chromatogram at the
starting time for the range you want to average.
2
Press the right mouse button while dragging the
mouse to the end of the range you want to average.
3
Release the mouse button. The spectra in the
selected range are averaged and the averaged
spectrum is displayed in window [1].
A data file must be loaded to perform any
of the following tasks.
To add two spectra
To integrate a chromatogram
1
If the integrator you wish to use is not currently
selected, open the Chromatogram menu and click
Select Integrator. Choose an integrator and
click OK.
2
Select Integrate from the Chromatogram menu.
3
(optional) Select List Results from the
Chromatogram menu. A report of tabulated results
is displayed on the screen. When you are finished
viewing the results, click Done.
To select a spectrum
•
Double-click the right mouse button on the time
point of interest in the chromatogram. The spectrum
appears in window [1].
1
Select a spectrum (double-click the right mouse
button in the chromatogram).
2
Select a second spectrum (double-click the right
mouse button in the chromatogram).
3
Select Add from the Spectrum menu. The two
spectra are added together and the resulting
spectrum is displayed in window [1].
To subtract two spectra
1
Select a spectrum (double-click the right mouse
button in the chromatogram).
2
Select the spectrum to be subtracted (double-click
the right mouse button in the chromatogram).
3
Select Subtract from the Spectrum menu.
The spectrum selected in Step 2 is subtracted from
the spectrum selected in Step 1 and the resulting
spectrum is displayed in window [1].
To zoom in
1
Position the pointer at one corner of the area you
wish to expand in a chromatogram or spectrum.
2
Press and hold the left mouse button while dragging
the mouse to select the area you wish to expand.
1
Select a spectrum or average a range of spectra to
subtract from the data file.
3
Release the mouse button. The selected area
expands to fill the existing window.
2
Select Subtract Background (BSB) from the File
menu. The system performs the following tasks:
To subtract background spectra
To zoom out
1
2
Position the pointer anywhere in the zoomed window.
Double-click the left mouse button.
• The selected spectrum is subtracted from every
scan in the current data file.
• The subtracted data is stored in a BSB
subdirectory in the same directory as the data file.
• The subtracted data file becomes the current data
file and is displayed in window [2].
— 22 —
73NQuickReference.fm Page 23 Tuesday, August 12, 2003 1:26 PM
To use spectral libraries
To integrate and search peaks
To search a single spectrum
Use the following procedure to integrate a total ion
chromatogram and automatically generate a library
search report for each peak detected.
1
In Data Analysis, load a data file. The TIC is displayed.
2
Select a spectrum. The selected spectrum appears in
a window below the chromatogram.
3
Initiate the library search by double-clicking the right
mouse button in the window containing the spectrum.
1
In Data Analysis, load a data file. The TIC is displayed.
2
Select Spectrum / Library Search Report.
3
When the Library Search Report Options dialog box
appears, select the options you want for the library
search report:
• Select either Summary or Detailed to determine
the report format.
• Select one or more destinations (Screen, Printer,
and File).
• Select an Integration Parameter File (leave the
field blank to autointegrate using the ChemStation
integrator).
• Select which spectrum from each peak to use
(Apex, Apex - Start of Peak, Apex - Background at
time, or Peak Average).
4
Click OK to initiate the search.
The chromatogram is integrated and a spectrum
from each peak is searched. The results of the
integration appear on the screen. The library search
report is sent to the destinations selected in Step 4.
5
Select Chromatogram / Integration Results to view
the tabulated integration results.
When the search is complete, the search results
appear on the screen. The spectrum for the unknown,
the reference spectrum you select from the list of
hits, and, if available, the chemical structure of the
reference compound is displayed.
4
To view other spectral data:
• Click on another compound in the hit list to display
a different reference spectrum.
• Select the Difference checkbox to display the
difference between the unknown and the reference
spectra.
5 To view other information:
• Click the Statistics button to display information
about the quality of each hit found in the list.
• Click the Text button to view the header
information stored in the library for the current
reference spectrum.
6 Click the Print button to print a copy of the displayed
spectra.
7
Click the Done button to clear the library search
results from the screen.
— 23 —
73NQuickReference.fm Page 24 Tuesday, August 12, 2003 1:26 PM
Maintenance Schedule
Maintenance tasks are described in the hardware
manuals supplied with your system. How often
you need to perform system maintenance may
vary for your system. Keep a maintenance record.
Every day
Check, and if necessary, replace the septum.
Check the tightness of the injection port liners.
Check the tightness of the column nuts.
Safety warnings
WA R N IN G
Do not perform maintenance with the MSD on or
connected to its power source unless specifically
instructed to by documentation supplied with the MSD.
WA R N IN G
The GC/MSD interface can be on and at a dangerously
high temperature even though the MSD is off. After it is
turned off, the GC/MSD interface cools very slowly.
Make sure all parts have cooled before handling them.
Every week
Check the foreline pump fluid level.
Change the injection port liners and O-rings.
Every month
WA R N IN G
Clean the split/splitless inlet vent line trap.
Check for leaks (inlet, column connections).
Be careful when working behind the GC. During
cool-down cycles, the GC will emit hot exhaust that
could cause burns.
Every three months
Replace gas cylinders (when below 500 psig).
WA R N IN G
Every six months
Replace the foreline pump fluid.
Check, and if necessary, refill the calibration vial.
The oil trap provided for your foreline pump stops only
foreline pump oil. If you are analyzing toxic chemicals or
using toxic solvents, remove the oil trap and use a hose
to route the foreline pump exhaust out of your
laboratory.
Every year
Check, and if necessary, replace the diffusion
pump fluid.
Recondition or replace internal and external
traps and chemical filters on the GC.
WA R N IN G
As needed
WA R N IN G
Tune the MSD.
Clean the ion source.
Replace the carrier gas trap.
Replace worn out parts (filaments, EM, etc.).
Replace the column.
Lubricate seals.
Use chemical-resistant gloves and safety glasses when
replacing pump fluid. Avoid all contact with the fluid.
The insulation around the inlets, detectors, valve box,
and insulation cups is make of refractory ceramic fibers
(RCF). Avoid inhalation of RCF particles. Ventilate your
work area, wear long sleeves, gloves, safety glasses, and
a disposable respirator. Dispose of insulation in a
sealed plastic bag. Wash your hands with mild soap and
cold water after handling RCFs.
— 24 —
73NQuickReference.fm Page 25 Tuesday, August 12, 2003 1:26 PM
Operating Tips
o Back up your data and methods regularly to
avoid loss of data if the files are accidentally
overwritten or deleted, or if a hardware
problem develops with your disk drive.
o Make sure the tune file you are using is
o For a new column, check that the column nuts
are still tight after the first few oven
temperature cycles.
o Use the Config Status keys on the GC keypad
to set the 3 display items most important
to you (time remaining, oven temp, etc.).
These are then always visible regardless of
which ChemStation view is on top.
appropriate for your samples.
o Save Tune reports in a notebook for future
reference.
o Perform system maintenance as indicated
by the maintenance schedule in the GC and
MSD hardware documentation. Keep a
record of all maintenance performed.
o Rinse and refill autosampler wash vials. Do
not add more solvent to a partially full vial.
o Use the following table as a guide to using
the SIM or Scan acquisition modes.
o When venting the MSD, take advantage of
the cool GC to do maintenance such as
replacing inlet liners, septa, etc.
o After pumpdown, wait at least 2 hours for
the MSD to reach thermal equilibrium before
tuning or acquiring data.
o Optimum sensitivity generally occurs at
column flow rates of 1.2 ml/minute or less.
o When injecting volumes greater than one
microliter, use the pulsed splitless mode and
increase the initial oven temperature
10 – 20°C.
Analyze a mixture with unknown
components.
Scan
Analyze a mixture with known
components in unknown
amounts (quantitate).
Scan or
SIM
Identify the presence of a few
known compounds at low levels
within a mixture.
SIM
exact mass printed in the Tabulation report,
not the nominal mass annotated on the
spectrum display. This provides more
accurate data.
o When doing SIM analysis, use low resolution
mode unless you are trying to determine the
ratios of masses one amu apart. Low
resolution provides maximum sensitivity and
repeatability.
o Selecting Constant Flow mode will provide
the most efficient separation in most cases.
It also results in constant sensitivity
throughout the temperature program.
Mode
o When choosing masses for SIM, use the
o For splitless injections, pulsed splitless mode
gives more quantitative sample transfer onto
the column. A pulse pressure of twice the
initial inlet pressure is typical.
Task
o Choose the narrowest scan range that still
— 25 —
produces good library search results. This
allows more spectra across the peak and
better quantitation.
73NQuickReference.fm Page 26 Tuesday, August 12, 2003 1:26 PM
Troubleshooting Tips
MSD is on, but status flashing “Server not
found! Check LAN connection”
This is normal when the MSD is initially turned
on. It means the ChemStation has not yet
established contact with the MSD. If the
flashing continues after the pumpdown is
initiated:
1 Temporary power failure interrupted
communications
2 Bad connection between the MSD and the
ChemStation and/or the hub
No peaks
1 Incorrect sample concentration
2 No analytes present
3 Syringe missing or not installed correctly
(ALS only)
4 Empty sample vial
5 Injection in split mode instead of splitless
mode
Tailing peaks
1
2
3
4
5
Active sites in sample path
Injection too large
Injection port too cool
Column flow too low
GC/MSD interface or ion source too cool
Peaks with flat tops
1
2
3
4
Solvent delay time too short
Display scale is wrong
Injection too large
Electron multiplier voltage too high
Peaks with split tops
1 Bad injection technique
2 Injection too large
Rising baseline
1 Column bleed
2 Other contamination
Retention time (RT) drift
1
2
3
4
5
6
Column has been shortened (shorter RT)
Old column (shorter RT)
Active sites in sample path (longer RT)
Reduced column flow (longer RT)
Injection port leak (longer RT)
Initial oven temperature changed (up =
shorter RT, down = longer RT)
Poor sensitivity
1
2
3
4
5
6
7
8
9
10
11
12
13
Incorrect tuning
Tune file does not match type of analysis
Incorrect temperatures
Incorrect sample concentration
Leaking injection port
Incorrect split ratio
Purge off time in splitless mode too short
Excessive pressure in the MSD
Dirty ion source
Air leak
Detector is not working correctly
Poor filament operation
Incorrect mass filter polarity
— 26 —
73NQuickReference.fm Page 27 Tuesday, August 12, 2003 1:26 PM
Poor repeatability
Isotopes missing or isotope ratios incorrect
1 Dirty syringe needle
2 Leaking injection port
3 Mismatched injection port liner and injection
size
4 Loose column connections
5 Variations in pressure, column flow, and
temperature
6 Dirty ion source
7 Loose connections in the analyzer
8 Ground loop
1
2
3
4
5
6
7
8
9
Inconsistent peakwidths
Foreline or vacuum manifold pressure
too high
1
2
3
4
5
6
Incorrect tuning
No PFTBA in calibration vial
Calibration valve failure
Dirty ion source
Worn out electron multiplier
MSD has not had enough time to reach
thermal equilibrium
7 Large variations in the temperature of the lab
High background in mass spectra
1
2
3
4
5
6
7
Incorrect tuning
Dirty ion source
High background
Electron multiplier voltage too high
Repeller voltage too high
High scan speed (Scan mode)
Low dwell time (SIM mode)
Peaks too wide or too narrow
Repeller and ion focus leads have been
reversed
Excessive column flow
Air leak
Diffusion pump fluid level too low
Diffusion pump fluid is contaminated
Foreline pump oil level too low
Foreline pump oil is contaminated
Constricted foreline hose (this would cause
the vacuum manifold pressure to be too high
but the foreline pressure to be too low)
1 Air leak
2 Foreline or vacuum manifold pressure too high
3 Other contamination
Ions at m/z 18, 28, 32, and 44
1 Detector vented recently (residual air and
water)
2 Air leak
Refer to the Troubleshooting the MSD section of
the online help for more detailed information.
— 27 —
73NQuickReference.fm Page 28 Tuesday, August 12, 2003 1:26 PM
What’s in this Book
What’s New in Revision D.01.00, 2
Using Online Help, 3
5973 MSD with a 6890 GC, 4
GC Keypad, 5
Instrument Control View, 6
Software Menus (Enhanced Mode), 8
Data Analysis Toolbar Buttons, 16
To vent (shut down) the MSD, 18
To pump down (start up) the MSD, 19
To tune your MSD, 20
To acquire data, 21
To analyze MS data, 22
To use spectral libraries, 23
Maintenance Schedule, 24
Operating Tips, 25
Troubleshooting Tips, 26
Document History
First Edition, 9/03
G1701DA MSD ChemStation
Rev. D.01.00
*G1701-90050*
*G1701-90050*
Manual Part Number
G1701-90050
Copyright © 2003
Agilent Technologies
Printed in U.S.A. 9/03