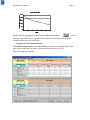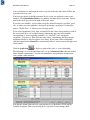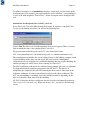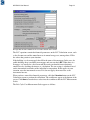
1
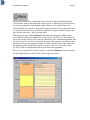
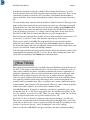
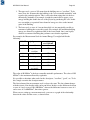
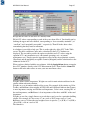
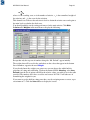
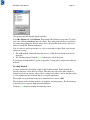
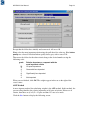
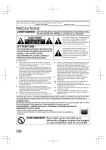
0&'08VHU0DQXDO 2SHQLQJVFUHHQGHVLJQE\3DULFKDUW&KLPNODL 0&'0 User Manual Page 2 IEA Solar Heating and Cooling Task 23 ³2SWLPL]DWLRQ6RODU(QHUJ\8VHLQ/DUJH%XLOGLQJV´ The main objective of Task 23 is to ensure the most appropriate use of solar energy in each specific building project, for the purpose of optimizing the use of solar energy and also of promoting more use of solar energy in the building sector. This is done by enabling the building designers to carry out trade-off analyses between the need for and potential use of energy conservation, daylighting, passive solar, active solar, and photo-voltaic technologies in systematic design processes. In addition, the objective of the Task is to ensure that the buildings promote sustainable development. This is done by including considerations of other resource use and of local and global environmental impact in the trade-off analyses to be carried out. The work in the Task is divided into four subtasks: In Task 23, all participants work on all Subtasks: (1) Case stories, (2) Design process guidelines, (3) Methods and tools for trade-off analysis, and (4) Dissemination and demonstration Participants (the first named is the contact person for each country) Norway Norway Norway Denmark Denmark Denmark Switzerland Switzerland USA Netherlands Netherlands Netherlands Austria Austria Canada Germany Germany Finland Finland Japan Japan Spain Spain Sweden Sweden Anne Grete Hestnes, Operating Agent Inger Andresen Per Kr. Monsen Torben Esbensen, Sub Task A Leader Søren Aggerholm Christina Henricksen Pierre Jaboyedoff, Sub Task B Leader Werner Sutter J. Douglas Balcomb, Sub Task C Leader Bart Poel, Sub Task D Leader Zednek Zavrel Gerelle van Chruchen Susanne Geissler Wibke Tritthart Nils Larsson Günter Löhnert Matthias Schuler Jyri Nienemen Pekka Huovila Mitsuhiro Udagawa Jun Tanimoto Luis Alvarez-Ude Manuel Macias Maria Wall Boris Wall 0&'0 User Manual Page 3 0&'08VHU0DQXDO by Dr. J. Douglas Balcomb Research Fellow National Renewable Energy Laboratory Center for Buildings and Thermal Systems 1617 Cole Blvd., Golden, CO 80401 USA [email protected] The MCDM procedure and 0&'0 program were developed within Sub-Task C of the International Energy Agency Solar Heating and Cooling Task 23. This title of the task is "Optimization of Solar Energy Use in Large Buildings". Sub-Task C concerns "Tools for Trade-Off Analysis". February 2001 0&'0 User Manual Page 4 $FNQRZOHGJHPHQWV Doug Balcomb, National Renewable Energy Laboratory in the USA (NREL), is SubTask C leader and led the effort to develop the MCDM procedure and the 0&'0 program. Particular thanks go to Anne Grete Hestnes, Operating Agent for Task 23, and to Inger Andresen, who contributed many of the key concepts regarding the multi-criteria decision-making process (both at SINTEF, Norway). Thanks are also due to all the Task 23 participants who contributed direction and ideas as the procedure was developed, from Austria, Canada, Denmark, Finland, Germany, Japan, Netherlands, Norway, Spain, Sweden, Switzerland, and the USA. 0&'0 is programmed in Visual Basic by Japan. Jun Tanimoto programmed the original version in 1998 while he was a Visiting Scientist at the NREL working under the direction of Doug Balcomb. Major revisions were subsequently made in the method, requiring new programming. These revisions were made in 2000 and 2001 at Kyushu University in Fukuoka, Japan under the direction of Dr. Tanimoto who had returned to his Associate Professor position. The programming itself was done by a Kyushu University student from Thailand, Parichart Chimklai, as part of her doctoral project. Doug Balcomb provided general oversight and wrote the program Help, the User Manual and the PowerPoint presentation (these files are on the distribution CD-ROM) . Thanks are due Mitsuhiro Udagawa, Task 23 contact person for Japan, for support (Kogakuin University, Japan). 0&'0is not copy protected. Anyone is free to use, copy, or modify the program. The source code is included on the distribution CD-ROM. The developers request only that they be referenced and that the origin of the program within the International Energy Agency Solar Heating and Cooling Task 23 be acknowledged. 0&'0 User Manual Page 5 0&'08VHU0DQXDO 0&'0 is a new design-tool program that automates many tasks involved in using the Multi-Criteria Decision-Making method developed by the International Energy Agency Solar Heating and Cooling Task 23. The end products of the program are worksheets, bar charts, and associated star diagrams that quantify how various design schemes stack up according to criteria selected by the user. There are two situations where 0&'0 will be a valuable tool: In the design process of a building when the team is making a selection between two or more candidate design schemes. In a design competition when a jury is selecting the best design from among several submissions. In both cases, 0&'0 will provide an organized structure within which to make an informed decision. The tool facilitates the process by automating routine tasks. 0&'0 does not make decisions – it leaves that to humans. The five steps of the procedure are as follows: *HWVWDUWHGHDUO\ 1. Select the main criteria and their sub criteria 2. Determine measurement scales for each of the sub criteria 3. Determine weights and sub-weights 3URSRVHWZRRUPRUHGHVLJQVFKHPHV 4. Enter values for each scheme 5. Print the worksheet and star diagram for each scheme and the stacked bar graph 6HOHFWWKHZLQQLQJVFKHPH We recommend that the first three steps be carried out at the beginning of a project before any schemes have been generated. This way the design team starts with a clear understanding of the project priorities. If schemes have already been formulated then there is a chance that some members of the team may be tempted to set up the criteria or weights to favor a particular scheme. Similarly, a jury using MCDM-23 in a design competition completes the first three steps before reviewing any submissions. The criteria and weights should be the same as those published in the request for submittals. This sets the stage for an impartial judging process. 7KH1HHGIRUD)DFLOLWDWRU Whether used by a design team or a design competition jury, it is VWURQJO\ UHFRPPHQGHGthat one person serve the role of facilitator. The facilitator guides the team or jury through the MCDM process. The facilitator is expert in running 0&'0 . It would be a mistake to require that everyone involved be knowledgeable about 0&'0. Just having to read this manual would intimidate many people who would 0&'0 User Manual Page 6 otherwise willingly participate in the process letting the facilitator deal with the program. Many designers are not software people and would be put off by having to learn a program, particularly when they might be suspicious of a method that is new and different – a departure from their normal process. You need to ease them into it. The steps required to run 0&'0 require agreement by the team or jury. Otherwise, the exercise is futile – the group will never buy into the process or accept the results. This means that the group (the team of the jury) must meet together early to agree on the criteria to be used and the importances (weights) each is to be assigned. They should also understand the significance of the measurement scales and participate in their development. One step in the process, the voting to determine weights, requires use of the computer program to enter the votes. However, this might best be accomplished by having each participant fill out a paper ballot rather than having participants use the computer themselves. The facilitator can then enter the results into the computer, perhaps during a coffee break, and present the resulting weights (using the pie charts) when the group reassembles. It would be easy to devise a ballot, using either the Grading method or the AHP method, and make copies to hand around. An example of each is shown in Appendix E. Another place to use voting is in developing values, especially for the non-quantitative criteria. Quality issues, such as architectural quality, can often be judged by experts. A committee of three or four experts could be appointed to rate the building schemes in question, possibly using the 1-to-10 scale. After discussion, each person could vote their judgements, which would then be discussed in the group to give an agreed value to be entered into 0&'0. ,167$//$7,21 0&'0 installs from the 0&'0 CD-ROM. This CD also contains: The user manual (MCDM-User-Manual.doc, 30 pages) A document file titled “The Multi-Criteria Decision-Making Method” (MCDMBooklet.doc, 16 pages) A PowerPoint file describing 0&'0 (MCDM-23.ppt, 30 images) We recommend that you save these to your hard disk and print them. To install 0&'0, insert the CD-ROM into your CD drive. This will usually initiate the installation process automatically. If nothing happens your computer has been set not to start setup automatically. In this case, navigate to the CD-ROM in Windows Explorer and double click Setup.exe or click Run in the Start menu, type in D:\setup, and click Run. Follow instructions that appear on your screen. 0&'0 will normally install in the Program Files directory on your C drive. 0&'0 requires 3.65 MB of hard disk space. The default directory for saving 0&'0 files is C:\Program Files\Mcdm-23\Projects. The installation will leave a startup icon on your desktop. 7RVWDUW0&'0FOLFNWKH0&'0LFRQ 0&'0 User Manual Page 7 7KH0HQX%DU The menu bar provides the main entrees into the 0&'0 program. Initially, all the items except )LOH are ghosted (appear grey) because they are not active unless a project is open. The first thing you will probably want to do is to open a project: Click )LOH and 2SHQ ( or click the 2SHQ icon on the tool bar). Select ([DPSOH and click 2.. This will open the example provided with 0&'0. Browse around in the example, moving from left to right in the menu. Starting a New Project As with many programs, you can either start a new project using an existing project as a starting point or start from scratch. If your new project has a lot in common with a previous one, then it may be best to use it as a starting template. The advantage of starting from an existing project is that you start with the criteria, measurement scales, weights, schemes, and scores that you used previously. This will probably be easiest if you are making only minor changes. If the design team is the same, you may not need to change the criteria or weights. You can easily delete previous schemes and substitute new ones. You can also add or subtract criteria or sub criteria or revote the weights. To start from scratch, just open 0&'0, click the 1HZ button (the one on the left on the tool bar) and begin defining criteria. Proceed from the left to the right on the menu, first &ULWHULD, then 0HDVXUHPHQW6FDOHV, and then :HLJKWV. We recommend that these steps be carried out at the beginning of a project before any schemes have been generated Having set up the project properly by going through the first three steps, you are ready to evaluate schemes (or evaluate design competition entries). You can enter as many as 7 schemes into the program at one time. (If there are more schemes than this, simply set up a separate project with a different name having the same criteria, measurement scales, and weights. This allows you to evaluate schemes in batches of 7.) To define a new scheme, click 9DOXHV in the main menu and select (QWHUQHZYDOXHV. Give the new building a name, for example “Scheme A”. Then enter the appropriate values. When you are finished, you can view the results using 5HVXOWV in the main menu. To change values after they have been entered, click 9DOXHV in the main menu and select (GLWYDOXHVand then select the scheme by name. The following descriptions assume that you are starting with a clean slate. 0&'0 User Manual Page 8 1. Criteria Criteria are the basis for evaluating the relative merits of different building schemes. Criteria define what is important in the selection process. Examples of possible criteria are energy consumption, sustainability, public relations value, and life cycle cost. Criteria fall into two categories, main criteria and sub criteria. Five to eight main criteria are selected. Sub criteria are sub divisions within these categories. Main criteria do not have to have sub criteria – they can stand alone. With no project open, clicking &ULWHULD in the main menu brings up a blank criteria screen. The first decision is whether to use Life Cycle Cost (LCC) as a main criteria. If you want to do this and you also want to use the built-in LCC calculation algorithm, then you must select Life Cycle Cost as your first criteria. The program is very finicky about having the name exactly right and the three sub criteria names exactly right. Otherwise, the program will not use the built-in LCC procedures. (See /&&3URFHGXUHVin the 0&'0 Help for information about the procedures and algorithms.) The HDV\ZD\to get the LCC entries correct is to click the 'HIDXOW button to the right of the first blank criteria box. The screen will now appear as follows: 0&'0 User Manual Page 9 Note that the check box to the left is checked. This indicates that Criterion 1 is active. Note also that the names are filled in for the criterion and three sub criteria. These are the exact names required to activate the LCC procedures. Note further that the number appears in the box at the bottom, indicating that you have selected one main criterion so far. To select another main criterion, click the check box labeled Criterion 2. Then type in the names of the main criterion and any sub criteria you want to use. Note that you can pull in default names for each of the first 6 criteria by simply clicking on the 'HIDXOWbutton. The defaults are the criteria and their sub criteria proposed by the IEA Task 23 group. You can edit these if you wish – it is simply a time-saving feature if you want to use it. The full list of IEA Task 23 criteria and sub criteria is given in Appendix A. Proceed in this way until you have defined at least 5 main criteria but not more than 8. To see criteria 4, 5, and 6 or 7 and 8, click the index tab at the top of the screen. When you are satisfied, click 2. The program will not let you exit until you have defined at least 5 main criteria. (You can always click &DQFHO to bail out.) Experience has shown that people tend to be overwhelmed if there are more than 8 main criteria, and at least 5 are needed in virtually any building situation. You will notice that the names you prescribed for the criteria and sub criteria names show up throughout the remaining 0&'0 screens. If you want to change any names, this can be done by returning to the &ULWHULD item in the main menu. 0HDVXUHPHQW6FDOHV The concept of measurement scales is probably the most difficult to grasp of the ideas in 0&'0. Put simply, a measurement scale is a way to convert a value into a score. A value can be a number of a phrase, depending on whether the criteria is quantitative or qualitative. Quantitative values are used for criteria that can be measured directly with numbers, such as annual energy use, life cycle cost, or carbon emissions. Qualitative values are words or phrases that can be used to characterize how well a building scheme rates against a particular criteria where the rating is more a matter of judgement, not normally subject to quantification. These are quality issues, such as architectural quality or functionality. Some criteria can be characterized either way, such as indoor air quality, which can be either subjective or rated based on a numerical value. In the MCDM method, all criteria are ultimately converted to a qualitative scale, using the familiar scale of 1 to 10. We are used to this scale. We might be asked "How do you rate Joe’s abilities, on a scale of 1 to 10?" There was even a movie, called "10", in which a guy developed an obsession over a girl he reckoned to be a "10". In 0&'0, the 1-to-10 scale is truncated at the bottom resulting in a 4-to-10 scale. The reason is a common theorem in decision-making theory that holds that a scale with seven items is about as fine a scale as people can easily deal with. Ten gradations is a bit too fine. So we just use the top 7 values, retaining the "scale of 10" concept. In the 4-to-10 scale in MCDM-23, the upper and lower ends have particular meanings. 0&'0 User Manual Page 10 1. The upper end, a score of 10, means that the building rates as "excellent". To be more exact, the 10 means that the building is the "best reasonable attainable" with regard to the particular criteria. This is a bit softer than saying that it is the best theoretically attainable. For example, it might be conceivable to create a zero energy building but double the cost of the project by purchasing PV cells. In this case you might set a practical lower bound of energy use close to the internal gains of the building. 2. The lower end, as score of 4, means that while it is just marginally possible to construct a building that scores this poorly. For example, the maximum building energy use allowed by regulation could be the lower bound. One is not legally allowed to construct a building that performs worse that the regulation. For example, the Measurement Scale for Annual Energy Use might look like the following: 6&25( MXGJHPHQW $QQXDOHQHUJ\ XVHN:KP 80 10 excellent 9 100 8 good to excellent good 7 fair to good 140 6 fair 160 5 borderline fair 190 4 marginally acceptable 250 120 The value of 80 kWh/m2 is the best reasonably attainable performance. The value of 250 kWh/m2 is the maximum allowed by regulation. It is possible to substitute other words for the descriptors, "excellent’, "good", etc. To do this, simply overwrite the descriptor names. The first column of the measurement scale is always the same. The last column changes with the criteria. Note that the table can be non-linear. In this case the difference between a score of 9 and a score of 10 is 20kWh/m2, whereas the difference between a score of 4 and a score of 5 is 60kWh/m2, three times greater. When you are setting up a measurement scale, you can see a graph of the relationship between the values and the scores, as shown below. 0&'0 User Manual Page 11 8 56 7 34 2 0 ,1 / -. ,( + ,* ) ' (( !"#%$ & Simply click the appropriate graph icon in the Measurement Scale screen. If you are still confused, see Appendix D where there is more discussion about the distinction between values and scores. 6HWWLQJ8SWKH0HDVXUHPHQW6FDOHV Click 0HDVXUHPHQW6FDOHV in the Main Menu and click one of the Main criteria. For now, let us assume that you select a criterion other than Life Cycle Cost. The screen appears as follows: 0&'0 User Manual Page 12 You see that there are measurement scales set up for each of the sub criteria. Follow the procedure below for each. You have two choices in the Measurement Scales screen: use qualitative terms or use numbers. Click 4XDQWLWDWLYH6FDOH to use numbers and then specify your units. Specify units in the small grey area to the right of the word “units”. If you don’t use numbers, you can either accept the default descriptors (excellent, good, etc.) or define your own qualitative descriptors specifying a string up to 31 characters, such as “World Class” or “Likely to win a design award”. If you select Quantitative Scale, then you must fill in the values corresponding to each of the scores from 10 to 4. You should start by defining the upper and lower bounds, corresponding to “best reasonably attainable” (or “excellent”) and “marginally acceptable”, respectively. Then fill in the other values, remembering that they must be monotonic. However, they do not have to be linear. If you want a linear relationship, click the button labeled /LQHDU)LOO to automatically fill in 5 values between the upper and lower bounds. Click the JUDSKLFRQ to display a graph of the value YV. score relationship. The following is a set of measurement scales set up for 5HVRXUFH8VHwith each of the 5 tables defined as quantitative. You can mix quantitative and qualitative measurement scales within a main criterion. Note that the default value table for each sub criteria is a qualitative scale using the standard descriptors. Thus you can skip these if you don’t want to change them. 0&'0 User Manual Page 13 To define a alternative set of TXDOLWDWLYH descriptors, simply type over the names in the descriptor boxes. For example, you could replace the word “ excellent” , corresponding to a score of 10, with the phrase “ World Class” . All the descriptors can be changed in this way. ,QVWUXFWLRQVIRUWKH6SHFLDO&DVHRI/LIH&\FOH&RVW Select Life Cycle Cost in the Measurement Scale menu. If you have set up Life Cycle Cost to use the built-in procedure, you will see the following box: Answer <HV. The Life Cycle Cost Measurement Scale screen appears. There is just one table in which the value is the calculated Life Cycle Cost. The present value of the life-cycle cost, LCC, is the sum of three terms: LCC = D (construction cost) + E (annual energy cost) + F(annual maintenance cost) The construction cost includes the cost of adding features to the building, compared with a typical building of the same size and type in the same location. Although the construction cost may be higher for a sustainable building than for a typical building, the annual operating cost will be lower, likely resulting in a lower LCC. The three coefficients, DEandF are calculated using standard life-cycle cost equations. See Appendix B for the equations programmed into 0&'0. The process of multiplying the weights by the costs and summing the three terms is carried out in the worksheet arithmetic. So at this point all that is needed are the three coefficients. The LCC for each building is calculated later in the building worksheet depending on the three costs that have been entered for that building. 0&'0 calculates the three coefficients for you based on your financial parameters. 7KLVLV/LIH&\FOH&RVWPDGHHDV\When you answer “ Yes” you will see the following screen: 0&'0 User Manual Page 14 Except that the three numbers in red at the bottom don’ t show. The LCC equations contain the financial parameters on the LCC Calculation screen, such as the discount rate and the annual increase in annual energy cost, among others. Fill in the values that pertain to your situation. If the building is to be mortgaged, then fill in the terms of the mortgage. In the case of a public building, there is normally no mortgage and you can check 12. When there is a mortgage, it is usually for a fixed term and the owner can benefit from reduction in annual taxes by declaring the interest as a deduction. The tax savings is calculated based on the incremental tax bracket of the individual or corporation. If this applies in your situation, enter the incremental tax rate. If it does not apply, then enter zero as the incremental tax rate. When you have entered the financial parameters, click the &DOFXODWH button on the LCC Calculation screen to perform the calculation. The coefficients appear at the bottom of the screen. Click 1H[W to transfer these values into the worksheets and the LCC Measurement Scales. The Life Cycle Cost Measurement Scale appears as follows: 0&'0 User Manual Page 15 Except that the values in the tables are initially blank. Fill in LCC values corresponding to each of the scores from 10 to 4. You should start by defining the upper and lower bounds, corresponding to “ best reasonably attainable” (or “ excellent” ) and “ marginally acceptable” , respectively. Then fill in the other values, remembering that they must be monotonic. A calculator is provided to help you. This is on the right side of the LCC Value Table screen. The three coefficients, D, E, and F, calculated by the LCC Calculator are displayed. The two tables provide the option to calculate two LCC values using the equation LCC = D (construction cost) + E(annual operating cost) + F (annual maintenance cost). Simply enter the appropriate values for the most optimistic scenario (Excellent) and the marginally acceptable scenario (Marginal) and the calculator does the arithmetic for the LCC. When you have finished with the two columns, click the $SSO\9DOXHV button to transfer these LCC numbers directly to the LCC Measurement Scale. Then click the /LQHDU)LOO button or fill in the other values or enter your own non-linear values. :HLJKWV Weights define relative importance. Weights are used for main criteria and then for sub criteria within each main criterion. Weights are a set of numbers which add up to one. For example, if the criteria are Color, Texture, and Brilliance, then weights of 0.30, 0.50, and 0.20 would indicate that Texture is most important, carrying one-half the total importance, Color is next, carrying 30% of the total importance, and Brilliance is least importance of the three with 20% of the total importance. Weights are used in a simple linear way to calculate a total score for a particular building scheme. For example, if Color scores a 7 on a scale of 10, Texture scores a 5, and Brilliance scores a 10, then the total weighted score is equal to (7) x (0.30) + 5 x (0.50) + (10 x (0.20) = 6.6 on a scale of 10. The formula is: 0&'0 User Manual ? : ; > Ê <9 Page 16 <=< 1 where 6 is the resulting score, P is the number of criteria, Z@ is the normalized weight of the criterion, and VA is the score for the criterion. This formula is used first at the sub criteria level to obtain the criteria scores and again at the main level to calculate the final score. You should probably start by setting preferences for the main criteria. Click 0DLQ &ULWHULD under :HLJKWVin the main menu to display the following: Except that only the top row of numbers alongside “ Mr. Default” appear initially. The weights that will be used in the worksheet are the values that appear in the bottom line of numbers, opposite the word :HLJKW. If you already know the weights you want to use you can bypass the whole built-in procedure of voting and calculating. Click on the button labeled $GRSWLQJ, select 8VHU 'HILQHGfrom the list of options and fill in the relative values you want to use in the table provided. The numbers don’ t have to add to one because 0&'0 will take care of normalizing the weights for you. If you want to use the built-in voting procedure, start by assigning names to voters, up to a maximum of 7. Click the 9RWHU button to display the screen: 0&'0 User Manual Page 17 (Except that only Mr. Default appears initially.) Select 0U'HIDXOW and click 5HQDPH. Then rename Mr. Default to your name. To add a new voter, clicking on $GG and provide a name. Keep going until you have created lines for each voting participant. The box above shows the situation when 4 new voters were defined, leaving Mr. Default unchanged. Now it is time to specify preferences as a way to determine weights. Each voter has two options for voting: 1. The AHP method (analytical hierarchy process). Click the blue button to the left of the name. 2. The Grading method. Click the green button to the left of the name. A description of each method is given in Appendix C along with a comparison of the two methods. *UDGLQJ0HWKRG A simple method for calculating weights is the Grading method. In this method, the person voting first selects their top criteria. Then they rate each of the other criteria in comparison to the top criteria, using a 10-to-4 rating scale, where 4 means that the criteria is of no significance and 10 means that it is of equal significance. The weights are proportional to the votes, normalized to a sum of 1.000. The advantage of the Grading method is it simplicity and transparency. The disadvantage is that it has a less rigorous mathematical foundation. Click the green button to display the following screen: 0&'0 User Manual Page 18 Except that the sliders have initially not been moved. All are at 10. )LUVW, select the most important criteria using the pull-down list at the top. Here ,QGRRU TXDOLW\was selected. Note that Indoor quality shows grey with a score of 10. Then move the sliders for the other criteria along to the desired number, using the following scale: JUDGH 10 9 8 7 6 5 4 5HODWLYHLPSRUWDQFHFRPSDUHGZLWKWKH PRVWLPSRUWDQWFULWHULD 2IHTXDOLPSRUWDQFH 6RPHZKDWOHVVLPSRUWDQW 6LJQLILFDQWO\OHVVLPSRUWDQW 1RWLPSRUWDQW When you are finished, click 2.. The weights appear in the row to the right of the voter’ s name. $+30HWKRG A more rigorous method for calculating weights is the AHP method. In this method, the person voting identifies the relative importance of all pairs of criteria. If there are 6 criteria, then there are (6 x 5)/2 = 15 pairs and thus 15 votes to be made. Click the blue button to display the following screen: 0&'0 User Manual Page 19 Except that all the squares are initially not colored. In this example there are 5 criteria and thus 10 pairs. Click any square. The following screen appears: The names are those corresponding to the square that was selected, in this case Architectural Quality and Environmental Loading. Use the slider to indicate your assignment of importance. (Note that a number appears above the slider as you move it. This relates to the number that is entered into the AHP matrix. The numbers 1, 2, 3, 4, 5, 6, 7, 8, and 9, are translated into the standard numbers used in the AHP method, 1/9, 1/7, 1/5 1/3, 1, 3, 5, 7, and 9. The weights are determined by calculating the principal eigenvector of the final matrix. See Appendix C.) A guide to voting is the following: End of the scale = WRWDOO\LPSRUWDQW, compared to the other criteria Next to the end = JUHDWO\PRUHLPSRUWDQW than the other criteria Next to the center = VRPHZKDWPRUHLPSRUWDQW than the other criteria Center of the scale = HTXDOO\LPSRUWDQW to the other criteria 0&'0 User Manual Page 20 After you have placed the slider to the position desired, click 5HFRUGWKLV9RWH. This returns you to the previous matrix with the box now colored in. If you don’ t vote any single box then that box is assigned a default vote of (TXDOO\,PSRUWDQW. When you have clicked on all the boxes and recorded all your votes, then click 2.. You will see the screen flicker as the program executes a DOS program called calm.exe returning with the following screen: In this case, Mr. Tanimoto was quite consistent in his votes. (Consistency in this situation relates to the fact that while there are 10 votes there are only 5 weights. Thus the votes are redundant.) If the voter is not consistent, then the consistency index, CI, will be large. If he or she is completely consistent then CI is zero. Adequate consistency exists when CI < 0.15, in which case the weights are recorded directly. If CI is greater than 0.15 the user is notified and can either vote again or barge ahead with his or her calculated weights. Click 2. in the above box to return to the original weighting screen showing all the voters and the current weights (as we showed earlier).. 0&'0 User Manual Page 21 After all the votes are recorded, the row of weights labeled $YHUDJH shows the arithmetic average of the weights of all of the voters. Click the button labeled $GRSWLQJ to display the following screen: Showing all the voters names, $YHUDJH, and 8VHU'HILQHG. Usually, having solicited votes from all participants, you will select $YHUDJH although you could select one of the other options. This transfers the corresponding row of values into the Weights row. These are the weights that will be used in the worksheet. Click the button labeled Pie Chart to display a pie chart of the weights. The pie chart graphic can be printed or copied to the clipboard. At this point it is a good idea to show the participants the results of their efforts. Adjustments can be made by consensus, using the 8VHU'HILQHG option to record the final agreed-on set of weights. The procedure for determining weights for each of the sub criteria within any of the main criteria is the same as described above. In the :HLJKWV menu, select the main criteria by name. A similar weighting screen will appear, showing the corresponding sub criteria. 8VLQJ3DSHU%DOORWV As you will now appreciate having just been through it, the process of weights is potentially quite complex and could be quite intimidating for the members of a design 0&'0 User Manual Page 22 team or jury. Fortunately, there is no need for all participants to get into the nitty gritty details of weights described in this section. In fact, it would be a mistake to ask them to. All they need to do is vote their preferences. The facilitator should make up simple paper ballots and hand them out. Participants can mark the ballots, which are then collected by the facilitator, who subsequently enters the numbers in the program. This shields the participants, who might well be reticent to use a computer or reluctant to take the time to learn even a simple procedure. The method also works if the participants are scattered and need to vote by e-mail or fax. Making ballots, which can then be copied, is easy. A pair of examples are given in Appendix E. 9DOXHV After you have set up 0&'0 in the first three steps, it is ready to use. You can enter up to seven different schemes in the program. The process is straightforward: 1. Click 9DOXHV in the main menu. Click (QWHUQHZEXLOGLQJ. Fill in the name of the building in the 1HZ%XLOGLQJ screen (for example, Scheme A). 2. The next screen has a series of tabs across the top, one for each of your main criteria. Starting with the first main criteria, fill in the values for each of the sub criteria. These must be between the upper and lower bounds for that sub criterion. As you fill in each value, the corresponding score (on the 4-to-10 scale) appears in the corresponding box. You can click on the graph icon to display the graph showing the relationship you determined earlier for values vs. scores. 3. Complete the process of defining values for each main criterion. 4. Click 2. when you are finished. Once you start, you must fill in all the values before you can exit. The screen in step #2 might appear as follows: Here we have defined a third scheme, Scheme C, in a project with 5 main criteria, which show as tabs across the top. The second main criterion is 5HVRXUFH8VH. The first two 0&'0 User Manual Page 23 sub criteria are quantitative and the last three are qualitative, as you can discern from the upper and lower scale values. Values are entered in the column on the far right (white background). The values must lie between the upper and lower bounds, indicated in the center columns. You can see your value table for each sub criteria plotted as a graph by clicking on the JUDSKLFRQ . The 0&'0 program interpolates your value within the value table, producing a score that is shown to two significant figures in the column labeled 6FRUH. Qualitative scores are integers but quantitative scores are linearly interpolated between two points. You may enter up to 7 schemes in a project. 5HVXOWV Whew! Now you are ready to see the fruits of your labors. Was it worth it? After you have entered values for one or all the buildings you want to evaluate, click 5HVXOWV in the main menu. You are given three choices of results: :RUNVKHHW, 6WDFNHGEDUJUDSK, DQG9LHZ UHVXOWVIRUDOOVFKHPHV. The worksheet option requires that you select the scheme you want to see. The other two show all schemes. It is recommended that you print out all these results and distribute them to the design team or competition jury for their review and comment. Worksheet The worksheet shows the values, weights, and scores for one scheme. The worksheet provides documentation of the process, which would be of particular importance to keep for a public building or a design competition. The results of the computations show in the two columns labeled "weighted scores" these are derived from the scores using the sub-weights by calculating simple weighted sums. The last column shows the weighted scores (the product of the criteria score and the criteria weight). The sum at the bottom of the last column is the final score. The worksheets can be printed or exported. On the worksheet there is a button marked 6WDU&KDUW. Click this button to display a star chart for the scheme. The star chart can be copied to the clipboard. 0&'0 User Manual Page 24 The button labeled ([SRUW needs some explanation. This initiates an export action that allows you to save the worksheet as a comma-delimited file (csv format). You will see a screen, similar to a Save As screen, asking you to specify a path and a file name. After saving the file, you can open it in a spreadsheet program, such as Excel, or any text editor or word processor. This will allow you to manipulate the numbers arbitrarily. Formulas are not copied. The 6WDFNHGEDUJUDSK DQG9LHZUHVXOWVIRUDOOVFKHPHoptions are self explanatory. 0&'0 User Manual Page 25 $SSHQGL[$&ULWHULD6HOHFWHGE\WKH,($7DVN*URXS The following is a list of criteria and sub-criteria for solar building design proposed by the IEA Task 2 participants. This might be a good starting point for the team discussions, providing a jump-start. /LIHF\FOHFRVW 5HVRXUFHXVH (QYLURQPHQWDOORDGLQJ $UFKLWHFWXUDOTXDOLW\ ,QGRRUTXDOLW\ )XQFWLRQDOLW\ Construction cost Annual operation cost Annual maintenance cost Annual electricity Annual fuels Annual water Construction materials Land CO2-emissions from construction Annual CO2 emissions from operation SO2-emissions from construction Annual SO2 emissions from operation NOx emission from construction Annual NOx emissions from operation Identity Scale/proportion Integrity/coherence Integration in urban context Air quality Lighting quality Thermal quality Acoustic quality Functionality Flexibility Maintainability Public relations value Note that this list contains PDLQFULWHULD and VXEFULWHULD. It is important to keep the number of main criteria between 5 and 8 and that there not be more than 8 sub criteria under any of the main criteria. A good procedure is to develop exhaustive list first and then refine it by (1) eliminating criteria of little importance, (2) grouping those that remain into main categories, (3) selecting a title for the main criteria, and (4) refining the sub criteria. The approach recommended is to start out wide with general, strategic objectives, and then narrow, proceeding to specific objectives until a level is reached that is reasonable. The example includes 26 total sub criteria, which is a reasonable number. More than 30 would probably be too many. $SSHQGL[%9RWLQJ0HWKRGV $+30HWKRG The Analytical Hierarchy Process (AHP) was developed in 1971 by Thomas L. Saaty, a Professor at Pittsburgh University. AHP is widely used in the field of operations research. AHP is a decision-making procedure combined with a systems-approach methodology and subjective evaluation. Most decision-making processes can be divided into three stages, setting the final goal, determining of the weights among the criteria, and choosing the alternative. AHP provides a rational procedure supported by a mathematical background for the latter two stages. 0&'0 User Manual Page 26 In MCDM-23, the full AHP method is not employed. Instead, the method is used only as a option for determining weights. Alternately, you can use the Grading method or you can identify weights any way you like and simply enter them into the program. The AHP method is automated in 0&'0. The determination of weights is a two-step process. In the first step, participants vote their preferences. Questions are presented for each possible pair of criteria. If there are N criteria, then there are N x (N – 1) ways to pair the criteria. Thus you vote N x (N – 1) times. The votes are recorded as numbers in a matrix. The numbers are 9, 7, 5, 3, 1, 1/3, 1/5, 1/7, or 1/9, based on your answers to each question. This fills out half the matrix. The numbers in the transpose locations are the reciprocals of these numbers. The diagonal matrix cells are all ones. Once you have voted on all the pairs, the weights are calculated by 0&'0. The weights are the principal eigen-vector of the matrix. It is important that your answers to the questions be consistent. As part of the evaluation, a consistence index (CI) is calculated. The smaller the number, the better. Prof. Saaty recommends that consistency index should be less than 0.15. If your CI is larger than 0.15, the program will notify you and give you a chance to change your votes. However, you may elect to forge ahead anyway with a CI greater than 0.15. The advantage of the AHP method is its technical rigor. The disadvantages are that more votes are needed and it is less transparent for the average user. *UDGLQJ0HWKRG A simpler alternative to the AHP method for calculating weights is the Grading method. In this method, the person voting first selects their top criteria. Then they rate each of the other criteria in comparison to the top criteria, using a 10-to-1 rating scale, where 1 means that the criteria is of no significance and 10 means that it is of equal significance. The weights are proportional to the votes, normalized to a sum of 1.000. The advantage of the Grading method is it simplicity and transparency. The disadvantage is that it has a less rigorous mathematical foundation than the AHP method. &RPSDULQJWKH0HWKRGV The advantage of the AHP method is its technical rigor. The disadvantages are that more votes are needed, it is less transparent for the average user, and the redundancy of the votes (leading to the need to made a consistency check) is very confusing for users. The advantage of the Grading method is it simplicity and transparency. The disadvantage is that it has a less rigorous mathematical foundation. In practical terms, we observe that the AHP method tends to spread out the weights more than the Grading method. It is really up to the individual voter to use the method that they are most comfortable with. It is possible for one voter to use one method and for another to use the other method. 0&'0 User Manual Page 27 $SSHQGL[&/LIH&\FOH&RVW There is a special procedure for using Life-Cycle Cost as a criteria. 0&'0 has a build-in calculator that computes the life-cycle cost based on your financial parameters (discount rate, energy cost escalation rate, mortgage terms, if any, etc.) and your building costs (construction cost, annual operating cost, and annual maintenance cost). To have access to the procedure, you MUST define the LCC criteria SUHFLVHO\, together with a SUHFLVH definition of the sub criteria. The foolproof way to set this up is to make LCC the first criteria by clicking the 'HIDXOWEXWWRQ to the right in the ILUVW Criteria dialog box. 'RQRWHGLWDQ\RIWKHQDPHV. The present value of the life-cycle cost, LCC, is the sum of three terms: LCC = D (construction cost) + E (annual energy cost) + F(annual maintenance cost) The construction cost includes the cost of adding features to the building, compared with a typical building of the same size and type in the same location. Although the construction cost may be higher for a sustainable building than for a typical building, the annual operating cost will be lower, likely resulting in a lower LCC. The three coefficients, DEandF are calculated using standard life-cycle cost equations. The process of multiplying the weights by the costs and summing the three terms is carried out in the worksheet arithmetic. So at this point all that is needed are the three coefficients. The LCC for each building is calculated later in the building worksheet depending on the three costs that have been entered for that building. 0&'0 calculates the three coefficients for you based on your financial parameters. 7KLVLV/LIH&\FOH&RVWPDGHHDV\ /LIH&\FOH&RVW(TXDWLRQV Nomenclature Tl: life of the building [year] Tm: mortgage period [year] Td: depreciation period [year] Ri: interest rate [%] Rd: discount rate [%] Rdp: down payment percentage [%] Rtax: incremental tax rate [%] Rop: increasing rate of annual operating cost [%] Rmt: increasing rate of annual maintenance cost [%] SAL: (salvage value) / (construction cost) [ND] AOC: annual operating cost [monetary unit] AMC: annual maintenance cost [monetary unit] AP: annual payment [monetary unit] CC: construction cost [monetary unit] CCt: construction cost considering mortgage [monetary unit] Dep: depreciation profit on tax [monetary unit] LCC: Life Cycle Cost [monetary unit] 0&'0 User Manual Page 28 MV: mortgage value [monetary unit] Payoff: payoff [monetary unit] SV: salvage value [monetary unit] TD: tax deduction [monetary unit] Present worth of Life Cycle Cost can be described as followings. LCC= D *CC + E * AOC + F * AMC …(1) D =CCt-SV-Dep/CC …(2) MV=CC*(1-Rdp/100) …(3) Tm Tm AP=MV*Ri/100*(1+Ri/100) /{(1+Ri/100) -1} …(4) If Tl>Tm then, CCt=CC*Rdp/100+ SAP/(1+Rd/100)i - TD …(5) where S means a summation from i=0 to Tm-1. TD can be derived from following arithmetic calculation. TD=SCC*TDi …(6) Where S means a summation from i=0 to Tm-1. i=0 Bl0=1-Rdp/100 TD0= Bl0*Ri/100*Rtax/100 i=1 Bl1= Bl0*(1+Ri/100)-AP/CC TD1= Bl1*Ri/100*Rtax/100/(1+Rd/100)i i=k Blk= Blk-1*(1+Ri/100)-AP/CC TDk= Blk*Ri/100*Rtax/100/(1+Rd/100)i If Tl<Tm then, CCt=CC*Rdp/100 + SAP/(1+Rd/100)i - TD+Payoff/(1+Rd/100)Tl …(7) where S means a summation from i=0 to Tl-1. TD can be derived from following arithmetic calculation. TD=SCC*TDi …(8) Where S means a summation from i=0 to Tl-1. i=0 Bl0=1-Rdp/100 TD0= Bl0*Ri/100*Rtax/100 i=1 Bl1= Bl0*(1+Ri/100)-AP/CC TD1= Bl1*Ri/100*Rtax/100/(1+Rd/100)i i=k Blk= Blk-1*(1+Ri/100)-AP/CC TDk= Blk*Ri/100*Rtax/100/(1+Rd/100)i Payoff=MV*(1+Ri/100)Tl-AP*{(1+Ri/100)Tl-1}/{Ri/100} …(9) SV=CC*SAL/(1+Rd/100)Tl-1 Dep=CC/Td*Rtax/100*D D=SDi …(12) Where S means a summation from i=0 to Td-1. i=0 sr0=1 D0= 1 i=1 sr1= sr0/(1+Rd/100) D1= sr1 …(10) …(11) 0&'0 User Manual i=k Page 29 sr1= srk-1/(1+Rd/100) Dk= srk E=S{(1+Rop/100)i*(1-Rtax/100)/(1+Rd/100)i} F=S{(1+Rmt/100)i*(1-Rtax/100)/(1+Rd/100)i} Where S means a summation from i=0 to Tl-1. … (13) … (14) $SSHQGL['9DOXHVDQG6FRUHV Two terms are used in MCDM-23, 9DOXH and 6FRUH. It is important to understand the distinction. 9DOXH is a raw result. It can be a number, such as the 125 kWh/m2 annual energy use, or it can be a phrase, such as "better than average". 6FRUH is a converted result, converted using the value table for the sub criterion. Scores are on a fixed scale from 4 to 10, where a 4 means marginally acceptable and a 10 means maximum reasonably attainable. The user sets up the measurement scales for each of the sub criteria. In a value table for a quantitative sub criterion, such as annual energy use, the value table may equate 300 kWh/m2 to a score of 4 and 80 kWh/m2 to a score of 10. Intermediate values would equate to intermediate scores. For example, an annual energy use of 125 kWh/m2 might equate to a score of 7. As in this example, a smaller value may yield a larger score. Measurement scales need not be linear but they must be monotonic. In a value table for a qualitative sub criterion, such as architectural quality, the value table may equate the phrases “ ordinary” to a score of 4, "just plain ugly" to a score of 5, and "definitely in line for an architectural award" to a score of 10. Intermediate descriptors would equate to intermediate scores. For example, a consensus of "better than average" of might equate to a score of 7. Having converted all values into scores, it is then possible to compare disparate criteria, such as annual energy use and architectural quality on a equal footing. What was originally an apples and oranges comparison becomes an apples and apples comparison. In the world of scores, bigger is always better. Not all scores need have equal significance. Weights are introduced to indicate the relative importance of one criteria against another. A larger weight indicates a greater importance. It is through the definition of measurement scales and weights that participants define the scales of each sub criteria and the importances of each sub criterion within a main criteria and the importances of different main criteria relative to one another. MCDM-23 provides a simple way for users to define measurement scales and two methods of voting for determining weights, taking into account the preferences of all participants. 0&'0 User Manual Page 30 $SSHQGL[(([DPSOHVRI%DOORWVIRU9RWLQJ3UHIHUHQFHV/HDGLQJWR:HLJKWV [two cases, one Grading, one AHP]