1
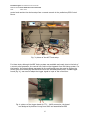
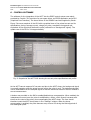
Document Type
EDMS ID Number
Add reference
Date
9 Nov. 2012
A technical report on the:
Implementation and test results of a Beam Current Monitor
prototype with a Bergoz ACCT
BCM iweek (15-19 April 2013)
Authors
Reviewers
Approver
Name
Hooman Hassanzadegan
Andreas Jansson
Andreas Jansson
Affiliation
ESS
ESS
ESS
European Spallation Source ESS AB
Home institute
Home adress
Home City
Home country
www.esss.se
Document TypeError! Reference source not found.
EDMS ID Number Error! Reference source not found.
Date
9 Nov. 2012
DOCUMENT REVISION HISTORY
Version
1.0
Reason for revision
Original
Date
24 May 2013
2
Document TypeError! Reference source not found.
EDMS ID Number Error! Reference source not found.
Date
9 Nov. 2012
1. INTRODUTION
The ESS Linac will include in total about 20 Beam Current Monitors (BCMs). These devices
are primarily used to measure the beam current and charge, but they will also provide input
for the MPS (Machine Protection System) and may also be used for the synchronization of
the target wheel to the beam arrival time [1].
It is planned to install most of the BCMs in the low energy end of the Linac (i.e. from the
source to the DTL) where there are fewer BLMs (Beam Loss Monitors). In addition to the
absolute current measurement, these BCMs will be used to measure the differential beam
current (i.e. current difference between two subsequent BCMs) and act on the BIS (Beam
Interlock System) if beam losses exceed certain thresholds.
It is planned to use commercial ACCTs (AC Current Transformers) for most of the BCMs.
These devices can be used to measure the pulse profile with a measurement rise/fall time of
a few hundred ns. In addition to the ACCTs, it is planned to use a few FCTs (Fast Current
Transformers) wherever shorter response times are required. The FCT has a bandwidth in
the order of a few GHz and can be used, for example, to measure the performance of the
MEBT (Medium Energy Beam Transport) choppers with a very short pulse rise/fall time.
2. ACCT OPERATING PRINCIPLE
The ACCT is basically a high permeability toroid core with about 10-100 winding turns. The
ACCT is mounted on the beam pipe at a location where the beam current has to be
measured. The beam goes through the ACCT and generates a voltage across the windings
(similar to a one-turn primary winding). This voltage basically has the same profile as the
beam pulse, but it does not include the very fast beam variations due to its limited
bandwidth. For example, one cannot normally see the individual bunches, but just the
envelope of the beam current. Also, there will be a droop of a few % per ms during the
pulse flat top. This is because the ACCT lower cut-off frequency normally goes down to a
few Hz but does not include 0 Hz. Therefore the ACCT cannot measure DC currents.
The output voltage of the ACCT is then transferred by some cables to the analogue ACCT
electronics, where the signal is filtered and conditioned. This electronics is normally supplied
by the toroid manufacturer and it is installed out of tunnel to minimize the risk of damage
due to excessive radiation from the beam. The output signal of the electronics can then be
seen on an oscilloscope or a voltmeter (in case of CW beams).
At ESS, it is planned to integrate the BCMs into the ICS (Integrated Control System).
Therefore, the analogue signal from the ACCT electronics has to be digitized, processed and
sent to the user interface via the control network as described in the following sections.
3
Document TypeError! Reference source not found.
EDMS ID Number Error! Reference source not found.
Date
9 Nov. 2012
3. THE BERGOZ ACCT
Figure 1 shows a picture of the Bergoz ACCT and its associated electronics, which were used
for the tests.
Fig. 1: the Bergoz ACCT (left) and its electronics (right)
Table 1 summarizes the main technical specifications of the ACCT [2]:
Table 1: Main specifications of the Bergoz ACCT
Input current
±100
mA
Sensor: BNO (bipolar BNC)
Connectors
Electronics input: BNO
Electronics output: BNC
Output full scale
±5
V
Lower -3 dB cutoff freq.
3
Hz
Upper -3 dB cutoff freq.
1
MHz
Droop
<2
%/ms
Slew rate
2
V/µs
Output offset
0.5
mV (MAX)
Noise at 100 mA full scale
< 20
µA (RMS)
Power Supply
±5, 100
V, mA
4
Document TypeError! Reference source not found.
EDMS ID Number Error! Reference source not found.
Date
9 Nov. 2012
4. CONTROL BOX AND DATA ACQUISITION ELECTRONICS
A demo MTCA.4 control box (see Figure 2) was used for the ACCT tests. The control box
consists of the following items [3]:
-
019 chassis from Schroff (including a power supply unit)
NAT MCH
GEN2 CPU unit from CONCURRENT TECNOLOGIES
SIS8300 digitizer card from Struck
SIS8900 RTM from Struck
In order to be able to properly measure the ACCT signal, channel 5 and channel 6 of the
data acquisition electronics were configured for DC coupling (by default, all the 10 input
channels were AC coupled). This was done by de-soldering and soldering some 0 Ohm
resistor bridges on both the SIS8300 and SIS8900 cards.
The clock source of the SIS8300 card was set to ‘internal’ with a clock frequency of 88 MHz.
The frequency was chosen to be equal to the planned data acquisition clock from the MRF
(Micro Research Finland) timing system.
Fig. 2: picture of the demo MTCA.4 control box and the hosted modules
5.
ACCT TEST SETUP
Figure 3 shows a picture of the ACCT test setup. The oscilloscope, which was used for these
tests, has a waveform generator port. This port was primarily used to generate a 2.86 ms
rectangular pulse with an amplitude of 3.6 V across a 146 Ohm resistor, thus generating a
current pulse of 24 mA for the ACCT. Later on, the oscilloscope was replaced with a
waveform generator generating the rectangular pulse for the ACCT. The output signal of the
ACCT, after being filtered and conditioned by the Bergoz electronics was fed into the fifth
channel of the RTM and then sampled and digitized by the Struck SIS8300 card hosted by
the MTCA.4 system. The control box was connected to the ESS EPICS control system
through its drivers and an EPICS application, thus providing the user with a possibility to
5
Document TypeError! Reference source not found.
EDMS ID Number Error! Reference source not found.
Date
9 Nov. 2012
control and monitor the whole setup from a remote console in the preliminary ESS Control
Room.
Fig. 3: picture of the ACCT test setup
For these tests, although the MRF timing system was available and ready, due to the lack of
a current pulse generator, the control box could not be triggered from the timing system. For
that reason, the pulsed voltage generated by the oscilloscope was also used to trigger the
control box, thus identifying the start and end of the simulated beam pulse. A small trigger
board (Fig. 4), was used to adapt the trigger signal to input of the control box.
Fig. 4: picture of the trigger board for TTL – LVDS conversion; the board
was designed by Andrew Young form SLAC and assembled at ESS
6
Document TypeError! Reference source not found.
EDMS ID Number Error! Reference source not found.
Date
9 Nov. 2012
6. CONTROL SOFTWARE
The software for the integration of the ACCT into the EPICS control system was mainly
provided by Cosylab. This consists of a user-space driver, an EPICS application and a GUI
(Graphical User Interface). The kernel driver of the SIS8300 card was supplied by Struck.
Figure 5 shows a snapshot of the GUI with a graphical view of the pulsed current and its
specifications, being: average current, charge per pulse, cumulative charge and mAequivalent of the signal level before the pulse (referred to as “background” signal). The
update rate of the GUI is 2 Hz approximately.
Fig. 5: Snapshot of the ACCT GUI showing the current pulse specifications and profile
As the ACCT cannot measure DC currents and due to the ACCT droop, the background signal
is normally negative while the actual current before the pulse is zero. The background signal
is then subtracted from the sampled signal so that the monitored value on the GUI reflects a
correct measurement.
A button was provided on the GUI to enable/disable droop compensation. When enabled, the
instantaneous current over the pulse is multiplied by a factor, which linearly increases with
time from the start of the pulse, thus compensating the ACCT droop. The user should
therefore insert the ACCT droop factor in the “Settings” window. When the droop
compensation is enabled, the pulse becomes very close to DC during the flat-top period of
the rectangular pulse.
7
Document TypeError! Reference source not found.
EDMS ID Number Error! Reference source not found.
Date
9 Nov. 2012
Other options provided on the GUI include a moving window averaging (with adjustable
length) for the pulse profile and the average current measurement, zoom in/out and save
options for the graph and a manual/auto re-arm mechanism for the data acquisition.
7. TEST RESULTS BEFORE CONNECTION TO THE CONTROL BOX
The test results of the ACCT before its connection to the Control Box were reported in [4].
The results were promising and in all cases consistent with the ACCT datasheet [2].
8. TEST RESULTS AFTER CONNECTION TO THE CONTROL BOX
The ACCT system was continuously put into operation during a period of one month
approximately. The read-back signals were checked from time to time on the GUI with the
aim of identifying any malfunctioning of the ACCT hardware, the control box or the control
software. The system worked as expected and no problems were seen during this period.
9. FUTURE WORKS/IMPROVEMENTS
With the current version of the GUI, a moving average filter is applied to the pulse waveform
to reduce noise. As a result of this, the rising and falling edges of the pulse always are very
close to straight lines with a slope depending on the width of the averaging window. While
the moving average filter seems to be a good option for the average current measurement
(numerical value) its effect on the pulse shape may not be desired, as it does not give any
useful information to the end user. The main aim of the pulse waveform is to provide the
user with the possibility to the check the shape of the pulse, for example the rising and
falling edges for any unexpected beam behaviour. For that reason, it is planned to use
another filtering method (ex. a low pass FIR filter) for the waveform. The filter bandwidth
can then be set so that on one hand the user sees a nearly-real pulse shape (within the
measurement bandwidth) and on the other hand reduce noise to a desired level.
Also, it is planned to trigger the Struck SIS8300 using the MRF system (currently, it is
triggered with the input signal of the ACCT). Although this is not expected to have any effect
on the on-going measurements, it will resemble the final setup more closely; hence it could
be useful for identifying and removing any potential problems.
The BCM system will be one the first beam diagnostic subsystems to be used in the Linac.
One of its main functionalities is to measure differential beam currents and act on the BIS
(Beam Interlock System) if beam losses are too high. For that purpose, the read-back signal
from two or more BCMs have to be compared with each other and appropriate alarm/fault
signals have to be sent to the GUI/MPS if the difference exceeds some user-defined
thresholds. As the reaction time for the differential current measurement should be in order
of a few µs, it cannot be implemented in the control software. Therefore it is planned to
transfer that part of the processing to the low-level electronics (i.e. the FPGA). Also, it might
8
Document TypeError! Reference source not found.
EDMS ID Number Error! Reference source not found.
Date
9 Nov. 2012
be useful to add some more custom-code to the FPGA firmware; for example a digital low
pass filter acting on the acquired samples for noise reduction purposes before sending the
samples to the control software. The source code of the FPGA firmware (VHDL) has been
provided by the manufacturer. It is planned to first understand the code and later modify it
to implement these additional functionalities.
Also, the option of connecting the BCM system to the data logging will be studied. The raw
(or slightly processed) ADC data will then be saved in a database and could later on be
retrieved upon a user request. This could be a useful option to make a history of the data
thus evaluating the long-term behaviour of the BCM system.
10. REFERENCES
[1] ESS Technical Design Report, 13 Nov. 2012
[2] Bergoz Instrumentation, AC Current Transformer User’s Manual
[3] H. Hassanzadegan, A technical report on the EPICS integration and preliminary results of
the demo BPM MTCA.4 system, ESS internal report, 9 Nov. 2012
[4] H. Hassanzadegan, Test results with the Prototype Bergoz ACCT, ESS Internal Report, 14
Dec. 2012
9
Document TypeError! Reference source not found.
EDMS ID Number Error! Reference source not found.
Date
9 Nov. 2012
Annex - 1