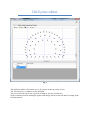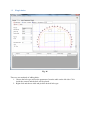
1
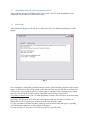
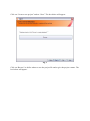
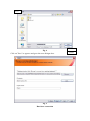
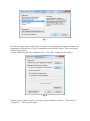
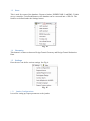
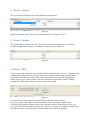
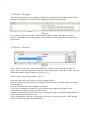
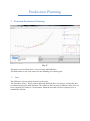
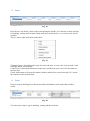
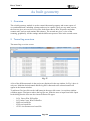
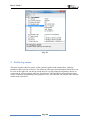
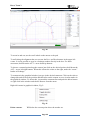
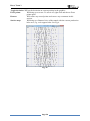
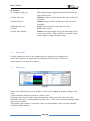
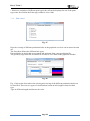
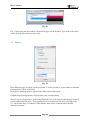
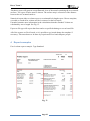
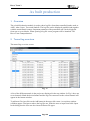
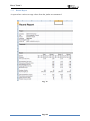
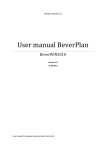
Bever Team 3 User Manual Bever Team 3 Operators Manual Copyright 2009-2010 Bever Control AS. All rights reserved This document is being furnished by Bever Control AS for information purposes only to licensed users of the Bever Team product and is furnished on an “AS IS” basis, that is, without any warranties, whatsoever, expressed or implied. Bever Team is service mark and registered trademark of Bever Control AS. Other brand and product names are trademarks or registered trademarks of the respective holders. Microsoft is a registered trademark and Windows, Windows XP, Windows Vista, Windows 7, the Windows logo, and the Windows XP/Vista/7 logo are registered trademarks of the Microsoft Corporation. Acrobat Reader and the Acrobat logo are registered trademarks of Adobe Systems Incorporated. Information in this document is subject to change without notice and does not represent a commitment on the part of Bever Control AS. The software described in this document is furnished under a license agreement. The software may be used only in accordance with the terms of that license agreement. It is against the law to copy or use the software except as specifically allowed in the license. No part of this document may be reproduced or retransmitted in any form or by any means, whether electronically or mechanically, including, but not limited to the way of: photocopying, recording, or information recording and retrieval systems, without the written permission of Bever Control AS. Bever Team 3 Operators Manual Written by Bever Control AS Initial publishing in Norwegian May 2009 Updated May 2010 Document No. BT3-1 Revision A Printed in Norway Address: Telephone: Telefax: E-mail: Web-address: Bever Control AS +47 32 85 89 60 +47 32 85 89 61 [email protected] http://www.bevercontrol.com/ Gunnersbraatan 2 P.O. Box 20 N-3421 Lierskogen NORWAY Content 1 2 3 What is Bever Team ........................................................................................................... 5 Definitions .......................................................................................................................... 5 Installation .......................................................................................................................... 5 3.1 Instalation with XP OS and service pack 3 ................................................................ 6 3.2 Licensing .................................................................................................................... 6 4 Main screen ........................................................................................................................ 7 5 Make a new project ............................................................................................................ 7 5.1 Advanced connection ............................................................................................... 10 1 The Menu ......................................................................................................................... 15 1.1 Submit to database ................................................................................................... 15 1.2 Open ......................................................................................................................... 15 1.3 Save .......................................................................................................................... 16 1.4 Geometry .................................................................................................................. 16 1.5 Settings ..................................................................................................................... 16 1.5.1 Jumbo Configurations .......................................................................................... 16 1.5.2 Request license ..................................................................................................... 17 1.5.3 Update/Register License ...................................................................................... 17 1.5.4 Point types: Design ............................................................................................... 17 1.5.5 Contour Layers ..................................................................................................... 17 1.5.6 Auto drill plans for Win2000 jumbos .................................................................. 18 1.5.7 Change language .................................................................................................. 18 1.5.8 Report: Contour surface ....................................................................................... 18 1.6 Help .......................................................................................................................... 19 1.7 ”Easter Egg” ............................................................................................................. 19 2 The Screen ........................................................................................................................ 20 3 A geometric minimum – how to create a quick tunnel .................................................... 21 4 Sheets - overview ............................................................................................................. 23 5 Sheet - Tunnels ................................................................................................................. 24 5.1 The columns ............................................................................................................. 24 6 Sheet - Line ...................................................................................................................... 24 7 Sheet - Horizontal............................................................................................................. 25 8 Sheet - Vertical ................................................................................................................. 26 9 Sheet - Camber ................................................................................................................. 26 10 Sheet - VIPS ..................................................................................................................... 26 11 Sheet - Changes ................................................................................................................ 27 12 Sheet - Contour................................................................................................................. 27 1 Overview Production Planning ........................................................................................ 30 1.1 Face .......................................................................................................................... 30 1.2 Laser ......................................................................................................................... 31 1.3 Point ......................................................................................................................... 31 1.4 Drill Plan .................................................................................................................. 32 1 Drill plan .......................................................................................................................... 35 1.1 Create helper lines .................................................................................................... 35 1.2 Create holes on a line ............................................................................................... 36 1.3 Single holes .............................................................................................................. 37 1.4 Read hole group ....................................................................................................... 38 1.5 Select holes ............................................................................................................... 39 1.6 Sequence and rotation .............................................................................................. 40 1.7 Automatic generated drill plan ................................................................................. 41 1 2 3 4 1 2 3 1 2 1.8 Operations in the table.............................................................................................. 42 1.9 Ignitor ....................................................................................................................... 43 1.10 Ignitor Groups .......................................................................................................... 44 1.11 Charge plan .............................................................................................................. 45 Overview .......................................................................................................................... 46 Tunnel log overview ......................................................................................................... 46 Profile log viewer ............................................................................................................. 48 3.1 Tools ......................................................................................................................... 51 3.1.1 Settings ................................................................................................................. 52 3.1.2 Recalculate ........................................................................................................... 54 3.1.3 Point types ............................................................................................................ 54 3.1.4 Hole colors ........................................................................................................... 55 3.2 Report ....................................................................................................................... 56 Report examples ............................................................................................................... 57 4.1 HEADING ................................................................................................................ 58 4.2 LEFT SIDE (theoretical values) ............................................................................... 58 4.3 RIGHT SIDE (Measured values) ............................................................................. 58 Overview .......................................................................................................................... 60 Tunnel log overview ......................................................................................................... 60 2.1 Report ....................................................................................................................... 61 2.1.1 PE-Bolt Report ..................................................................................................... 62 2.1.2 Round Report ....................................................................................................... 63 2.2 Summary .................................................................................................................. 64 TunnProduction ................................................................................................................ 65 3.1 Main Screen .............................................................................................................. 65 3.2 Menus ....................................................................................................................... 66 3.3 Tool bar .................................................................................................................... 67 3.4 Sheets ....................................................................................................................... 68 3.4.1 Drillpattern ........................................................................................................... 68 3.4.2 Bolts ..................................................................................................................... 69 3.4.3 Single hole ............................................................................................................ 70 3.4.4 Multi hole ............................................................................................................. 71 3.4.5 Development ........................................................................................................ 72 3.4.6 Drillpattern 3D ..................................................................................................... 73 3.4.7 Linear ................................................................................................................... 74 3.4.8 Collar surface ....................................................................................................... 75 3.4.9 Linear surface ....................................................................................................... 76 3.5 Settings ..................................................................................................................... 77 3.6 Miscellaneous ........................................................................................................... 79 3.6.1 Sequence............................................................................................................... 79 3.6.2 Area calculation .................................................................................................... 80 3.6.3 Number of drillholes ............................................................................................ 80 Windows XP .................................................................................................................... 81 Windows 7 / Vista ............................................................................................................ 81 Bever Team 3 Main 1 What is Bever Team Bever Team is a program that is used for planning and documentation in tunneling. The program is used by contractors, consultants and clients that need access to project data and as built data. The database is based on standard SQL. 2 Definitions Tunnel line Center line or Aligment. The line witch the tunnel is built around. Defines the horizontal curve of the tunnel. Contour Cross section. Describes the cross section on a given chainage number on the tunnel line. Road model A digital model from client/consultant that can be read directly into the program. Drill plan A planned drill pattern which can be transferred to a jumbo. Drill log A log from a jumbo. Gives data on as built drilling. Placing on the face, MWD, water flow, pressure and so on… Profiler log Points measured with Bever Profiler 3D, scanner or a total station. Fixed points Reference points in the tunnel. Used to navigate a jumbo or a profiler. Memory stick Movable media (USB). It is used to import/export data on a jumbo. XML Normal file format on the import/export data. Can also be a contour definition file from Novapoint tunnel. SQL Standardized database solution. Here defined as the name of the database, like; XXX.mdf (SQL server Master Database Fil). 3 Installation Bever Team is installed by inserting the CD. If it is not, use explorer and double click on the setup.exe file. After the installation is done start the program by opening the “Bever Control” folder on the desktop. Double click on the Bever Team 3 icon: 3.1 Instalation with XP OS and service pack 3 There could be an issue with Microsoft`s sevice pack 3 for XP. If the installation is not completed, contact Bever Control AS for help. 3.2 Licensing After startup the program will ask for a valid license file. The following dialogue box will appear: Fig. 1 If the computer is connected to internet this box can be closed and the program can be started again. A valid license file will be found on the internet. This license will last for at least four weeks before the program needs to go online again to validate. If the computer is not online then copy the text from this box into an email and send it to Bever Control AS. ([email protected]). If it is a valid installation a license file will arrive in an email after a short while. Important: The ID needs to be from the local Ethernet card and not from a wireless or Bluetooth card. It is easiest to be connected to the internet with a cable. It is also possible to find the ID (MAC address) from cmd. Run cmd and type in “ipconfig /all” Then all the addresses on the machine will appear. It is not necessary to save the received license file on a specific place. . 4 Main screen Fig. 2 Main screen. First time starters will notice that it is only the two first choices in the menu that are active. 5 Make a new project A project in Bever Team is a collection of planned data and as built data. It is not defined just how much data the project contain. It can be a total project with many tunnels or just a small niche inside a tunnel. It is up to each user to define the complexity and size of each project. Click on “Create a new project” and on “Next”. The box below will appear: Fig. 3 Click on “Browse” to define where to save the project file and to give the project a name. The box below will appear: Save as Fig. 4 Click on ”Save” to approve and go to the next dialogue box: Fig. 5 Data base connection Save Cancel On the fig. 5 box, click on the “Browse” button to address the database correctly. The following box will appear: Fig. 6 If it is the first time the program is being used the list will be empty. Each database will however be on the list after creation. Data base can be deleted by graying out the whole row and push the delete button. Normally the user chooses “New std. connection…” then a new window will open and here the user must find the database file made in a previous step. (Database.MDF). Click on “Open” and the program will return to Fig. 5, database connection. Now the user can type in company name and a project name. By clicking on the “Logo” button can a company logo be referred to. This logo will then appear in all the reports made in the program. The logo picture should be about 1,5 cm high and 4,2 cm in width to fit ok in the reports. Recommended format is .bmp. 5.1 Advanced connection If ”New adv. Connection…” is chosen every connection to the database needs to be configured manually. The first dialogue box to appear is this: Fig. 7 Here the user must choose witch SQL server that is to be used with the program and data base management. With the Bever Team 3 installation is the MS SQL Express. This is used in the following instructions. Choose ”Microsoft SQL Server Database File”. Click ”OK” and the next box will be: Fig. 8 Find the project .mdf file made in a previous step by clicking on ”Browse”. Then click on ”Advanced…”. This box will appear: Fig. 9 ”Data Source” must be set to SQLEXPRESS. Click on ”OK”. The ”Connection Properties” box (Fig. 8) will appear and the next step is to test the connection. This is done by clicking on the ”Test Connection” button. The following box should appear: Fig. 10 Click on “OK” twice and the main screen will appear: Fig. 11 Main screen. The whole menu should now be active. To open an existing database file (.MDF) the user must mark ”Manage an existing project” in the main menu. Then the steps from Fig. 5 must be done. When an already existing project is opened it is necessary to load all the log files into the database again. If it is a project with a digital road model this must be referred to again as well. Note! If the database is on a network it is necessary to do a little change in the registry. The procedure to do this is described in a text file on the installation CD. Note! Only highly trained IT personnel should do this! Design Tunnel Geometry Designing the tunnel geometry is where one or more tunnels are defined. Both with a horizontal and a vertical alignment. And onto the alignment there has to be contours connected to it. A tunnel must always be defined with an alignment and one or more contours. Main screen in Design Tunnel Geometry: Fig. 12 1 The Menu The menu is the same in Design Geometry and Design Tunnel Production Data. Here the user can find settings for export to jumbo, name of layers in the contour, import of XML files and etc. Fig. 13 1.1 Submit to database This button will save all the changes done in the database. 1.2 Open This is used for opening an already existing Bever Team 2 project or an XML file. The Bever Team 2 project and the XML file can both contain an alignment and contours. 1.3 Save This is used for export of the database. Export to Jumbos, IREDES XML, LandXML, Trimble survey controller, Leica Road Runner or the database can be converted into a .ZIP file. The Jumbos are defined under the Settings button. Fig. 14 1.4 Geometry This button is a short cut between Design Tunnel Geometry and Design Tunnel Production Data. 1.5 Settings Here the user can define various settings. See Fig. 4. Fig. 15 1.5.1 Jumbo Configurations Is used for setting up export parameters to the jumbos. Fig. 16 Configuration name: Name of the Jumbo/configuration. Path to media: Choose the path to the memory stick to use. Type of jumbo: Defines the data format to the jumbo. Pack/Zip: Used to Zip the project for wireless transfer of data. 1.5.2 Request license To be used when in need of a new license file. 1.5.3 Update/Register License Is used to activate a received and valid license file. 1.5.4 Point types: Design This is used to define different point types that can be used on the jumbo. These values are used in the Design Tunnel Production Data module. Fig. 17 1.5.5 Contour Layers Here the different layers in the contour can be defined. Layer number, name, visibility, if camber is to be used and color on the layers. Fig. 18 1.5.6 Auto drill plans for Win2000 jumbos Is used to create an automatically generated drill plans for old versions of the Bever Control system on the jumbo. There is a user guide from Bever Control which can be purchased for this feature. Fig. 19 1.5.7 Change language Change language. 1.5.8 Report: Contour surface Used to create a report from the theoretical contour surface. This report is only possible with MS Visio. A typical report can be as shown in Fig.9 Fig. 20 1.6 Help This will open a PDF document with some relevant help. 1.7 ”Easter Egg” Visual Earth, depended on datum, has to be WGS-84/UTM 2 The Screen The screen is divided in five separate parts. See Fig. 10 for an over view. Vertical Alignment Horizontal Alignment Camber Contour Table Fig. 21 By using the scroll wheel on the mouse it is possible to zoom in and out on the horizontal alignment. Click and press down the left mouse button to pan on the horizontal alignment. By clicking on the pin in the upper right corner can the box be minimized. Maximize with the same function. See Fig. 11. Fig. 22 3 A geometric minimum – how to create a quick tunnel To make a quick test project it is enough to have a line and a contour. The easiest way to do this is first to define a tunnel. This is done by giving the tunnel a name, for type, choose point line. After this is done click on the Line sheet. The picture in Fig. 12 will appear. Punch in some easy values on the northing and easting and the simple alignment are all done. Fig. 23 The next step will then be to create a contour.. Click on the Contour sheet. Type in a Chainage, should be on the alignment somewhere. Then type in a description. After that, click on the Edit button. Then the contour editor will come up. In the contour editor there are several ways to enter a contour. In this case we choose the General – XYR. Then type in some values. Fig. 13 gives an example on values. Fig. 24 Go out of the contour editor and push the Submit to database button. 4 Sheets - overview The different elements in the design are available in the sheets in the lower left corner. They can vary if it is different type of alignments that are in use. Point line, Parametric or VIPS. In Fig. 11 it`s shown with a Parametric line. 5 Sheet - Tunnels A tunnel can be one of many in a project. On each tunnel there can be contours, points, lasers and as built data. To get up a menu in the tunnel table, just right click with the mouse. Save: Saves the tunnel line into Atlas tunnel line (tl8), Bever Win 2000 line (tli) or Bever Org line (tli). Control: To control northing, easting, height and camber on the alignment. 5.1 The columns Name – The name of the tunnel or alignment Type – Here the user can choose between Point Line, Parametric or VIPS. Delta – Gives the length between each point created on the alignment for the jumbo export. With steep curves it can be useful to put this to maybe 1 or 2 meter. Default value is 5 meters. If the tunnel consists of a point line then the next sheet will be Line. If it consist of a parametric line then there will be three new sheets, Horizontal, Vertical and Camber. If the tunnel is defined as VIPS then there will also be in addition to the ones mentioned above a sheet named Changes and a sheet named VIPS. 6 Sheet - Line Fig. 25 A point line is defined with a series of points containing chainage, northing, easting, up (elevation) and camber at each point. These values can either be typed directly in the table or be imported on .TLI (Bever Control), .TL8 (Atlas Copco) or Iredes.XML formats. When right clicking in the table a menu will appear. Fig 15. Open will bring the user to the import dialog box. It`s also possible to extend a line or find a point on the line by typing in a new chainage value in the bottom of the table. Right click and choose Suggest coordinates and the program will interpolate or extend. Check delta pel will control if there are any differences between the chainage values and the coordinates. It is also possible to right click on the header over each column. Fig. 26 7 Sheet - Horizontal When having a parametric line as alignment the Line sheet will be switched with three new ones. The first is the Horizontal. Fig. 27 It shows the Horizontal alignment in the tunnel with chainage, northing, easting, radius start, radius end and clotoides. Right click in the table and the menu in Fig. 17 will appear. Fig. 28 8 Sheet - Vertical The vertical sheet will show the vertical alignment in the tunnel. Fig. 29 Right click and the same menu as on the horizontal sheet will appear. Fig.17. 9 Sheet - Camber The Camber sheet will show the “tilt” of the tunnel around the alignment. It`s even here possible to right click and get up a small menu with copy, paste and so on. Fig. 30 10 Sheet - VIPS Vips is a total road model that can be imported directly into the Bever Team 3. Together with a digital tunnel model the user can get a total project which contains all the data needed to start making drill plans. To read a Vips project the model files are needed. Including the tunnel geometry file. If the geometry file is not included it is possible to make a dummy structure file. That must be done in order to export survey data. Fig. 31 Load in the Vips and the tunnel structure file by pushing the browse button. Beware to get the right camber values from the model by choosing the right surface. Clear will reset. Dummy structure will create a dummy structure a parameter will give an overview of the tunnel length were there are structure, or contours. If marking the show layers the different layers in the road model will be turned on and off in the graphics. 11 Sheet - Changes This shows the changes in the geometry of both the road model and the tunnel model. This is defined by chainage and a code for what is happening at the actual chainage. Fig. 32 It`s even here a right click menu. The most used features in that is the update selection. If a new road model is read in the update feature should be used on all sheets containing one in the menu. 12 Sheet - Contour Fig. 33 This is where the contours will be connected to the alignment and where the contours are made. Type in chainage and give the contour a name (description). After this is done, click the Edit button and the contour editor will open. Fig. 24. There is also a right click menu here. Fig. 23. Here copy and paste can be used as well as deleting contours. Send To and Get From are basically sending the actual contour to a library and get a contour from the library. Choose File and an open/save dialogue will appear. If you are at a chainage between two known contours the program can suggest a new interpolated one with the suggest contour election. Suggest interpolation will try to find a way to arrange the points in a contour automatically for correct interpolation between the two. Check interpolation will open up the profiler log viewer so that the user can “walk” through the tunnel and control the interpolation done. Fig. 34 There are several types of making a contour. In the roll down menu there are: General – XYR, Input data by typing or cut and paste. X and Y relative to the tunnel alignment, which is shown as a small round marker in the grid. R is the radius. General – Angle, input as the previous but with angles as well. Open/Save File, an existing one can be opened or the one in play can be saved. In .tl2 and XML format. Standard, here a standard from the Norwegian tunneling handbook can be chosen and inserted. Graphical, Here a contour can be drawn directly into the grid by clicking the mouse. It is possible to zoom in and out by using the scroll wheel on the mouse. To add or remove layers. Just right click on the layer sheet and choose add or delete. Fig. 35 It is also important to notice that a contour always is defined with the first point in the low left corner and goes clockwise to the end point. The endpoint doesn`t have to be the same as the start point. The program will close the polygon with a straight line. To make a report it is necessary to keep the graphical contour to the left of the thin grey line in the grid. After this is done click the report button and choose Excel or Visio. Any regrets? Hit the Undo button. Right click for a menu like Fig. 24. Here the user can select to copy and paste, add a line, delete lines and scale up or down the whole contour. Fig. 36 Production Planning 1 Overview Production Planning Fig. 37 This part is used to define Faces, Lasers, Points and Drill Plans The Main menu on top is the same as in the Planning of Geometry part. 1.1 Face The difference is in the sheets at the low left corner. The first sheet is Face. This is used to define the different faces in a project, connect the face to a tunnel and give the drill direction. The column to the left (Active) indicates if the face are to be exported to a Jumbo or a Total station. Mark the box and it will be exported, leave it unmarked it will not. 1.2 Laser Fig. 38 Here the user can define a laser used for navigating the Jumbo. Give the laser a name and type in Northing, easting and Elevation. Both at the laser and at the face, or as close to the face as possible. There is also a right click menu in the table. Fig. 39 Chainage range is for limiting the range for where the laser is active, this is given with a start chainage and an end chainage. Control is for a third point measured on the laser, and then the user can see the deviation on the laser line. Check with contour will open the contour window and the laser can be checked if it`s inside the contour for the desired range. 1.3 Point Point is used for defining Fixed Points and other installations in the tunnel that could be useful. Fig. 40 Give the point a name, type in northing, easting and the elevation. Type of points can be defined in the main menu at the top, under Settings and Point Types: Design. If the Alarm is set, the Jumbo operator can get information of the point on the screen in the Jumbo. This is mainly used for trenches, niches and installations that`s not included in the design. The operator will also get the text from the description field. Right click in the table and the following menu will appear: Fig. 41 Open is for importing a file containing points. Save is for saving the point list to a file. Pel is for typing in a point with chainage, distance to alignment and elevation. Report brings up an excel report. Properties give information on the selected point. 1.4 Drill Plan Fig. 42 This is for making drill plans. The activate column to the left defines if the drill plan is to be exported to the Jumbo or not. If active it will be exported. The chainage typed in will define the actual contour for the drill plan. Round Length defines the length of the round and will indicate if it is a blast round, grouting, bolt or probe. The description will be the information the Jumbo operator will see and must be used. To create the drill plan simply press the Edit button. Right click and the following menu will appear: Fig. 43 Send to is used to send the drill plan to a library called favorites. Get from will open the library so that a drill plan can be inserted. Drill plan editor Fig. 1 The drill plan editor will contain two or five sheets at the top of the screen. The first one gives a summary of the drill plan. The user can create a new one, open an existing or save the current one. Setup is mainly used for turning the ignitor and charge sheets on and off and for setting of the hole parameters. 1 Drill plan The drill pattern is defined on this sheet. Use the Select button to create holes, help lines, sequences or an automated drill pattern: 1.1 Create helper lines Fig. 44 Helper lines can be used to create holes on a line. To create a line just left click with the mouse and drag the line to where it should be. After the line is created it is easy to edit the line in the table if it is not in the right place. 1.2 Create holes on a line Fig. 45 First must the line to use be marked. Use left click on the mouse. There are two methods of adding holes. 1. Choose the hole type and set the parameters from the table on the left side. Push the Add button on if pleased push Apply. 2. Right click and choose Add and pick the desired hole type. 1.3 Single holes Fig. 46 There are two methods of adding holes. 1. Choose the hole type and set the parameters from the table on the left side. Click inside the contour and the hole will be placed. 2. Right click and choose Add and pick the desired hole type. Bever Team 3 1.4 Read hole group Fig. 47 Choose Open, find the file and it will be opened. The group of holes can be moved around by typing in coordinates and press the Move button or left clicking with the mouse. Cutting: The group of holes can be cut so that only the holes inside the area will be applied. Mark the Use clipping. Adjust the parameters Page 38 Bever Team 3 1.5 Select holes Fig. 48 Choose method and then mark the desired holes. The marked holes will turn up green on the screen and will also appear in the table. The Help on the left side gives an over view over quick tools. To use the last two quick tools the method has to be “single”. Page 39 Bever Team 3 1.6 Sequence and rotation Fig. 49 Choose the boom for the sequence. When a hole is marked: Hold down the Shift button and the left mouse button to change the rotation. Page 40 Bever Team 3 1.7 Automatic generated drill plan Fig. 50 Load the parameters by choosing Generate. Also choose which parameter set to use and the chainage to put it. The parameters in the excel file can be adjusted to fit the users need: - Choose Edit Excel will start Change the desired values Save the file. Read in the new parameters. Page 41 Bever Team 3 1.8 Operations in the table Table: Fig. 51 There are several ways to change the values in the table: Directly type values in each cell. Right click on the column header to change values on the entire column. Fig. 52 By right clicking in the table the following menu will appear. Here the user can choose to show more columns, delete and copy / paste in the table. Fig. 53 Page 42 Bever Team 3 1.9 Ignitor Fig. 54 Choose method to mark the holes for the ignitors. Type: Ignitor type. View: Delay or ignitor name in the graphics. Report: Makes an excel report with ignitors. Page 43 Bever Team 3 1.10 Ignitor Groups Fig. 55 Choose method to mark the holes for the ignitors. Type: type of delayer. Name: A free given name on the group. Connected to: the connection from this group and to the next. The user must type in several groups in order to get more groups to choose from. View: Group name or total delay for the hole. Report: Makes an excel or Visio report with ignitor groups. Page 44 Bever Team 3 1.11 Charge plan Fig. 56 Choose method to mark the holes for the charge. Type: Different types of charge. Report: Makes an excel report with the actual charge in each marked hole. Standard values used are from Orica. Page 45 Bever Team 3 As built geometry 1 Overview The as built geometry module is used to control the tunnel geometry and create reports of over and underbreak, including volumes and areas in a tunnel. There are two main screens, the first one gives an overview of log files, both from a Bever Win 3D profiler and other scanner units, such as total stations and scanners. The second one gives a view of the scanning, graphically. All the settings and the different reports are also in the second screen. 2 Tunnel log overview The tunnel log overview screen: Fig. 57 A list of the different tunnels in the project are displayed in the top window. In Fig. 1 there is only one. Mark the desired tunnel and the log files connected to the selected tunnel will appear in the bottom window. To add new files just click on the Add button in the upper left corner. An explorer window will then appear. Navigate to where the log files are, mark the ones to import and click Open. In the dialog box the user can also choose different file types. - .LG4 Bever Win 3D Profiler .LG5 Atlas Copco Win 3D Profiler .KOF text based file .PXY text based file .SVY Leica Scanner text based file Page 46 Bever Team 3 The new files will automatically be sorted along the horizontal alignment. It is also possible to click on the header over each column to sort by number of point, date, chainage and so on. To delete log files, mark the ones that should be deleted and press the Delete button on upper left corner. Only the one or ones that is marked will be deleted. If right clicking on a log file the following menu will appear Fig.2: Fig. 58 View – this will open the Profiler log viewer and display all log files. View current – this will open the profiler log viewer and show the current log. Add – this will open the add log files dialog window. Delete – this will delete the marked log file. Send to – this will allow the user to save the log file in another folder. Change type – here the point type code can be changed. Details – this will open the Profiler log viewer. 3D Mesh – this will show the log file in a 3D mesh. Properties – this will show details about the log file, see Fig. 3. Some values are only valid from the Bever Win 3D profiler. Page 47 Bever Team 3 Fig. 59 3 Profile log viewer The main window shows a picture of the contour together with scanned data. Optional production data can also be shown. The different point types and information about these can be seen on the right side. On the top menu the user can step along the alignment, choose to report and do various settings under the Tools button. The field under the graphical display are for comments and marking in the graphical view. Note that this can only be done with the model mode switch off. Page 48 Bever Team 3 Fig. 60 To zoom in and out, use the scroll wheel on the mouse or the pad. To walk along the alignment the user can use the Prev. and Next buttons in the upper left corner. It is also possible to type in a chainage number directly in the box. For faster movement, hold down the ALT + arrow down/up buttons. To choose a scanned point along the contour just click on the desired point or hold down the ALT + arrow left/right buttons. When this is done the values to the right, under the “cursor” header will change. To comment in the graphical window just type in the desired comment. Click on the color to change this and click on the position and thereafter on the contour to set a circular marker in the graphical window. To delete this, just mark the comment line and push the delete button or right click in the window and choose Restore from the menu. Right click menu in graphical window, Fig 5.: Fig. 61 Delete current: Will delete the current point where the marker are. Page 49 Bever Team 3 Toggle deviation: Will set the deviation on current position in the graphics. Erase points: Will bring up an eraser. To turn it off, right click and choose Erase points again. Restore: Will restore any erased points and remove any comments in this session. Surface map: Will bring up a flattened view of the tunnel with the current production holes on it, e.g. rock support bolts. See Fig 6. Fig. 62 Page 50 Bever Team 3 By right clicking on one of the logs in the surface map the Move production holes dialog box will show. Here the production holes can be moved. The whole log or just within a timeframe. Start values will give the actual desired movement and the End values will give the direction. Fig. 63 3.1 Tools Fig. 64 Settings: Recalculate: Various settings for calculations, views, graphics and filters. Must be done after adjusting various settings. Choose between the complete tunnel or a specified length. Point types: Settings for displaying point types. E.g. color. Hole colors: Settings for displaying production data (Drilled holes). Page 51 Bever Team 3 3.1.1 Settings Fig. 65 To change values, type directly in the table. To turn on and off, choose hide or show. 01 General 01 Chainage delta (m) The step length along the alignment. Standard length are 0,5 meters. This will display all the points at the actual chainage ± 0,25 m. If the value is set to 1 meter then all the points ± 0,5 meters will be displayed in the graphics. The program will also use this value when calculating over and underbreak, so it is therefore important to set this as small as possible. 02 Contour layer used… Choose which layer to use in calculations. 03 Print every (profile) If the chainage delta is set to 0,5 meters and a print for every 10 meters is needed this can be set to e.g. 20. 04 Contour radius add (m) Can be used to calculate and display an offset to the current contour layer. Both positive and negative values can be used. 02 View 01 Hidden points To hide or show the points that is outside the values set in the “Filter” dialogue. Page 52 Bever Team 3 02 Estimates 03 Draw line between points 04 Minimum deviation from… 05 Auto scale 06 Maximum deviation… 07 Model 08 Scale 09-10 Screen corrections 11-12 Report corrections 13 Basic mode 03 Filter 01 Maximum distance… This is to turn on/off estimates in calculations. The values is set in the “Estimation” dialogue. Calculations are done between where the estimates are set. Turn on/off lines between the scanned points. Turn on/off a graphical value where the scan is closest to the theoretical surface. For printing. The contour will automatically be fitted in the print window. (The grey square in the graphically view). Turn on/off graphical value where the scan is furthest away from the theoretical surface. This can be used to smoothen the surface on the scan. A triangulated model is made. From the model points and lines will be drawn along the contour with a 50 mm distance between them. No changes can be made and saved in this mode. The standard scale when opening the viewer. Can be used to set a factor to correct the scale on the graphical view on screen. Can be used to set a factor to correct the scale on the printout. Displays only the basic information in the log file. If the distance between two points exceed this value there will not be drawn a line between them. 02 Maximum deviation… All point outside this value will not be used in calculations. They can also be hidden if the “Hidden points” is turned on. 03 Maximum deviation… All point outside this value will not be used in calculations. They can also be hidden if the “Hidden points” is turned on. 04 Average distance for.. A filter. If a value is given here the program will take all the points within the radius and make one point with an average value. Mostly used for large scanner files. > 500 000 points. 04 Estimation 01 Left side length… Where to set the start of the estimated values/calculations. If there are no points where the estimate start the program will take the average deviation and use that value where there are missing points. 02 Right side length… Where to set the end of the estimated values/calculations. If there are no points where the estimate ends the program will take the average deviation and use that value where there are missing points. Page 53 Bever Team 3 05 Surface 01 Length per page (m) 02 Max value (m) 03 Min value (m) 04 Equidistance (m) 05 Scale 06 Max edge distance The length along the alignment that will be printed per page on the report. Outside perimeter. Points outside this value will not be displayed. Inside perimeter. Points outside this value will not be displayed. Steps of color within the max and min value. Scale of the surface. Defines the longest length of a leg in the triangles used to create the surface. There will not be created a surface if the lengths are longer than this value. 3.1.2 Recalculate If major changes are done in the settings menu, the hole types are changed or if some of the log files are deleted then a recalculation must be done. Choose the whole tunnel or a section of the tunnel. 3.1.3 Point types Fig. 66 Name of the different types can be defined. Color can be changed by double clicking on the color. Visible indicates whether the points are visible or not. Point type is the actual coding of the scanned points. If the points don`t have any codes attached to them they will automatically get the code 31. The codes can also be changed in the log overview window. The graphic point symbol is a small dot, if the user want another symbol it can be changed under the Symbol column. Page 54 Bever Team 3 ! If there are a number of different point types they all can be displayed as one if the point type in the first field in the Point type column is set to 1000. 3.1.4 Hole colors Fig. 67 Here the viewing of different production holes in the graphical overview can be turned on and off. The first sheet defines the different hole types. External holes are holes that are measured and imported from a non production file. The geometry logs must also be turned On in order to view them in the graphical window. Fig. 68 Fig. 12 shows the sheet where the coloring and viewing of the different production holes can be classified. There are two types of classification; based on hole length or based on hole type. Type in different lengths and choose the color. Page 55 Bever Team 3 Fig. 69 Fig. 13 shows the last sheet where external hole types can be defined. Type in the code on the points from the file and choose the color. 3.2 Report Fig. 70 Here different types of reports can be generated. It is also possible to export points to different text based files (.KOF and .PXY). From and to chainage must be typed in for all the reports and export. Graphical report will generate a report of the cross section/contour. Surface report will generate a surface map/flattened view of the tunnel containing the scanned surface and production holes. These must however be turned on in the hole color table (Fig. 11). The surface map is a function of the distance between the scanned surface and the theoretical contour. Page 56 Bever Team 3 Thickness report will generate a map/flattened view of the tunnel containing the two scanned surfaces. Two types of holes must be chosen. The surface map is a function of the distance between the two scanned surfaces. Numerical report either a volume report or a estimated bolt length report. Choose template; extended or standard for volume and bolt estimates for the bolt report. Extended contains more information in the calculations than the standard. Volume are calculated by area x length. See Fig. 15. Export to file type will export data from and to a specified chainage to a text based file. All of the reports are Excel based, so it is possible to go in and change the template if necessary. This must however be done by experienced Excel and computer people. 4 Report examples Excel volume report example. Type Standard: Fig. 71 Page 57 Bever Team 3 4.1 HEADING Site – Project or site, from the excel sheet; RawData1. Tunnel – Specific tunnel, from the excel sheet; RawData1. Date – Date, from the excel sheet; RawData1. Comment – Comment, from the excel sheet: RawData1. Calculated length in meter – The calculated length, from the excel sheet; RawData3, plus the last area. 4.2 LEFT SIDE (theoretical values) Comment - Place to type in a comment. Signature – Place to type in operator Contour volume – Total volume of calculated tunnel. Area of theoretical contours times steps on tunnel line (Station, Chainage). From the excel sheet RawData3. Trench volume – The operator must define the size of the trench in the formula. If there are none the volume is zero. Total volume - Contour volume plus ditch volume. Contour length – The length along the contour from the defined floor on the left side and to the defined floor on the right side. From the excel sheet RawData3. Perimeter floor – The length of the floor from left to right side. From the excel sheet RawData3. Perimeter floor – Total length around the contour, including tunnel profile and floor. Out Area conditions – The value indicates what should be taken into the calculations of the over break. If the value is set to 0, all area of over break will be used. The value here is used in the formula in “No of slices”. No of Slices – The number of contours with over break data in it. Containing over break larger than the value set in “Out area conditions”. InArea Condition - The value indicates what should be taken into the calculations of the under break. If the value is set to 0, all area of under break will be used. The value here is used in the formula in “Total measured inside” on the right side of the sheet. 4.3 RIGHT SIDE (Measured values) Omit sections without data – Sections without any data. Overbreak measured – All sections with over break are summoned. From the excel sheet RawData3. Measured tunnel length – Length of tunnel containing scanned data. Total overbreak – Estimated value including the sections without measured data. It is an average of the sections with data times the sections without. Total volume tunnel – Theoretical volume and over break volume summoned. Overbreak % - The percentage over break compared to the theoretical contour. All the numbers above are from scanned data. The numbers below are from estimated data. The average deviation is taken and used on the parts along the contour lacking scanned data. Page 58 Bever Team 3 Overbreak total - All sections with over break are summoned. From the excel sheet RawData3. Measured tunnel length – Length of tunnel containing scanned data. Total estimated overbreak – Estimated value including the sections without measured data. It is an average of the sections with data times the sections without. Total volume tunnel – Theoretical volume and over break volume summoned. Overbreak % - The percentage over break compared to the theoretical contour. Total measured inside – gives the value of the under break. From the excel sheet RawData3. Page 59 Bever Team 3 As built production 1 Overview The as built Production module is used to show log files from data controlled jumbos such as AMV, Atlas Copco, Terex and Sandvik. The log files can be displayed graphical and together with the actual tunnel contour. Important parameters like penetration rate can be displayed from one or several holes. When opening a log file a new program will be launched. The Bever Team Tunnproduction. 2 Tunnel log overview The tunnel log overview screen: Fig. 72 A list of the different tunnels in the project are displayed in the top window. In Fig. 1 there are several tunnels. Mark the desired tunnel and the log files connected to the selected tunnel will appear in the bottom window. To add new files just click on the Add button in the upper left corner. An explorer window will then appear. Navigate to where the log files are, mark the ones to import and click Open. In the dialog box the user can also choose different file types. Page 60 Bever Team 3 - .TL2 Bever Production log files .XML Iredes Production log files .LOG Atlas Production log files .PXY text based file .KOF text based file The new files will automatically be sorted along the horizontal alignment. It is also possible to click on the header over each column to sort by number of points, navigation date, chainage and so on. To delete log files, mark the ones that should be deleted and press the Delete button in the upper left corner. Only the one or ones that is marked will be deleted. If right clicking on a log file the following menu will appear Fig.2: Fig. 73 View – This will open the Tunnproduction app and show the log files. The user will be asked if the tunnel line should be reused. Answer yes or no. If there are no changes in the geometry it is not necessary to reuse the line. This is for quicker response in the application. Add – This will open the add log files dialog window. Delete – This will delete the marked log file. Send to – This will allow the user to save the log file in another folder or tunnel. Properties – Not in use. 2.1 Report Click on the report button to generate a production report. The menu in Fig 3. will appear. Page 61 Bever Team 3 Fig. 74 2.1.1 PE-Bolt Report This report is used for documenting fixed bolts/anchors. Depending on the inner lining it can be bolts for rock support, membranes, concrete elements, various attachments and other water and frost protection bolting. 2 3 1 4 Fig. 75 1. 2. 3. 4. The bolt number along the contour, numbered from the lower left corner. Station number. Length of bolt to be mounted. Actual drilled length. Page 62 Bever Team 3 2.1.2 Round Report A report where various average values from the jumbo are summoned. Fig. 76 Page 63 Bever Team 3 2.2 Summary A report who also generate more hole details about the drilling. Mark the desired log files in the overview and generate the report. Fig. 77 Page 64 Bever Team 3 3 TunnProduction 3.1 Main Screen Fig. 78 To the left are the chainage numbers on all the rounds registered in the project. The marker is on the round displayed. The middle window shows a graphical display of the drilled round. To the right are a list with details and descriptions for the graphical window. Page 65 Bever Team 3 3.2 Menus File New Open Save Save as Save holetab Open external bolts Graphdata to Excel Print Print preview Printer setup Exit/Back Create a new Tunnlog project. Open a TunnProd project. Save as a TunnProd project. Save as a TunnProd project. Save the current log and holes in a text file with coordinates. Import external bolts from .TXT or .KOF files. Export graphs to Excel Exit the program and returns to the log overview. Edit Delete Restore Copy New textbox Line textbox Selected hole will be set as a Dummy hole. Delete all the changes made in the log. Copies the graphical window. Paste into desired application. Create a textbox in the graphical window. Create a line from the textbox to a desired point. Round Holedata Diagram Sequence Area Number Next round Prev round Merge next Merge next Shows a detailed report for a chosen hole. Choose between the different sheets in the graphical window. Shows the sequence of the drilled holes. Shows area of the contour or drilled holes. Shows number of drilled holes and type of holes. Go to next drill log increasing chainage. Go to next drill log decreasing chainage. Merge the next logfile in increasing chainage. Merge the next logfile in decreasing chainage. Selection Single Multi Redraw Shows data and graphs from a single hole . Shows data and graphs from several holes. Refresh the graphical view. Page 66 Bever Team 3 View Tool bar Status bar Page header Grid Zoom in Zoom out Turn on/off the tool bar. Turn on/off the status bar at the bottom. Turn on/off the sheets in the graphical window. Turn on/off the grid. Zoom in on chosen hole. Zoom out to default value. Setup Options Language Various control parameter settings. Not in use. Help 3.3 Not in use. Tool bar Button functionality: Create a new Tunnlog project. Open a TunnProd project. Save settings for the application. Set holetype to dummy Copy Paste Grid on/off. Zoom in on a selected hole. Default zoom scale. Left mouse button to choose a hole. Left mouse button to choose many holes. Refresh / Remove marking on holes. Make a new textbox. Create a line from textbox Print. One page pr. round. Show version number and copyright information. Not in use. Page 67 Bever Team 3 3.4 Sheets 3.4.1 Drillpattern Will show the round from the face and in. Use the scroll bars to move the graphics around. This will also move it on the printout. Choose a hole in the round by left click and then right click. A menu will appear were different settings can be done: Change the hole type. Type a text line which can be shown in the graphics and on the reports. Show a detailed report on a hole. Fig. 79 Summary Started: When the hole was started. Ended: When the hole was ended. Boom: Which boom who drilled the hole. Hole type: Registered hole type. Auto/man.: Shows whether the hole is drilled in auto or manually mode. Log mode: Position, normal or extended. Drillplan: Which drillplan is used for this hole. Position Right, Height, Distance: Position for where the hole was started. Look out: Look out. Page 68 Bever Team 3 Direction: The angle of the hole. Rotation: Feeder rotation. Hole depth Depth ref: Max, collar or face. Number of rods: The number of rods used to drill the hole. Start depth: Distance from depth ref before the logging started. End depth: Distance from depth ref before the logging ended. Drilled in normal: Drilled length in normal modus. Ave. drilling: Penetration rate – Hammer, Feeder, Rotation pressure: Average values for the hole. Times Detailed time view of the different drilling operations. Sampling Number of samples from the drilling. Machine Voltage: Average supply voltage for the drilled hole. Motor current: Average electric current for the drilled hole. System pressure: Average system pressure for the drilled hole. 3.4.2 Bolts Show a flattened view of the tunnel with the bolt holes. An external bolt file can be opened and displayed in the graphics by choosing File, Open external bolts. Page 69 Bever Team 3 3.4.3 Single hole Fig. 80 Single hole Graphical view of the different hole parameters as a function of the hole depth. Page 70 Bever Team 3 3.4.4 Multi hole Fig. 81 Multi hole Graphical view of one hole parameter as a function of the hole depth. Choose other parameters by clicking on the Parameters button in the menu. Page 71 Bever Team 3 3.4.5 Development Fig. 82 Development Graphical view of one hole parameter as a function of the hole number. Choose other parameters by clicking on the Parameters button in the menu. Show one graph per boom. Page 72 Bever Team 3 3.4.6 Drillpattern 3D Fig. 83 Drillpattern 3D A 3D view of the round. The scoll bars decides the angle of the 3D rotation. The length of the graphical axis can be set under Settings in the menu. Graphical view of one hole parameter as a function of the round. Choose other parameters by clicking on the Parameters button in the menu. Page 73 Bever Team 3 3.4.7 Linear Fig. 84 Linear A Graphical view of one or more rounds at a specific chainage. It is also possible to view the profiler scan together with the round holes. Page 74 Bever Team 3 3.4.8 Collar surface 1 Graphical height map of the collar surface. To the right there is a profile of the collar seen from the left towards the right. Under is a profile seen from above and downwards. Choose where to see the profile by left click on the mouse in the map. The red cross will then indicate where the profiles are. 3.4.9 Linear surface Page 75 Bever Team 3 Fig. 85 Linear Surface Graphical map of one or more rounds shown as a function of penetration rate. Choose other parameters by clicking on the Parameters button in the menu. Page 76 Bever Team 3 3.5 Settings This tool box is found by clicking on setup and options in the top menu. Fig. 86 Properties General Peg linear Chainage where the drill log and interpolated contour are. Delta linear The chainage distance in linear mode. Ave. along rod Distance where the average values are collected. Tunnel offset Max dist. Area calc Max distance between the holes when calculating area. Max height area calc Max height above tunnel line when calculating area. Normal round length Attributes Drill hole size The size of the graphical holes. Grid dist. The distance between the squares in the grid. Graphs pr. page How many graphs per page to be printed. Size 3D view The length of the axis in the 3D view. Colored surface map Turn the colors on/off. Print in color Print in color or black and white. Holetypes Mark the holes to show in the graphics. Double click on the color in order to change this. Page 77 Bever Team 3 Bolt Colors To show different bolt lengths in different colors. Click add and then double click on the added line to set the length and color. Hole info Feeder rotation Sequence line Look out Collar point Hole text Turn on/off the display of feeder rotation on each hole. Show the sequence line for each boom. Turn on/off the look out for each hole. Show the collar as a point in the graphics. Turn on/off different text values for each hole. Drillplan/Contour Drillholes Lines Colored View Show drillholes from the drillplan. Show the lines from the drillplan. Show the drillholes from the drillplan in blue. Show the teorethical contour. Graphs/Surf. Setup for displaying the graphs and surface maps. Normally set to auto. Profiler Max distance between points to draw a line between them. Max deviation outside the contour to draw a line to the points. Max deviation inside the contour to draw a line to the points. Measurement: To show the measurements one step before and one step after the chainage value. Interpolated profile: Use a triangulation to draw a interpolated profile at the chainage value. Page 78 Bever Team 3 3.6 Miscellaneous 3.6.1 Sequence Choose Round – Sequence in the menu. Fig. 87 Sequence Fig. 88 Setup Boom In the Drillpattern sheet will the first hole drilled in the round be marked with a boom figure. It is the possible to step trough the actual drilled sequence by clicking on the next/previous buttons. Determine the boom setup. For a tree boomer it is best to use the default settings. Boom height is the graphical size of the boom figure. Page 79 Bever Team 3 3.6.2 Area calculation Choose Round – Area in the menu. Fig. 89Area calculations The area can be calculated from: Drill holes, collar The area drawn around the holes on the collar. Drill holes, bottom The area drawn around the holes at the bottom of the round. Drillholes, from collar to collar will give a volume on the round. Lines, drillplan The area drawn around the holes in the drillplan. Contour Area of the theoretical contour. 3.6.3 Number of drillholes Choose Round – Number in the menu. Fig. 90 Number of drillholes Page 80 Bever Team 3 Program Files and Folders The Install procedure will create different folders and files. Some are for the program and other for libraries and settings. 1 Windows XP The program will be installed under: C:\Program Files\Bever Control\Bever Team 3\Binaries In here are all the program files and subfolders created. One to be aware of is the DOC folder. This folder contains all the report templates. If any changes are to be made with the templates just open the desired excel file, change and save. It is very important to save the changed file(s) to a second folder as well before any program updates, since the update procedure will overwrite the user changed files. Libraries and settings folders are found under: C:\Documents and Settings\current user\my documents\Bever Team It is recommended to use this as the default folder for databases as well when using the program on a single computer and with no network database. Just add a folder and name i.e. databases. If there are any auto drill pattern made in the program an Auto folder will automatically be made in here as well. The Favorites folder contains contours and drill patterns sent to favorites from the program, like libraries. The Settings folder contains various personal settings in the program, like colors on the contour layers, fixed points definition ASO. It also contains the resent project to open. 2 Windows 7 / Vista The program will be installed under: C:\Program Files\Bever Control\Bever Team 3\Binaries In here are all the program files and subfolders created. One to be aware of is the DOC folder. This folder contains all the report templates. If any changes are to be made with the templates just open the desired excel file, change and save. It is very important to save the changed file(s) to a second folder as well before any program updates, since the update procedure will overwrite the user changed files. Libraries and settings folders are found under: C:\Users\current user\Documents\Bever Team Page 81 Bever Team 3 It is recommended to use this as the default folder for databases as well when using the program on a single computer and with no network database. Just add a folder and name i.e. databases. If there are any auto drill pattern made in the program an Auto folder will automatically be made in here as well. The Favorites folder contains contours and drill patterns sent to favorites from the program, like libraries. The Settings folder contains various personal settings in the program, like colors on the contour layers, fixed points definition ASO. It also contains the resent project to open. Page 82