1
MapInfo Professional
10.5
USER GUIDE
Information in this document is subject to change without notice and does not represent a commitment on the part of the vendor or its representatives. No part
of this document may be reproduced or transmitted in any form or by any means, electronic or mechanical, including photocopying, without the written
permission of Pitney Bowes Software Inc., One Global View, Troy, New York 12180-8399.
©2010 Pitney Bowes Software Inc. All rights reserved. MapInfo, Group 1 Software, and MapInfo Professional are trademarks of Pitney Bowes Software Inc. All
other marks and trademarks are property of their respective holders.
United States:
Phone: 518.285.6000
Fax: 518.285.6070
Sales: 800.327.8627
Government Sales: 800.619.2333
Technical Support: 518.285.7283
Technical Support Fax: 518.285.6080
pbinsight.com
Canada:
Phone: 416.594.5200
Fax: 416.594.5201
Sales: 800.268.3282
Technical Support:.518.285.7283
Technical Support Fax: 518.285.6080
pbinsight.ca
Europe/United Kingdom:
Phone: +44.1753.848.200
Fax: +44.1753.621.140
Technical Support: +44.1753.848.229
pbinsight.co.uk
Asia Pacific/Australia:
Phone: +61.2.9437.6255
Fax: +61.2.9439.1773
Technical Support: 1.800.648.899
pbinsight.com.au
Contact information for all Pitney Bowes Software Inc. offices is located at: http://www.pbinsight.com/about/contact-us.
Adobe Acrobat® is a registered trademark of Adobe Systems Incorporated in the United States.
© 1993 - 2010 Safe Software, Inc.
libtiff © 1988-1995 Sam Leffler, copyright © Silicon Graphics, Inc.
libgeotiff © 2010 Niles D. Ritter.
Portions © 1999 3D Graphics, Inc. All Rights Reserved.
HIL - Halo Image Library © 1993, Media Cybernetics Inc. Halo Imaging Library is a trademark of Media Cybernetics, Inc.
Portions thereof LEAD Technologies, Inc. © 1991-2010. All Rights Reserved.
Portions © 1993-2010 Ken Martin, Will Schroeder, Bill Lorensen. All Rights Reserved.
ECW by ER Mapper © 1993-2010
VM Grid by Northwood Technologies, Inc., a Marconi Company © 1995-2005.
Portions © 2010 Earth Resource Mapping, Ltd. All Rights Reserved.
MrSID, MrSID Decompressor and the MrSID logo are trademarks of LizardTech, Inc. used under license. Portions of this computer program are copyright ©
1995-1998 LizardTech and/or the university of California or are protected by US patent nos. 5,710,835 or 5,467,110 and are used under license. All
rights reserved. MrSID is protected under US and international patent & copyright treaties and foreign patent applications are pending. Unauthorized use or
duplication prohibited.
Contains FME ® Objects; © 2010 Safe Software, Inc.
Crystal Reports ® is proprietary trademark of Crystal Decisions. All Rights Reserved.
Amyuni PDF Converter © 2000-2010, AMYUNI Consultants – AMYUNI Technologies. All rights reserved.
Civic England - Public Sector Symbols Copyright © 2010 West London Alliance. The symbols may be used free of charge. For more information on these
symbols, including how to obtain them for use in other applications, please visit the West London Alliance Web site at http://www.westlondonalliance.org/
© 1984-2010 Tele Atlas. All Rights Reserved. This material is proprietary and the subject of copyright protection and other intellectual property rights owned or
licensed to Tele Atlas. The use of this material is subject to the terms of a license agreement. You will be held liable for any unauthorized copying or disclosure
of this material.
Microsoft Bing © 2010 Microsoft Corporation.
This product contains 7-Zip, which is licensed under GNU Lesser General Public License, Version 2.1, February 1999 with the unRAR restriction. The license
can be downloaded from http://www.7-zip.org/license.txt. The source code is available from http://www.7-zip.org.
Products named herein may be trademarks of their respective manufacturers and are hereby recognized. Trademarked names are used editorially, to the
benefit of the trademark owner, with no intent to infringe on the trademark.
June 2010
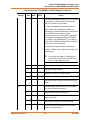
Table of Contents
Chapter 1: Introduction . . . . . . . . . . . . . . . . . . . . . . . . . . . . . . . . . . . . . . . . . . . . . . 15
Mapping at a Glance . . . . . . . . . . . . . . . . . . . . . . . . . . . . . . . . . . . . . . . . . . . . . . . . . . .16
Reviewing the MapInfo Professional Features. . . . . . . . . . . . . . . . . . . . . . . . . . . . . . . .17
Getting Support . . . . . . . . . . . . . . . . . . . . . . . . . . . . . . . . . . . . . . . . . . . . . . . . . . . . . . . . .19
Using the Status Bar . . . . . . . . . . . . . . . . . . . . . . . . . . . . . . . . . . . . . . . . . . . . . . . . . . .19
Using the Help System. . . . . . . . . . . . . . . . . . . . . . . . . . . . . . . . . . . . . . . . . . . . . . . . . .20
Getting Technical Support . . . . . . . . . . . . . . . . . . . . . . . . . . . . . . . . . . . . . . . . . . . . . . .20
Contacting Technical Support . . . . . . . . . . . . . . . . . . . . . . . . . . . . . . . . . . . . . . . . . . . .20
Tell Us What You Think! . . . . . . . . . . . . . . . . . . . . . . . . . . . . . . . . . . . . . . . . . . . . . . . .21
Chapter 2: What’s New in MapInfo Professional . . . . . . . . . . . . . . . . . . . . . . . . . 22
Cursors have a new Look . . . . . . . . . . . . . . . . . . . . . . . . . . . . . . . . . . . . . . . . . . . . . . .23
Docking Windows and Tools . . . . . . . . . . . . . . . . . . . . . . . . . . . . . . . . . . . . . . . . . . . . .23
Printing . . . . . . . . . . . . . . . . . . . . . . . . . . . . . . . . . . . . . . . . . . . . . . . . . . . . . . . . . . . . . .24
Printing to PDF. . . . . . . . . . . . . . . . . . . . . . . . . . . . . . . . . . . . . . . . . . . . . . . . . . . . . . . .25
Mapping – New and Enhanced Features. . . . . . . . . . . . . . . . . . . . . . . . . . . . . . . . . . . . .26
Table List . . . . . . . . . . . . . . . . . . . . . . . . . . . . . . . . . . . . . . . . . . . . . . . . . . . . . . . . . . . .26
Adding Map Tile Server Layers and Bing™ Layers to your Maps . . . . . . . . . . . . . . . . .26
Applying Style Overrides for when Zooming the Map . . . . . . . . . . . . . . . . . . . . . . . . . .27
Stacking Styles to Customize Map Features . . . . . . . . . . . . . . . . . . . . . . . . . . . . . . . . .27
New Coordinate Systems and Projections. . . . . . . . . . . . . . . . . . . . . . . . . . . . . . . . . . .28
Data Access Features . . . . . . . . . . . . . . . . . . . . . . . . . . . . . . . . . . . . . . . . . . . . . . . . . . . .28
Data Enhancements . . . . . . . . . . . . . . . . . . . . . . . . . . . . . . . . . . . . . . . . . . . . . . . . . . . . .29
New and Existing Tools . . . . . . . . . . . . . . . . . . . . . . . . . . . . . . . . . . . . . . . . . . . . . . . . . .29
Catalog Browser. . . . . . . . . . . . . . . . . . . . . . . . . . . . . . . . . . . . . . . . . . . . . . . . . . . . . . .29
Synchronize Windows . . . . . . . . . . . . . . . . . . . . . . . . . . . . . . . . . . . . . . . . . . . . . . . . . .30
Named Views . . . . . . . . . . . . . . . . . . . . . . . . . . . . . . . . . . . . . . . . . . . . . . . . . . . . . . . . .30
Feature Manipulation Engine (FME) . . . . . . . . . . . . . . . . . . . . . . . . . . . . . . . . . . . . . . .31
MapCAD. . . . . . . . . . . . . . . . . . . . . . . . . . . . . . . . . . . . . . . . . . . . . . . . . . . . . . . . . . . . .31
Geographic Tracker Tool . . . . . . . . . . . . . . . . . . . . . . . . . . . . . . . . . . . . . . . . . . . . . . . .32
New in Documentation . . . . . . . . . . . . . . . . . . . . . . . . . . . . . . . . . . . . . . . . . . . . . . . . . . .32
Graphing Your Data . . . . . . . . . . . . . . . . . . . . . . . . . . . . . . . . . . . . . . . . . . . . . . . . . . . .32
MapInfo Professional 10.5
3
User Guide
Creating a MapInfo_MapCatalog Manually . . . . . . . . . . . . . . . . . . . . . . . . . . . . . . . . . .32
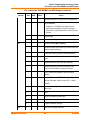
Chapter 3: The Basics of MapInfo Professional . . . . . . . . . . . . . . . . . . . . . . . . . . 34
Starting MapInfo Professional . . . . . . . . . . . . . . . . . . . . . . . . . . . . . . . . . . . . . . . . . . . .35
Exiting MapInfo Professional . . . . . . . . . . . . . . . . . . . . . . . . . . . . . . . . . . . . . . . . . . . . .35
A Tour of the MapInfo Professional Desktop . . . . . . . . . . . . . . . . . . . . . . . . . . . . . . . . .36
Working with Toolbars . . . . . . . . . . . . . . . . . . . . . . . . . . . . . . . . . . . . . . . . . . . . . . . . . .36
Using Workspaces . . . . . . . . . . . . . . . . . . . . . . . . . . . . . . . . . . . . . . . . . . . . . . . . . . . . .41
Understanding Your Data in MapInfo Professional . . . . . . . . . . . . . . . . . . . . . . . . . . . .43
What is a Layer? . . . . . . . . . . . . . . . . . . . . . . . . . . . . . . . . . . . . . . . . . . . . . . . . . . . . . .43
Map Objects as Part of Layers. . . . . . . . . . . . . . . . . . . . . . . . . . . . . . . . . . . . . . . . . . . .44
Managing a Map’s Layers . . . . . . . . . . . . . . . . . . . . . . . . . . . . . . . . . . . . . . . . . . . . . . .44
Working with Tables in the Table List . . . . . . . . . . . . . . . . . . . . . . . . . . . . . . . . . . . . . . .45
Accessing the Table List . . . . . . . . . . . . . . . . . . . . . . . . . . . . . . . . . . . . . . . . . . . . . . . .45
About the Context Menu . . . . . . . . . . . . . . . . . . . . . . . . . . . . . . . . . . . . . . . . . . . . . . . .48
Selecting Multiple Tables in the Table List. . . . . . . . . . . . . . . . . . . . . . . . . . . . . . . . . . .50
Dragging and Dropping in the Table List . . . . . . . . . . . . . . . . . . . . . . . . . . . . . . . . . . . .50
Sorting in the Table List . . . . . . . . . . . . . . . . . . . . . . . . . . . . . . . . . . . . . . . . . . . . . . . . .50
Searching the Table List . . . . . . . . . . . . . . . . . . . . . . . . . . . . . . . . . . . . . . . . . . . . . . . .51
Working with Layers in the Layer Control . . . . . . . . . . . . . . . . . . . . . . . . . . . . . . . . . . .51
Accessing Layer Control . . . . . . . . . . . . . . . . . . . . . . . . . . . . . . . . . . . . . . . . . . . . . . . .53
Adding Layers to the Map . . . . . . . . . . . . . . . . . . . . . . . . . . . . . . . . . . . . . . . . . . . . . . .56
Reordering Map Layers . . . . . . . . . . . . . . . . . . . . . . . . . . . . . . . . . . . . . . . . . . . . . . . . .56
Setting the Zoom Layering . . . . . . . . . . . . . . . . . . . . . . . . . . . . . . . . . . . . . . . . . . . . . . .57
Positioning and Sizing Labels . . . . . . . . . . . . . . . . . . . . . . . . . . . . . . . . . . . . . . . . . . . .58
Displaying the Lines, Nodes, and Centroids . . . . . . . . . . . . . . . . . . . . . . . . . . . . . . . . .59
Understanding the Cosmetic Layer . . . . . . . . . . . . . . . . . . . . . . . . . . . . . . . . . . . . . . . .60
Making the Layers “Editable” . . . . . . . . . . . . . . . . . . . . . . . . . . . . . . . . . . . . . . . . . . . . .60
Making a Read-Only Table “Editable” . . . . . . . . . . . . . . . . . . . . . . . . . . . . . . . . . . . . . .60
Getting Layer Information . . . . . . . . . . . . . . . . . . . . . . . . . . . . . . . . . . . . . . . . . . . . . . .61
Selecting Objects in a Layer . . . . . . . . . . . . . . . . . . . . . . . . . . . . . . . . . . . . . . . . . . . . .62
Working with Thematic Layers . . . . . . . . . . . . . . . . . . . . . . . . . . . . . . . . . . . . . . . . . . . .62
Ordering Thematic Layers . . . . . . . . . . . . . . . . . . . . . . . . . . . . . . . . . . . . . . . . . . . . . . .63
Displaying Thematic Layers . . . . . . . . . . . . . . . . . . . . . . . . . . . . . . . . . . . . . . . . . . . . . .63
Converting Objects into Region Objects . . . . . . . . . . . . . . . . . . . . . . . . . . . . . . . . . . . .64
Working with Raster and Grid Layers in Layer Control . . . . . . . . . . . . . . . . . . . . . . . . .64
Converting Grid Files to MapInfo Professional Grids (*.mig) . . . . . . . . . . . . . . . . . . . .65
Working with Seamless Layers . . . . . . . . . . . . . . . . . . . . . . . . . . . . . . . . . . . . . . . . . . . .65
Features Available with Seamless Layers . . . . . . . . . . . . . . . . . . . . . . . . . . . . . . . . . .66
Data – Where MapInfo Professional Begins . . . . . . . . . . . . . . . . . . . . . . . . . . . . . . . . . .69
What is a Database and Other Basic Terminology . . . . . . . . . . . . . . . . . . . . . . . . . . . .69
What Data Can I Use in MapInfo Professional?. . . . . . . . . . . . . . . . . . . . . . . . . . . . . . .70
MapInfo Professional 10.5
4
User Guide
Support for Raster Images . . . . . . . . . . . . . . . . . . . . . . . . . . . . . . . . . . . . . . . . . . . . . . .71
Opening MapInfo Tables . . . . . . . . . . . . . . . . . . . . . . . . . . . . . . . . . . . . . . . . . . . . . . . .73
Opening Data in Remote Tables . . . . . . . . . . . . . . . . . . . . . . . . . . . . . . . . . . . . . . . . . .75
Reviewing the Windows in MapInfo Professional . . . . . . . . . . . . . . . . . . . . . . . . . . . . .77
Displaying Data in a Map Window . . . . . . . . . . . . . . . . . . . . . . . . . . . . . . . . . . . . . . . . .78
Displaying Data in a Browser Window . . . . . . . . . . . . . . . . . . . . . . . . . . . . . . . . . . . . . .79
Changing a Record's Data, Font, and Style . . . . . . . . . . . . . . . . . . . . . . . . . . . . . . . . .81
Displaying Data in a Graph Window . . . . . . . . . . . . . . . . . . . . . . . . . . . . . . . . . . . . . . .81
Displaying Data in a Layout Window . . . . . . . . . . . . . . . . . . . . . . . . . . . . . . . . . . . . . . .82
Other Windows for Displaying Data . . . . . . . . . . . . . . . . . . . . . . . . . . . . . . . . . . . . . . . .82
Saving, Closing, and Exporting Your Work . . . . . . . . . . . . . . . . . . . . . . . . . . . . . . . . . .83
Saving a Workspace . . . . . . . . . . . . . . . . . . . . . . . . . . . . . . . . . . . . . . . . . . . . . . . . . . .83
Exporting to GeoTIFF (*.tif) Format . . . . . . . . . . . . . . . . . . . . . . . . . . . . . . . . . . . . . . . .84
Saving a Table or a Copy of a Table . . . . . . . . . . . . . . . . . . . . . . . . . . . . . . . . . . . . . . .85
Closing a Table . . . . . . . . . . . . . . . . . . . . . . . . . . . . . . . . . . . . . . . . . . . . . . . . . . . . . . .86
Opening vs. Importing . . . . . . . . . . . . . . . . . . . . . . . . . . . . . . . . . . . . . . . . . . . . . . . . . .86
Exporting Your Data to a New Format . . . . . . . . . . . . . . . . . . . . . . . . . . . . . . . . . . . . . .87
Importing and Exporting Data in AutoCAD Format . . . . . . . . . . . . . . . . . . . . . . . . . . . .87
Cropping Images . . . . . . . . . . . . . . . . . . . . . . . . . . . . . . . . . . . . . . . . . . . . . . . . . . . . . .88
Exporting to ASCII Format . . . . . . . . . . . . . . . . . . . . . . . . . . . . . . . . . . . . . . . . . . . . . .88
Exporting to dBase (*.DBF) Format . . . . . . . . . . . . . . . . . . . . . . . . . . . . . . . . . . . . . . .88
Smoothing Map Images during Export. . . . . . . . . . . . . . . . . . . . . . . . . . . . . . . . . . . . . .89
Using the Tools in the Tool Manager . . . . . . . . . . . . . . . . . . . . . . . . . . . . . . . . . . . . . . .89
File Format Types Supported. . . . . . . . . . . . . . . . . . . . . . . . . . . . . . . . . . . . . . . . . . . . . .90
Chapter 4: Understanding Your Data. . . . . . . . . . . . . . . . . . . . . . . . . . . . . . . . . . . 93
Adding to a Table . . . . . . . . . . . . . . . . . . . . . . . . . . . . . . . . . . . . . . . . . . . . . . . . . . . . . .94
Updating a Table . . . . . . . . . . . . . . . . . . . . . . . . . . . . . . . . . . . . . . . . . . . . . . . . . . . . . .95
Appending Rows to a Table . . . . . . . . . . . . . . . . . . . . . . . . . . . . . . . . . . . . . . . . . . . . . .96
Appending One Table to Another. . . . . . . . . . . . . . . . . . . . . . . . . . . . . . . . . . . . . . . . . .97
Parsing Data from One Column to Multiple Columns . . . . . . . . . . . . . . . . . . . . . . . . . .97
Placing Graphic Information in Visible Columns . . . . . . . . . . . . . . . . . . . . . . . . . . . . .100
Creating a New Table . . . . . . . . . . . . . . . . . . . . . . . . . . . . . . . . . . . . . . . . . . . . . . . . .100
Editing a Table’s Structure . . . . . . . . . . . . . . . . . . . . . . . . . . . . . . . . . . . . . . . . . . . . .103
Copying and Renaming a Table. . . . . . . . . . . . . . . . . . . . . . . . . . . . . . . . . . . . . . . . . .103
Deleting a Table . . . . . . . . . . . . . . . . . . . . . . . . . . . . . . . . . . . . . . . . . . . . . . . . . . . . . .103
Packing a Table . . . . . . . . . . . . . . . . . . . . . . . . . . . . . . . . . . . . . . . . . . . . . . . . . . . . .104
Collecting Data into the Table using Update Column . . . . . . . . . . . . . . . . . . . . . . . . .104
Browsing a Table . . . . . . . . . . . . . . . . . . . . . . . . . . . . . . . . . . . . . . . . . . . . . . . . . . . . .105
Creating a Report of your Data . . . . . . . . . . . . . . . . . . . . . . . . . . . . . . . . . . . . . . . . . . .106
Opening an Existing Report . . . . . . . . . . . . . . . . . . . . . . . . . . . . . . . . . . . . . . . . . . . .107
Saving a Report . . . . . . . . . . . . . . . . . . . . . . . . . . . . . . . . . . . . . . . . . . . . . . . . . . . . .107
MapInfo Professional 10.5
5
User Guide
Chapter 5: Graphing Your Data . . . . . . . . . . . . . . . . . . . . . . . . . . . . . . . . . . . . . . 108
Graphing Terms . . . . . . . . . . . . . . . . . . . . . . . . . . . . . . . . . . . . . . . . . . . . . . . . . . . . . .109
3D Graphs . . . . . . . . . . . . . . . . . . . . . . . . . . . . . . . . . . . . . . . . . . . . . . . . . . . . . . . . . .109
Area Graphs. . . . . . . . . . . . . . . . . . . . . . . . . . . . . . . . . . . . . . . . . . . . . . . . . . . . . . . . .110
Bar Graphs. . . . . . . . . . . . . . . . . . . . . . . . . . . . . . . . . . . . . . . . . . . . . . . . . . . . . . . . . .110
Bubble Graphs . . . . . . . . . . . . . . . . . . . . . . . . . . . . . . . . . . . . . . . . . . . . . . . . . . . . . . .110
Column Graphs . . . . . . . . . . . . . . . . . . . . . . . . . . . . . . . . . . . . . . . . . . . . . . . . . . . . . .111
Histogram Graphs . . . . . . . . . . . . . . . . . . . . . . . . . . . . . . . . . . . . . . . . . . . . . . . . . . . .111
Line Graphs . . . . . . . . . . . . . . . . . . . . . . . . . . . . . . . . . . . . . . . . . . . . . . . . . . . . . . . . .111
Pie Graphs . . . . . . . . . . . . . . . . . . . . . . . . . . . . . . . . . . . . . . . . . . . . . . . . . . . . . . . . . .111
Scatter Graphs . . . . . . . . . . . . . . . . . . . . . . . . . . . . . . . . . . . . . . . . . . . . . . . . . . . . . . .112
Surface Graphs . . . . . . . . . . . . . . . . . . . . . . . . . . . . . . . . . . . . . . . . . . . . . . . . . . . . . .112
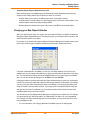
Graphing Your Data . . . . . . . . . . . . . . . . . . . . . . . . . . . . . . . . . . . . . . . . . . . . . . . . . . . .112
Creating a Graph using the Graph Wizard. . . . . . . . . . . . . . . . . . . . . . . . . . . . . . . . . .112
Editing a Graph . . . . . . . . . . . . . . . . . . . . . . . . . . . . . . . . . . . . . . . . . . . . . . . . . . . . . .114
Working with Multi-Table and Multi-Variable Graphs . . . . . . . . . . . . . . . . . . . . . . . . .119
Exploding a Pie Graph . . . . . . . . . . . . . . . . . . . . . . . . . . . . . . . . . . . . . . . . . . . . . . . . .119
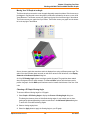
3D Graphs - Using the 3D Viewing Angle . . . . . . . . . . . . . . . . . . . . . . . . . . . . . . . . . .121
Selections in Graphs and Their Tables . . . . . . . . . . . . . . . . . . . . . . . . . . . . . . . . . . . .124
Saving a Graph . . . . . . . . . . . . . . . . . . . . . . . . . . . . . . . . . . . . . . . . . . . . . . . . . . . . . . . .125
Using Graph Templates . . . . . . . . . . . . . . . . . . . . . . . . . . . . . . . . . . . . . . . . . . . . . . . . .125
Location Preferences . . . . . . . . . . . . . . . . . . . . . . . . . . . . . . . . . . . . . . . . . . . . . . . . . .126
Saving a Graph Template . . . . . . . . . . . . . . . . . . . . . . . . . . . . . . . . . . . . . . . . . . . . . .126
Chapter 6: Accessing Remote Data . . . . . . . . . . . . . . . . . . . . . . . . . . . . . . . . . . . 128
Supported Databases and Versions . . . . . . . . . . . . . . . . . . . . . . . . . . . . . . . . . . . . . .129
About Linked and Live DBMS Tables . . . . . . . . . . . . . . . . . . . . . . . . . . . . . . . . . . . . .129
Accessing Data in Remote Spatial Databases . . . . . . . . . . . . . . . . . . . . . . . . . . . . . .131
Storing Coordinate Values in a Remote Table. . . . . . . . . . . . . . . . . . . . . . . . . . . . . . .132
Creating a Spatial Index Column . . . . . . . . . . . . . . . . . . . . . . . . . . . . . . . . . . . . . . . . .132
Creating a MapInfo_MapCatalog . . . . . . . . . . . . . . . . . . . . . . . . . . . . . . . . . . . . . . . . .132
Making a Remote Table Mappable . . . . . . . . . . . . . . . . . . . . . . . . . . . . . . . . . . . . . . .134
Opening a Connection to an ODBC Data Source . . . . . . . . . . . . . . . . . . . . . . . . . . . .135
Opening a Connection to an Oracle Spatial Data Source . . . . . . . . . . . . . . . . . . . . . .137
Opening a Connection to a PostGIS Data Source . . . . . . . . . . . . . . . . . . . . . . . . . . . .138
Opening a Database Table from a Connection . . . . . . . . . . . . . . . . . . . . . . . . . . . . . .139
Refreshing Live and Linked Remote Tables . . . . . . . . . . . . . . . . . . . . . . . . . . . . . . . .146
Unlinking a Table from a Remote Database . . . . . . . . . . . . . . . . . . . . . . . . . . . . . . . .146
Saving a DBMS Table . . . . . . . . . . . . . . . . . . . . . . . . . . . . . . . . . . . . . . . . . . . . . . . . .146
Disconnecting from a Remote Database . . . . . . . . . . . . . . . . . . . . . . . . . . . . . . . . . . .149
Working with Styles in DBMS Tables. . . . . . . . . . . . . . . . . . . . . . . . . . . . . . . . . . . . . .149
MapInfo Professional 10.5
6
User Guide
Converting Unsupported Geometries in Oracle, SQL Server SpatialWare, SQL Server
Spatial, and PostGIS . . . . . . . . . . . . . . . . . . . . . . . . . . . . . . . . . . . . . . . . . . . . . . . . . .150
Supporting Oracle Spatial . . . . . . . . . . . . . . . . . . . . . . . . . . . . . . . . . . . . . . . . . . . . . .152
Creating Legends from/for a Live Table. . . . . . . . . . . . . . . . . . . . . . . . . . . . . . . . . . . .154
Chapter 7: Drawing and Editing Objects . . . . . . . . . . . . . . . . . . . . . . . . . . . . . . . 157
Using the Drawing and Editing Commands . . . . . . . . . . . . . . . . . . . . . . . . . . . . . . . . .158
Adding Nodes to an Object (Overlay Nodes Command) . . . . . . . . . . . . . . . . . . . . . . .159
Drawing Objects . . . . . . . . . . . . . . . . . . . . . . . . . . . . . . . . . . . . . . . . . . . . . . . . . . . . . . .160
Specifying an Object's Geographic Attributes . . . . . . . . . . . . . . . . . . . . . . . . . . . . . . .160
Reverting to a Previous Version . . . . . . . . . . . . . . . . . . . . . . . . . . . . . . . . . . . . . . . . .161
Using the Ruler Window as You Draw . . . . . . . . . . . . . . . . . . . . . . . . . . . . . . . . . . . . .161
Object Styles . . . . . . . . . . . . . . . . . . . . . . . . . . . . . . . . . . . . . . . . . . . . . . . . . . . . . . . .161
Printing Fill Patterns . . . . . . . . . . . . . . . . . . . . . . . . . . . . . . . . . . . . . . . . . . . . . . . . . . .162
Drawing Polygons and Polylines. . . . . . . . . . . . . . . . . . . . . . . . . . . . . . . . . . . . . . . . . .162
Converting a Polyline to a Region . . . . . . . . . . . . . . . . . . . . . . . . . . . . . . . . . . . . . . . .164
Converting Objects into Polyline Objects . . . . . . . . . . . . . . . . . . . . . . . . . . . . . . . . . .165
Drawing Symbols . . . . . . . . . . . . . . . . . . . . . . . . . . . . . . . . . . . . . . . . . . . . . . . . . . . . . .165
Changing a Symbol Style on a Map. . . . . . . . . . . . . . . . . . . . . . . . . . . . . . . . . . . . . . .166
Supported Fonts for Symbols. . . . . . . . . . . . . . . . . . . . . . . . . . . . . . . . . . . . . . . . . . . .167
Working with Custom Symbols . . . . . . . . . . . . . . . . . . . . . . . . . . . . . . . . . . . . . . . . . .167
Working with Text on the Map . . . . . . . . . . . . . . . . . . . . . . . . . . . . . . . . . . . . . . . . . . .169
Editing Objects . . . . . . . . . . . . . . . . . . . . . . . . . . . . . . . . . . . . . . . . . . . . . . . . . . . . . . . .170
Positioning and Sizing your Map Objects. . . . . . . . . . . . . . . . . . . . . . . . . . . . . . . . . . .171
Changing your Map Object Attributes . . . . . . . . . . . . . . . . . . . . . . . . . . . . . . . . . . . . .175
Reshaping Map Objects. . . . . . . . . . . . . . . . . . . . . . . . . . . . . . . . . . . . . . . . . . . . . . . .176
Using “Snap To” to Select Nodes and Centroids . . . . . . . . . . . . . . . . . . . . . . . . . . . . .177
Setting Snap Preferences for a Visible Snap Area . . . . . . . . . . . . . . . . . . . . . . . . . . .178
Autotracing Objects . . . . . . . . . . . . . . . . . . . . . . . . . . . . . . . . . . . . . . . . . . . . . . . . . . .179
Smoothing and Unsmoothing Lines . . . . . . . . . . . . . . . . . . . . . . . . . . . . . . . . . . . . . . .180
Converting Regions to Polylines . . . . . . . . . . . . . . . . . . . . . . . . . . . . . . . . . . . . . . . . .181
Merging One Map into Another . . . . . . . . . . . . . . . . . . . . . . . . . . . . . . . . . . . . . . . . . .181
Chapter 8: Selecting and Querying Data . . . . . . . . . . . . . . . . . . . . . . . . . . . . . . . 183
Characteristics of Selections . . . . . . . . . . . . . . . . . . . . . . . . . . . . . . . . . . . . . . . . . . . .185
Selecting from the Screen . . . . . . . . . . . . . . . . . . . . . . . . . . . . . . . . . . . . . . . . . . . . . .186
Selecting Tools. . . . . . . . . . . . . . . . . . . . . . . . . . . . . . . . . . . . . . . . . . . . . . . . . . . . . . .187
Unselecting Objects or Records. . . . . . . . . . . . . . . . . . . . . . . . . . . . . . . . . . . . . . . . . .192
Querying Your Data in MapInfo Professional . . . . . . . . . . . . . . . . . . . . . . . . . . . . . . . .193
Selecting and Using Queries . . . . . . . . . . . . . . . . . . . . . . . . . . . . . . . . . . . . . . . . . . . .194
Making Queries using the Select Command . . . . . . . . . . . . . . . . . . . . . . . . . . . . . . . .196
Making Queries using the SQL Select Command . . . . . . . . . . . . . . . . . . . . . . . . . . . .197
MapInfo Professional 10.5
7
User Guide
Displaying Query Results Quickly . . . . . . . . . . . . . . . . . . . . . . . . . . . . . . . . . . . . . . . .198
Creating Query Expressions . . . . . . . . . . . . . . . . . . . . . . . . . . . . . . . . . . . . . . . . . . . .198
Using Select to Create Queries . . . . . . . . . . . . . . . . . . . . . . . . . . . . . . . . . . . . . . . . . .201
Interactively Selecting Objects . . . . . . . . . . . . . . . . . . . . . . . . . . . . . . . . . . . . . . . . . . .203
Using SQL Select to Query Data . . . . . . . . . . . . . . . . . . . . . . . . . . . . . . . . . . . . . . . . .204
Saving Queries. . . . . . . . . . . . . . . . . . . . . . . . . . . . . . . . . . . . . . . . . . . . . . . . . . . . . . .208
Using Date- and Time-Based Data in Maps and Queries . . . . . . . . . . . . . . . . . . . . . .209
Using Templates for Queries . . . . . . . . . . . . . . . . . . . . . . . . . . . . . . . . . . . . . . . . . . . .217
Deriving Columns. . . . . . . . . . . . . . . . . . . . . . . . . . . . . . . . . . . . . . . . . . . . . . . . . . . . .218
Creating Column Aliases . . . . . . . . . . . . . . . . . . . . . . . . . . . . . . . . . . . . . . . . . . . . . . .219
Aggregating Data . . . . . . . . . . . . . . . . . . . . . . . . . . . . . . . . . . . . . . . . . . . . . . . . . . . . .219
Joining Tables Using SQL Select. . . . . . . . . . . . . . . . . . . . . . . . . . . . . . . . . . . . . . . . .221
Joining Tables Geographically (Using Geographic Operators) . . . . . . . . . . . . . . . . . .223
Joining Two or More Tables . . . . . . . . . . . . . . . . . . . . . . . . . . . . . . . . . . . . . . . . . . . .225
Finding Duplicate Values in a Column . . . . . . . . . . . . . . . . . . . . . . . . . . . . . . . . . . . . .226
Calculating the Distance to a Fixed Point . . . . . . . . . . . . . . . . . . . . . . . . . . . . . . . . . .227
Chapter 9: Creating Thematic Maps, Legends, and Other Maps . . . . . . . . . . . 229
Using Thematic Mapping to Analyze Information . . . . . . . . . . . . . . . . . . . . . . . . . . . .230
Planning Your Thematic Map. . . . . . . . . . . . . . . . . . . . . . . . . . . . . . . . . . . . . . . . . . . .231
Methods of Thematic Mapping. . . . . . . . . . . . . . . . . . . . . . . . . . . . . . . . . . . . . . . . . . .233
Types of Thematic Maps . . . . . . . . . . . . . . . . . . . . . . . . . . . . . . . . . . . . . . . . . . . . . . .234
Ranged Maps . . . . . . . . . . . . . . . . . . . . . . . . . . . . . . . . . . . . . . . . . . . . . . . . . . . . . . .235
Bar Chart Maps . . . . . . . . . . . . . . . . . . . . . . . . . . . . . . . . . . . . . . . . . . . . . . . . . . . . . .237
Pie Chart Maps . . . . . . . . . . . . . . . . . . . . . . . . . . . . . . . . . . . . . . . . . . . . . . . . . . . . . .238
Graduated Symbol Maps . . . . . . . . . . . . . . . . . . . . . . . . . . . . . . . . . . . . . . . . . . . . . .239
Dot Density Maps . . . . . . . . . . . . . . . . . . . . . . . . . . . . . . . . . . . . . . . . . . . . . . . . . . . .241
Individual Value Maps . . . . . . . . . . . . . . . . . . . . . . . . . . . . . . . . . . . . . . . . . . . . . . . . .243
Grid Surface Maps . . . . . . . . . . . . . . . . . . . . . . . . . . . . . . . . . . . . . . . . . . . . . . . . . . .244
Creating a Thematic Map . . . . . . . . . . . . . . . . . . . . . . . . . . . . . . . . . . . . . . . . . . . . . . . .245
Step 1: Choosing a Type of Thematic Template . . . . . . . . . . . . . . . . . . . . . . . . . . . . .245
Step 2: Choosing Thematic Values . . . . . . . . . . . . . . . . . . . . . . . . . . . . . . . . . . . . . . .247
Step 3: Customizing Your Thematic Map. . . . . . . . . . . . . . . . . . . . . . . . . . . . . . . . . . .248
Thematic Maps as Layers . . . . . . . . . . . . . . . . . . . . . . . . . . . . . . . . . . . . . . . . . . . . . .250
Changing the Display Parameters of a Map . . . . . . . . . . . . . . . . . . . . . . . . . . . . . . . .251
Changing a Map's Proportions . . . . . . . . . . . . . . . . . . . . . . . . . . . . . . . . . . . . . . . . . . .251
Working with Thematic Maps and Legends . . . . . . . . . . . . . . . . . . . . . . . . . . . . . . . . .252
Modifying a Thematic Map . . . . . . . . . . . . . . . . . . . . . . . . . . . . . . . . . . . . . . . . . . . . . .252
Using the Theme Templates . . . . . . . . . . . . . . . . . . . . . . . . . . . . . . . . . . . . . . . . . . . .252
Saving Your Thematic Settings . . . . . . . . . . . . . . . . . . . . . . . . . . . . . . . . . . . . . . . . . .253
Creating a Theme Legend . . . . . . . . . . . . . . . . . . . . . . . . . . . . . . . . . . . . . . . . . . . . .254
Updating Columns using Thematic Mapping . . . . . . . . . . . . . . . . . . . . . . . . . . . . . . . .255
MapInfo Professional 10.5
8
User Guide
Adding Temporary Columns . . . . . . . . . . . . . . . . . . . . . . . . . . . . . . . . . . . . . . . . . . . .259
Working with Legends . . . . . . . . . . . . . . . . . . . . . . . . . . . . . . . . . . . . . . . . . . . . . . . . . .260
Creating a Legend Window . . . . . . . . . . . . . . . . . . . . . . . . . . . . . . . . . . . . . . . . . . . . .260
What are Cartographic Legends? . . . . . . . . . . . . . . . . . . . . . . . . . . . . . . . . . . . . . . . .261
Customizing a Thematic Legend . . . . . . . . . . . . . . . . . . . . . . . . . . . . . . . . . . . . . . . . .262
What are Thematic Legends? . . . . . . . . . . . . . . . . . . . . . . . . . . . . . . . . . . . . . . . . . . .264
Working with Grid Surface Maps . . . . . . . . . . . . . . . . . . . . . . . . . . . . . . . . . . . . . . . . . .265
Working with Grid Handlers . . . . . . . . . . . . . . . . . . . . . . . . . . . . . . . . . . . . . . . . . . . . .266
Chapter 10: Buffering and Working with Objects. . . . . . . . . . . . . . . . . . . . . . . . 268
Understanding Buffers . . . . . . . . . . . . . . . . . . . . . . . . . . . . . . . . . . . . . . . . . . . . . . . . .269
Creating a Buffer . . . . . . . . . . . . . . . . . . . . . . . . . . . . . . . . . . . . . . . . . . . . . . . . . . . . .269
Buffer Methods. . . . . . . . . . . . . . . . . . . . . . . . . . . . . . . . . . . . . . . . . . . . . . . . . . . . . . .274
Types of Buffers . . . . . . . . . . . . . . . . . . . . . . . . . . . . . . . . . . . . . . . . . . . . . . . . . . . . . .275
Editing Objects using the Set Target Model . . . . . . . . . . . . . . . . . . . . . . . . . . . . . . . . .277
Aggregating and Disaggregating Data . . . . . . . . . . . . . . . . . . . . . . . . . . . . . . . . . . . . .280
Clipping a Region of a Map . . . . . . . . . . . . . . . . . . . . . . . . . . . . . . . . . . . . . . . . . . . . .280
Overview of Combining Map Objects . . . . . . . . . . . . . . . . . . . . . . . . . . . . . . . . . . . . .281
Clearing a Target . . . . . . . . . . . . . . . . . . . . . . . . . . . . . . . . . . . . . . . . . . . . . . . . . . . .283
Splitting Objects . . . . . . . . . . . . . . . . . . . . . . . . . . . . . . . . . . . . . . . . . . . . . . . . . . . . .284
Creating Territories by Combining Objects . . . . . . . . . . . . . . . . . . . . . . . . . . . . . . . . .285
Combining Selected Objects . . . . . . . . . . . . . . . . . . . . . . . . . . . . . . . . . . . . . . . . . . . .285
Combining Objects Using Column . . . . . . . . . . . . . . . . . . . . . . . . . . . . . . . . . . . . . . .286
Creating a Voronoi Polygon . . . . . . . . . . . . . . . . . . . . . . . . . . . . . . . . . . . . . . . . . . . .287
Grouping Objects using Multipoint and Collection Object Types . . . . . . . . . . . . . . . . .288
Creating and Manipulating Objects . . . . . . . . . . . . . . . . . . . . . . . . . . . . . . . . . . . . . . . .288
Chapter 11: Stylizing Your Map for Presentations and Publishing . . . . . . . . . 289
Changing a Region’s Style . . . . . . . . . . . . . . . . . . . . . . . . . . . . . . . . . . . . . . . . . . . . .290
Changing a Line’s Style . . . . . . . . . . . . . . . . . . . . . . . . . . . . . . . . . . . . . . . . . . . . . . .291
Changing a Symbol’s Style . . . . . . . . . . . . . . . . . . . . . . . . . . . . . . . . . . . . . . . . . . . . .292
Changing the Text Style. . . . . . . . . . . . . . . . . . . . . . . . . . . . . . . . . . . . . . . . . . . . . . . .293
Labeling Your Map . . . . . . . . . . . . . . . . . . . . . . . . . . . . . . . . . . . . . . . . . . . . . . . . . . . . .294
Designing Your Labels . . . . . . . . . . . . . . . . . . . . . . . . . . . . . . . . . . . . . . . . . . . . . . . . .295
Choosing the Label Content. . . . . . . . . . . . . . . . . . . . . . . . . . . . . . . . . . . . . . . . . . . . .295
Using AutoLabeling . . . . . . . . . . . . . . . . . . . . . . . . . . . . . . . . . . . . . . . . . . . . . . . . . . .297
Labeling Interactively . . . . . . . . . . . . . . . . . . . . . . . . . . . . . . . . . . . . . . . . . . . . . . . . . .303
Using Text Objects as Labels . . . . . . . . . . . . . . . . . . . . . . . . . . . . . . . . . . . . . . . . . . .304
Saving Labels. . . . . . . . . . . . . . . . . . . . . . . . . . . . . . . . . . . . . . . . . . . . . . . . . . . . . . . .304
Adding an Adornment to the Map . . . . . . . . . . . . . . . . . . . . . . . . . . . . . . . . . . . . . . . . .305
Adding a Scale Bar to Represent Map Scale. . . . . . . . . . . . . . . . . . . . . . . . . . . . . . . .305
Working with Layouts . . . . . . . . . . . . . . . . . . . . . . . . . . . . . . . . . . . . . . . . . . . . . . . . . . .306
MapInfo Professional 10.5
9
User Guide
What is a Layout Window?. . . . . . . . . . . . . . . . . . . . . . . . . . . . . . . . . . . . . . . . . . . . . .306
Working in the Layout Window. . . . . . . . . . . . . . . . . . . . . . . . . . . . . . . . . . . . . . . . . . .307
Before You Create a Layout. . . . . . . . . . . . . . . . . . . . . . . . . . . . . . . . . . . . . . . . . . . . .308
Creating a Layout Window . . . . . . . . . . . . . . . . . . . . . . . . . . . . . . . . . . . . . . . . . . . . .310
Using Legends in a Layout. . . . . . . . . . . . . . . . . . . . . . . . . . . . . . . . . . . . . . . . . . . . . .314
Moving Frames in a Layout Window . . . . . . . . . . . . . . . . . . . . . . . . . . . . . . . . . . . . . .315
Aligning Objects in a Layout Window. . . . . . . . . . . . . . . . . . . . . . . . . . . . . . . . . . . . . .315
Setting the Map Scale for a Layout Window . . . . . . . . . . . . . . . . . . . . . . . . . . . . . . . .316
Cloning a Map View . . . . . . . . . . . . . . . . . . . . . . . . . . . . . . . . . . . . . . . . . . . . . . . . . . .317
Creating a Cartographic Legend . . . . . . . . . . . . . . . . . . . . . . . . . . . . . . . . . . . . . . . . . .317
What is a Cartographic Legend? . . . . . . . . . . . . . . . . . . . . . . . . . . . . . . . . . . . . . . . . .317
Printing and Exporting Your Results . . . . . . . . . . . . . . . . . . . . . . . . . . . . . . . . . . . . . .318
Printing Your Project . . . . . . . . . . . . . . . . . . . . . . . . . . . . . . . . . . . . . . . . . . . . . . . . . .318
Exporting a Layout . . . . . . . . . . . . . . . . . . . . . . . . . . . . . . . . . . . . . . . . . . . . . . . . . . . .320
Save Window As Supports Raster Formats. . . . . . . . . . . . . . . . . . . . . . . . . . . . . . . . .321
Chapter 12: Registering Raster Images. . . . . . . . . . . . . . . . . . . . . . . . . . . . . . . . 324
Determining Map Coordinates . . . . . . . . . . . . . . . . . . . . . . . . . . . . . . . . . . . . . . . . . .325
An Introduction to Raster Image Registration . . . . . . . . . . . . . . . . . . . . . . . . . . . . . . .325
Understanding Raster Images in MapInfo Professional. . . . . . . . . . . . . . . . . . . . . . . .326
Raster Image Format Details . . . . . . . . . . . . . . . . . . . . . . . . . . . . . . . . . . . . . . . . . . . .327
Opening a Raster Image . . . . . . . . . . . . . . . . . . . . . . . . . . . . . . . . . . . . . . . . . . . . . . . . .328
Registering the Coordinates of a Raster Image . . . . . . . . . . . . . . . . . . . . . . . . . . . . . .328
Reprojecting a Raster Map . . . . . . . . . . . . . . . . . . . . . . . . . . . . . . . . . . . . . . . . . . . . .329
Transferring Vector Map Coordinates Directly to a Raster Map . . . . . . . . . . . . . . . . .330
Modifying Control Points for Raster Images. . . . . . . . . . . . . . . . . . . . . . . . . . . . . . . . .331
Adjusting the Contrast or Brightness of a Raster Image . . . . . . . . . . . . . . . . . . . . . . .333
Adjusting the Translucency of a Raster Image . . . . . . . . . . . . . . . . . . . . . . . . . . . . . .333
Printing/Exporting Translucent Raster Images . . . . . . . . . . . . . . . . . . . . . . . . . . . . . .333
Chapter 13: Putting Your Data on the Map . . . . . . . . . . . . . . . . . . . . . . . . . . . . . 335
When Do I Geocode vs. Create Points? . . . . . . . . . . . . . . . . . . . . . . . . . . . . . . . . . . .336
Displaying your Data on a Map . . . . . . . . . . . . . . . . . . . . . . . . . . . . . . . . . . . . . . . . . . .336
Displaying your Excel (.XLS or .XLSX) Data . . . . . . . . . . . . . . . . . . . . . . . . . . . . . . . .337
Displaying your Access (.MDB or .ACCDB) Data . . . . . . . . . . . . . . . . . . . . . . . . . . . .338
Displaying your Comma Delimited Data . . . . . . . . . . . . . . . . . . . . . . . . . . . . . . . . . . .339
Displaying your dBase Data . . . . . . . . . . . . . . . . . . . . . . . . . . . . . . . . . . . . . . . . . . . .340
Displaying your Lotus 1-2-3 Data. . . . . . . . . . . . . . . . . . . . . . . . . . . . . . . . . . . . . . . . .340
Displaying your ESRI Shapefile Data . . . . . . . . . . . . . . . . . . . . . . . . . . . . . . . . . . . . .340
Registering and Displaying your ASCII Data . . . . . . . . . . . . . . . . . . . . . . . . . . . . . . .342
Opening MapInfo Professional Grid Files . . . . . . . . . . . . . . . . . . . . . . . . . . . . . . . . . .343
Importing Graphic Files . . . . . . . . . . . . . . . . . . . . . . . . . . . . . . . . . . . . . . . . . . . . . . . .343
MapInfo Professional 10.5
10
User Guide
Importing and Displaying GML File Data . . . . . . . . . . . . . . . . . . . . . . . . . . . . . . . . . .344
Using Universal Data Directly . . . . . . . . . . . . . . . . . . . . . . . . . . . . . . . . . . . . . . . . . . .344
Understanding MapInfo Professional’s Use of the Topography Layer. . . . . . . . . . . . .350
Viewing a List of Open Tables . . . . . . . . . . . . . . . . . . . . . . . . . . . . . . . . . . . . . . . . . . .350
Displaying Data Details using the Statistics Window . . . . . . . . . . . . . . . . . . . . . . . . .351
Displaying Your Remote DBMS Data . . . . . . . . . . . . . . . . . . . . . . . . . . . . . . . . . . . . .352
Displaying and Importing Data from a Web Map Service . . . . . . . . . . . . . . . . . . . . . .353
Geocoding – Assigning Coordinates to Records . . . . . . . . . . . . . . . . . . . . . . . . . . . .353
What Do I Need to Know Before Geocoding? . . . . . . . . . . . . . . . . . . . . . . . . . . . . . . .354
Understanding the Geocoding Process . . . . . . . . . . . . . . . . . . . . . . . . . . . . . . . . . . . .355
Modes of Geocoding . . . . . . . . . . . . . . . . . . . . . . . . . . . . . . . . . . . . . . . . . . . . . . . . . .356
Methods of Geocoding . . . . . . . . . . . . . . . . . . . . . . . . . . . . . . . . . . . . . . . . . . . . . . . . .356
Refining Your Geocoding Search . . . . . . . . . . . . . . . . . . . . . . . . . . . . . . . . . . . . . . . .357
Finding an Exact Street Match . . . . . . . . . . . . . . . . . . . . . . . . . . . . . . . . . . . . . . . . . . .358
Placing Geocoded Points. . . . . . . . . . . . . . . . . . . . . . . . . . . . . . . . . . . . . . . . . . . . . . .359
Matching Street Names . . . . . . . . . . . . . . . . . . . . . . . . . . . . . . . . . . . . . . . . . . . . . . . .360
Matching Address Numbers. . . . . . . . . . . . . . . . . . . . . . . . . . . . . . . . . . . . . . . . . . . . .360
Matching to Region . . . . . . . . . . . . . . . . . . . . . . . . . . . . . . . . . . . . . . . . . . . . . . . . . . .361
Selecting Records Not Geocoded . . . . . . . . . . . . . . . . . . . . . . . . . . . . . . . . . . . . . . . .362
Locating Newly Geocoded Points . . . . . . . . . . . . . . . . . . . . . . . . . . . . . . . . . . . . . . . .363
Result Codes . . . . . . . . . . . . . . . . . . . . . . . . . . . . . . . . . . . . . . . . . . . . . . . . . . . . . . . .363
Ungeocoding a Table . . . . . . . . . . . . . . . . . . . . . . . . . . . . . . . . . . . . . . . . . . . . . . . . .363
Putting Latitude/Longitude Coordinates on a Map . . . . . . . . . . . . . . . . . . . . . . . . . . .365
Dispersing Points Located in the Same Place . . . . . . . . . . . . . . . . . . . . . . . . . . . . . . .365
Creating Points for Intersections . . . . . . . . . . . . . . . . . . . . . . . . . . . . . . . . . . . . . . . . .366
Geocoding Data using a Server . . . . . . . . . . . . . . . . . . . . . . . . . . . . . . . . . . . . . . . . . .366
Displaying Your Data on the Map . . . . . . . . . . . . . . . . . . . . . . . . . . . . . . . . . . . . . . . . .367
Finding Data on your Map . . . . . . . . . . . . . . . . . . . . . . . . . . . . . . . . . . . . . . . . . . . . . .368
Printing Your Results . . . . . . . . . . . . . . . . . . . . . . . . . . . . . . . . . . . . . . . . . . . . . . . . . . .368
Setting up the Page . . . . . . . . . . . . . . . . . . . . . . . . . . . . . . . . . . . . . . . . . . . . . . . . . . .368
Printing Your Map . . . . . . . . . . . . . . . . . . . . . . . . . . . . . . . . . . . . . . . . . . . . . . . . . . . .369
Viewing and Printing Text . . . . . . . . . . . . . . . . . . . . . . . . . . . . . . . . . . . . . . . . . . . . . .371
Troubleshooting Print Problems. . . . . . . . . . . . . . . . . . . . . . . . . . . . . . . . . . . . . . . . . .372
Chapter 14: Working with Coordinate Systems and Projections . . . . . . . . . . . 374
Displaying Coordinates . . . . . . . . . . . . . . . . . . . . . . . . . . . . . . . . . . . . . . . . . . . . . . . .375
Elements of a Coordinate System . . . . . . . . . . . . . . . . . . . . . . . . . . . . . . . . . . . . . . . .375
Understanding Coordinate Systems . . . . . . . . . . . . . . . . . . . . . . . . . . . . . . . . . . . . . .376
Building Blocks of a Coordinate System . . . . . . . . . . . . . . . . . . . . . . . . . . . . . . . . . . .381
Coordinate Systems, Projections, and their Parameters . . . . . . . . . . . . . . . . . . . . . . .381
Projection Types . . . . . . . . . . . . . . . . . . . . . . . . . . . . . . . . . . . . . . . . . . . . . . . . . . . . .382
Datums . . . . . . . . . . . . . . . . . . . . . . . . . . . . . . . . . . . . . . . . . . . . . . . . . . . . . . . . . . . .385
MapInfo Professional 10.5
11
User Guide
Units . . . . . . . . . . . . . . . . . . . . . . . . . . . . . . . . . . . . . . . . . . . . . . . . . . . . . . . . . . . . . . .386
Coordinate System Origin . . . . . . . . . . . . . . . . . . . . . . . . . . . . . . . . . . . . . . . . . . . . . .386
Standard Parallels (Conic Projections) . . . . . . . . . . . . . . . . . . . . . . . . . . . . . . . . . . . .386
Oblique Azimuth (Hotine Oblique Mercator) . . . . . . . . . . . . . . . . . . . . . . . . . . . . . . . .386
Scale Factor (Transverse Mercator) . . . . . . . . . . . . . . . . . . . . . . . . . . . . . . . . . . . . . .387
False Easting and False Northing . . . . . . . . . . . . . . . . . . . . . . . . . . . . . . . . . . . . . . . .387
Range (Azimuthal Projections). . . . . . . . . . . . . . . . . . . . . . . . . . . . . . . . . . . . . . . . . . .387
About Polyconic Coordinate Systems . . . . . . . . . . . . . . . . . . . . . . . . . . . . . . . . . . . . .388
Examples of Projection Entries in the MAPINFOW.PRJ File . . . . . . . . . . . . . . . . . . . .388
Adding Projections to the MAPINFOW.PRJ File . . . . . . . . . . . . . . . . . . . . . . . . . . . . .389
Using the New Projection in a Coordinate System . . . . . . . . . . . . . . . . . . . . . . . . . . .391
Entering a New Coordinate System (Example) . . . . . . . . . . . . . . . . . . . . . . . . . . . . . .391
Understanding Precision in MapInfo Professional . . . . . . . . . . . . . . . . . . . . . . . . . . .392
What is Precision? . . . . . . . . . . . . . . . . . . . . . . . . . . . . . . . . . . . . . . . . . . . . . . . . . . . .392
Understanding Affine Transformations . . . . . . . . . . . . . . . . . . . . . . . . . . . . . . . . . . . .392
Description of an Affine Transformation. . . . . . . . . . . . . . . . . . . . . . . . . . . . . . . . . . . .393
Using Earth and Non-Earth Maps . . . . . . . . . . . . . . . . . . . . . . . . . . . . . . . . . . . . . . . . .395
Specifying Coordinates for a Non-Earth Map . . . . . . . . . . . . . . . . . . . . . . . . . . . . . . .396
Chapter 15: Working with Web Services . . . . . . . . . . . . . . . . . . . . . . . . . . . . . . . 397
Accessing Web Services in MapInfo Professional . . . . . . . . . . . . . . . . . . . . . . . . . . .398
Web Service Authentication . . . . . . . . . . . . . . . . . . . . . . . . . . . . . . . . . . . . . . . . . . . . .398
Enhancing Map Data using a Web Map Service. . . . . . . . . . . . . . . . . . . . . . . . . . . . . .399
How Does MapInfo Professional Use WMS Servers? . . . . . . . . . . . . . . . . . . . . . . . . .400
Supported Image Formats for WMS . . . . . . . . . . . . . . . . . . . . . . . . . . . . . . . . . . . . . .401
Understanding WMS Error Messages . . . . . . . . . . . . . . . . . . . . . . . . . . . . . . . . . . .401
Enhancing Map Data using a Web Feature Service . . . . . . . . . . . . . . . . . . . . . . . . . . .403
WFS Server Requirements . . . . . . . . . . . . . . . . . . . . . . . . . . . . . . . . . . . . . . . . . . . . .404
Geocoding using a Geocoding Server . . . . . . . . . . . . . . . . . . . . . . . . . . . . . . . . . . . . .406
What Are MapMarker and Envinsa Geocoding Services? . . . . . . . . . . . . . . . . . . . . . .407
Geocoding a Single Address using a Geocoding Service . . . . . . . . . . . . . . . . . . . . . .408
Understanding the Geocoding Result Codes. . . . . . . . . . . . . . . . . . . . . . . . . . . . . . . .408
Creating Routing Distance and Time Buffers. . . . . . . . . . . . . . . . . . . . . . . . . . . . . . . .410
How are Time and Distance Buffers Calculated? . . . . . . . . . . . . . . . . . . . . . . . . . . . .411
Using Driving Region Buffers to Display Data . . . . . . . . . . . . . . . . . . . . . . . . . . . . . . .412
Creating Time or Distance Buffers for Objects. . . . . . . . . . . . . . . . . . . . . . . . . . . . . . .412
Accessing Envinsa Online Services . . . . . . . . . . . . . . . . . . . . . . . . . . . . . . . . . . . . . . .413
Enhancing Map Data using a Mapping Tile Server . . . . . . . . . . . . . . . . . . . . . . . . . . .414
Tile Server Authentication . . . . . . . . . . . . . . . . . . . . . . . . . . . . . . . . . . . . . . . . . . . . . .415
Setting up a Mapping Tile Server Table. . . . . . . . . . . . . . . . . . . . . . . . . . . . . . . . . . . .415
Adding a Tile Server Layer to your Map. . . . . . . . . . . . . . . . . . . . . . . . . . . . . . . . . . . .416
Adding a Microsoft Bing Layer to a Map . . . . . . . . . . . . . . . . . . . . . . . . . . . . . . . . . . .417
MapInfo Professional 10.5
12
User Guide
Setting Tile Server Layer Properties . . . . . . . . . . . . . . . . . . . . . . . . . . . . . . . . . . . . . .417
Chapter 16: Specialized Topics in MapInfo Professional . . . . . . . . . . . . . . . . . 419
What You Should Know First . . . . . . . . . . . . . . . . . . . . . . . . . . . . . . . . . . . . . . . . . . . .420
Menus and Commands Available While Using the MapInfo Map . . . . . . . . . . . . . . . .421
Limitations of OLE . . . . . . . . . . . . . . . . . . . . . . . . . . . . . . . . . . . . . . . . . . . . . . . . . . . .421
Working with Embedded Maps . . . . . . . . . . . . . . . . . . . . . . . . . . . . . . . . . . . . . . . . . .421
Sharing Documents with Embedded Maps . . . . . . . . . . . . . . . . . . . . . . . . . . . . . . . . .422
Using MapInfo Tables with Data Map . . . . . . . . . . . . . . . . . . . . . . . . . . . . . . . . . . . . .422
Internet Connectivity and MapInfo Professional . . . . . . . . . . . . . . . . . . . . . . . . . . . . .423
What Are Active Objects? . . . . . . . . . . . . . . . . . . . . . . . . . . . . . . . . . . . . . . . . . . . . . .423
HTML Landing Pages . . . . . . . . . . . . . . . . . . . . . . . . . . . . . . . . . . . . . . . . . . . . . . . . .424
Redistricting — Grouping Map Objects into Districts . . . . . . . . . . . . . . . . . . . . . . . . .425
What is Redistricting and How Can I Use It? . . . . . . . . . . . . . . . . . . . . . . . . . . . . . . .425
Using the Districts Browser . . . . . . . . . . . . . . . . . . . . . . . . . . . . . . . . . . . . . . . . . . . . .427
Using Redistricting . . . . . . . . . . . . . . . . . . . . . . . . . . . . . . . . . . . . . . . . . . . . . . . . . . . .427
Options in Redistricting . . . . . . . . . . . . . . . . . . . . . . . . . . . . . . . . . . . . . . . . . . . . . . . .428
Creating Expressions . . . . . . . . . . . . . . . . . . . . . . . . . . . . . . . . . . . . . . . . . . . . . . . . . . .428
Where Expressions Can Be Used . . . . . . . . . . . . . . . . . . . . . . . . . . . . . . . . . . . . . . . .429
Constructing Simple Expressions . . . . . . . . . . . . . . . . . . . . . . . . . . . . . . . . . . . . . . . .429
Constructing Complex Expressions . . . . . . . . . . . . . . . . . . . . . . . . . . . . . . . . . . . . . . .431
Entering Specific Values (Constants) into Expressions . . . . . . . . . . . . . . . . . . . . . . .431
Using Mathematical Operators in Expressions . . . . . . . . . . . . . . . . . . . . . . . . . . . . . .432
Using String Operators in Expressions . . . . . . . . . . . . . . . . . . . . . . . . . . . . . . . . . . . .433
Using Comparison Operators in Expressions . . . . . . . . . . . . . . . . . . . . . . . . . . . . . . .433
Using Geographic Operators in Expressions . . . . . . . . . . . . . . . . . . . . . . . . . . . . . . . .436
Using Logical Operators in Expressions . . . . . . . . . . . . . . . . . . . . . . . . . . . . . . . . . . .437
Understanding Operator Precedence . . . . . . . . . . . . . . . . . . . . . . . . . . . . . . . . . . . . .439
Using Functions in Expressions . . . . . . . . . . . . . . . . . . . . . . . . . . . . . . . . . . . . . . . . . .440
Working with the MapBasic Window. . . . . . . . . . . . . . . . . . . . . . . . . . . . . . . . . . . . . . .440
Accessing the MapBasic Window . . . . . . . . . . . . . . . . . . . . . . . . . . . . . . . . . . . . . . . .441
Running a MapBasic Program . . . . . . . . . . . . . . . . . . . . . . . . . . . . . . . . . . . . . . . . . .442
Appendix A: Directory of MapInfo Professional Shortcuts . . . . . . . . . . . . . . . . 444
Shortcuts for Edit Menu Items . . . . . . . . . . . . . . . . . . . . . . . . . . . . . . . . . . . . . . . . . . . .445
Shortcut to Tools Menu Items . . . . . . . . . . . . . . . . . . . . . . . . . . . . . . . . . . . . . . . . . . . .445
Shortcuts to Objects Menu Items . . . . . . . . . . . . . . . . . . . . . . . . . . . . . . . . . . . . . . . . .446
Shortcuts for Query Menu Items . . . . . . . . . . . . . . . . . . . . . . . . . . . . . . . . . . . . . . . . . .446
Shortcuts for Options Menu Items . . . . . . . . . . . . . . . . . . . . . . . . . . . . . . . . . . . . . . . .446
Shortcuts for Map Menu Items. . . . . . . . . . . . . . . . . . . . . . . . . . . . . . . . . . . . . . . . . . . .446
Shortcuts for Window Menu Items . . . . . . . . . . . . . . . . . . . . . . . . . . . . . . . . . . . . . . . .447
Shortcuts by Keystroke . . . . . . . . . . . . . . . . . . . . . . . . . . . . . . . . . . . . . . . . . . . . . . . . .447
MapInfo Professional 10.5
13
User Guide
Shortcuts for the Map or Layout Window . . . . . . . . . . . . . . . . . . . . . . . . . . . . . . . . . . .449
When the Map or Layout is Active . . . . . . . . . . . . . . . . . . . . . . . . . . . . . . . . . . . . . . . .449
While Drawing a Polyline or Polygon . . . . . . . . . . . . . . . . . . . . . . . . . . . . . . . . . . . . . .450
When Selecting One or More Objects from the Editable Layer or Layout . . . . . . . . . .450
Appendix B: Elements of a Coordinate System . . . . . . . . . . . . . . . . . . . . . . . . . 451
Projection Types . . . . . . . . . . . . . . . . . . . . . . . . . . . . . . . . . . . . . . . . . . . . . . . . . . . . .454
Projection Datums . . . . . . . . . . . . . . . . . . . . . . . . . . . . . . . . . . . . . . . . . . . . . . . . . . . .456
Units . . . . . . . . . . . . . . . . . . . . . . . . . . . . . . . . . . . . . . . . . . . . . . . . . . . . . . . . . . . . . .464
Coordinate System Origin . . . . . . . . . . . . . . . . . . . . . . . . . . . . . . . . . . . . . . . . . . . . . .465
Standard Parallels (Conic Projections) . . . . . . . . . . . . . . . . . . . . . . . . . . . . . . . . . . . .466
Oblique Azimuth (Hotine Oblique Mercator) . . . . . . . . . . . . . . . . . . . . . . . . . . . . . . . .466
Scale Factor (Transverse Mercator) . . . . . . . . . . . . . . . . . . . . . . . . . . . . . . . . . . . . . .466
False Northings and False Eastings . . . . . . . . . . . . . . . . . . . . . . . . . . . . . . . . . . . . . .466
Range (Azimuthal Projections). . . . . . . . . . . . . . . . . . . . . . . . . . . . . . . . . . . . . . . . . . .466
Polyconic Projection. . . . . . . . . . . . . . . . . . . . . . . . . . . . . . . . . . . . . . . . . . . . . . . . . . .467
Equidistant Cylindrical Projection. . . . . . . . . . . . . . . . . . . . . . . . . . . . . . . . . . . . . . . . .467
Coordinate System Enhancements by Version . . . . . . . . . . . . . . . . . . . . . . . . . . . . . .467
Coordinate System and Datum Additions for MapInfo Professional 10.5 . . . . . . . . . .468
For More Information on Projections . . . . . . . . . . . . . . . . . . . . . . . . . . . . . . . . . . . . . .472
Contact Information . . . . . . . . . . . . . . . . . . . . . . . . . . . . . . . . . . . . . . . . . . . . . . . . . . .473
Appendix C: Manually Creating a MapInfo_MapCatalog . . . . . . . . . . . . . . . . . . 474
Manually Making a Remote Table Mappable. . . . . . . . . . . . . . . . . . . . . . . . . . . . . . . .476
Appendix D: MapInfo Map Interchange Format . . . . . . . . . . . . . . . . . . . . . . . . . 479
CharSet . . . . . . . . . . . . . . . . . . . . . . . . . . . . . . . . . . . . . . . . . . . . . . . . . . . . . . . . . . . .486
Delimiter . . . . . . . . . . . . . . . . . . . . . . . . . . . . . . . . . . . . . . . . . . . . . . . . . . . . . . . . . . . .486
Unique . . . . . . . . . . . . . . . . . . . . . . . . . . . . . . . . . . . . . . . . . . . . . . . . . . . . . . . . . . . . .487
Index . . . . . . . . . . . . . . . . . . . . . . . . . . . . . . . . . . . . . . . . . . . . . . . . . . . . . . . . . . . . . .487
CoordSys Clause . . . . . . . . . . . . . . . . . . . . . . . . . . . . . . . . . . . . . . . . . . . . . . . . . . . . .487
Transform Clause. . . . . . . . . . . . . . . . . . . . . . . . . . . . . . . . . . . . . . . . . . . . . . . . . . . . .488
Columns . . . . . . . . . . . . . . . . . . . . . . . . . . . . . . . . . . . . . . . . . . . . . . . . . . . . . . . . . . . .489
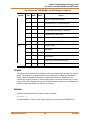
Appendix E: Glossary of Terms . . . . . . . . . . . . . . . . . . . . . . . . . . . . . . . . . . . . . . 490
MapInfo Professional 10.5
14
User Guide
Introduction
Welcome to the Pitney Bowes Software Inc. family of products. As the field of
computer mapping continues to expand, Pitney Bowes Software Inc. leads the
way with new products that are designed to fulfill users’ computer mapping
needs from the most basic to the most specialized with MapMarker, our premier
address matching product.
MapInfo Professional is a comprehensive computer mapping tool that enables
you to perform complex geographic analysis such as redistricting, accessing
your remote data, dragging and dropping map objects into your applications,
creating thematic maps that emphasize patterns in your data, and much more.
This User Guide contains all of the information you need to learn about and be
productive using MapInfo Professional.
Topics in this Section:
What is MapInfo Professional? . . . . . . . . . . . . . . . . . . . . . . . . . . . .16
Getting Support . . . . . . . . . . . . . . . . . . . . . . . . . . . . . . . . . . . . . . . .19
1
Chapter 1: Introduction
What is MapInfo Professional?
What is MapInfo Professional?
With MapInfo Professional, the power of computer mapping is at your complete disposal. You can
display your data as points, as thematically shaded regions, as pie or bar charts, as districts, etc.
You can perform geographic operations such as redistricting, combining and splitting objects, and
buffering. You can also make queries against your data and access your remote data directly from
MapInfo Professional.
For example, MapInfo Professional can show which branch store is the closest to your biggest
customers. It can calculate the distances between customers and stores; it can show you the
customers who spent the most last year; it can color-code the store symbols by sales volume. What
makes it all come together is a visual display of your data on the map.
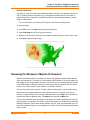
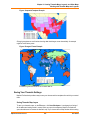
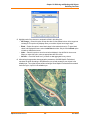
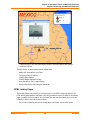
Mapping at a Glance
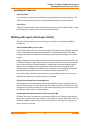
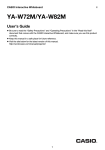
Huge quantities of information are available today, far more than ever before. Data abounds in
spreadsheets, sales records, and marketing files. Paper and disk store masses of information on
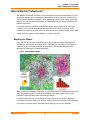
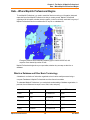
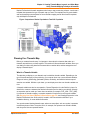
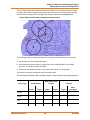
customers, stores, personnel, equipment, and resources. Thematic maps and graphs show
distribution of customers for a marketing campaign.
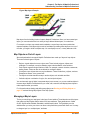
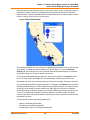
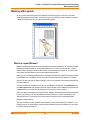
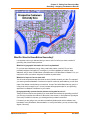
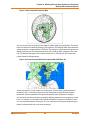
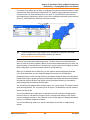
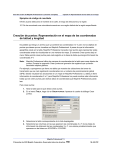
Figure: Thematic Map Example
Nearly all data has a geographic component. An estimated 85 percent of all databases contain some
sort of geographic information such as street addresses, cities, states, postal codes, or even
telephone numbers with area codes and exchange numbers.
Computer mapping can help you sort through all of this information, and using the geographic
components in your data, display your results on a map. This lets you see patterns and relationships
in the mass of information quickly and easily without having to pore over your database.
MapInfo Professional 10.5
16
User Guide
Chapter 1: Introduction
What is MapInfo Professional?
Windows Compatibility
MapInfo Professional is Windows XP Professional and Windows XP compatible, so you will feel right
at home with its windowing environment. It is designed to fit smoothly into your work environment, so
it only changes the results you get, not the way you work.
Using Your Own Data
To begin with, you can use the data you already have, in the form it’s already in — spreadsheets
such as Excel, databases such as Access, popular CAD packages, and other GIS applications, to
name just a few. If your data is on a remote database, you can access it directly from MapInfo
Professional. If you have data that is not already online, you can create database files right inside
the product, or use data supplied by Pitney Bowes Software Inc. — such as census data.
Similarly, you can use any of thousands of maps available from Pitney Bowes Software Inc.,
everything from street and highway maps to world maps. You can also create your own maps, either
in MapInfo Professional or with a drawing package. You can diagram anything — floor plans, flow
charts, even brain anatomy — can be treated as a map and entered into the product.
After you’ve organized your data visually, you’ll save the results to files, or send them to any of the
dozens of printers and plotters MapInfo Professional recognizes.
If you have your data on hand and you can read a map, you’re just about ready to begin. Soon, we’ll
show you an example of how easy it is to put MapInfo Professional’s power to work for you.
But first, install MapInfo Professional following the instructions in the MapInfo Professional Install
Guide. If you are new to the product, or new to computer mapping, we suggest you refer to The
Basics of MapInfo Professional on page 34 for an overview of basic mapping terms and
concepts. Use the web-enabled tutorial to learn about its features, and become accustomed to the
more common tasks and functions.
For more product and service information, you can connect directly from MapInfo Professional to our
forum (on the Help menu, click MapInfo on the Web), or, consult our World Wide Web site
(www.pbinsight.com).
Reviewing the MapInfo Professional Features
MapInfo Professional gives you the processing power of databases (including powerful SQL
queries) and the visual power of maps, plus charts and graphs. It’s an essential business tool for
data analysis, sales, and presentations.
Here is a look at some of the features MapInfo Professional offers:
•
•
•
•
•
Direct opening of files created with dBASE or FoxBASE, delimited ASCII, comma delimited CSV
files, ESRI® shapefiles, Lotus 1–2–3, Microsoft Excel, and Microsoft Access; importing of
graphics files in a variety of formats; a function for creating database files from within the
product.
Multiple views of your data in Map, Browser, and Graph windows. Hot Views allow you to open
multiple views of the same data and update them when you change any one view.
Live ODBC access to remote database data such as Oracle and SQL Server.
Seamless map layers that allow you to handle several map layers as if they were one layer.
Cartographic legends, enabling you to create and customize legends for any map layer.
MapInfo Professional 10.5
17
User Guide
Chapter 1: Introduction
What is MapInfo Professional?
•
•
•
•
•
•
•
•
•
•
•
•
•
Thematic maps to create analyses of your data with high visual impact, including grid surface
themes, 3DMaps, and Prism maps.
Use raster underlay capabilities to enhance your work session.
Querying capabilities ranging from simple data selections from a single file to complex SQL
queries from one or more files.
Workspaces that save all your settings and views so you can start where you left off.
HotLinks that let you launch files or URLs directly from a Map window.
OLE embedding of Map windows into other applications.
A comprehensive array of drawing and editing tools for customizing your maps.
Thousands of ready-made maps and functions for creating your own maps.
Crystal Reports, the industry-standard report-writing program, allows you to create reports of
your tabular data directly in the product.
A layout window for preparing output.
Printing and export capabilities for high-quality output
The ability to change the projection of your map for display or digitizing.
Object processing functions that help to correct errors in data, set node snap tolerances for
different objects, as well as thin nodes and polygons.
When it’s time to run MapInfo Professional, you’ll feel right at home with its windowing environment.
After you’ve organized your data visually, you’ll save the results to files, or send them to your printer
or plotter.
For tips to help you succeed in using MapInfo Professional, see Ensuring Your Success in the Help
System.
MapInfo Professional Documentation Set
The MapInfo Professional User Guide contains a subset of the information found in the MapInfo
Professional online help system. If you cannot find the information you are looking for, refer to the
online help system, which is installed with the product.
Accessing MapInfo Professional Documentation
You can access the MapInfo Professional files in the Documentation subfolder located in your
installation directory. You can read these files using Adobe® Acrobat Reader, which is available on
the installation DVD or by going to the Adobe web site:
http://get.adobe.com/reader/
Obtaining the User Guide in Hard Copy
To obtain a printed copy of the MapInfo Professional User Guide, see the instructions on the
postcard provided in your MapInfo Professional box or go to our website at
http://go.pbinsight.com/prodocs
MapInfo Professional 10.5
18
User Guide
Chapter 1: Introduction
Getting Support
Getting Support
Here at Pitney Bowes Software Inc., we are committed to your success and we provide a wide range
of support to assist you in getting the results you are working toward.
•
•
•
•
Using the Status Bar
Using the Help System
Getting Technical Support
Tell Us What You Think!
MapBasic Available Free of Charge on the Web
The MapBasic development environment is a free download available from www.pbinsight.com.
To get your copy, go to www.pbinsight.com/mapbasic. There is also information there about
building custom applications and integrating MapInfo Professional into your application using the
MapBasic development environment. For additional SDK development environments, go to
www.pbinsight.com/mapxtreme.
To obtain your free copy of MapBasic and access other resources to enhance your use of MapInfo
Professional, you need to register on the Pitney Bowes Software Inc. site before accessing this
download page.
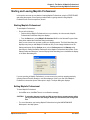
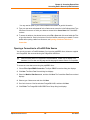
Using the Status Bar
The Status Bar along the lower edge of your window provides helpful information during your
mapping session and allows you to make some changes directly in the Status Bar. On the Options
menu, click Show/Hide Status Bar to control the display of the Status Bar.
L
•
•
•
•
•
•
Not all entries display in the Status Bar at all times. Entries display when a feature is active.
Status Bar Help: For instantaneous answers to “What does that command do” simply move the
cursor over the command. A brief description of the command displays in the left pane of the
Status Bar along the lower edge of your screen.
Zoom, Map Scale, Cursor Location: View any one of these settings in the Status Bar. You can
change which one displays directly from the Status Bar. Click the arrow on the right side of the
box to display a popup list of the three options. Click the setting you want to display. The Status
Bar automatically updates. These display settings are also controlled in the Map Options dialog
box (on the Map menu, click Options).
Editable Layers: To keep track of which layer is currently editable, review the list of layers that
display in the Status Bar. You can change the editable layer directly in the Status Bar. Click the
arrow to the right of the box to display a popup list of the layers in the Map window. Click the
layer you want to make editable. The Status Bar automatically updates, showing the new
editable layer.
Selectable Layers: The Status Bar indicates which layer the current selection is from. If there is
nothing selected, the Status Bar reads: “Selecting: NONE.”
Browser window Records: When viewing a table in a Browser, the record count displays in the
Status Bar.
Snap-to-Node: This S-key toggle feature is in use when SNAP displays in the Status Bar.
MapInfo Professional 10.5
19
User Guide
Chapter 1: Introduction
Getting Technical Support
•
•
Autotrace indicator: This T-key feature is in use when AUTOTRACE displays in the Status Bar.
Autonode indicator: This N-key feature is in use when AUTONODE displays in the Status Bar.
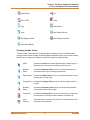
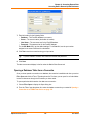
Using the Help System
MapInfo Professional’s comprehensive Online Help system provides the information you need to
learn and use the product more effectively. You can reach the information in several ways:
•
•
•
•
•
•
Use the Help Contents screen to choose topics from “books”. Click a book to display its topics,
choose a topic from the list.
Use the Search feature to search on a specific word. Type the word you want to search for in the
first field, select the matching word in the second, and then the topic in the third box. MapInfo
Professional displays the topic in the pane on the right.
Use the Index feature to find a topic quickly. Type the first few letters of the word you are looking
for. The index entry that most closely matches your entry is highlighted. Click the index entry you
want to display.
Use the Favorites tab to collect and store topics you want to refer to frequently.
Context-Sensitive Feature: Press the F1 key to receive more information on any menu command
or dialog box. The Help window for that item displays. Also click the Help button in the MapInfo
Professional dialogs to display information on the current dialog box.
Quick Access to the publications web site: Click the underlined Pitney Bowes Software Inc.
name at the bottom of each topic page to go to the Pitney Bowes Software Inc. web site. From
here you have access to product information, upcoming events, tech tips, and a complete set of
documentation.
Getting Technical Support
Pitney Bowes Software Inc. offers a free support period on all new software purchases and
upgrades, so you can be productive from the start. Once the free period ends, Pitney Bowes
Software Inc. offers a broad selection of extended support services for individual, business, and
corporate users.
Technical Support is here to help you, and your call is important. This section lists the information
you need to provide when you call your local support center. It also explains some of the technical
support procedures so that you will know what to expect about the handling and resolution of your
particular issue.
Please remember to include your serial number, partner number or contract number when
contacting Technical Support.
Contacting Technical Support
Full technical support for MapInfo Professional is provided for the currently shipping version plus the
two previous versions.
To use Technical Support, you must register your product. This can be done very easily during
installation or anytime during normal business hours by contacting Customer Service directly.
MapInfo Professional 10.5
20
User Guide
Chapter 1: Introduction
Getting Technical Support
Technical Support Contact Information
Extended support options are available at each of our technical support centers in the Americas,
Europe/Middle East/Africa, and Asia-Pacific regions. To contact the office nearest you, refer to the
Support > Contact Support section on our website:
http://www.pbinsight.com/support/contact-support/
Technical Support Online Case Management System
The Technical Support Online Case Management system is another way to log and manage cases
with our Technical Support center. You must register yourself the first time you access this site if you
do not already have a user ID.
http://go.pbinsight.com/online-case-management
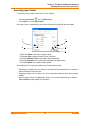
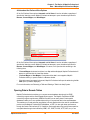
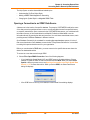
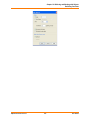
Tell Us What You Think!
Want to give MapInfo Professional Engineers feedback? We have an option in the Help menu
for you to provide direct product feedback to Pitney Bowes Software Inc.. If you have a need for a
new feature, or you need our product to do something it doesn’t currently do, use this feature to write
to us. Whether you want to complain or complement, let us know so we can meet your MapInfo
Professional needs better.
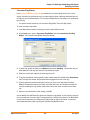
To send us feedback:
•
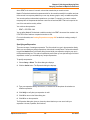
Choose Help > Send Product Improvement Suggestions to display the customer
feedback form.
Our team of Product Managers and Engineers will collect your feedback and consider your request
in a future release of MapInfo Professional. You will be able to track the activity on your suggestions
through different statuses and maintain a list of your ideas or suggestions. Your suggestions will be
grouped with other similar ideas to help us build a list of new features and workflows for the
application. You may be invited to give your feedback on the scoping and implementation of these
suggestions and participate in surveys that help us narrow down the priority of the features we are
working on.
Our goal is to ensure that MapInfo Professional stays on the forefront of your needs and product
requirements. Help us do that important work for you!
MapInfo Professional 10.5
21
User Guide
What’s New in MapInfo
Professional
Thank you for upgrading to the most advanced computer mapping product in
the Pitney Bowes Software Inc. software family! As the field of computer
mapping continues to expand, Pitney Bowes Software Inc. leads the way with
new products that are designed to fulfill your computer mapping needs from the
most basic to the most specialized.
For more information about the bug fixes and corrections we have made to
MapInfo Professional in this release, you will soon be able to review the release
notes at:
http://go.pbinsight.com/prodocs
Topics in this Section:
New Major Features in MapInfo Professional . . . . . . . . . . . . . . . .23
Mapping – New and Enhanced Features . . . . . . . . . . . . . . . . . . . .26
Data Access Features . . . . . . . . . . . . . . . . . . . . . . . . . . . . . . . . . . .28
Data Enhancements . . . . . . . . . . . . . . . . . . . . . . . . . . . . . . . . . . . . .29
New and Existing Tools . . . . . . . . . . . . . . . . . . . . . . . . . . . . . . . . . .29
New in Documentation. . . . . . . . . . . . . . . . . . . . . . . . . . . . . . . . . . .32
2
Chapter 2: What’s New in MapInfo Professional
New Major Features in MapInfo Professional
New Major Features in MapInfo Professional
Cursors have a new Look
Cursors have been updated to have an improved look. Their behaviors have not changed only how
they look has changed. Look for this improvement when working with MapInfo Professional.
Cursor updates include:
•
•
•
•
Using a tool within MapInfo Professional, such as zoom, select, or add object.
Dragging layers within the layer control.
The updated crosshair cursor is now larger and more visible than the previous version.
MapBasic applications that create their own toolbar for a Toolbutton with a built-in cursor. For
example:
Create ButtonPad As Toolbutton <other params> Cursor <num>
L
There is no change to behavior of custom cursors from external resource files.
Cursor <num> File <resource filename>
For MapBasic, the cursor definitions in icons.def have been updated to contain a list of the valid
cursor numbers.
Docking Windows and Tools
You can dock windows, such as the Layer Control and Table List, and some tools, such as Named
Views and Catalog Browser, to the sides (top, bottom, left, and right) of MapInfo Professional.
When docked, windows can share the same space—you may dock multiple windows to the same
side of the screen.
To dock a window or a tool:
•
Click on the window’s or tool’s title bar and drag the mouse over one of the visual cues (arrows)
to dock it to a side of the application. If visual cues are turned off, drag it to one of the sides of the
application.
The windows and tools are in a fixed position when they are docked. When windows and tools are
not docked, they are floating and can be moved anywhere in the application.
Changing from dock state to a floating state:
•
Click the window’s or tool’s title bar and drag it away from the area. The window or tool is
restored to its previous size.
MapInfo Professional 10.5
23
User Guide
Chapter 2: What’s New in MapInfo Professional
New Major Features in MapInfo Professional
There are visual cues, arrows, that display by default to help you when docking a window or a tool.
Drag the window or tool to one of the arrows to dock it at that location.
To enable or disable the visual cues for docking windows or tools:
•
Select Options > Preferences > System Settings and then select the Show Guides when
Docking Windows check box.
Printing
Printing to an Offscreen Bitmap
The Advanced Printing Options dialog box (select File > Print and click Advanced) includes a new
output method in addition to Print Directly to Device and Print using Enhanced Metafile (EMF).
This can be useful to control transparency and color, particularly for raster images:
Print using Offscreen Bitmap (OSBM)
This printing process generates an Offscreen bitmap of your MapInfo Professional image
before sending it to the printer. Offscreen bitmap is invoked depending upon the type of
translucent content in the map and enhanced rendering state of the window. However,
setting OSBM from this window means that while printing Offscreen bitmaps (OSBM) will be
selected regardless of the translucency and anti alias settings.
Setting Print to an Offscreen Bitmap as your Default
You can set this option as a default by selecting Options > Preferences > Output and then
selecting Print using Offscreen Bitmap (OSBM) under the Printing tab. This preference sets the
default for all new windows.
Subdivide Printing
In earlier versions of MapInfo Professional, there was an optional registry setting, called
SubdividePrinting, to allow print jobs to be broken into multiple, smaller print requests. This is
especially useful if printing large raster/translucent maps to large paper sizes. Now that option has
been added as a Preference. The preference is initialized using the registry setting if it existed. You
will find this option in Options > Preferences > Output Settings under the Printing tab. There is a
check box for Subdivide Printing. If checked, the print job will be broken into multiple smaller print
request. If unchecked, the print is done in a single request.
Polygon Mode Printing
In earlier versions of MapInfo Professional, there was an optional registry setting, called
PolygonMode, that controlled how polygons (regions) are rendered. For many years, MapInfo
Professional has done some special processing when rendering polygons. This can include
breaking the polygons into smaller, simpler sections to make the rendering code deal with less
complex data. The end result (visual appearance) should be the same, regardless of which method
is used to draw the regions. If Polygon Mode is not set, then the old rendering with special
processing is done. If Polygon Mode is set, the new rendering that draws the object as a single
request with all nodes is done. In certain circumstances printing to PDF files would produce extra
MapInfo Professional 10.5
24
User Guide
Chapter 2: What’s New in MapInfo Professional
New Major Features in MapInfo Professional
hairlines in the output if Polygon Mode is turned off. But, users have also reported PDF files getting
large and being slow to produce when PolygonMode is on. So the general recommendation is to
turn on Polygon Mode if you see extra hairlines in PDF files.
Polygon Mode may be set for each of three types of drawing: on-screen, printing and exporting.
Select the Polygon Mode check box from the Options > Preferences > Output Settings menu
under the Display tab, Printing tab, and Exporting tab.
Printing to PDF
The MapInfo PDF Printer has been updated to a new version for 10.5. MapInfo Professional lets you
save a map to a layered PDF file. Since Acrobat 6.0, PDFs are capable of holding multiple pages of
information in the same space through the use of Optional Content Groups (OCG), which are more
commonly known as layers. Layers in PDFs are very similar to MapInfo Professional map layers.
Your PDF now displays layers in the same order as shown in the MapInfo Professional Layer
Control window, and it displays translucency. The MapInfo PDF Printer supports GeoRegistration,
which stores the bounds and coordinate systems of the map view in the PDF file. The PDF file also
stores the attribute data of the records on the map.
New in this release when saving to a PDF file:
•
Print to PDF – Select File > Print to PDF to save your map, browser, graph, or layout to a PDF
file. This option is similar to Save As, and gives you the option to concatenate PDF files.
•
MapInfo PDF Printer tool – The Main menu includes a new MapInfo PDF Printer
tool,
which is the same as selecting File > Print to PDF to save your map, browser, graph, or layout
to a PDF file.
Translucency – You can create a layered PDF that includes translucent layers in MapInfo
Professional 10.5.
PDF Preferences – The MapInfo Professional Print dialog (select File > Print) now includes a
PDF button that displays after selecting MapInfo PDF Printer from the Name list. This button
launches the PDF Preferences dialog. From this dialog, you can make the following settings:
•
•
Layered PDF
Select to save layers for a map, as shown in the MapInfo Professional Layer Control window,
to the PDF file. When saving a layout window, each frame, such as map frame and legend
frame, becomes a layer in the PDF.
Georegistered PDF
Select to store the bounds and coordinate systems of the map or layout view in the PDF file.
Add Attribute data to PDF
Select to store the attribute data of the records on the map in the PDF file.
MapInfo Professional 10.5
25
User Guide
Chapter 2: What’s New in MapInfo Professional
Mapping – New and Enhanced Features
Automatically open the PDF
Select to have the PDF file open after it is generated.
Selecting the Layered PDF option in the PDF Preferences dialog box enables the Direct to
Device option, and disables using OSBM and EMF.
If you select the Print using EMF and Print using the Offscreen Bitmap (OBSM) output method
and later on select the Layered PDF from the PDF Preferences dialog box, then the output
method forcibly sets to Direct to Device. However, disabling the Layered PDF option resets the
print output method back to your original selection, EMF/OSBM.
•
Context Sensitive Help for the MapInfo PDF Printer – This version of the MapInfo PDF Printer
includes documentation in the form of a help system. To access this help system, select File >
Print and click Properties in the Print dialog box. This opens the MapInfo PDF Printer
Properties dialog box, which now includes a Help button on each tab.
Mapping – New and Enhanced Features
Table List
The Table List window lets you perform operations for open tables in MapInfo Professional using
fewer clicks. You can organize tables into groups and sort them alphabetically and recently opened
first. It is now easier to manage maps that have multiple tables open at the same time. It is
accessible from the Table > Table List menu.
For more information about the Table List and how to work with it, see Working with Tables in the
Table List on page 45.
Adding Map Tile Server Layers and Bing™ Layers to your Maps
A tile server is a server that contains a collection of raster tile images. The tiles cover a given place
on the earth. Tiles are organized in a row/column grid fashion. There are also multiple levels of tiles.
Each level represents a different resolution of data, covering the same place on the earth. The level
determines the number of tiles (number of rows and columns). As you zoom in or out, the level of
data may change. As you pan around, the specific tiles that are needed may change.
MapInfo Professional lets you use tile server data within the product. If you add a tile server layer to
a MapInfo Professional map, then the application takes care of fetching the appropriate tiles from the
server and displaying them. You only need to add the tile server layer and then pan/zoom.
For information about map tile server setup, see Enhancing Map Data using a Mapping Tile
Server on page 414.
With a single click, you can easily add either a Microsoft Bing Aerial or Microsoft Bing Hybrid layer to
a map. You do not need to open the Bing table prior to adding it to the map. If the current window is
a map, MapInfo Professional adds the Bing layer to it. If the current window is not a map or there are
no windows open, then MapInfo Professional creates a new map with the Bing layer. For
instructions, see Adding a Microsoft Bing Layer to a Map on page 417.
MapInfo Professional 10.5
26
User Guide
Chapter 2: What’s New in MapInfo Professional
Mapping – New and Enhanced Features
Applying Style Overrides for when Zooming the Map
At different zoom levels information on the map may be difficult to view. Changing (overriding) the
display style for specific zoom levels can help. As an example, to make the map easier to read, you
may want roadways to display using a thick line when zoomed in to the map, but a very thin line
when zoomed out of the map. For similar reasons you may want to change the label style for specific
zoom levels, to have labels stand out and read more clearly.
Right-clicking on a layer name in the Layer Control list and clicking the Add Display Override option
creates a display override for that layer. Clicking the Add Label Override option creates a label
override for that layer. The first override defaults to the zoom range of the layer. Adding subsequent
overrides splits the zoom range of the first override. You can then customize the style for the layer at
each specific zoom level.
For more information, see the following topics in the Help System:
•
•
•
•
•
•
Setting Different Styles for Different Zoom Levels
Setting Different Label Styles for Different Zoom Levels
Changing Override Style Properties already set for Different Zoom Levels
Splitting an Override Property
Removing an Override Property
Drag and Drop an Override to a Different Layer
Stacking Styles to Customize Map Features
Stacked styles are new to MapInfo Professional 10.5. A stacked style is a list of styles drawn on top
of each other to create a more complex or interesting looking map feature. Stacked styles can be
created for points, polylines, and polygon features. This is especially useful for polyline styles.
Figure 1 shows a sample line using one of MapInfo's interleaved line styles. Figure 2 shows the
same sample using a stacked line style.
Figure: Figure 1:
Figure: Figure 2:
Stacked styles create more meaningful display styles for your application without having to add your
data as multiple layers in a map. You can define as many styles in a stacked style as you want.
However, the more styles you define the more you will impact the map's rendering performance.
Typically, most cartographic maps would use two or three styles in a stacked style to draw features.
MapInfo Professional 10.5
27
User Guide
Chapter 2: What’s New in MapInfo Professional
Data Access Features
For more information about using stacked styles, see the following topic in the Help System:
•
Stacking Styles for a Layer
New Coordinate Systems and Projections
There are enhancements for European, French, Australian, Finnish, United States, Slovenian and
Zambian coordinate systems. For a detailed list of enhancements, see Coordinate System and
Datum Additions for MapInfo Professional 10.5 on page 468.
Equidistant Cylindrical Projection
The Equidistant Cylindrical projection (also called the Equirectangular projection, geographic
projection, Plate Carrée or Carte Parallelogrammatique projection or CPP) is a very simple map
projection attributed to Marinus of Tyre, who Ptolemy claims invented the projection about 100 AD.
The projection maps meridians to equally spaced vertical straight lines, and circles of latitude to
evenly spread horizontal straight lines. The projection is neither equal area nor conformal. Because
of the distortions introduced by this projection, it has little use in navigation or cadastral mapping and
finds its main use in thematic mapping. In particular, the Plate Carrée used often in computer
applications that process global maps, because of the particularly simple relationship between the
position of an image pixel on the map and its corresponding geographic location on Earth.
X
X
Range
False Northing
Scale Factor
False Easting
X
Azimuth
X
Standard Parallel 2
X
Standard Parallel 1
Origin, Longitude
X
Origin, Latitude
Units
Equidistant Cylindrical 33
Datum
Projection Name
Projection Type
The Plate Carrée (French, for "flat square"), is the special case where standard parallel is zero.
The following examples are of PRJ entries for Plate Carrée and Equidistant Cylindrical projection
centered at 46.5 degree Standard Parallel (used in France):
"Plate Carree WGS84", 33, 104, 7, 0, 0, 0, 0
"Equidistant Cylindrical 46.5 Degree WGS84", 33, 104, 7, 0, 46.5, 0, 0
Data Access Features
MapInfo Professional now supports:
•
PostgreSQL 8.3 with PostGIS 1.3
PostGIS extends a PostgreSQL database to support spatial data (geographic objects). PostGIS
follows the OpenGIS Simple Features Specification for SQL.
MapInfo Professional 10.5
28
User Guide
Chapter 2: What’s New in MapInfo Professional
Data Enhancements
For details about working with PostGIS and other databases, see Chapter 6: Accessing Remote
Data.
Data Enhancements
For this release of MapInfo Professional, we have updated the sample data to include database files
for Microsoft Office 2007 Access (.ACCDB) and Excel (.XLSX).
See the MapInfo Professional Data Directory document on the MapInfo Professional DVD for a
description of the sample data supplied with this product.
New and Existing Tools
Catalog Browser
The Catalog Browser is a tool in MapInfo Professional that allows you to locate descriptive
information about spatial and non-spatial datasets. This information is often referred to as metadata.
Metadata describes information about the data, such as its title, creation/modified date, coordinate
reference system and location.
Metadata is stored in a catalog as individual records for each dataset. Organizations, particularly
those in the public sector, make their catalogs known to others to describe and advertise the
availability of their spatial datasets. The Catalog Browser enables you to see what data is available
and how to get it.
The Catalog Browser can search any available CSW-compliant catalog. Note that some catalog
capabilities are limited by the organization who owns the catalog, such as the ability to edit metadata
and access datasets for free. Information from the owner organization is provided in the metadata
for each record.
You can search and view metadata records with the Catalog Browser. In the future, a CSWcompliant Catalog service and catalog from Pitney Bowes Business Insight will be available as a
separate purchase that support enhanced operations, such as records management and harvesting.
For how to work with the Catalog Browser, see the Catalog Browser User Guide, which is the
Catalog Browser’s help system.
The Catalog Browser autoloads. In MapInfo Professional click the Search CSW Catalog
or File > Open Web Services > Search CSW Catalogs.
tool
Information about the Catalog Browser is in the MapInfo Professional Help System.
MapInfo Professional 10.5
29
User Guide
Chapter 2: What’s New in MapInfo Professional
New and Existing Tools
Synchronize Windows
The Synchronize (Sync) Windows tool gives you access to tool bar buttons that allow you to control
what displays on selected, open Map windows. This tool allows you to automate common MapInfo
Professional tasks and creates a way to control the addition and removal of embedded legends. The
Sync Windows tool allows you to automatically share changes made in one mapper window to all
other open Map windows in a given MapInfo Professional session.
Now you can dock the Sync Windows toolbar along the sides of the MapInfo Professional window.
New on this toolbar is the Instant Sync Windows button, which provides a way to enable/disable
the synchronization of multiple map windows.
To use the Sync All Map Windows, add the Sync Windows tool to the Tool Manager list:
1. On the Tools menu, click Tool Manager to display the Tool Manager dialog box.
2. Scroll through the list of tools to find Sync Windows and then select the Loaded check box.
Selecting the Autoload check box loads this tool every time MapInfo Professional starts.
3. Click OK.
The Sync Windows toolbar displays and a new option is available from the Tools menu: Tools >
Sync Windows.
Figure: Sync Windows Toolbar
1
2
3
4
5
6
7
8
9
10
1 Clone Map Window, 2 Rename Current Window, 3 Tile Windows
4 Sync All Map Windows, 5 Instant Sync Windows, 6 Create a Symbol on All
Cosmetic Layers, 7 Create a Polyline on All Cosmetic Layers, 8 Create a Rectangle on
All Cosmetic Layers 9 Create an Ellipse on All Cosmetic Layers, 10 Clear All Cosmetic
Layers
Named Views
The Named Views tool saves a map’s view, position and zoom settings, so you can return to them
as needed. This is useful if there is a neighborhood or other area you need to refer to frequently. The
Named Views window is dockable.
You can use other user's list of views by copying the NViews.XML file to the following location:
MapInfo Professional 10.5
30
User Guide
Chapter 2: What’s New in MapInfo Professional
New and Existing Tools
%APPDATA%\MapInfo\MapInfo\nviews.xml
L
L
If you overwrite your Nviews.XML file with that of another user, you will lose your existing
views information. To retain your existing views, keep a copy of your Nviews.xml file and
restore it at the same location, when required.
If you want to use views created in MapInfo Professional 10.0, copy the Nviews.XML file from
%APPDATA%\MapInfo\MapInfo\Professional\1000\nviews.xml to the new location
%APPDATA%\MapInfo\MapInfo\nviews.xml
To create a named view:
1. Display the map at the exact position and zoom level you want to return to.
2. Select Tools > Named Views > Named Views to display the Named Views dialog box.
3. Click Add and type a description of the current map view. Click Add to save your description.
L
Views you create with the Named Views tool are global and are saved independently of the
workspaces and tables they are associated with. If you delete the list of views, you delete
these views.
Feature Manipulation Engine (FME)
This release updates the Feature Manipulation Engine (FME) tool to a new version. The FME opens
a variety of Universal Data formats. For a complete list, see Using Universal Data Directly on
page 344.
FME now supports Google Earth KML® files in MapInfo Professional 10.5. The SQL Server support
has been turned off. For full SQL Server 2008 read and write support, open SQL Server tables using
ODBC via MapInfo Professional.
L
You cannot open a SQL Server table through Open Universal Data. If you open an existing
table or workspace that references a SQL Server database, then an error message displays.
To access the FME to open universal data directly in MapInfo Professional, choose File > Open
Universal Data. For details, see Opening Universal Data Directly on page 345.
MapCAD
This release updates the MapCAD tool to a new version. This product provides tools that work with
MapInfo Professional to create maps that are appropriate for land development and surveying tasks.
The MapCAD tool includes a new look for icons, improved processing time, and you can now dock it
along the sides of the MapInfo Professional window.
MapInfo Professional 10.5
31
User Guide
Chapter 2: What’s New in MapInfo Professional
New in Documentation
The MapCAD tool installs automatically with MapInfo Professional to a subfolder called MapCAD. To
access MapCAD drawing and editing tools and toolbars, from the MapInfo Professional Tools
menu, select Tool Manager > MapCAD. The manufacturer provides a full help system to assist you
in using this product. For support, contact MapCAD Incorporated directly. Their web site is:
http://www.geoas.de
Geographic Tracker Tool
This release updates the global positioning software (GPS) GeoTracker tool to a new version. This
tool (from Blue Marble Geographics) integrates a Geographic Positioning Systems (GPS) with
MapInfo Professional. It is a free utility available as a separate download from the MapInfo
Professional DVD.
Blue Marble Geographics has upgraded this tool to with new look and feel and improved
performance. The Geographic Tracker supports streaming of live GPS position data, playback of
recorded GPS log files and transfer of spatial data both to and from various GPS units. Geographic
Tracker reads GPS information from a GPS receiver, decodes the information into component parts
such as Latitude, Longitude, Time, Speed, Heading, etc., and displays the information in an intuitive
and useful user interface. Users can also save or view GPS log files through Geographic Tracker's
interface.
This tool is available as a separate download from the MapInfo Professional DVD: click Install
Products, click Free Utilities, and then click Install GPS Support. For detailed installation
instructions, refer to the MapInfo Professional Install Guide.
New in Documentation
Graphing Your Data
Additional information about the MapInfo Professional graphing feature is available in a new chapter
titled Graphing Your Data on page 108. The graphing feature in MapInfo Professional lets you
create a myriad of different graphs from three-dimensional bar graphs to exploded pie graphs. Each
type of graph has its own set of features that you can customize to emphasize a particular piece of
information, or create the aesthetic look you want for your graph. These features, plus additional
formatting options, give you full control over the look and content of the graph.
This new chapter provides additional information to help you determine the type of graph to select.
Creating a MapInfo_MapCatalog Manually
A new chapter Manually Creating a MapInfo_MapCatalog on page 474 provides instructions on
how to manually creating a MapInfo Map Catalog and making a remote table mappable, two
procedures that are necessary for geocoding remote tables. This information is designed for users
who do not have access to MapInfo Professional.
MapInfo Professional users would create a MapInfo Map Catalog automatically.
•
Creating a MapInfo_MapCatalog Automatically
MapInfo Professional 10.5
32
User Guide
Chapter 2: What’s New in MapInfo Professional
New in Documentation
•
Making a Remote Table Mappable
You or your database administrator must create one MapInfo Map Catalog for each database you
wish to access in MapInfo Professional.
MapInfo Professional 10.5
33
User Guide
The Basics of MapInfo
Professional
Now that you have installed MapInfo Professional, you are probably anxious to
get mapping. But, if you are new to MapInfo Professional, take a few minutes to
read this chapter to familiarize yourself with the concepts, components, and
tools for successful computer mapping.
Topics in this Section:
Starting and Leaving MapInfo Professional. . . . . . . . . . . . . . . . . .35
A Tour of the MapInfo Professional Desktop. . . . . . . . . . . . . . . . .36
Understanding Your Data in MapInfo Professional . . . . . . . . . . . .43
Working with Tables in the Table List. . . . . . . . . . . . . . . . . . . . . . .45
Working with Layers in the Layer Control . . . . . . . . . . . . . . . . . . .51
Working with Thematic Layers . . . . . . . . . . . . . . . . . . . . . . . . . . . .62
Working with Seamless Layers. . . . . . . . . . . . . . . . . . . . . . . . . . . .65
Data – Where MapInfo Professional Begins . . . . . . . . . . . . . . . . .69
Reviewing the Windows in MapInfo Professional . . . . . . . . . . . . .77
Saving, Closing, and Exporting Your Work . . . . . . . . . . . . . . . . . .83
Using the Tools in the Tool Manager . . . . . . . . . . . . . . . . . . . . . . .89
File Format Types Supported . . . . . . . . . . . . . . . . . . . . . . . . . . . . .90
3
Chapter 3: The Basics of MapInfo Professional
Starting and Leaving MapInfo Professional
Starting and Leaving MapInfo Professional
In this section we cover the very basics of starting MapInfo Professional, using the STARTUP.WOR,
and exiting the program. Since opening a table is basic to getting started in using MapInfo
Professional, we cover that topic here, as well.
Starting MapInfo Professional
To start MapInfo Professional:
•
Do one of the following:
• Double-click the MapInfo Professional icon on your desktop. In a few seconds, MapInfo
Professional’s Quick Start dialog box displays.
• From the Start menu, select MapInfo Professional 10.5 from the Selected Program folder.
Using either method the Quick Start dialog box displays.
Here you can choose how you want to start your mapping session. The Quick Start dialog box
displays every time you start MapInfo Professional, but you can change this behavior in the
Startup preferences (On the Options menu, point to Preferences and click Startup) using
instructions in Setting the Startup Preferences in the MapInfo Professional Help System. In the
Startup Preferences dialog box, clear the Display Quick Start dialog box to deactivate the display
of the Quick Start dialog box.
If you are returning to MapInfo Professional, you can return to the previous mapping session by
choosing Restore Previous Session or use last workspace. If this is your first look at MapInfo
Professional, choose the Open a Table option to begin. The Open dialog box displays.
Exiting MapInfo Professional
To leave MapInfo Professional:
•
On the File menu, click Exit. There is no confirmation message.
CAUTION:
•
If you made changes to a table and did not save them a prompt appears asking
you if you want to save the changes. Unless you choose Save, the changes are
lost.
For more information, see Leaving MapInfo Professional using the MAPINFOW.WOR
Workspace in the Help System.
MapInfo Professional 10.5
35
User Guide
Chapter 3: The Basics of MapInfo Professional
A Tour of the MapInfo Professional Desktop
A Tour of the MapInfo Professional Desktop
This section details the tools and commands that are available to you in the MapInfo Professional
product. You may refer to these frequently as you familiarize yourself with MapInfo Professional.
Working with Toolbars
MapInfo Professional provides toolbars of tool buttons and commands to give you tremendous
mapping creativity at the click of a button.
To reshape the toolbars, click and drag on their borders. Drag the title bar to move them. To dock a
toolbar, drag it to one of the edges of the application window. The toolbar changes shape and
positions as it docks itself. You can easily change it back to the floating view by clicking the
background area of the toolbar and dragging it away from its position. The toolbar retains the same
shape as it had before you docked it.
Displaying or Hiding Toolbars
To show or hide toolbars:
1. Choose Options > Toolbars.
2. Show a toolbar by checking its check box or clear its check box to hide a toolbar.
3. Click Close. The toolbars display or disappear from your screen.
Reviewing the Standard Toolbar
The Standard toolbar contains tools for commonly performed menu functions from the File, Edit, and
Window menus. It also contains tools for quick access to a Redistricting window and online Help.
Many of these tools are familiar to you from working with Microsoft Windows.
New Table
Help
Open Workspace
Open
Bing Aerial
Save Table
Bing Hybrid
Close All
Save Workspace
Print Window
MapInfo Professional 10.5
36
User Guide
Chapter 3: The Basics of MapInfo Professional
A Tour of the MapInfo Professional Desktop
Save Window
Cut
Print To PDF
Paste
Copy
New Browser
Undo
New Grapher Window
New Mapper Window
New Redistricter Window
New Layout Window
Reviewing the Main Toolbar
The Main toolbar contains buttons for selecting objects, changing the view of the Map window,
getting information about an object, and showing distances between objects. It also contains buttons
that allow you to change layer attributes and open the Legend or Statistics window.
Select
Accesses the Select tool to select objects/records in a Map, Layout, or
Browser window. Also acts as the default pointer/cursor tool.
Marquee
Select
Accesses the Marquee Select tool so you can select and search for
map objects within a given rectangle (marquee box).
Radius Select
Accesses the Radius Select tool so you can select and search for map
objects within a circular region.
Polygon Select
Accesses the Polygon Select tool so you can select objects within a
polygon.
Boundary
Select
Accesses the Boundary Select tool so you can select and searches
for map objects within a given region.
Unselect All
Accesses the Unselect All tool so you can clear all of your object and
record selections. Performs the same operation as Unselect All.
Invert
Selection
Selects all objects or records not included in the current selection, and
cancels the current selection.
MapInfo Professional 10.5
37
User Guide
Chapter 3: The Basics of MapInfo Professional
A Tour of the MapInfo Professional Desktop
Graph Select
Accesses the Graph Select tool. As you click graph objects, such as a
riser bar, pie slice, column, etc., this tool selects the corresponding
records from the table.
Zoom-in *
Accesses the Zoom-in tool to get a closer area view of a map or layout.
Zoom-out *
Accesses the Zoom-out tool so you can get a wider area view of a map
or layout.
Change View *
Accesses the Change View dialog box so you can specify settings for
Map window width, map scale, resizing, and centering.
Grabber *
Accesses the Grabber tool so you can reposition a map or layout within
its window.
Info tool *
Accesses the Info tool so you can view the tabular data that is
associated with a map object.
HotLink
Accesses the HotLink tool, so you can launch active objects such as
files or URLs from your Map window.
Label
Accesses the Label tool so you can label objects with information from
the related database.
Drag Map
Window *
Accesses the Drag Map Window button to drag an MapInfo
Professional map into an OLE container application.
Layer Control
Accesses the Layer Control window so you can specify how the various
tables in a Map window are layered and displayed.
Ruler
Accesses the Ruler tool to determine the distance between two points
and the length of some path.
Show/Hide
Legend
Accesses the Legend window for maps or graphs.
Show/Hide
Statistics
Accesses the Statistics window to tally the sum and average of all
numeric fields for the currently chosen objects or records.
Set Target
District from
Map
Sets the target district from the map during a Redistricting session.
Assign
Selected
Objects
Assigns selected objects to the target district during a Redistricting
session.
MapInfo Professional 10.5
38
User Guide
Chapter 3: The Basics of MapInfo Professional
A Tour of the MapInfo Professional Desktop
Clip Region
On/Off
Redisplays the entire map.
Set Clip
Region
Isolates a map region for display.
Create a Scale
Bar
Access the Create Scale Bar dialog box, so that you can add a scale
bar to the mapper window.
Table List
Accesses the Table List so that you can view a list of open tables,
perform operations on them, and organize or sort them into groups.
* These tools are also available when you access your MapInfo .TAB map within a container
application such as MS Word, PowerPoint, etc.
Reviewing the Drawing Toolbar
The Drawing toolbar contains tools and commands that are used to create and edit map objects. For
more about how to use these buttons, see Using the Drawing and Editing Commands on
page 158.
Symbol
Accesses the Symbol tool, which allows you to place point symbols on
your map like “push pins.”
Line
Accesses the Line tool, which allows you to draw straight lines.
Polyline
Accesses the Polyline tool, which allows you to draw polylines (an open,
connected sequence of lines).
Arc
Accesses the Arc tool, which allows you to draw an arc the size and shape
of one quarter of an ellipse.
Polygon
Accesses the Polygon tool, which allows you to draw polygons (a closed,
connected sequence of lines).
Ellipse
Accesses the Ellipse tool, which allows you to create elliptical and circular
objects.
Rectangle
Accesses the Rectangle tool, which allows you to draw rectangles and
squares.
Rounded
Rectangle
Accesses the Rounded Rectangle tool, which allows you to draw rounded
rectangles and squares.
Text
Accesses the Text tool, which allows you to add titles, labels, and
annotation to maps and layouts.
MapInfo Professional 10.5
39
User Guide
Chapter 3: The Basics of MapInfo Professional
A Tour of the MapInfo Professional Desktop
Frame
Accesses the Frame tool, which allows you to create frames in the Layout
window to display maps, graphs, browsers, and legends.
Reshape
Toggles in and out of Reshape mode. Reshape allows you to edit regions,
polylines, lines, arcs, and points by moving, adding, and deleting nodes that
define them.
Add Node
Accesses the Add Node tool, which allows you to add a node to regions,
lines, or polylines when you are in Reshape mode.
Symbol
Style
Accesses the Symbol Style dialog box where you can change the style,
color, and size of a symbol object.
Line Style
Accesses the Line Style dialog box where you can change the style, color,
and width of line objects.
Region
Style
Accesses the Region Style dialog box where you can change the fill
pattern, color, and background, plus the border style, color, and width of
region objects.
Text Style
Accesses the Text Style dialog box where you can change the font
typeface, size, style, color, and background of text objects.
Reviewing the DBMS Toolbar
The DBMS Toolbar contains buttons and commands that are used to access tables residing on a
remote database. These options are only available if you have installed a relational database
manager.
Open DBMS Table
Accesses the Open dialog box, which allows you to access a
remote database. If a connection has not been established, you
are prompted to open one. This button is also found in the
Open dialog box if DBMS is installed.
Refresh DBMS Table
Accesses the Refresh DBMS Table dialog box, which allows
you to refresh a MapInfo Professional linked or live table with
the most recent data residing on the remote database for that
linked or live table.
Unlink DBMS Table
Accesses the Unlink DBMS Table dialog box, which allows you
to unlink a downloaded table from its remote database.
Make DBMS Table
Mappable
Accesses the Make DBMS Table Mappable dialog box, which
allows you make a table linked to a remote database mappable
in MapInfo Professional.
MapInfo Professional 10.5
40
User Guide
Chapter 3: The Basics of MapInfo Professional
A Tour of the MapInfo Professional Desktop
Change Symbol for a
Mappable DBMS Table
Accesses the Change Symbol for a Mappable DBMS Table
dialog box, and allows you to change the symbol style of a
mappable DBMS table.
Disconnect DBMS
Accesses the Close DBMS Disconnection dialog box, where
you can close a connection to a remote database.
Reviewing the Web Services Toolbar
The Web Services Toolbar contains buttons and commands that are used to access web services.
For more about accessing web services, see Chapter 15: Working with Web Services.
Open WMS Table
Opens a Web Map Service table into the current map or into a
new map. The Open WMS Table button is available whenever
your computer is connected to the intranet or the Internet.
Open WFS Table
Opens a Web Feature Service table into the current map or into
a new Map window. The Open WFS Table button is available
whenever your computer is connected to the intranet or the
Internet.
Find Address
Displays the Find Address dialog box to begin geocoding a
single address using a geocoding service.
Geocode Using Server
Displays the Geocode Using Server dialog box to begin
geocoding a table using a geocoding service.
Create Drive Regions
Displays the Create Driving Regions dialog box to begin using
driving region buffers to display data or creating time or
distance buffers for a table.
Web Services
Preferences
Displays the Web Services Preferences dialog box to begin
setting the geocoding server preferences and setting the
routing server preferences.
Using Workspaces
A workspace is a list of all the tables, windows, and settings you are using, stored in a file with the
extension .WOR. Workspaces are a convenient way to return to a previously created map without
having to open each table file individually. The workspace keeps track of the following elements:
•
•
•
•
•
Map, Browser, Graph, 3DMap, and Layout windows, including their size and position
Query tables created from base tables using either the Select or SQL Select statements (queries
on queries will not be saved)
Graphs
Thematic maps
Legend windows
MapInfo Professional 10.5
41
User Guide
Chapter 3: The Basics of MapInfo Professional
A Tour of the MapInfo Professional Desktop
•
•
•
Cosmetic objects
Labels
Styles for fonts, symbols, lines, and fill patterns used to display objects
To view the contents in the workspace file, open the .WOR file in MapInfo Professional, a text editor
or word processor.
L
When you save a workspace, you cannot save any references to selections or queries made
by the Selection tools or the Query options.
Opening a Workspace
Any previously opened tables and windows will be left untouched when you open a workspace.
However, to avoid cluttering up your screen with unnecessary windows, use the Close All command
from the File menu before adding the workspace.
When you exit MapInfo Professional, the MapInfo Professional workspace (MAPINFOW.WOR)
stores the last session (unless you have set your preferences so that the workspace will not be
written). If there are files you don't want added to your workspace, close them before exiting.
To open a workspace:
1. Choose File > Open. The Open dialog box displays.
2. Choose Workspace (*.wor) from the Files of type drop-down list.
3. Specify the name, directory and drive for the workspace you want to open.
4. Click OK.
When you exit MapInfo Professional, the MapInfo Professional workspace (MAPINFOW.WOR)
stores your last session. If there are files you don't want added to your workspace, make sure you
close them before exiting.
•
For more information, see Opening Multiple Workspaces in the Help System.
How Renaming Tables Affects Workspaces
When you change the name of a table listed in a workspace, you invalidate the workspace. Table
names are stored in the workspace file, so if change it, the workspace cannot find it.
For example, if you create a workspace called CUSTOMER.WOR that contains the STATES table. If
you later rename the STATES table to AMERICA, MapInfo Professional will not be able to open the
CUSTOMER.WOR workspace. It will try to open the STATES table and not be able to locate it.
There are three ways to avoid this problem:
•
•
•
Make any table name changes before you start to build workspaces.
Open the workspace file in any text editor and manually change the table names.
Open a workspace. Rename the table(s) using the Rename Table dialog box and immediately
save the workspace.
MapInfo Professional 10.5
42
User Guide
Chapter 3: The Basics of MapInfo Professional
Understanding Your Data in MapInfo Professional
Saving Printer Information to a Workspace
MapInfo Professional enables you to save your printer information to a workspace, and restore
printer information from a workspace. These settings are located in the Startup preferences (on the
Options menu, point to Preferences, and click Startup). To save printer information to a
workspace, check the Save Printer Information to Workspaces check box. Subsequently, when
you save your workspace, the printer name, paper orientation, paper size, and the number of copies
are saved. When this preference is on, the printer settings are saved in a workspace file.
L
We recommend that you leave this preference on.
To restore printer information from a workspace, check the Restore Printer Information to
Workspaces box. When you open the workspace, the printer name, paper orientation, paper size,
and the number of copies are restored. This is useful if you are sharing workspaces with other
MapInfo Professional 6.0 or later users who are also using the same printers. You may want to leave
it off if you want to send the workspace to someone who is using a different printer. If this preference
is turned off, MapInfo Professional uses the default printer selected in the Printer preferences.
L
You can get additional printer advice in the MapInfo Professional Printing Guide, which is
located in the Documentation subfolder of your installation directory.
Understanding Your Data in MapInfo Professional
Computer maps are organized into layers. Think of the layers as transparencies that are stacked on
top of one another. Each layer contains different aspects of the whole map.
What is a Layer?
In MapInfo Professional you begin by opening your table of data and displaying it in a Map window.
Each table displays as a separate layer. Each layer contains the table plus any map objects, such as
regions, points, lines, and text. Additionally, the layer contains style overrides and zoom layering
characteristics that you can add to give the layer more or less prominence in the Map window.
MapInfo Professional 10.5
43
User Guide
Chapter 3: The Basics of MapInfo Professional
Understanding Your Data in MapInfo Professional
Figure: Map Layers Example
Map layers form the building blocks of maps in MapInfo Professional. Once you have created your
layers, you can customize them in a variety of ways, add and delete layers, or reorder them.
For example, one layer may contain state boundaries, a second layer may have symbols that
represent capitals, a third layer might consist of text labels. By stacking these layers one on top of
the other, you begin to build a complete map. You can display one, two, or many tables at a time.
Map Objects as Part of Layers
We mentioned earlier that maps in MapInfo Professional are made up of layers of map objects.
There are five basic types of objects:
•
•
•
•
•
Regions: closed objects that cover a given area. These include polygons, ellipses, and
rectangles. For example, country boundaries, postal code boundaries, sales territories.
Point objects: represent single locations of data. For example, customer locations, restaurants,
parking meters. Points can also be combined into multipoint objects.
Line objects: open objects that cover a given distance. These include lines, polylines, and arcs.
Examples are streets, rivers, power lines.
Text objects: text that describes a map or another object, such as labels and titles.
Collection objects: combination of region, line, and multipoint objects.
You can have each type of object in a separate layer (most common), or you can combine objects in
the same layer. MapInfo Professional lets you create, edit, customize, and display these objects to
make maps that meet your needs.
For information about drawing and editing map objects, see Drawing and Editing Objects on
page 157 and see Moving Map Objects in the Help System.
Managing a Map’s Layers
The key to controlling your map layers is the Layer Control window. The window shows all the layers
that make up a Map window and the status of the layer attributes. These attributes are: Visible
On/Off, Style Override, Editable, Selectable, and Automatic Labels. ToolTips display over the
attribute when you move your cursor over them to help familiarize yourself with each one. It is easy
to change a layer’s, or multiple layers’, attributes.
MapInfo Professional 10.5
44
User Guide
Chapter 3: The Basics of MapInfo Professional
Working with Tables in the Table List
You also have options available to change the display and label settings; modify any thematic maps
you have displayed; and reorder, add, or remove layers.
•
•
For instructions on accessing the Layer Control window, see Accessing Layer Control in the
Help System.
For instructions on changing layer order in the Layer Control window, see Changing the Order of
Contiguous Layers or Changing the Order of Random Layers topics in the Help System.
Working with Tables in the Table List
The Table List window lets you perform operations for open tables in MapInfo Professional using
fewer clicks. You can organize tables into groups and sort them alphabetically and recently opened
first. The Table List window is accessible by selecting Table > Table List.
The Table List has the following features:
•
•
•
•
•
•
•
Modeless, so that you can open it and leave it open for the duration of your session. (Modeless
windows do not have OK or Cancel buttons.)
Dockable to any of the four sides of the MapInfo Professional window: top, left, bottom, and
right. The Layer Control window and Table List Window can also share the same space.
Drag and drop enabled, so that you can select tables and drag and drop them to a blank area to
open them in a new Mapper window. When dropping tables on to an existing Mapper window,
MapInfo Professional adds them to the Mapper window as new layers.
Sorting enabled, to sort tables based on ascending order of table alias (name), descending
order of table alias, and recently opened. Sorting criteria persist across different MapInfo
Professional sessions.
Multi-Selection enabled, to select multiple tables using the Ctrl or Shift keys.
Context Menu enabled, so that when you right-click on table aliases (names) a pop-up menu
displays and you can perform the desired operations.
Searching enabled, you can search for a table name in the Table List Window by typing
characters in a Search text box. The Table List Window list refreshes itself to show only those
tables that contain the search characters.
Accessing the Table List
To access the Table List, do one of the following:
•
•
Click the Table List
tool in the Main toolbar.
On the Table menu, click Table List.
MapInfo Professional 10.5
45
User Guide
Chapter 3: The Basics of MapInfo Professional
Working with Tables in the Table List
Table List lets you manage open tables and their attributes. It is resizable. It supports two modes of
display:
•
ListView – tables display as a list.
•
TreeView – tables group according to the type they belong to.
MapInfo Professional 10.5
46
User Guide
Chapter 3: The Basics of MapInfo Professional
Working with Tables in the Table List
To see the table names of the open tables, expand or collapse the groups using + and -.
L
Hovering over an entry in the Table List will display the path of the open table as a tool tip.
About the Table List Buttons
Click Group By Type to switch to tree view mode.
Click Ungroup by Type to switch to list view mode.
Click Ascending order to sort tables in ascending order.
Click Descending order to sort tables in descending order.
Click Recently Opened First to sort tables based on the order they were opened. The
most recently opened table displays first. In Tree View, the table type nodes always
display in ascending order.
L
The sorting criteria persists across different MapInfo Professional sessions.
Moving the Table List to Customize your Work Area
The Table List is a floating window, so that you can leave the Table List open throughout your
session. To move the Table List to another location in the application window:
•
•
Dock it to any of the four sides of the MapInfo Professional window: top, left, bottom, and right.
The Layer Control window and Table List Window can also share the same space. You can dock
it also using the docking guides if you enable it from System Preferences. Look for System
Preferences dialog box.
Undock it by double-clicking the Table List window title bar, so that it floats. You can then move
it to another location in the application window.
L
If your computer has two monitors, try dragging the Table List window on to the second
monitor. This arrangement allows more room for map windows on the first monitor.
MapInfo Professional 10.5
47
User Guide
Chapter 3: The Basics of MapInfo Professional
Working with Tables in the Table List
About the Context Menu
Right-click on a table in the Table List to view a pop-up menu with the following options:
L
You can add your own context menu items into this list using MapBasic functions.
Select All
Select this option to select all the rows in the table together. If a table is selectable, this menu item
includes the table name. For unsupported tables, this menu option is unavailable.
Browse
Select this option to open a table in a Browser window and edit records, copy records, add new
records, or delete existing records.
Open in new Map Window
Select this option to open the table in a new Map window.
For more information, see Opening a Table in the Help System.
Export
Select this option to open the Export Table to File dialog box to export the table. You can export
graphics and tabular data to MapInfo Professional format (MIF) and AutoCAD DXF (*.dxf) files. Only
tabular data can be exported to Delimited ASCII (*.txt), dBASE DBF (*.dbf), and Command delimited
CSV (*.csv).
MapInfo Professional 10.5
48
User Guide
Chapter 3: The Basics of MapInfo Professional
Working with Tables in the Table List
Refresh
Select this option to refresh WFS, Universal Data, and DBMS tables. It is enabled for single
selection only.
•
WFS table – It refreshes the WFS layer based on the WFS server settings and the filter options
set for WFS Refresh in the Web Services Preferences. It is enabled for a WFS table when
connection to the Internet or intranet is established.
•
Universal Data table – It refreshes the Universal Data table, such as AutoCAD®, Microstation
Design®, ESRI ArcSDE datasets.
DBMS table –It refreshes a MapInfo Professional linked table with the most recent data residing
on the remote database for that linked table. It is enabled when there are no pending edits
against the table.
•
Table Structure
Select this option to specify the field name, field type, number of characters (width), and whether the
field is to be indexed for each field in your new database. You also indicate whether or not the table
is mappable by associating graphic objects with records and, if so, whether the map is to be an earth
or a non-earth map. Collectively, this information is the structure of your database.
Create Points
Select this option to create point objects for a database that has X and Y coordinates or
longitude/latitude coordinate information. These points can be displayed on a map. If you do not
have coordinates in your table, then use Geocode to match some other geographic information
(such as street address) against a table that already has graphic objects.
Update Column
Select this option to change a column's value by updating a table based on its own data values or by
updating a table based on data from another table. This dialog box remembers the column that was
updated the last time update was run and the expression that was used for updating a column the
last time an update was run.
Close
Closing a table removes it from active use in your current session. When you close a table, you
automatically close all views of that table. When closing a table that displays in a Map window with
other tables, MapInfo Professional removes that table from the window and keeps the Map window
open.
For more information, see Closing a Table in the Help System.
View Catalog Record
This option is for metadata catalog users who are cataloging their data holdings. The View Catalog
Record command lets you view any already existing cataloged records from an online service. The
View Catalog Record command is active when the Catalog Browser is loaded.
For more information, see the Catalog Browser help system.
MapInfo Professional 10.5
49
User Guide
Chapter 3: The Basics of MapInfo Professional
Working with Tables in the Table List
Create Catalog Record
This option is for metadata catalog users who are cataloging their data holdings. The Create Catalog
Record command lets you edit any already existing cataloged records from an online service. The
View Catalog Record command is active when the Catalog Browser is loaded.
For more information, see the Catalog Browser help system.
Selecting Multiple Tables in the Table List
Multiple tables can be selected with Ctrl, Shift, or arrow keys. Only Browse, Open in new Map
Window and Close options are enabled in Context Menu for multi-selected tables.
L
In tree view mode, only tables can be selected. Table type nodes are not selectable.
Dragging and Dropping in the Table List
To open multiple tables in a new Mapper window, select them (using the Ctrl and Shift keys) and
then drag and drop them on to a blank area. When dropping tables on to an existing Mapper
window, MapInfo Professional adds them to the Mapper window as new layers.
L
Tables can be dropped only on a Mapper window or an empty area in the MapInfo
Professional.
Sorting in the Table List
You can sort tables based on ascending order of table alias (name), descending order of table alias,
and recently opened. Sorting criteria persists across different MapInfo Professional sessions.
The following buttons sort the Table List view:
Click Ascending order to sort tables in ascending order.
Click Descending order to sort tables in descending order.
Click Recently Opened First to sort tables based on the order they were opened. The most
recently opened table displays first. In Tree View, the table type nodes always display in ascending
order.
L
The sorting criteria persists across different MapInfo Professional sessions.
MapInfo Professional 10.5
50
User Guide
Chapter 3: The Basics of MapInfo Professional
Working with Layers in the Layer Control
Searching the Table List
Searching Tables
You can search for a table name in the Table List by typing characters in the Search text box. The
Table List view refreshes itself to show only those tables that contain the search characters.
Clear Search
Typing in the search text box causes the Search button to change to a Clear Search button. To clear
the contents of the search text box, click on the Clear Search button.
Working with Layers in the Layer Control
The Layer Control window lets you control the layers on display for all maps open in MapInfo
Professional.
Select and Modify Many Layers at Once
Select multiple layers at once in the Layer list by using the Shift and Ctrl keys. Selecting a check box
for one of these layers then selects the check boxes for all selected layers. This is useful when
turning several layers off, because the map redraws only once instead of redrawing for each layer
selection.
Modify multiple layers at once instead of having to modify layer properties one layer at a time. Use
the Shift and Ctrl keys to select multiple layers in the Layer list, and then click the Layer Properties
button to launch the Layer Properties dialog box. Changes apply to all selected layers making it
easier to ensure consistency in your layer settings. You can also set the style override for all
selected layers by clicking the style swatch for one of the layers, or set the labeling font for all the
selected layers by right-clicking on one of the layers and then choosing Label Font.
You can only modify a selection of similar layers; if you select different types of layers, such as a
raster layer and a pie theme, then the dialog box is not enabled.
Preview Style Changes before Committing them
Style dialog boxes that are launched by clicking a style swatch for a layer in the Layer Control list
include a Preview button. Use this Preview button to see what the map will look like with your style
changes before committing the change. You can cancel the preview if you do not like what you see
by clicking the Cancel button in the style dialog box.
Apply Display and Label Overrides for when Zooming the Map
At different zoom levels information on the map may be difficult to view. Changing (overriding) the
display style for specific zoom levels can help. As an example, to make the map easier to read, you
may want roadways to display using a thick line when zoomed in to the map, but a very thin line
when zoomed out of the map.
MapInfo Professional 10.5
51
User Guide
Chapter 3: The Basics of MapInfo Professional
Working with Layers in the Layer Control
Right-clicking on a layer in the Layer Control list and clicking the Add a Display Override option
creates a display override for that layer. Right-clicking and clicking the Add a Label Override option
creates an override for labels for a layer. The first display override defaults to the zoom range of the
layer. Adding subsequent display overrides splits the zoom range of the first display override. You
can then customize the display style for the layer at each specific zoom level.
Reorder Layers
The Layer list has multi-select capabilities. To change the order of one or more contiguous layers,
hold down the Shift key, select the layers, and drag them up or down. To change the order of one or
more layers that are out of sequence, hold down the Ctrl key, select the layers, and drag them up or
down.
When you begin to drag the layers, the cursor will change shape to represent the number of layers
being dragged. If you are dragging one layer, the cursor becomes an arrow icon with a single layer
icon attached to the top. If you are dragging multiple layers, the arrow icon will display multiple layer
icons at the top. If you select layers that cannot be dragged or if you are attempting to insert layers
where they cannot be inserted, the cursor becomes a circle with a line through it.
L
A selection of layers that is out of sequence will become contiguous upon insertion.
Use the Move Layers Up or Move Layers Down buttons to move one or more layers. You cannot
reorder or remove the Cosmetic layer. It will always be the top layer.
Group Layers
Group layers to organize them, so that you can show or hide the entire group with a single click.
L
Group Layers are not preserved when you do a Save Workspace As to a .MWS file.
Quick View an Entire Layer
Right-click on a layer name and choose View Entire Layer to view the layer as a whole without
going through a dialog box.
Rename Maps
You can give a descriptive title for your map by right-clicking on the Map name (at the top of the
layer list) and choosing Rename Map.
Suspend or Resume Map Drawing
For those times when you want to make many quick changes, and you do not want the map to
redraw after each change, you can toggle the Automatic Map Drawing button to temporarily turn off
map display.
•
For more information, see Grouping Layers and Suspend or Resume Map Drawing, in the Help
System.
MapInfo Professional 10.5
52
User Guide
Chapter 3: The Basics of MapInfo Professional
Working with Layers in the Layer Control
Accessing Layer Control
To access the Layer Control window, do one of the following:
•
•
Click the Layer Control
tool in the Main toolbar.
On the Map menu, click Layer Control.
Use Layer Control to manipulate the layers and their attributes to determine the map display.
1
3
2
4
5
1 Select the Visible check boxes to display a layer.
2 The Layer Type indicates the types of items in the layer.
3 Click the Automatic Labels icon to label a layer automatically.
4 Click the Selectable icon to make a layer selectable in the Map window.
5 Click the Editable icon to make the layer editable.
Visual indicators in the Layer list provide more information about a layer:
•
•
•
When a layer is outside of its zoom range, the layer name is dimmed and there is an asterisk (*)
beside the Visible On/Off check box.
Selecting an object, such as a point or line, in the map window causes the layer name to appear
in bold.
When you select a layer, it is highlighted in the list. You can select multiple layers by using the
Ctrl and Shift keys when making your selections.
MapInfo Professional 10.5
53
User Guide
Chapter 3: The Basics of MapInfo Professional
Working with Layers in the Layer Control
Layer Types
The Layer Type Indicate the types of items in the layer, such as points, lines, regions, theme range,
or raster images. If the layer has a Style Override, then the icon indicates the style. You can show or
hide layer type icons by clicking the Layer Control Options button in the Layer Control window. Layer
Type icons include:
•
For points, lines, and regions, click the icon to open the corresponding style dialog box and edit
style properties for the layer.
points
lines
regions
•
A layer with a theme shows a thematic icon.
Range Theme
Bar Chart Theme
Pie Chart Theme
Graduated Symbol Theme
Dot Density Theme
Individual Theme
Grid Theme
•
A map tile server layer or a raster layer displays the following icon:
Raster Layer or Tile Server Layer
•
A group layer icon indicates a group of layers. You can drag to move layers in to or out of the
group.
Group Layer
L
Group Layers are not preserved when you do a Save Workspace As to a .MWS file.
MapInfo Professional 10.5
54
User Guide
Chapter 3: The Basics of MapInfo Professional
Working with Layers in the Layer Control
About the Layer Control Buttons
The following buttons in the Layer Control window help you to control how the map displays layers:
Click Add Layers to open the Add Layer dialog box and add one or more layers to the
map. Select from the list of open tables. Your additions display in the Layer list.
The Add Layers button enables when there is an active map window; the layers you add
are for the active map window. Before clicking the Add Layers button, make a map active
(bring it to the front) by clicking on the map title in the layer list.
Click Remove Layers to remove selected layers from the Layer list. To select multiple
layers, press the Shift or Ctrl key while selecting layers.
L
The Remove Layers button displays a confirmation dialog box. If you would rather
not see these confirmation prompts, click the Layer Control Options button and
un-check Confirm Removal of Layers in the Layer Control Options dialog.
Click Move Layers Up to reorganize one or more layers in the list. To select multiple
layers, press the Shift or Ctrl key while selecting layers.
Click Move Layers Down to reorganize one or more layers in the list. To select multiple
layers, press the Shift or Ctrl key while selecting layers.
The order determines which layers obscure the contents of the other layers; the bottom
layer in the list is the most obscured.
Click Layer Properties to open the Layer Properties dialog box and set display attributes,
including label display and labeling rules, for selected layers.
The Layer Properties button enables after selecting a single layer or multiple layers of the
same type. If you select two different layer types, such as the Cosmetic layer and a raster
layer, then this button does not enable.
Click Modify Theme to open the Modify Thematic Map dialog box and set display
attributes for a thematic layer. This button is only active after selecting a thematic layer.
Click Hotlink Options to open the Hotlink Options dialog box where you can specify
filename expression, file locations, what activates HotLink, and saving options to table
metadata. See Creating Active Objects in the Help System.The Hotlink Options button
enables only after selecting a single layer.
Click Automatic Map Drawing to allow map redraw or to turn off map display as changes
are made to layers. Select to suspend automatic redraw when there are many layers that
slow the redraw process.
Click Layer Control Options to open the Layer Control Options dialog box and set which
maps show in the Layer list, enable confirmation when removing a layer, disable tooltips in
the Layer Control window, and show or hide icons in the Layer Control window.
MapInfo Professional 10.5
55
User Guide
Chapter 3: The Basics of MapInfo Professional
Working with Layers in the Layer Control
Moving the Layer Control Window to Customize Your Work Area
The Layer Control is a floating window, so that you can leave the Layer Control window open
throughout your session. It also docks to the side of the application window, so that you can
customize your work area.
To move the Layer Control to another location in the application window:
•
•
Undock it– Double-click the Layer Control window title bar, so that it floats. You can then move it
to another location in the application window.
Dock it – Drag the layer control window by the title bar, toward the left or right side of the screen,
so that the Layer Control window snaps in to place.
L
If your computer has two monitors, try dragging the Layer Control window on to the second
monitor. This arrangement allows more room for map windows on the first monitor.
Adding Layers to the Map
You can add one layer to the current Map window at a time or use the multi-select functionality to
add layers simultaneously.
L
•
You can only add layers from tables that are open. If you want to add a layer and you do not
see it in the list, make sure the table that contains that layer is open.
For more information, see the Help System.
Reordering Map Layers
Map layers display in the order that they are listed in the Layer Control window, with the bottom layer
drawn first and the top layer (which is always the Cosmetic Layer) drawn last. It is important to order
your layers correctly.
For example, you have a layer of customer points and a layer of census tracts. If the layers are
incorrectly ordered in the Map window, MapInfo Professional might draw the customer points first
and then display the census tract layer second. Your points would be obscured by the census tract
layer. You can reorder how layers are displayed in a Map window two ways.
•
For more about layers, see Reordering Layers, Changing the Order of Contiguous Layers and
Changing the Order of Random Layers topics in the Help System.
Layer order is also important when you use the Select button. The Select tool selects objects from
the topmost Selectable layer. If you have several objects at the same location, it is difficult to select
the exact one you want. You can reorder your layers in Layer Control so that the layer you want to
select from is the new topmost layer.
MapInfo Professional 10.5
56
User Guide
Chapter 3: The Basics of MapInfo Professional
Working with Layers in the Layer Control
MapInfo Professional does not allow you to control the front-to-back ordering of objects within a
single map layer. If you are editing a table, and you draw a line on top of a circle, the line might
appear in front of or behind the circle; you cannot control whether it is in the front or the back. You
can, however, control the front-to-back ordering of objects in a Layout window.
L
•
If you need to control the ordering of objects (for example, you need to make sure that your
lines display on top of your regions), put the different object types in separate layers. Put
your line objects in one table, and put your region objects in another table. Then use the
Layer Control window to order the layers.
For more information, see Removing a Layer from the Map and Changing how a Layer Displays
on the Map in the Help System.
Setting the Zoom Layering
Sometimes you want a map layer to display only at certain zoom levels. Zoom Layering controls the
display of a map layer so that it displays only when the map’s zoom level falls within a preset
distance.
For example, you have a layer of streets and a layer of postal code boundaries. When you zoom out
past 10 or so miles, the streets look like a black smudge in the window. This is because the zoom
(window width) is too wide to show detailed street maps. Use Zoom Layering to tell MapInfo
Professional to display the street layer only when the zoom is set to a distance that allows you to see
the street detail properly, for instance, less than 5 miles.
MapInfo Professional 10.5
57
User Guide
Chapter 3: The Basics of MapInfo Professional
Working with Layers in the Layer Control
The first map doesn’t have zoom layering set for its street layer. At a zoom of 15 miles across, notice
how difficult it is to see any detail. The second map has zoom layering set to display the streets
when the zoom is less than five miles. Therefore, the streets layer does not display when the window
is set at 15 miles.
For more information, see Setting the Zoom Layering in the Help System.
You can display different layers in the same Map window at different zoom levels. For example, you
have a layer of streets, a layer of county boundaries, and a layer of state boundaries. You want the
streets layer to be visible only when the zoom level is less than eight miles. You want the county
boundary layer to display when the zoom level falls between 20 miles and 200 miles. You want the
states boundary layer to be visible only when the zoom level is greater than 100 miles. You can set
a different zoom level for every layer in your Map window.
L
When you add an object, a region, a line, or a polyline in the Map window and zoom out
beyond where the zoom layer would permit you to see that feature, MapInfo Professional
turns off zoom layering so you can continue to see what you are working on. When you
complete the add process, a message displays asking you if you want to leave zoom layering
off (so you will still be able to see the feature). If you click Cancel, MapInfo Professional
cancels the zoom layering. If you click OK, you need to adjust your zoom settings to see this
feature again.
For more information, see Changing a Map’s Zoom Level in the Help System.
Positioning and Sizing Labels
Two features in the Layer Properties dialog box help you with label placement: Anchor Point and
Offset.
To label a map object using the Label button:
1. Make sure that the layer containing the objects you want to label is selectable. Choose Map >
Layer Control and click the Selectable
icon to make the layer selectable.
2. Click the Label button in the Main toolbar.
3. Click on an object with the Label button to display a label for that object. MapInfo Professional
labels the object with the values (from the column that you specified for that layer in the Layer
Properties dialog box on the Label Display tab).
4. To change label options, choose Map > Layer Control. The Layer Control window displays.
5. In the Layer list, double-click the layer name. The Layer Properties dialog box displays.
MapInfo Professional 10.5
58
User Guide
Chapter 3: The Basics of MapInfo Professional
Working with Layers in the Layer Control
6. Select the Label Display tab and specify the desired label options, such as label style and
placement.
Default Position (also called the anchor point) is the label’s position relative to the map object.
Click on one of the buttons to select an anchor point. You have nine choices.
The anchor point is an ongoing attribute of the label. For example, if you anchor a point object’s
label at Center Left and you increase the label’s font size, the text will grow to the left. This way,
the text can never overwrite the point.
The default anchor point varies with the type of map object you are labeling:
• Regions default to Center.
• Lines default to Below Center.
• Points default to Right.
Label Offset is how far away a label is from its anchor point. Specify the number of half spaces
you want the label to be from the anchor point in the Label Offset box.
7. Select the Labeling Rules tab and specify the desired label adjustments, such as allow or
discard overlapping text, try other positions when overlapping occurs, allow duplicate text, and
label partial objects.
Label Size
Label size does not change with zoom or scale changes. Labels display at the size you specify at all
zoom levels as well as on printed output. Labels are never hidden behind other geographic objects
because they are always the last objects drawn on the map.
Displaying the Lines, Nodes, and Centroids
The Layer Properties dialog box allows you to display line directions, nodes, and object centroids.
Select the Show Line Direction check box when you want to show the direction in which line
objects are drawn. Check the Show Nodes check box to display the nodes in a layer.
The Show Centroids box displays the centroids of each object in a layer. In MapInfo Professional, a
region’s centroid does not represent its center of mass. Instead, the centroid represents the location
used for automatic labeling, geocoding, and placement of thematic pie and bar charts. If you edit a
map in Reshape mode, you can reposition region centroids by dragging them.
See the Help System for these related topics:
•
•
•
•
Changing a Layer’s Labeling Options
Changing a Region’s Centroid
Changing a Label’s Style
Drawing Autolabels
For instructions on inserting table-based style in the Layer Control window, see Inserting Styles into
Tables in the Help System.
MapInfo Professional 10.5
59
User Guide
Chapter 3: The Basics of MapInfo Professional
Working with Layers in the Layer Control
Understanding the Cosmetic Layer
Every Map window in MapInfo Professional has a Cosmetic Layer. Think of the Cosmetic Layer as
the blank transparency that lies on top of the other map layers (transparencies). It can store map
titles and other graphic objects you create during a work session. The Cosmetic Layer is always the
top layer of the map. You cannot remove or reorder the Cosmetic Layer.
You can only make the Cosmetic Layer editable or selectable. Other Layer Control options (labeling,
zoom layering, display mode) are not available for the Cosmetic Layer. To select fill patterns, line
types, symbols, and text font for the Cosmetic Layer, use the Line Style, Region Style, Symbol Style
and Text Style commands from the Options menu. When the Cosmetic Layer is editable, you can
access the style options from the Drawing Toolbar.
The contents of the Cosmetic Layer are linked proportionally to the map. Map objects (except for
symbols) and text in the Cosmetic Layer are proportionally linked to the zoom level of the map. If you
draw objects in the Cosmetic Layer and then change the map’s zoom from 30 to 100 miles, the size
of the objects will appear smaller.
See these related topics in the Help System:
•
•
•
•
•
Using the Cosmetic Layer
Saving Cosmetic Layer Objects
Saving Objects on the Cosmetic Layer
Removing Cosmetic Objects
Disabling the Save Cosmetic Objects Warning Dialog Box
Making the Layers “Editable”
To make changes to the graphic objects in a layer, you must make the layer editable. You can draw
objects on that layer, add text, combine, or delete objects. You can only make one layer editable at a
time.
•
For specific instructions, see Making Layers Editable in the Help System.
Making a Read-Only Table “Editable”
If you are working with tables that were opened from Excel, Lotus, or ASCII files, you may have
noticed that they come in as read-only tables. Because the files are not in native MapInfo
Professional formats or standard DBF format, MapInfo Professional is unable to edit the tabular
information contained in these tables.
MapInfo Professional 10.5
60
User Guide
Chapter 3: The Basics of MapInfo Professional
Working with Layers in the Layer Control
If you wish to modify the table information, you must save a copy of the table. You can do this when
you open the table in MapInfo Professional by selecting the Create copy in MapInfo format for
read/write check box before selecting Open in the Open dialog box.
•
For instructions on making read-only map layers editable, see Making Layers Editable in the
Help System.
Getting Layer Information
You can use the Info tool button to get information pertaining to the map layer.
To get information about an object in a particular layer:
1. Make sure the layer you want information about is the selectable layer.
2. Click Info
L
in the Main toolbar and click the object you want information about.
If the information that displays is not what you were looking for, check to see that the
layer you are interested in getting data for is selected.
Using either method, the Info Tool box displays.
L
Use the Ctrl key with the Info button to toggle through all selectable layers and access
overlapping objects.
When you click a map location using the Info button where two or more selectable map objects
overlap, the data tied to the objects on each layer display in the Info tool window. If you do not want
the information for all layers to display, turn off Selectable for those layers in the Layer Control
window.
You can also view an object’s label expression in an InfoTip when you use the Select, Info, or Label
buttons. InfoTips work very much like ToolTips. Using one of these tools, place your cursor over an
object. An InfoTip displays the label expression for the object in the topmost selectable layer. To set
MapInfo Professional 10.5
61
User Guide
Chapter 3: The Basics of MapInfo Professional
Working with Thematic Layers
InfoTips for a particular layer, adjust the Selectable attribute in the Layer Control window so that the
Tips display for the layer you want. InfoTips are active by default, but you can turn them off in the
Map window preferences (on the Options menu, point to Preferences and click Map window).
Selecting Objects in a Layer
If you only want to select objects for further analysis rather than edit the objects, make the layer
selectable. More than one layer can be selectable at a time. If a layer is editable, it is also selectable.
Many MapInfo Professional functions require that map objects be selected before performing the
particular operation. To use the Select button, Label button or Info button you must first make the
layer selectable. Unlike the editable feature, more than one layer may be selectable at the same
time. You may, however, only select from one layer at a time.
The Select button selects objects from the topmost Selectable layer. To select an object that is not in
the top Selectable layer, you can turn off the Selectable option in Layer Control for every layer above
the layer you want to select from by selecting a layer’s Selectable
icon to deactivate it.
Alternately, you can leave all layers Selectable and use the Ctrl key in combination with the Select
button to cycle through each Selectable layer.
L
•
The instructions for making a layer editable are the same, except that you select
Editable On/Off
instead.
For instructions on making objects in a layer selectable, see Selecting Objects in a Layer in the
Help System.
For example, if you want to find all customers who live within a fifty kilometers radius of Paris, make
the Street layer selectable. If the map also includes a layer of hospitals (which you do not want to
include in the radius search), turn off the Selectable option for the hospital layer.
The Editable or Selectable options only apply to the Map window itself. You can always select
objects using the Select or SQL Select commands regardless of whether a layer is selectable.
Working with Thematic Layers
When you create a thematic map in MapInfo Professional, the thematic shading is added to your
map as a separate layer. It is drawn on top of the layer, from which it gets the raw data. Separating a
thematic layers from its base layer provides you with several important options:
•
•
Graduated symbol thematic maps do not require that your base layer contain point objects.
Instead, graduated symbol objects are built regardless of the map object type. Therefore, even if
your base layer contains region or line objects, you will still be able to create a graduated
symbols map.
You can have multiple thematic layers per base layer. In some cases, you do not have to add
another base layer to the map to create another thematic layer. You can display more than one
thematic layer at a time, as well as perform bivariate thematic mapping.
MapInfo Professional 10.5
62
User Guide
Chapter 3: The Basics of MapInfo Professional
Working with Thematic Layers
•
You can use Layer Control to turn the display on or off for a given thematic layer. The layer it is
based on can continue to display. You can also set individual zoom layers on thematic maps.
Ordering Thematic Layers
To display thematic layers properly, they must be in a specific order. This is especially important
when you want to display more than one thematic layer at a time. For example, you would want pie
or bar charts for an area map to display on top of regions that are shaded in order to see them.
The following lists the order of map layers from top to bottom (note that map layers are drawn from
the bottom up):
1. Pies, Bars, or Graduated Symbol thematic layer.
2. Dot Density thematic layer.
3. Ranged thematic layer – where Color or Size Attributes are applied.
4. Ranged (or Individual Value) thematic layer – where All Attributes are applied.
5. Major layer or base layer.
6. Grid thematic layer.
When you create a new thematic layer, MapInfo Professional automatically inserts it into its proper
place.
•
For more information, see Reordering Thematic Layers in the Help System.
Displaying Thematic Layers
You can turn the display on and off for thematic layers the same way you can for other map layers.
All the display settings in Layer Control are also applicable to thematic layers, enabling you to set a
zoom level for each thematic layer. You can also access the Modify Thematic Map dialog box
through Layer Control by double-clicking a Thematic layer.
Thematic layers are always drawn after their base layer. Therefore, they appear above their base
layer in the Layer Control list, and are indented to distinguish them from other map layers.
Thematic layers are displayed in the list with this naming convention:
<Thematic type> with/by <variable-list>
The type of thematic map is noted first, followed by the list of variables used to create the map. For
example, a pie thematic layer that uses commuting data is listed this way:
Pies with ComAlone, ComCarpool...
The variable list is truncated if there is not enough room to display each variable used in your
thematic analysis. For more information about thematic mapping, see Using Thematic Mapping to
Analyze Information on page 230.
MapInfo Professional 10.5
63
User Guide
Chapter 3: The Basics of MapInfo Professional
Working with Thematic Layers
Converting Objects into Region Objects
When you convert a circle or ellipse into a region, the region contains 101 nodes. When you convert
an arc into a region, the number of nodes depends on the starting and ending angle of the arc. If the
arc spans 180 degrees (for example, the starting angle is zero and the ending angle is 180), a region
based on the arc will contain 52 nodes; if the arc spans 90 degrees, a region based on the arc will
contain 27 nodes; etc.
If you perform extensive map editing, you may need to convert polylines to regions. If you cut or
copy a group of selected nodes, MapInfo Professional treats the set of nodes as a polyline object,
and places the polyline on the clipboard. If you then paste the object, MapInfo Professional places
the polyline on your map. At this point, you may want to perform Convert to Regions, depending on
whether you want the finished object to be a region.
Convert to Regions also allows you to perform node-editing operations (for example, adding and
moving nodes) on objects that ordinarily do not allow node editing. For example, MapInfo
Professional does not allow you to add nodes to rectangle objects; however, if you convert a
rectangle object to a region, you can then add nodes to the region.
To convert objects into region objects:
1. Make the Map window active.
2. Choose the layer containing the objects and make it editable.
3. Select one or more objects from the editable layer.
4. Choose Objects > Convert to Regions.
When you choose Convert to Regions, MapInfo Professional converts each of the selected
objects into a region object. Each object is converted into a separate region; MapInfo
Professional does not combine all selected objects into one region. To combine objects, use the
Combine command.
MapInfo Professional automatically assigns the current region style to each of the region objects.
To specify a region style, choose Options > Region Style.
Line, polyline, arc, ellipse, rectangle, and rounded rectangle objects may all be converted to
regions. The Convert to Regions command does not affect point objects, text objects and
region objects.
•
For more information, see the Creating Regions from Polygonal Areas Enclosed by Polylines
topic in the Help System.
Working with Raster and Grid Layers in Layer Control
A raster image is a type of computerized image that consists of row after row of tiny dots (pixels). If
you have a scanner and scanner software, you can create a raster image by scanning a paper map.
After you scan a map image and store the image in a file, you can display the file using MapInfo
Professional.
In contrast, vector images contain coordinate-based data structures represented by x and y
coordinates (most of MapInfo Professional’s data is in vector format).
MapInfo Professional 10.5
64
User Guide
Chapter 3: The Basics of MapInfo Professional
Working with Seamless Layers
The Help System contains these related topics:
•
•
•
•
Displaying a Raster Image
Registering the Coordinates of a Raster Image
Working with Raster Images
Changing the Display of a Raster Image
Converting Grid Files to MapInfo Professional Grids (*.mig)
The Grid Tools (Create MapInfo Grid from Table of Objects and Create MapInfo Grid from Other
Grid Files) In MapInfo Professional allow you to convert Grid Files to MapInfo Professional Grids
(*.mig). These tools convert any grid file for which there is a grid handler present with the output
being in MapInfo Professional (*.mig) format. You can apply relief shading from a user-specifiable
virtual light source and control the color inflection values. The color files are simple text files that you
can edit to specify the color inflection values by specific value or as a percentage of the range of
data values. You can open and display the new grid after the conversion.
•
For specific instructions, see Converting Grid Files to MapInfo Professional Grids and Specifying
Inflection Values with the MapInfo Professional Grid Converter in the Help System.
Adjusting the Translucency of a Grid Thematic Map
The Translucency slider control in the Modify Thematic Map dialog box allows you to control the
percentage that layers show through raster images. A translucent image allows you to partially see
through the image. Translucent images can be layered on top of other layers so that the lower layers
are partially visible through the image.
L
•
The Grid Appearance dialog box allows you to specify color inflection distribution options for
grid maps.
For specific instructions, see Adjusting the Translucency of a Grid Thematic Map in the Help
System.
Working with Seamless Layers
Use or create a seamless map layer to treat a group of base tables as if they were one. A seamless
layer allows you to change display attributes, apply or change labeling or use the Layer Control
window for an entire group of tables at once. You can also retrieve information using the Info tool,
and select or browse any one of the layer’s base tables. A base table can be any regular MapInfo
Professional table. Grid layers cannot be made seamless.
This feature is especially useful when you want to display a vector or raster backdrop for your maps
such as joining street or boundary maps. For example, you may have a seamless layer of county
boundaries made up of several individual county tables.
MapInfo Professional 10.5
65
User Guide
Chapter 3: The Basics of MapInfo Professional
Working with Seamless Layers
When zooming in on a seamless layer, MapInfo Professional only opens data for displaying the map
at the specific zoom level—only those component tables on display open. If you change the zoom
level, then MapInfo Professional analyzes which tiles to open and which tiles to close, and does not
cache the data. Specific raster handlers open raster images, which are usually slower than vector
tables.
Features Available with Seamless Layers
Since a seamless layer is actually made up of several base tables, MapInfo Professional does treat
it a little differently than a regular MapInfo Professional table. You can use the following MapInfo
Professional features with a seamless map layer:
Layer Control
Use any of the functions except Thematic Mapping from the Layer Control window on your
seamless layer. Add, remove, or reorder layers or set display, zoom layering or label options
for the seamless layer (all base tables) at one time. However, you cannot make a seamless
layer editable.
Info Tool
Retrieve information about a particular object in a base table.
Select Tools
Select objects from the seamless layer. You can only select a group of objects if they reside
in the same base table. Press the Shift key while clicking the Select Tool to do so. If you
attempt to select several objects that reside in different base tables, MapInfo Professional will
only select objects in one base table. If you use the Marquee or Radius select tools and the
selected area spreads across two different base tables, MapInfo Professional selects the
table in either the center of the circle or polygon.
Browse Table
Display a Browser window of a particular seamless table. You are prompted to select a base
table.
Turning Seamless Layers On and Off
If you need to edit the structure of your seamless layer, you’ll need to turn your seamless layer off.
To turn your seamless layer off:
1. Choose Options > Show MapBasic Window. The MapBasic Window displays.
2. Type set table “tablename” seamless off. MapInfo Professional turns off the seamless layer.
3. Display the table in a browser to view or edit its table structure. If you edit the table structure, you
will need to recompile the seamless layer.
MapInfo Professional 10.5
66
User Guide
Chapter 3: The Basics of MapInfo Professional
Working with Seamless Layers
MapInfo Professional turns off the seamless layer. Display the table in a browser to view or edit its
table structure. Use the Seamless Table Manager to add or create seamless tables.
L
You can access information about MapBasic functions, statements and procedures in the
MapInfo Professional Help System. Select Help > MapInfo Professional Help Topics.
When you select this option, you can access the MapBasic Language Reference list from the
Contents page.
To turn the seamless layer on:
1. Choose Options > Show MapBasic Window. The MapBasic Window displays.
2. Type set table “tablename” seamless on. MapInfo Professional turns the seamless layer on
again.
Opening a Seamless Map Layer
MapInfo Professional includes sample seamless maps or you can create your own. Some of these
data files are available on the Pitney Bowes Software Inc. web site in the MapInfo Professional
Tutorial data. We recommend you download this data for use with these examples.
From the mapinfo\tutorial\tut-usa\usa\dc\seamless directory, choose dcmetrow. A seamless
map layer of water areas in Washington DC displays. Notice at first glance that the seamless layer
looks like any other MapInfo Professional table. However, the Dcmetrow seamless map layer is
made up of the following base tables:
•
•
•
VAARLIW.TAB (Arlington Virginia water areas)
VAALEXW.TAB (Alexandria Virginia water areas)
DCWASHW.TAB (Washington DC water areas)
To display a sample seamless map:
1. On the File menu, click Open.
2. From the data directory, choose DCWATER.
The following seamless map layer of water areas in Washington DC displays.
MapInfo Professional 10.5
67
User Guide
Chapter 3: The Basics of MapInfo Professional
Working with Seamless Layers
The structure of each seamless layer includes the path name of each base table plus a description
that defaults to the table name (alias). To view the table structure, turn the seamless layer off and
display the seamless table in a browser. Refer to Turning Seamless Layers On and Off on
page 66.
Characteristics of a Seamless Layer
Since a seamless layer is actually made up of several base tables, MapInfo Professional does treat
it a little differently than a regular MapInfo Professional table. You can use the following MapInfo
Professional features with a seamless map layer:
•
•
•
•
•
•
Layer Control. Use any of the functions except Thematic Mapping from the Layer Control
window on your seamless layer. Add, remove, or reorder layers or set display, zoom layering or
label options for the seamless layer (all base tables) at one time. However, you cannot make a
seamless layer editable.
Info Tool. Retrieve information about a particular object in a base table.
Select Tools. Select objects from the seamless layer. You can only select a group of objects if
they reside in the same base table. Press the Shift key while clicking the Select button to do so.
If you attempt to select several objects that reside in different base tables, MapInfo Professional
will only select objects in one base table. If you use the Marquee or Radius select buttons and
the selected area spreads across two different base tables, MapInfo Professional selects the
objects in the center of the circle or polygon.
Browser Table. Display a Browser window of a particular seamless table. You will be prompted
to select a base table.
For more information, see Creating/Compiling a Seamless Layer in the Help System.
For more about Seamless Layers in general, see the MapInfo Professional Help System.
The Help System contains these related topics:
•
•
•
Experimenting with a Seamless Layer
Specifying Search Paths for Component Tables of a Seamless Layer
Turning Seamless Layers On and Off
MapInfo Professional 10.5
68
User Guide
Chapter 3: The Basics of MapInfo Professional
Data – Where MapInfo Professional Begins
Data – Where MapInfo Professional Begins
To use MapInfo Professional, you need to match the files that contain your information (data) and
maps that come from MapInfo Professional or that you create yourself. MapInfo Professional
organizes all its information, whether textual or graphic, in the form of tables; each table is a group of
MapInfo Professional files that constitute either a map file or a database file.
Emergency medical calls thematically shaded by type of call and time of call, with
response zones shaded by number of calls.
MapInfo Professional begins when you open tables, whether they are maps or data from a
database.
What is a Database and Other Basic Terminology
A database is a collection of information organized so that it can be readily accessed using a
computer. Databases in MapInfo Professional are often referred to as tables.
To understand MapInfo Professional, you need a basic understanding of database organization, in
particular, three fundamental concepts: record, field, index, and query.
LastName
FirstName
Address
ZIPCode
Fraser
Mark
212 Hudson St
12205
Donaldson
Eva
459 Yates St
12208
Espinosa
Kim
200 Broadway
12180
Smith
Charles
1 Redbird Ln
12065
Chang
Elizabeth
53 Crescent Rd
12077
MapInfo Professional 10.5
69
User Guide
Chapter 3: The Basics of MapInfo Professional
Data – Where MapInfo Professional Begins
To understand the database concepts we are about to discuss, consider the table above.
Each row in the list contains information about one person. In database terms, each row is a record.
Each different box of information (Last Name, First Name, etc.) within a record is called a field.
Fields correspond to the columns so that the table shown above contains four different fields.
Database fields are ordered (first, second, third, fourth, etc.), and the basic convention is that the
first field displays as the first column in the database. The second field is in the column to the right of
the first, and so on to the last field, which is displayed in the right most column.
Since the data in a database isn’t usually in alphabetical order or postal code order or any other
pattern which would make it easy for the computer to find the information, the computer needs a way
to organize the information. A database uses an index to keep track of what information is where
and what record it is tied to. Without indices it would be tedious to find anything in a database with
hundreds of records, not to mention databases with thousands and tens of thousands of records.
A database index works on the same principle as a book index. A book index is an alphabetical list
of topics that appear in the book and the page number or address of the information. Database
indices work in a similar way, except that they generally work behind the scenes. You don’t ever see
them. But the computer constructs them and allows you to use them in your work. An index allows
the computer to work with the records according to the order of items in the key field.
MapInfo Professional requires fields to be indexed in order to use the Find command. Indices are
also used to improve performance in SQL Select and joins.
A query is just another word for a question. You query data to collect a particular type information
from your database. For example, if you wanted to know how many customers live within a certain
number of miles of your store, (and you had that kind of information in your database), you could
query the database to find out that information. The result of the query is query data. You can think
of query data as a subset of your data as in the example — a list of all the customers within 5 miles
and none of the customers who live further away. MapInfo Professional has tools to help you query
your data and display it on a map. For more about querying your data, see Selecting and Querying
Data on page 183.
What Data Can I Use in MapInfo Professional?
MapInfo Professional allows you to use data that was created in other file formats. When you bring
data into MapInfo Professional for the first time, you need to specify its format. For example, if your
data is in delimited ASCII format, choose Delimited ASCII from the File Format drop-down list.
Data file choices include:
•
•
•
Microsoft Access
Microsoft Excel
dBASE DBF
•
•
•
•
•
•
ESRI ® shapefiles
Raster Images
Grid Images
ASCII Delimited Text
Lotus 1–2–3
Remote Databases (Oracle, SQL Server, PostGIS)
MapInfo Professional 10.5
70
User Guide
Chapter 3: The Basics of MapInfo Professional
Data – Where MapInfo Professional Begins
•
•
Workspace
Comma Delimited CSV files
When you choose a particular file format, the File Name box will only list files that have the
appropriate extension. For example, if you choose dBASE DBF from the File Format drop-down list,
MapInfo Professional will only list files that are in dBASE format.
When you choose a file other than a MapInfo-formatted file type, MapInfo Professional creates a
table structure for that data based on the type of file that it is.
L
During the .TAB file creation process, the original file is in no way altered. The file retains its
original properties.
When you open that table in future work sessions, MapInfo Professional will treat these files as if
they were in MapInfo Professional’s native format. The next time you want to open the table, you
should choose the .TAB format for the table. If you accidentally attempt to open the file again with its
original file format, MapInfo Professional prompts you with the message:
Table definition already exists. Overwrite it?
This message displays because MapInfo Professional has already created a table for that file. To
use the file you have already created, press Cancel and open the associated .TAB file.
Also keep in mind that MapInfo Professional supports long filenames and UNC paths. The UNC
paths allow you to access your data without having to remember your drive mappings from one
session to another.
To display your table in the Map window, your data must contain X and Y coordinates. If it doesn’t
already, you can add them using MapInfo Professional. Assigning these coordinates is called
geocoding. More about geocoding follows later in this chapter and in Putting Your Data on the Map
on page 335.
The Help System contains these related topics:
•
•
•
•
•
•
•
•
•
•
Displaying your Excel (.XLS or .XLSX) Data
Displaying your Access (.MDB or .ACCDB) Data
Displaying your Comma Delimited Data
Displaying your dBase Data
Displaying your Lotus 1-2-3 Data
Displaying your ESRI Shapefile Data
Registering and Displaying your ASCII Data
Importing and Displaying GML File Data
Displaying Your Remote DBMS Data
Displaying and Importing Data from a Web Map Service
Support for Raster Images
MapInfo Professional supports raster image display. Raster images are computerized pictures.
These graphic images can be used as backgrounds for maps you create in MapInfo Professional
and can serve as a reference for your displayed data.
MapInfo Professional 10.5
71
User Guide
Chapter 3: The Basics of MapInfo Professional
Data – Where MapInfo Professional Begins
When you bring in a raster image to MapInfo Professional, you may need to register it (specify its
map coordinates) so MapInfo Professional can display it properly. Choosing the Raster Image file
format from the Open dialog box will bring you to the Image Registration dialog box where you can
specify the appropriate map coordinates. Once you register the image, a process that creates a
.TAB file for the image, you can open it as you would open any table in a Map window. Images that
you purchase from MapInfo Professional will already be registered.
If a raster image is georeferenced it will be automatically opened. If a raster image has an
associated world file, you will be prompted to choose the projection. If you open a raster image that
does not have any georeferencing data, you will be prompted to display or register the image.
For a full discussion of raster image display, see Registering SPOT Images in the Help System.
The MapInfo Professional raster handlers support:
•
•
•
LeadTools to version 15
MrSID SDK (3.2), to provide support for MG3 files
Multi-threading; specifically for ECW and the Government handlers (ADRG, ASRP, CADRG,
CIB, NITF)
AirPhotoUSA provides raster images at different elevations for particular areas in the United States.
The AirPhotoUSA map handler allows MapInfo Professional users to open and display the imagery
contained in AirPhotoUSA Map files as a layer. These files are treated just like any other raster file in
MapInfo Professional. The MAPINFOW.PRJ file contains AirPhotoUSA information.
You can use the AirPhotoUSA Conterminous U.S. coordinate system without making any changes.
However, if you want MapInfo Professional to recognize and give a name to that coordinate system,
or to use it for other purposes, you must add it to the MAPINFOW.PRJ.
Understanding the Files Associated with MapInfo Professional Tables
When you open your data file, MapInfo Professional creates a table. This table consists of at least
two separate files. The first file contains the structure of the data. The second file contains the raw
data. All MapInfo Professional tables have the following two files:
•
•
<SOMEFILE>.tab: This file describes the structure of your table. It is a small text file describing
the format of the file containing your data.
<SOMEFILE>.DAT or <SOMEFILE>.WKS, .DBF, .XLS, .XLSX: These files contain your tabular
data. If you are working with a dBASE/FoxBASE, delimited ASCII, Lotus 1–2–3, Microsoft Excel,
or Microsoft Access file, your MapInfo Professional table will consist of a .TAB file and your data
or spreadsheet file. For raster tables, the equivalent extension might be BMP, TIF, or GIF.
Your data may also contain graphic objects. Once you assign X and Y coordinates to your data
records, your table will also contain graphic objects. In Geocoding – Assigning Coordinates to
Records on page 353, you will learn how to assign X and Y coordinates to your data records so you
can display them on a map. If you already have graphic objects in your table, there are two more
files associated with the table:
•
•
<SOMEFILE>.MAP: This file describes the graphic objects.
<SOMEFILE>.ID: This file is a cross reference file that links the data with the objects.
MapInfo Professional 10.5
72
User Guide
Chapter 3: The Basics of MapInfo Professional
Data – Where MapInfo Professional Begins
For a Microsoft Access table, there will be a file SOMEFILE.AID associated with the table instead of
SOMEFILE.ID. This file is a cross reference file that links the data with the objects for a Microsoft
Access table.
Your table may also include an index file. The index file allows you to search for map objects using
the Find command. If you want to locate an address, city, or state using the Find command, those
fields must be indexed in your table. The index is located in:
•
<SOMEFILE>.IND
Opening Your Data in MapInfo Professional
You can open your Excel (.XLS or .XLSX), dBase (.DBF), Microsoft Access (.MDB or .ACCDB), and
ASCII (.TXT) in MapInfo Professional and display that data on a map. There are three steps to
accomplishing this:
1. Creating a copy of your data in MapInfo format.
2. Creating points on a map using either coordinates in your data or by matching your data to a
search file (see When Do I Geocode vs. Create Points? on page 336 for this process).
3. Display your data on the map (see Displaying your Data on a Map on page 336 to complete
this process).
If you are accessing your data remotely or use SpatialWare or other ODBC supported database
product, see Understanding Remote Tables and Databases on page 129 and Working with the
MapBasic Window in the MapInfo Professional Help System for additional support. For more
information about converting, displaying, and printing your data, see Understanding Your Data on
page 93.
Opening MapInfo Tables
To work with the data in your database, you open the file or table that contains the data. Pitney
Bowes Software Inc. provides some free introductory data you can open as soon as you get MapInfo
Professional.
L
•
When you open a table and select a new Preferred View from the drop-down list, MapInfo
Professional remembers your selection and uses it the next time you open a table.
For instructions on opening the free introductory data provided by Pitney Bowes Software Inc.,
see Opening the MapInfo Professional Introductory Data in the Help System.
To open a local table:
1. On the File menu, click Open. The Open dialog box displays.
L
If you are at the Quick Start dialog box (the first dialog box you see after starting MapInfo
Professional), choose the Open button. The Open dialog box displays.
2. Navigate to the data file you want to open. Use the Files of type drop-down to select the type
appropriate for your data.
MapInfo Professional 10.5
73
User Guide
Chapter 3: The Basics of MapInfo Professional
Data – Where MapInfo Professional Begins
3. Select the view you want of this data from the Preferred View drop-down list.
•
•
•
•
•
Automatic – MapInfo Professional chooses the most appropriate view. If the data is
mappable (for example, graphic objects are attached to the data), for example, MapInfo
Professional opens the table in a Map window. If you have a Map window displayed and the
table you want to open is mappable, MapInfo Professional will automatically open the table in
the current Map window. If the data is not mappable, MapInfo Professional will attempt to
open the table in a Browser window. If the table cannot be mapped or browsed, MapInfo
Professional opens the table using the No View option (no data is displayed).
Browser – MapInfo Professional attempts to open the table in a Browser window.
Current Mapper – MapInfo Professional attempts to add your data to the current Map
window.
New Mapper – MapInfo Professional attempts to open the table in a new Map window.
No View – MapInfo Professional opens the table, but no data is displayed.
L
When you open a table and select an option in the Preferred View drop-down list,
MapInfo Professional remembers what you selected and uses the same option the next
time you open a table.
4. Select the Create copy in MapInfo format for read/write to open it in native (.tab) format.
L
If you do not select the Create copy... check box, the file opens read-only.
5. To open the file, do one of the following:
•
•
Double click the file you want to open
Click the file you want to open to highlight it in the list and click Open.
Using either method, MapInfo Professional opens the data file.
Note that although an MapInfo Professional table consists of two or more component files
(STATES.TAB, STATES.DAT, STATES.MAP, etc.), only the .TAB file appears in the File Name box
of the Open dialog box. It is the only component file you must open. For more about these other
MapInfo file types, see Understanding the Files Associated with MapInfo Professional Tables
on page 72.
In MapInfo Professional you can work with a variety of table types. Some data tables are like the
example table we just discussed. Further subdividing this class of tables are data tables that contain
graphic objects (map objects) and data tables that do not (such as spreadsheets or external
database tables). Raster tables are graphic images that you can display in a Map window. These
computerized pictures do not have the same table structure of record, field, and index as data tables
do, and therefore, will not be discussed in this chapter. For more on raster images, see Working with
Raster Images in the MapInfo Professional Help System.
You can see what windows are currently open by reviewing the list at the bottom of the Window
menu. If one of these “More Windows” windows is the active window, the check box displays beside
the More Windows entry. To make another window active, click the entry in the Window list. The
window you selected comes to the forefront of the MapInfo Professional screen. When you select
the More Windows entry, the Select Window dialog box displays. To activate a window from this list,
either double-click the entry in the Select Window list, or click the entry and click OK.
MapInfo Professional 10.5
74
User Guide
Chapter 3: The Basics of MapInfo Professional
Data – Where MapInfo Professional Begins
A Note about the Preferred View Options
Of the five Preferred View options, Automatic and No View will work on all tables, regardless of
what kind of data they contain. MapInfo Professional attempts to open the table as specified for
Browser, Current Mapper, and New Mapper.
Of the five Preferred View options, Automatic and No View will work on all tables, regardless of
what kind of data they contain. MapInfo Professional attempts to open the table as specified for
Browser, Current Mapper, and New Mapper. If it cannot, it will open the table according to the
following rules:
•
•
•
If Current Mapper is selected, and there is no Map window displayed, MapInfo Professional will
attempt to open the table in a new Map window.
If Current Mapper or New Mapper is selected and the data is not mappable, MapInfo
Professional will try to open the table in a Browser window.
If the table cannot be mapped or browsed, MapInfo Professional will open the table using the No
View option (no data is displayed).
For more information, see Renaming a Table and Deleting a Table in the Help System.
Opening Data in Remote Tables
MapInfo Professional also enables you to access remote database data through its ODBC
connectivity support and the Oracle Spatial Object support. The MapInfo Professional ODBC
connectivity support supplies many ODBC drivers that you can easily install. Oracle spatial
databases enable you to store spatial objects with your conventional data in the same database.
This enables you to read and write geographies in Oracle Spatial without the need for a middleware
product such as MapInfo Professional’s SpatialWare, or SDE. You also gain better performance
through the Oracle Call Interface (OCI). In addition, Oracle applications can use this same spatial or
non-spatial data through other interfaces (ODBC, OCI, JDBC, PL/SQL, HTTP, IIOP, etc.) or use
MapInfo Professional 10.5
75
User Guide
Chapter 3: The Basics of MapInfo Professional
Data – Where MapInfo Professional Begins
other spatial or non-spatial tools (MapInfo Professional, ArcView, Intergraph, Excel, Forte, Formida,
etc.). For more about accessing remote data using ODBC connectivity, see Setting your Database
Connection Preferences in the Help System.
Using the MapInfo Places on Open Dialog Box
The Open dialog box provides a quick way to look for maps you have created.
1
1 The Places box. Select the Workspaces Directory option in the Places box, to
display the Workspace (.wor) type in the Files of Type list. If you select any other
entry in the Places box, MapInfo (.tab) displays in the Files of type list.
The Open dialog box provides many ways to quickly find the maps that you have created in a variety
of locations in your system and network.
L
The Places box on the left side of the Open dialog box allows you to select a directory in
which you may have your map and other MapInfo Professional tables and workspaces.
When you select the Workspaces Directory option in the Places box, the Files of type drop-down
list changes to Workspace (.wor) type. If you select any other entry in the Places box, MapInfo (.tab)
displays in the Files of type list.
•
For more information, see Opening MapInfo Professional Introductory Data in the Help System.
Opening Special File Types
There are additional file types that MapInfo Professional can read including rasters, grids, shape
files. For details about working with raster images, see Displaying a Raster Image and Registering
the Coordinates of a Raster Image in the MapInfo Professional Help System.
MapInfo Professional 10.5
76
User Guide
Chapter 3: The Basics of MapInfo Professional
Reviewing the Windows in MapInfo Professional
Opening a Grid Layer
A grid layer is a type of thematic map that displays data as continuous color gradations across the
map. To produce this type of thematic map, you interpolate point data from the source table. In
MapInfo Professional, a grid file from the data interpolation is generated and displays as a raster
image in a Map window.
•
For more information, see Selecting Point Objects in Grid Files in the Help System.
To open a grid layer:
1. On the File menu, click Open to display the Open dialog box.
2. Select Grid Image in the Files of type drop-down list.
3. Navigate to the directory in which your grid image is located and click the file you want to open.
4. Click Open to display the grid image.
Reviewing the Windows in MapInfo Professional
MapInfo Professional allows you to display your data in many different windows and with different
views at the same time. For instance, you can display the WORLD table of country boundaries in a
Map window to view the geographic boundaries. At the same time you can display the tabular data
of the WORLD table in a Browser window to see the country names, population, and other data in
the file. If you make a change in either window, it is reflected in the other.
Only one view can be active at a time. To make a different window active, click its title bar. Notice
that the menu bar changes depending on which window is active. For instance, when you are
working in a Map window when you also have a Browser open, only the Map menu is available on
the menu bar. Make the Browser active. The Browse menu replaces the Map menu.
There are many different types of windows you can display your data in, depending upon what you
need your data to communicate. This section covers the many ways you can display your data using
MapInfo Professional. Each of these display methods: map, list, graph, and presentation give your
information a different impact. How you display the information you have should depend upon what
effect you want.
MapInfo Professional 10.5
77
User Guide
Chapter 3: The Basics of MapInfo Professional
Reviewing the Windows in MapInfo Professional
Consider these options carefully before you select a display type.
•
•
•
•
Map windows present information arranged as conventional maps, allowing you to visualize the
geographic patterns of your data (for details, see Displaying Data in a Map Window).
Browser windows present information as tabular lists (just as conventional databases do),
allowing you to fully examine tabular data (for details, see Displaying Data in a Browser
Window).
Graph windows present information arranged as graphs, allowing you to visualize and make
comparisons of the purely numerical patterns (for details, see Displaying Data in a Graph
Window).
Layout windows present information in a polished and attractive way and can be embedded in
other applications such as Microsoft Word or PowerPoint (for details, see Displaying Data in a
Layout Window).
L
To switch between windows to change which is active, press the Ctrl + TAB keys.
Displaying Data in a Map Window
You use Map windows to display the geographic objects from your table on a map. Map windows
can display information from many tables at once, with each table a separate layer.
Opening a Table in a Map Window
You can create your maps or edit existing maps. You can open a Map window directly on the File
menu, by clicking Open or by selecting New Map window from the Window menu.
Getting Around in the Map Window
There are a wide variety of tools that allow you to zoom, pan, and move objects around the Map
window. Zooming allows you to look more closely or more widely at a particular geography. Panning
allows you to move around a map left, right, up, and down. Moving selected objects in an editable
layer is useful when you want to get your map right.
You can zoom using the mouse wheel or using the keyboard.
MapInfo Professional 10.5
78
User Guide
Chapter 3: The Basics of MapInfo Professional
Reviewing the Windows in MapInfo Professional
In addition to the usual zoom keys on your Main Toolbar (
,
- keys on the keyboard, to zoom in and out more precisely.
•
•
, and
), you can use the + and
When you press +, you zoom in by a factor of 2.
When you press -, you zoom out by a factor of .5.
You can pan in your Map window using the scroll bars or the Arrow keys Up, Down, Left, and
Right.
Further, you can move an object in an editable layer more precisely by selecting it and using the
following key combinations.
•
•
<CTRL + Arrow> - moves the editable, selected objects 1 pixel at a time
<CTRL + Shift Arrow> - moves the editable, selected objects 10 pixels at a time
L
These tools also apply to the Layout window.
Changing a Map's Zoom Level
You change a map's zoom level by specifying certain parameters in the Change View dialog box.
To change a map's zoom level do one of the following:
•
•
Choose Map > Change View. The Change View dialog box displays.
Click the Change View button on the Main toolbar. The Change View dialog box displays.
The Change View dialog box allows you to set various parameters of the map including:
•
•
•
•
•
Display the current zoom, scale or cursor position in the status bar (the default unit of
distance is miles which is specified in Map > Options).
Change the zoom, scale, and the center point of the current map view.
Behavior of the map when you resize the window.
Resize the map to fit the new window, keeping the view the same.
Set the map to preserve the current scale, so that resizing the window has the effect of letting
you see more or less of the map.
The Help System contains the following related topics:
•
•
•
Opening MapInfo Professional Introductory Data
Setting Margins for a Map Window when Printing
Editing Text in a Map or Layout
Displaying Data in a Browser Window
You use Browser windows to view and manipulate your data records in traditional row and column
form, typically used in spreadsheets and databases. Each column contains information about that
particular field, such as name, address, phone number, cable ID number, or order amount. Each row
contains all information relating to a single record.
•
For more information, see Displaying Data in a Browser Window in the Help System.
MapInfo Professional 10.5
79
User Guide
Chapter 3: The Basics of MapInfo Professional
Reviewing the Windows in MapInfo Professional
About the Browser Format
If you have ever worked with spreadsheets or databases, you are probably familiar with the Browser
format. Each row of the table contains one record, and each column in the record contains
information about a particular field (for example, last name, street address, order number, price, and
so forth). The name of the table appears in the Browser window’s title bar. Column titles appear
directly below the Browser window title bar, appearing as headings. You select a row by single
clicking the empty box appearing to the left of that row.
The Status Bar appears at the bottom left of the MapInfo Professional window. This bar displays the
range of records currently displayed within the Browser window out of the total number of records in
the table.
Opening a Table in a Browser Window
You can edit records in your table, copy records, add new ones, or delete existing records. To open
a Browser directly, on the Window menu, click New Browser Window.
To create a report of your data, use the Crystal Reports functionality included in MapInfo
Professional (on the Tools menu, click Crystal Reports).
•
For more information, see Opening Multiple Browsers, Scrolling through a Table, and Using the
Select Tool to Edit Browser Entries in the Help System.
How a Browser Displays in a Layout
A Browser window displays with the column headings at the very top of the frame. Immediately
below, it displays the contents of the table, starting with the row and column at the upper-left corner
of the table. It displays as many columns and rows as it can fit in the frame, regardless of how many
are displayed in the table. When you resize the frame, the number of rows and columns displayed
are adjusted accordingly. However, fields removed from the table with the Pick Fields command are
not displayed in a table frame.
MapInfo Professional 10.5
80
User Guide
Chapter 3: The Basics of MapInfo Professional
Reviewing the Windows in MapInfo Professional
The number of rows and columns that can be displayed in a frame depends on font size and column
width. The frame displays Table text using the font style and size for that Browser window. When
you want a different type style in the frame, you have to make the change in the Browser window
using Options > Text Style dialog box. When you use smaller type, you can get more rows and
columns in a frame.
You can also manually adjust column width in a Browser window without affecting the underlying
field size for the base table. You do this by clicking and dragging the short vertical bars separating
the column names in the Browser window.
The Help System contains the following related topics:
•
•
•
•
•
•
•
•
•
•
•
Adding a New Row to a Browser
Adding and Editing Text in a Browser
Adding Fields to a Browser
Choosing a Font for your Browser
Creating a Default Browser View
Preserving Column and Expression Settings in a Browser Window
Removing Fields from a Browser
Resizing a Browser’s Columns
Setting Margins for a Browser Window when Printing
Showing or Hiding a Browser’s Grid
Using the HotLink Tool in a Browser Window
Changing a Record's Data, Font, and Style
The Info tool allows you to choose an object or row and see a window displaying information from
the table about that object. Click another object with the Info tool button and its information appears
in the same window. Click the Ctrl-menu box [Close box] of the Info window to make it disappear.
Mouse Wheel Support for Browser Window
When you are working in the Browser window, you can use the mouse wheel to scroll through the
records. Roll the mouse button down to scroll down the list, and roll the mouse button up to scroll up
the list. You can use the Tab key to scroll right and the <Shift Tab> keys to scroll left in the Browser
window.
Displaying Data in a Graph Window
The Graph window allows you to visualize statistical relationships in graph format. You can create
many different kinds of graphs: 3D, area, bar, bubble, column, histogram, line, pie, scatter, and
surface graphs. You can also choose from a number of different graph templates.
To display a table as a graph:
1. From the File menu, click Open and select the table that you want to display as a graph.
2. Choose Window > New Graph Window.
MapInfo Professional 10.5
81
User Guide
Chapter 3: The Basics of MapInfo Professional
Reviewing the Windows in MapInfo Professional
After the graph displays you can invoke one of several editing dialog boxes from the Graph menu to
modify an extensive array of attributes. You can also move and resize objects within the graph
window until the desired graph is achieved.
For more information about using the graph features of MapInfo Professional, see Graph Help
System available by selecting Help > MapInfo Graphing Help Topics.
Displaying Data in a Layout Window
The Layout window allows you to combine Browsers, Map windows, Graph windows, and other
graphic objects into one layout which can then be sent to a printer or plotter. You use this type of
window to create presentation graphics. Layout windows have scroll bars at the right and at the
bottom like Map windows and Browser windows.
You can display rulers at the top and to the left to help you in positioning, sizing and aligning objects.
The Zoom displayed in the status bar indicates the magnification factor that is currently applied to
the Layout. When the zoom is 37.46%, then the Layout is being displayed 37.46% of its actual size.
When the zoom is at 123%, then the Layout is being displayed at 123% of its actual size.
Opening a Map in a Layout Window
To use a Layout window, on the Window menu, click New Layout Window.
L
MapInfo Professional has some excellent tools to assist you in moving around the Layout
window. See Getting Around in the Map Window on page 78 for these details.
The Help System contains these related topics:
•
•
•
•
•
•
•
•
•
•
Sending Objects to the Back of a Layout
Sending Objects to the Front of the Layout
Printing a Layout
Setting Printing Margins for a Layout
How a Map Legend Displays in a Layout
Printing a Legend in a Layout
Changing a Map Scale in a Layout
Moving a Map or a Layout
For instructions in sending objects to the back of a layout, see the Displaying Data in the Layout
topic in the Help System.
For instructions in sending objects to the front of a layout, see the Displaying Data in the Layout
topic in the Help System.
Other Windows for Displaying Data
There are two other ways of displaying data that are used less often or can be used in conjunction
with display options we have already reviewed.
•
Legend Windows are the key boxes at the bottom of the map that explain what the map symbols
mean. There are two different kinds of legend windows:
MapInfo Professional 10.5
82
User Guide
Chapter 3: The Basics of MapInfo Professional
Saving, Closing, and Exporting Your Work
•
a. The Thematic Legend window is automatically created and details the meaning of colors,
symbols and styles on a thematic map. Display or hide this legend in the Options menu, by
clicking the Show/Hide Theme Legend Window menu option.
b. The Cartographic Legend displays legend frames for any map layer, not just thematic map
layers. The legend window displays the legend, or key, to the cartographic data on your map.
The legend frames can all be in one window, or can be split among several legend windows
for the same map. Therefore, each map can have one or more cartographic legend windows
containing the frames of your choice. Additionally, you can customize the text and style of the
information presented. Modifications to the legend can be made through shortcut menus
you access by right-clicking in the legend window or through the Legend menu. You can
learn more about legends in Working with Thematic Maps and Legends on page 252.
Redistricting Windows allow you to create groupings of spatial information. This is a little more
complex than these other options. For more information about redistricting windows, see
Redistricting in the MapInfo Professional Help System.
Saving, Closing, and Exporting Your Work
Preserving your work is an important part of being productive. MapInfo Professional has a wide
variety of ways you can save what you are working on, depending upon what needs to be saved and
how you need to retrieve it.
Saving a Workspace
If you work with the same tables repeatedly, you know that opening each one individually every time
you use it can be tedious. With MapInfo Professional’s workspace feature, you can automate this
process so you can get back to the business of creating maps and analyzing data sooner.
When you work with MapInfo Professional you generally use many different tables and windows. A
Map window, for instance, is likely to be built of several layers. MapInfo Professional uses
workspaces to save your work setup from session to session. Workspaces prevent you from having
to reassemble all the pieces of your earlier setup from scratch. So, you don’t have to reopen tables,
re-create maps or layouts, resize windows, or do anything else just to duplicate what was on your
desktop the last time you were using MapInfo Professional.
CAUTION:
Saving a workspace will not save edits you have made to tables in the
workspace.
If you close a window or table and you have thematic maps, graphs, label settings or label edits, or
cosmetic objects pending, MapInfo Professional will prompt you to save the session to a workspace.
•
•
For more information, see Saving a Workspace and Saving a Map Window as a .TAB File in the
Help System.
For instructions on saving a Map window as a .TAB file, see the Help System.
MapInfo Professional 10.5
83
User Guide
Chapter 3: The Basics of MapInfo Professional
Saving, Closing, and Exporting Your Work
Saving Your Workspace as an XML-Based MWS File
You can save the maps in your workspace out to an XML format for use with MapXtreme (2004 or
later) applications. When saving a workspace to MWS format, only the map windows and legends
are saved. All other windows are discarded as MapXtreme applications cannot read that information.
Once your workspace is saved in this format, it can be opened with the Workspace Manager utility
that is included in the MapXtreme installation or with an application developed using MapXtreme.
The file is valid XML you can view it using any XML viewer or editor.
L
You will not be able to read files saved in MWS format in pre-8.0 versions of MapInfo
Professional. MWS files created with MapInfo Professional 7.8 or later can be validated using
schemas supplied with MapXtreme 2004 or later.
You can set the visibility of a modifier theme without regard to its reference feature layer, so you can
turn the visibility of the main reference layer off but still display the theme. In MapXtreme, the
modifier themes (Dot Density, Ranges, Individual Value) are only drawn if the reference feature
layer is visible. To ensure that modifiers marked as visible in MapInfo Professional display in tools
like Workspace Manager, we force the visibility of the reference feature layer so that its modifier
themes display.
•
•
For specific instructions, see Saving your Workspace as an XML-Based MWS File in the Help
System.
For more information, see Caveats for Saving Label Expressions to MWS and Caveats for
Saving Thematic Expressions to MWS in the Help System.
Exporting to GeoTIFF (*.tif) Format
MapInfo Professional includes the capability of exporting Map windows to GeoTIFF (*.tif) export
format. GeoTIFF files are designed to connect a raster image to its location on the earth.
Georeferencing information is written directly to the *.tif file so that it can be used in other
applications. This section explains the requirements for exporting maps to GeoTIFF format. Using
GeoTIFF format has the following requirements:
•
•
•
The window you are exporting is a Map window.
The Map window’s projection contains an EPSG code. Projections that do not have an EPSG
code are not supported.
The Map window must not be rotated, or contain a raster image that causes a rotation.
GeoTIFF Export Procedure
To export a Map window to a GeoTIFF format file, do the following:
1. Open the desired layers in a Map window, if you do not have your map open already.
2. Make the Map window active.
3. Choose File > Save Window As. The Save Window As dialog box displays on the screen.
4. In the Save in box, select the destination folder of the exported file.
MapInfo Professional 10.5
84
User Guide
Chapter 3: The Basics of MapInfo Professional
Saving, Closing, and Exporting Your Work
5. In the Save as type drop-down list, click the arrow to see the file format choices. Select GeoTIFF
(*.tif).
6. In the File name box, enter a name for the exported file.
Click Save and continue with the normal Save Window As process.
•
For more information about the conditions of GeoTIFF exporting, see Exporting to GeoTIFF
Format in the Help System.
Saving a Table or a Copy of a Table
To save changes to map objects or data, you must save the table. (On the File menu, click Save
Table.) A dialog box displays asking you to choose which table you want to save.
You can also save a copy of the table under a new name, using Save Copy As. This, in essence,
creates a new table. This is helpful in several instances, as when you want to:
•
•
•
•
•
Retain any changes while preserving the original table.
Save a table with a temporary column (from Update Column).
Create a new table before you make editing changes to the original table.
Save spreadsheet files that you wish to modify in MapInfo Professional.
Save a table in a different projection.
To save a copy of the table:
1. On the File menu, click Save Copy As. The Save Copy of Table dialog box displays.
2. Choose the file to save and click OK.
3. Give the file a new name.
The original table remains unchanged and open for all further changes. The new table does not
open immediately after its creation, but can be opened for use at any time. When choosing a name
for your new table that begins with a number, MapInfo Professional adds an underscore to the
beginning of the table name. For instance, your table 1STREETS.TAB will become
_1STREETS.TAB.
Saving a copy of a raster table only saves a copy of the *.tab file, not the image. You cannot change
the projection of a raster or grid table using Save Copy As. To do this go to the Table menu, point to
Raster and click Modify Image Registration and click the Projection button. Then save the file
from there.
Since MapInfo Professional supports long filenames, it is easier to give the new table a name that is
descriptive and at the same time distinguishes it from the original file.
The Help System contains these related topics:
•
•
•
•
•
•
Saving a Copy of your Table as a New Table
Saving a Copy of Your Table in a Different Projection
Tables you Cannot Update
Choosing Ascending vs. Descending Sorts
Column Name Syntax in the Order By Columns Field
Rearranging a Table's Column Order
MapInfo Professional 10.5
85
User Guide
Chapter 3: The Basics of MapInfo Professional
Saving, Closing, and Exporting Your Work
•
•
Saving Changes Made to a DBMS Table
Saving a Copy of a Table to a DBMS Server
Closing a Table
Closing a table removes it from active use in your current session. Choose the Close command
from the File menu to close tables. When you close a table, you automatically close all views of that
table. If you close a table that is displayed in a Map window with other tables, MapInfo Professional
removes that table from the window, but the Map window remains open.
In addition, any subset tables of the original table (known as query tables) also close. You can use
the Close command for any table, whether or not it is displayed in a window. Opening and closing
tables is different from opening and closing windows in which you view your tables. You can open a
table without opening any views of the data. Similarly, closing a window does not close the table (or
tables) you are viewing in the window. They are still open and available for use. To close a window,
click the Ctrl-menu box in the upper-left corner of any window and select Close.
If you have made changes to a table but have not yet saved those changes, MapInfo Professional
will ask you if you want to save them before closing the table. To save your changes, choose Save
Table from the File menu.
•
For more information, see Closing a Table, Closing All Open Tables, and Closing Multiple Tables
in the Help System.
Opening vs. Importing
You must open a table before you can use it. The Open command activates a dialog box for opening
tables, (opening a table is described below). Choose the appropriate table by double-clicking on it in
the dialog box.
Most programs require you to import files created in some other programs. MapInfo Professional
allows you to work directly with files created in other programs. When you have a file in one of the
following non-MapInfo Professional formats, you do not have to import it:
•
•
•
•
•
dBase DBF
Delimited ASCII
Lotus 1-2-3
Microsoft Access Database
Microsoft Excel
By not importing data you save time; opening a file is quicker than importing it. You also save disk
space. When you import a file, you make a copy of it. Since MapInfo Professional works directly with
files from other programs, it does not have to make a copy.
When MapInfo Professional opens a file from some other program, it creates a file with a .TAB
extension. This file describes the format of the file that actually contains the data. When you have
opened a non-MapInfo Professional file, such as a Lotus file, in a previous session and attempt to
open it again, the following prompt appears:
Table definition already exists. Overwrite it?
MapInfo Professional 10.5
86
User Guide
Chapter 3: The Basics of MapInfo Professional
Saving, Closing, and Exporting Your Work
The table definition referred to is the .TAB file. It does not hurt anything if you continue. MapInfo
Professional overwrites the .TAB file and opens the file.
Exporting Your Data to a New Format
You can export your Map window to other file formats with the Save Window As command (on the
File menu, click Save Window As). This enables you to use your map in another application, such
as word processing, presentation, or computer publishing packages.
Supported Export Formats
You can save data in a number of formats in MapInfo Professional. Windows .bmp is the initial
default. The Save Window to File dialog box sets the last-used format as the default. Formats
include:
•
•
•
•
•
•
•
•
•
•
•
•
•
Windows Bitmap (*.BMP)
Windows Metafile (*.WMF)
Windows Enhanced Metafile (*.EMF)
JPEG File Interchange Format (*.JPG)
JPEG 2000 (*.JP2)
Portable Network Graphics Format (*.PNG)
Tagged Image File Format (*TIF)
TIFF CMYK (*.TIF)
TIFF CCITT Group 4 (*.TIF)
TIFF LZW (*.TIF)
Graphic Interchange Format (*.GIF)
Photoshop 3.0 (*.PSD)
Comma Delimited Format (.CSV)
•
See Understanding the Advanced Exporting Options in the MapInfo Professional Help System.
•
For more information, see Understanding the Advanced Exporting Options and Setting your
Output Setting Preferences in the Help System.
Importing and Exporting Data in AutoCAD Format
Because CAD packages represent drawings in non-earth coordinates, all drawings imported or
exported between MapInfo Professional and CAD suffer some distortion. This comes from trying to
display non-earth information on a spherical coordinate system (like the globe). Coordinate
conversions are used to assign longitude/latitude coordinates to CAD drawings that were created
using non-earth coordinates. Conversions near the equator are more exact than conversions at the
extremes of the hemispheres. To minimize distortion, import and export with no coordinate
conversions and avoid translating maps that cover large areas.
•
For more information, see Importing DXF Attributes into MapInfo Professional and Importing
Attributes with Nested Blocks in the Help System.
•
For more information, see DXF Exporting Notes in the Help System.
MapInfo Professional 10.5
87
User Guide
Chapter 3: The Basics of MapInfo Professional
Saving, Closing, and Exporting Your Work
Cropping Images
When MapInfo Professional exports a window, it does not clip objects that extend beyond the edges
of the windows, but it does export information about where the clipping is.
Other programs always honor the clipping of bitmap files. As for other formats, the behavior varies
depending on the program that is used to display and print the file. Many programs, such as drawing
programs, "explode" the file into individual objects. A file containing several country boundaries
would explode into several polygon objects, one for each country. Programs like these usually
ignore the clipping information that MapInfo Professional stores in the file.
Other programs, such as word processing programs and spreadsheets, typically open files as one
compound object, without trying to explode them into component objects. These programs usually
honor the clipping information and clip the contents appropriately.
For example, if you are exporting a Map window that displays part of Germany, but not all of it, the
exported file contains the entire image of Germany. It also contains information about where
MapInfo Professional clipped that image in its Map window. But when you open the exported
window in your target application, a drawing package for example, the image of Germany may not
be clipped.
Exporting to ASCII Format
MapInfo Professional also allows you to export your tabular data to a delimited ASCII file. This file
can later be edited with a text editor or imported into another package. When you export to ASCII,
MapInfo Professional displays the Delimited ASCII Information dialog box, where you choose your
delimiter character. You can also choose to have the first row of the ASCII file become column titles.
MapInfo Professional also displays a dialog box that you use to indicate the character set for the
exported ASCII file. Different platforms use different character sets. MapInfo Professional must
know the platform where you are going to use the exported file in order to provide the appropriate
character set. No graphical data is exported to ASCII.
Exporting to dBase (*.DBF) Format
MapInfo Professional can export tabular data into dBASE DBF format. Exporting to DBF creates
only the .DBF file. No graphical data is exported to dBASE. When you save your table in DBF
format, you create a .DBF file, as well as some other files. These other files contain graphic
information (for example, MapInfo Professional indices and other information that MapInfo
Professional uses).
MapInfo Professional also displays the dBASE DBF Information dialog box that you use to indicate
the character set for the exported DBF file. Different platforms use different character sets. MapInfo
Professional must know the platform where you are going to use the exported file in order to provide
the appropriate character set.
MapInfo Professional 10.5
88
User Guide
Chapter 3: The Basics of MapInfo Professional
Using the Tools in the Tool Manager
Smoothing Map Images during Export
You can anti-alias a table during the export process to give you more control over your map images.
This is particularly important when you are saving maps created in MapInfo Professional for use in
other Windows-based applications, in particular in slide presentations or for web pages.
Anti-aliasing allows you to smooth images in all types of windows such as Map windows, layouts,
legends, and graphs.
L
You cannot anti-alias images you are exporting to .EMF or .WMF format, because these are
not true raster formats.
There are three smoothing options you can use to customize your raster image:
1. Smooth using a Filter value. You can set a flag that selects one of six filters that allow you to
choose the direction the filter is applied to the image from.
2. Smooth using a Mask value. You can select a value that indicates the size of the area you want
to smooth. For example, to create a 3x3 pixel mask value, you would enter a 3 in this field. This
would limit the amount of change in the color of the pixels. Typically mask sizes would be 2-3
pixels when exporting at screen resolution. If you are exporting at a higher resolution, a larger
mask might be appropriate.
3. Smooth using a Threshold value. You can select a threshold value to indicate which pixels to
smooth. Each pixel in an image has a value based on its color. The smaller the pixel value, the
darker the color. Select this option to smooth all of the pixels above the threshold you enter in
this field. When you set this value to 0, MapInfo Professional will smooth all of the pixels.
You must either set a global preference for these anti-aliasing options or set them locally during the
export process (using the Advanced button).
•
For specific instructions, see Smoothing Map Images During Export in the Help System.
Using the Tools in the Tool Manager
MapInfo Professional contains many additional tools that simplify mapping tasks, convert MapInfo
Professional files to different file formats and vice versa, automate tasks for working with DBMS
tables, and more. The Tool Manager helps you run and manage these many utilities easily.
Use the Tool Manger to run, add, edit, or remove tools from the currently registered list of tools in the
Tools menu. You can also configure a tool to run automatically upon startup. If you performed a
Custom installation, you may have elected to not install the tools. In this case when you open the
Tool Manager dialog box, the list box will be empty (on the Tools menu, click Tool Manager).
For a list of available tools and for information about using the tools in MapInfo Professional, see the
MapInfo Professional Help System.
MapInfo Professional 10.5
89
User Guide
Chapter 3: The Basics of MapInfo Professional
File Format Types Supported
File Format Types Supported
You can open the following file types using the File > Open capability in MapInfo Professional:
•
•
•
•
•
•
•
•
•
•
•
•
•
ACCDB – Microsoft Access files
CSV – Comma Delimited files
DBF – dBASE DBF files
MDB – Microsoft Access files
TAB – MapInfo .TAB files
Raster image files – (*.bil, *.sid, *.gen, *.adf, *.img, *.ntf, *.ecw, *.url, *.tif, *.grc, *.bmp, *.gif,
*.tga, *.jpg, *.pcx, *. jp2, *.j2k, *.png, *.psd, *.wmf, *.emf, *.map)
SHP – ESRI Shapefiles
TXT – Delimited ASCII files
WKS – Lotus 1-2-3 files (*.wk1, *.wks, *.wk3, *.wk4)
WOR – MapInfo workspace files
XLS – Microsoft Excel files
XLSX – Microsoft Excel files
Grid images – (*.adf, *.flt, *.txt, *.asc, *.img, *.dem, *.dt0, *.dt1, *.dt2, *.mig, *.grd)
L
Grid Format Direct Support: The following grid handlers support direct read of DEM-USGS
Text (.dem); GTOPO30 (.dem) and DTED levels 1, 2, 3 (.dt0, .dt1, .dt2). These grid handlers
are read-only; they cannot be used to create grid files during the Create Grid Thematic
interpolation process.
Using the Universal Translator, you can import these file format types:
•
•
•
•
•
•
•
•
CATD.DDF – Spatial Data Transfer Standard (SDTS)
DWG, DXF – AutoCAD
DGN – Microstation Design files (DGN)
E00 – ESRI ArcInfo format
FT – Vector Product Format (VPF)
MID, MIF – MapInfo file formats (MIF)
SHP – ESRI Shapefile format
TAB – MapInfo .TAB files
You can import the following file types into MapInfo Professional using Table > Import:
•
•
•
•
•
•
DXF – The graphic/data interchange format (DXF) for AutoCAD and other CAD packages
GML – OS MasterMap format
GML, XML – Geographic Markup Language (GML) 2.1
IMG – A file format for MapInfo Professional for DOS image files
MBI – MapInfo Professional Boundary Interchange format (MBI)
An ASCII file for MapInfo DOS boundary files.
MIF – MapInfo Professional Interchange Format (MIF)
MapInfo Professional’s data interchange format (ASCII file format).
MapInfo Professional 10.5
90
User Guide
Chapter 3: The Basics of MapInfo Professional
File Format Types Supported
•
MMI – MapInfo DOS MMI
L
You can download raster handlers for NIMA formats such as ADRG, CADRG, ASRP, CIB,
USRP, and NITF formats from the Pitney Bowes Software Inc. website or get them from the
Installation DVD.
MapInfo Professional imports graphics and textual information from MapInfo Professional
Interchange Format, DXF, MBI, and MMI files. MapInfo Professional imports only graphics from
IMG.
These are the Raster image file formats MapInfo Professional supports:
•
•
•
•
•
•
•
•
•
•
•
•
•
•
•
•
•
•
•
•
•
•
•
•
ADF – ArcInfo coverage Data File (ADF)
ASC – ASCII text file
BIL – Satellite Pour l'Observation de la Terre (SPOT) satellite images
Spot Image Formats 1.5 and 4.0: 8 Bit Gray, Format 1.5, 8 Bit Gray, Format 4.0, 24 Bit Color,
Format 1.5, 24 Bit Color, Format 4.0
BMP – Windows bitmap (BMP) Monochrome: 8 Bit Color, 24 Bit Color
filename.* – Compressed ARC Digitized Raster Graphic (CADRG) format
filename.* – Controlled Image Base (CIB) format
ECW – Enhanced Compression Wavlet (ECW) 2.0 format handler by ER Mapper
EMF – Enhanced Metafile Format
FLT – Image Filter (FLT)
GEN – ARC Digitized Raster Graphic (ADRG) format
GEN – ARC Standard Raster Product to 1.2 (ASRP) 1.2 format
GIF – Graphics Interchange Format (GIF)
GIF – Graphics Interchange Format (GIF89a) non-interlaced only Monochrome: 8 Bit Color
GRC – MapInfo Vertical Mapper
GRD – MapInfo Vertical Mapper
MapInfo Professional treats GRD files as either a grid or raster image. If the associated .TAB file
contains a RasterStyle 6 entry, then MapInfo Professional treats the file as a grid.
JFIF – JPEG File Interchange Format (JFIF)
8 Bit Gray, 24 Bit Color, No Subsampling, 24 Bit Color, YUV422 Subsampling, 24 Bit Color,
YUV411 Subsampling
JP2 – Joint Photographic Experts Group (JPEG) 2000 format
MapInfo Professional supports creating JPEG 2000 files using Save Window As and viewing
JPEG 2000 files using the LeadTools raster handler.
JPG – Joint Photographic Experts Group (JPG)
JPEG – Joint Photographic Experts Group (JPEG)
8 Bit Gray, 24 Bit Color, No Subsampling, 24 Bit Color, YUV422 Subsampling, 24 Bit Color,
YUV411 Subsampling
NTF – National Imagery Transmission Format (NITF) version 2.x format
PCX – ZSoft Paintbrush
PCX – Format Version 5 (Paintbrush Version 3.0)
Monochrome, 8 Bit Gray, 8 Bit Color, 24 Bit Color
PNG – Portable Network Graphics (PNG) format
PSD – Photoshop 3.0
MapInfo Professional 10.5
91
User Guide
Chapter 3: The Basics of MapInfo Professional
File Format Types Supported
•
•
•
•
•
•
•
•
•
SID – MrSID format
The MrSID raster handler allows you to open and display raster images compressed in the
MrSID format
TIF – Geographic Tagged Image File Format (GeoTIFF)
TIF – Tagged Image File Format (TIFF)
TIFF Revision 5.0, Monochrome (Class B), Uncompressed, Monochrome (Class B), PackBits
Compression, 8 Bit Gray (Class G), Uncompressed, 8 Bit Color (Class P), Uncompressed, 24 Bit
Color (Class R), Uncompressed
TIF – Tagged Image File Format (TIFF) CMYK
TIF – Tagged Information File Format (TIFF) CCITT Group 4
TIF – Tagged Information File Format (TIFF) LZW
TXT – Text
TGA – Targa
TGA Truevision File Format Specification 2.0. 8 Bit Gray, 8 Bit Color, 24 Bit Color
WMF – Windows Metafile Format (WMF)
The raster handler will load a rasterized version of the WMF file.
Map Tile Server raster images. For more information, see Enhancing Map Data using a Mapping
Tile Server on page 414.
File Limitations for MapInfo Professional Supported Formats
Keep the following notes in mind when working with these MapInfo formats:
•
•
•
•
MapInfo Professional only supports the DXF file import to release 13. This has been
superseded by the Universal Translator and Open Universal Data feature.
The Open Universal Data feature supports all DXF formats up to the current AutoCAD
release. While it is our company’s intention to keep pace with the new releases of FME, if you
extend the application to import AutoCAD DXF files using a newer version of FME before we
have upgraded our product, errors may occur.
You can have maximum 500 files open at a time in MapInfo Professional if you remove the
HKEY_LOCAL_MACHINE\SOFTWARE\MapInfo\MapInfo\Common Max Files registry key.
You can have up to 125 files open at a time for editing in MapInfo Professional.
MapInfo Professional 10.5
92
User Guide
Understanding Your Data
You cannot work for long in MapInfo Professional without wanting to add more
or enhance your own data in some way. This chapter teaches you how to get
the most from your MapInfo tables and how to create reports with your data.
Topics in this Section:
Working with MapInfo Tables . . . . . . . . . . . . . . . . . . . . . . . . . . . . .94
Creating a Report of your Data . . . . . . . . . . . . . . . . . . . . . . . . . . .106
4
Chapter 4: Understanding Your Data
Working with MapInfo Tables
Working with MapInfo Tables
After you have brought your data into MapInfo and created .tab files, you can manage them within
MapInfo Professional. You can view any database table in MapInfo Professional, once you have
converted it to MapInfo format. Additionally you can add or remove fields, change the order, name,
type, width, or index of any field. You can also specify or determine the projection of the table from
this dialog box. You can also check if the table is mappable (contains map objects). To make these
types of changes, see Editing a Table’s Structure on page 103.
Keep in mind that you can only view the structure of a spreadsheet or database file that you convert
into MapInfo Professional’s table structure. See Displaying your Data on a Map on page 336 for
these instructions.
To view the structure of a table:
•
•
On the Table menu, point to Maintenance and click Table Structure. The View/Modify
Table Structure dialog box displays.
For more information, see Accessing StreetPro Data in the Help System.
Adding to a Table
One important operation in maintaining tables is the ability to update the data contained in the table.
MapInfo Professional’s Update Column feature allows you to:
•
•
•
Add a temporary column or update an existing column with data from another table
Update a table
Place graphic information into visible columns
Updating Information in a Subset of a Table
Use Update Column to update information in a subset of a table. For example, you could marquee
the southeast of the United States, then use Update Column to set the "sales rep" field to the name
of your sales representative for the Selection table.
You can update all the rows in a table or a selection of rows. To update a selection of rows you need
to select the rows using Select, SQL Select, the Select tool, the Boundary Select tool, or the
Radius Select tool, and then update the selection.
Adding a Temporary Column using Update Column
If you need to bring data from one table into another, you can use the Update Column command in
MapInfo Professional. In fact to bring this data into the table, you can either add a temporary column
or you can update an existing column. In both cases, use the Table menu to click Update Column
to bring over the information.
You have tremendous flexibility with how information is imported and what information is transferred.
You can perform aggregate functions to transfer averages, minima, maxima, sums, weighted
averages, and proportional sums. You can also create expressions to derive additional information
from the data.
MapInfo Professional 10.5
94
User Guide
Chapter 4: Understanding Your Data
Working with MapInfo Tables
•
For specific instructions and an example, see Adding a Temporary Column using Update
Column in the Help System.
Geographic and Descriptive Joins
A join allows you to join two tables. To do this, MapInfo Professional must know how to associate
records in the two tables.
For example, assume you are shading STATES by the values in SALES. Obviously, you want all
Pennsylvania sales to be associated with Pennsylvania, all Maryland sales to be associated with
Maryland, etc. MapInfo Professional has two ways of doing this:
1. From a common descriptive field.
2. Geographically/graphically.
In this case, the most likely descriptive field contains the state name or an abbreviation for the state
name. Thus the STATES table might have a field called Abbr, containing the abbreviation of the
state name, and SALES might have a field called State, that contains the state abbreviation.
MapInfo Professional matches the entries in these two fields so that information in the SALES State
field is matched to the record having the same entry in the Abbr field of STATE, thus matching NY
(sales) to NY (state), PA (sales) to PA (state), etc.
However, if both tables contain graphic information, MapInfo Professional can also make a graphic
match.
For example, if you are a conservation official and you want to shade a map of COUNTIES
according to the number of FIRES that occurred in the last year. Your FIRES database has been
geocoded. In this case MapInfo Professional could examine the coordinates of each fire location and
determine the county where the fire had occurred. That would allow MapInfo Professional to
associate each fire record with the appropriate county.
•
For more information, see Specifying a Join Based on Descriptive Criteria and Specifying a Join
Based on Geographic Criteria in the Help System.
Updating a Table
For a quick visual way to update your table, select the objects in the Map window and use Update
Column to update the table with the new value. This would be useful when you want to update a
number of objects with the same value.
To include the District column in the STATES table:
1. Create the District column (on the Table menu, point to Maintenance and click Table
Structure) in the States table.
2. Add a field for Districts.
3. Redisplay the STATES table in a Map window.
4. Select the appropriate states with the Marquee tool (or other selection method).
5. On the Table menu, click Update Column and fill in the dialog box as illustrated in the next
figure. Be sure to put the value in quotes so MapInfo Professional does not treat it as a new
column name.
MapInfo Professional 10.5
95
User Guide
Chapter 4: Understanding Your Data
Working with MapInfo Tables
6. Click OK. MapInfo Professional creates a query table of the southeastern states with the District
column containing the value Southeast.
7. Save the table to preserve the new information.
Appending Rows to a Table
Use the Append Rows to Table command to attach the records from one table to another. The two
tables should have the same set of columns in the same order.
To append data to another table:
1. On the Table menu, click Append Rows to Table. The dialog box displays.
2. Specify the table containing the records you want appended.
3. Specify the table to which the records will be appended and click OK.
If the corresponding columns do not have the same data type, a best fit is done to convert the data
to the appropriate type. If the order of the columns is not the same between the two tables, use the
Table Structure command to reorder the columns before using Append Rows to Table.
L
If tables are mappable, the bounds of the map in one table must be large enough to allow
objects from the other table to fit within it. Otherwise, the objects will be distorted to the
bounds of the Map window. Use the Check/Set CoordSys Bounds tool to alter the map
bounds of the table if this occurs. See Using the Tools in the Tool Manager on page 89 for
more about the CoordSys Bounds tool.
MapInfo Professional 10.5
96
User Guide
Chapter 4: Understanding Your Data
Working with MapInfo Tables
Appending One Table to Another
To append one table to another:
1. Choose Table > Append Rows to Table. The Append Table dialog box displays.
2. Choose the table you want to append from. Select a table in the Append Table drop-down list.
3. Choose the table you are appending to. Select a table in the To Table drop-down list.
4. Click OK. The status of the append operation displays.
5. Click Stop to halt the append process.
When the columns of the two tables are not ordered properly, so that columns with corresponding
positions do not have corresponding data, use Modify Structure to change the order of the columns
in one of the tables.
You can use SQL Select to reorder the columns of one of the tables and then append the results.
Parsing Data from One Column to Multiple Columns
If you have imported data into MapInfo Professional from another format, there is always the chance
that the data will not come in exactly the way you want it. In some instances, items that should
appear in separate columns may be put together in one column. The following is a series of column
updates that parses one column of full names (first, middle, and last) into three parts. It works even
if there is no middle name, or if there is only a last name.
To parse data from one column to multiple columns:
1. On the File menu, click Open and open the table to be modified.
2. Add three new columns to your table. On the Table menu, point to Maintenance and click Table
Structure. Add two character columns of size 15. Call them FIRST and MIDDLE. Then add a
character column called LAST of size 30.
3. Put the full name into the column called LAST by choosing the Table menu, and clicking Update
Column. Fill in the Update Column dialog box.
MapInfo Professional 10.5
97
User Guide
Chapter 4: Understanding Your Data
Working with MapInfo Tables
The column to update is LAST, and we get the Value from the column that has the full name in it.
Remember we are only working with one table, so the Table to Update and Get Value From
Table should be the same table. In the following example, the table is TABLE1 and the full name
column is your_full_name_column. You should fill in your own values for these two items.
4. To parse the first name out of the full name column, choose the Table menu and click Update
Column. Fill in the Update Column dialog box.
The Column to Update is: FIRST
The Value is: left$(LAST, instr(1,LAST,” “))
5. To parse the last name out of the full name column, on the Table menu, click Update Column.
Fill in the Update Column dialog box.
MapInfo Professional 10.5
98
User Guide
Chapter 4: Understanding Your Data
Working with MapInfo Tables
The Column to update is: LAST
The Value is: Right$(LAST, Len(LAST)-Instr(1,LAST,” “)).
6. To parse the middle name out of the full name column, on the Table menu, click Update
Column. Fill in the Update Column dialog box.
Update the MIDDLE column with the Value: Left$(LAST, Instr(1,LAST,” “))
7. Then update the LAST column again by returning to the Table menu, clicking Update Column,
and filling in the dialog box.
The Value is: Right$(LAST, Len(LAST)-Instr(1,LAST,” “))
8. Click OK to update the column.
MapInfo Professional 10.5
99
User Guide
Chapter 4: Understanding Your Data
Working with MapInfo Tables
Placing Graphic Information in Visible Columns
Update Column is also useful to put graphic information into columns so that it is visible. Tables that
contain map objects store the graphic information about these objects invisibly. Using Update
Column, you can bring some of that information into a column so it can be viewed in a Browser.
Update Column with CentroidX(Obj), CentroidY(Obj) uses the Session Projection Preferences (if
set), otherwise it defaults to Longitude/Latitude. For example, you want to display the longitude and
latitude coordinates of a table of radio station point locations in a Browser. In this example, you are
only working with one table, RADIOLOC, but you still use Update Column as in the Add Temporary
Column example.
•
For more information, see Placing Geographic Information in Visible Columns in the Help
System.
Mouse Wheel Support for Browser Window
When you are working in the Browser window, you can use the mouse wheel to scroll through the
records. Roll the mouse button down to scroll down the list, and roll the mouse button up to scroll up
the list. You can still use the Tab key to scroll right and the <Shift Tab> keys to scroll left in the
Browser window.
Adding a Row to a Table
You can add a temporary row to an editable MapInfo table.
To add a row:
1. On the Window menu, click New Browser window.
2. Choose an editable table from the drop-down list.
3. Click OK to display the table in a Browser window.
4. On the Edit menu, click New Row to add a row to the bottom of the table.
5. Type the new data into each appropriate column of the new row.
6. When you are finished adding rows, on the File menu, click Save Table to save the new data.
The Save Table dialog box displays.
7. Click Save to save the new row(s).
Creating a New Table
You can bring in data tables from several outside sources: dBASE, Excel, Access, Lotus 1–2–3,
shapefiles, Grid, comma delimited, and delimited ASCII. You can also create your own database
directly in MapInfo Professional. These databases can be opened and displayed as maps (providing
they contain graphic objects), Browsers, or graphs.
To create a table in MapInfo Professional:
1. On the File menu, click New Table. The New Table dialog box displays.
MapInfo Professional 10.5
100
User Guide
Chapter 4: Understanding Your Data
Working with MapInfo Tables
2. Choose one or more from the following:
•
•
•
Open New Browser — Click this check box to display the new buffer in a new Browser
window only.
Open New Mapper — Click this check box to display the new buffer in a new Map window.
Add to Current Mapper — Click this check box to display the new buffer in the current Map
window.
3. Do one of the following and click OK:
•
•
To create a new table and new table structure, click Create New.
To create a new table based on the structure of an existing table, click Using Table and
select from the list of open tables.
4. Choose OK. The New Table Structure dialog box displays.
If you selected Create New, this dialog is empty. You can remove a field by
highlighting it and clicking the Remove Field button.
5. Choose Add Field to begin adding new fields to the database’s structure. Give the field a name,
type, width, and specify whether the field will be indexed.
6. Continue to add fields until you have the structure you want.
7. Use the Up and Down buttons to reorder the fields. Keep in mind that the order of fields in this
dialog box (top to bottom) will actually display as columns (left to right) in the Browser window.
8. Choose Create. The Create New Table dialog box displays.
9. Specify a location for the new table in the Save in box.
10. Enter a name for the table in the File Name box.
MapInfo Professional 10.5
101
User Guide
Chapter 4: Understanding Your Data
Working with MapInfo Tables
11. Specify the file type in the Save as type drop-down list in one of these formats:
•
•
•
MapInfo (*.tab)
dBASE DBF (*.tab)
Microsoft Access (*.tab)
12. Click Save. One of these things occur:
•
•
•
If you chose the MapInfo Professional format, MapInfo Professional creates your table.
If you chose dBASE DBF, proceed to step 13.
If you chose dBASE DBF, the dBASE DBF Information dialog box displays, asking you to
specify a file character set. Choose the one appropriate for your language and click OK.
13. Click Save in the Create New Table dialog box. MapInfo Professional creates the new table.
L
•
Do not use “Districts” as a name for your base tables. MapInfo Professional uses
“Districts” internally as a system table when beginning a redistricting session.
For more information, see Naming a File and Opening Multiple Tables in the Help System.
Creating a New Table by Combining Objects Using Column
If you want to make a new map of the U.S. based on areas such as Midwest, Pacific Coast,
Northeast, etc., you could combine all of the state data and create new objects where some
common data value is the key to which the new map object states will belong.
To do this, you could draw a rectangle somewhere on the States map. Select some states around
the rectangle and specify them as the target. Select the rectangle and do a split operation. The new
objects will be created and each split object will have its same state initials. Then, use Combine
Objects Using Column and specify the state initials fields as the grouping value. The states will be
re-created.
The Combine Objects Using Column feature gives you the option of creating a new table for the
newly combined objects:
1. Choose Table > Combine Objects using Column to display the Combine Objects using
Column dialog box.
2. Choose the objects from the table you want to combine.
3. Choose the column you want the objects to be grouped by.
4. Choose New In the Store results in table drop-down list.
5. Press the Next button to display the New Table dialog box.
6. Press the Create button to display the New/Modify Table Structure dialog box.
7. Press the Create button to display the Create New Table dialog box.
8. Press Save and a new table is created.
MapInfo Professional 10.5
102
User Guide
Chapter 4: Understanding Your Data
Working with MapInfo Tables
Editing a Table’s Structure
You can make changes to the structure of your table directly in MapInfo Professional. You can add
or remove fields, change the order, name, type, width, or index of any field. You can also specify or
determine the projection of the table from this dialog box. You can also check if the table is
mappable (contains map objects).
The Table is Mappable option in the Modify Table Structure dialog box allows you to modify a table
so you can map it or, when left cleared, it will ungeocode your table.
To change the structure of the table:
1. Choose Table > Maintenance > Table Structure. The View/Modify Table Structure dialog box
displays.
2. Click the View/Modify Table drop-down list, a list of available tables displays.
3. Choose the table you want to modify.
4. Click OK.
The Modify Table Structure dialog box displays for editable tables and allows you to change the
structure of a table. The View Table Structure dialog box displays for read-only tables and is only for
viewing the table's structure.
L
Keep in mind that you can only view the structure of a file that you bring into MapInfo
Professional.
To move a column in the Modify Table Structure dialog box, select the column you want to move and
drag it to the new position in the list. A small blue arrow shows the position of the column you are
dragging.
Copying and Renaming a Table
Because a MapInfo Professional table consists of two or more component files (STATES.TAB,
STATES.DAT, STATES.MAP, etc.), all of these files for a particular table must be in the same
directory. If you move any of the component files to a different directory, you must move all of them.
When you want to back up a table to diskette, you must back up all of the component files.
Because each table has at least two files associated with it, you cannot change one file name
without changing all the other associated file names. Otherwise, MapInfo Professional would not
know where to find all the files that constitute the table.
•
For more specific instructions, see Copying and Renaming a Table in the Help System.
Deleting a Table
Deleting a table allows you to remove the .tab file and all component files associated with the table.
To delete a table:
1. On the Table menu, point to Maintenance and click Delete Table.
MapInfo Professional 10.5
103
User Guide
Chapter 4: Understanding Your Data
Working with MapInfo Tables
2. Choose the table to delete and click OK. A message displays to inform you that the table will be
permanently deleted and the operation cannot be undone.
3. Click OK and MapInfo Professional deletes the table.
Deleting a raster table only deletes the *.tab file. Deleting a grid file removes both the *.tab and grid
file.
Packing a Table
Packing a table allows you to compress tables to take up less disk space. You can choose to pack
only tabular data or graphic objects or both. Packing tabular data removes deleted records. When
you pack a table, MapInfo Professional requires that you have twice as much free space as the table
takes up to handle a copy of the database as a scratch file.
To pack a table:
1. On the Table menu, point to Maintenance and click Pack Table. The Pack Table dialog box
displays.
2. Choose a table from the Pack Table drop-down list.
3. Click the appropriate radio button to specify the type(s) of data.
Pack Tabular Data
This option removes deleted records, making the table smaller, and increasing processing
speed.
Pack Graphic Data
This option packs only graphic information.
Pack Both Types Of Data
Both graphic and textual information are packed.
4. Click OK.
L
Packing a table can corrupt customized labels saved to a workspace. If you are going to be
working with customized labels, pack the table before you create the labels.
Collecting Data into the Table using Update Column
MapInfo Professional provides a number of powerful aggregating functions that allow you to derive
new information. These features are available in Update Column when you specify two tables in the
Update Column dialog box. The aggregate expressions include Average, Count, Minimum,
Maximum, Sum, Weighted Average, Proportion Sum, Proportion Average, and Proportion
Weighted Average. Each is defined in the next table.
MapInfo Professional 10.5
104
User Guide
Chapter 4: Understanding Your Data
Working with MapInfo Tables
Aggregate Expressions
Description
Average
Calculates the average of the values for all records in a group.
Count
Counts the number of records in a group.
Minimum
Finds the lowest value for all records in a group.
Maximum
Finds the highest value for all records in a group.
Sum
Calculates the sum of the values for all records in a group.
Weighted Average
Gives more weight to one value over another when averaging.
Proportion Sum
A sum calculation that is adjusted based on how much of one object
is within another object.
Proportion Average
An average calculation that is adjusted based on how much of one
object is within another object.
Proportion Weighted
Average
A weighted average calculation that is adjusted based on how much
of one object is within another object.
Note that average, count, min, max, sum, and weighted average operate on data values only. The
proportion functions take geographic relationships into account.
For faster performance for proportional calculations, use the Proportional Overlap Tool; see Using
the Tools in the Tool Manager on page 89. For information about this tool, see Proportional
Overlap Tool in the Help System.
L
•
To find instructions for using the Update Column feature, see Adding a Temporary Column
using Update Column on page 94.
For more examples, see Collecting Data into the Table using Update Column in the Help
System.
Browsing a Table
There are times when viewing the tabular data in a table is necessary. In MapInfo Professional, this
is called browsing the table.
To browse a table:
1. On the Window menu, click New Browser Window.
2. Choose the table you wish to browse and click OK.
The Browser shows the fields of the data table (column headings) and the records of data (rows).
MapInfo Professional 10.5
105
User Guide
Chapter 4: Understanding Your Data
Creating a Report of your Data
A Browse menu item gives you further functionality. On the Browse menu, click Pick Fields to
display only the columns of data you want to see. If you wish to show information that is only implicit
in the base table, in the Pick Fields dialog box choose Expression from the Fields in Table list. For
more on expressions see Deriving Columns on page 218, or Creating Query Expressions on
page 198.
To show or hide the Browser window grid, on the Browse menu, click Options.
To add new records to the Browser:
1. On the Edit menu, click New Row to add a row (or use Ctrl-E).
2. Enter text directly into each field. As you type, press Tab or Shift-Tab to move from field to field.
3. You must remember to save the new information to the base table before exiting the program.
The square box to the left of each record in the Browser window is the select box. Click it to select
the record in the Browser window. If the Map window for the table is open, the record is selected as
well. To add records to the selection, Shift and drag to select consecutive records, or Shift-Click
non-consecutive records.
Selecting records creates a subset of the table that you can browse, map, or graph, just like the full
table. More on selecting is found later in Selecting and Querying Data on page 183. You can also
create a report of your tabular data using the Crystal Reports functionality included with MapInfo
Professional. The Crystal Reports User Guide, which is located in the Documentation subfolder of
your installation directory to help you get the most out of this powerful report writing program.
Creating a Report of your Data
MapInfo Professional includes the full report-writing functionality of Crystal Reports. Crystal Reports
enables you to create reports of your tabular data. The Crystal Reports User Guide is included
online so that you can get the most from this program.
To create a report and print it:
1. On the Tools menu, point to Crystal Reports and click New Report. The New Report dialog
box displays. It lists all the open tables.
2. Click the table you want to create a report for, and click Report. The Crystal Reports user
interface displays.
3. In Crystal Reports, Choose Report > Report Expert to display the Create Report Expert dialog
box. The Report Expert walks you through the selection of data, fields, fields to sort by, fields to
total, and styles for your report. Click Preview Sample to see a sample of your report on the
screen.
4. On the File menu, click Print to print your report.
L
Tables with columns containing underscores, temporary column, do not display in the default
Crystal Report. Use the Expert Wizard to access columns containing these elements.
MapInfo Professional 10.5
106
User Guide
Chapter 4: Understanding Your Data
Creating a Report of your Data
Opening an Existing Report
To open an existing report:
1. Choose Tools > Open Report. The Choose Crystal Report dialog box displays.
2. Select the report from the dialog box.
Saving a Report
When you save a report, an .rpt extension is assigned to the report. The report is assigned the
default name: (tablename) report.rpt. You may rename the report using the Crystal Reports Save As
feature.
All .rpt files are saved in the directory specified in Options> Preferences > Directories > Crystal
Report files.
MapInfo Professional 10.5
107
User Guide
Graphing Your Data
The graphing feature in MapInfo Professional lets you create a myriad of
different graphs from three-dimensional bar graphs to exploded pie graphs.
Each type of graph has its own set of features that you can customize to
emphasize a particular piece of information, or create the aesthetic look you
want for your graph. These features, plus additional formatting options, give you
full control over the look and content of the graph.
In this Chapter:
Selecting the Right Type of Graph . . . . . . . . . . . . . . . . . . . . . . . .109
Graphing Your Data . . . . . . . . . . . . . . . . . . . . . . . . . . . . . . . . . . . .112
Working with Multi-Table and Multi-Variable Graphs . . . . . . . . .119
Saving a Graph . . . . . . . . . . . . . . . . . . . . . . . . . . . . . . . . . . . . . . . .125
Using Graph Templates . . . . . . . . . . . . . . . . . . . . . . . . . . . . . . . . .125
5
Chapter 5: Graphing Your Data
Selecting the Right Type of Graph
Selecting the Right Type of Graph
What do you need your graph to tell your audience? The answer to this question determines the type
of graph you should select. In MapInfo Professional, you can choose from 10 different graph types.
Each type of graph includes at least one graph template that you can use to create your graph. Each
graph type, with a brief description of each template, is explained in the next section.
Graphing Terms
Axis (Axes)
An axis refers to a graduated line bordering the plot area of a graph. Coordinates are measured
relative to the axes. By convention, the X-axis is horizontal and the Y-axis is vertical.
1
2
1 Y Axis 2 X Axis
Data Series
A data series is the information your graph is based on.
Graph Object
A graph object is any selectable element in your graph. This can be a line, an area, text, or title.
Graph Series
A graph series is the row of objects you are graphing.
Label Axis
The label axis is the axis that has the labels of the data values being graphed. For example, in a
typical financial graph, the label axis might have 1st Qtr, 2nd Qtr, and 3rd Qtr while the value axis
might have dollar amounts. For a graph in normal orientation (not rotated), the label axis is the X, or
horizontal axis.
3D Graphs
Three-dimensional (3D) graphs give your information impact and depth. Most 3D templates are
variations of a bar graph. You can customize a graph to fine-tune its appearance, such as applying a
3D Viewing Angle feature to set the angle at which a 3D graph displays.
•
3D Bar – A conventional bar graph in three dimensions.
MapInfo Professional 10.5
109
User Guide
Chapter 5: Graphing Your Data
Selecting the Right Type of Graph
•
•
•
•
•
3D Floating Cube – Each value being measured, such as population, is displayed as a cube.
The value is indicated by the placement of the cube in the graph. Cubes that have higher values
appear to float within the graph.
3D Floating Sphere – This graph is the same as the 3D Floating Cube, except that each value
being measured is displayed as a sphere.
3D Line – The values being measured for a category, such as a country or a city, are displayed
as a continuous line across the axis. The line will dip and spike according to the values.
3D Pyramid – Each value being measured is displayed as a 3-dimensional pyramid. This graph
is based on a bar graph—the higher the value, the taller the pyramid.
3D Round – This graph is the same as the 3D Bar graph, except that the values are displayed
as cylinders instead of bars.
Area Graphs
Area graphs display cumulated totals as numbers or percentages over time. You view your graph
series as an area, where the area from the X axis to the plot line of the data series is filled in with a
pattern or color. You can choose from the following templates:
•
•
•
Clustered – A clustered area graph draws area risers overlapping each other to show the
absolute relationship between data series.
Percent – The percent area graph is an area version of a pie graph whose parts total 100%.
Each group calculates the percent of the total required for each series. The axis goes from 0 to
100%.
Stacked – The area risers are stacked on top of each other. The axis is the cumulative total of all
the groups.
Bar Graphs
Bar graphs display proportional relationships over time by using horizontal or vertical bars, whose
lengths are proportional to quantities.
•
•
•
Clustered – The clustered bar graph is a side-by-side group of bars. This is the standard type of
two-dimensional graph.
Percent – The percent bar graph is a bar-graph representation of a pie graph. Each group
calculates the percent of the total required for each series. The axis goes from 0 to 100%.
Stacked – The stacked bar graph displays stacked groups of bars. Each stack is made up of all
series in this group, added up to obtain a total. The axis is the total value of the cumulative
points.
Bar charts are more accurate than pie charts, because distances are more accurately estimated
than areas. Do not use bar graphs for:
•
•
Comparisons. Instead use one-dimensional scatterplots.
Larger data sets. Instead, use line charts.
Bubble Graphs
Bubble graphs plot values on an X-Y axis and compare a third value, Z, by the size of the markers in
the graph. The bubble graph requires three values per marker, X, Y, and Z, in that order. Another
way to think of it is that the graph is an X-Y plot where the marker size depends on a third value, Z.
MapInfo Professional 10.5
110
User Guide
Chapter 5: Graphing Your Data
Selecting the Right Type of Graph
Column Graphs
Column graphs display observations over time or under different conditions. This type of graph is
effective with smaller data sets.
•
•
•
Clustered – Each group of columns for a category are clustered together.
Percent – The percent column graph is a column-graph representation of a pie graph. Each
group calculates the percent of the total required for each series. The axis goes from 0 to 100%.
Stacked – The stacked column graph shows stacked groups of columns. Each stack is made up
of all series in this group, added up to obtain a total. The axis is the total value of the cumulative
points.
Column charts are more accurate than pie charts, because distances are more accurately estimated
than areas. Do not use column graphs for:
•
•
Comparisons. Instead use one-dimensional scatterplots.
Larger data sets. Instead, use line charts.
Histogram Graphs
Histograms show frequency distribution by grouping values into value ranges—it measures the
number of data values that fall within each range. The ranges display as bars without gaps.
•
•
Horizontal – The orientation of the bars is horizontal.
Vertical – The orientation of the bars is vertical.
Line Graphs
Line graphs display trends and relationships by connecting data points by lines or curves.
•
•
•
Clustered – In a clustered line graph, lines draw on top of each other to show the absolute
relationships between data series.
Percent – The percent line graph is a line-graph representation of a pie graph. Each group
calculates the percent of the total required for each series. The axis goes from 0 to 100%.
Stacked – In a stacked line graph, lines stack on top of each other. The axis is the cumulative
total of the all the groups.
Do not sue line graphs if the X axis has non-numeric values.
Pie Graphs
Pie graphs display proportional relationships at a given time. Segments of the pie chart may be
pulled out of the pie for emphasis, as an exploded pie chart.
•
•
Pie – The pie graph displays percentages of a total as pie wedges.
Ring Pie – The ring pie graph is a variation of the standard pie graph. It looks like a ring or donut.
The total value of all the pie slices displays in the center.
Pie charts do not represent values beyond 100% and do not show change over time. Do not use pie
charts:
•
For exact comparisons of values. The pie shapes can be hard for people to interpret.
MapInfo Professional 10.5
111
User Guide
Chapter 5: Graphing Your Data
Graphing Your Data
•
•
For rank data. Instead, use column or bar charts.
When proportions vary greatly.
Scatter Graphs
Scatter graphs display measurements over time (one-dimensional scatterplot) or an impression of
the relation between two variables (two-dimensional scatterplot). It distributes data points along one
or two dimensions using a standard X-Y plot requiring two values per marker, X and Y, in that order.
Do not use a scatter graph for:
•
•
Trends, interpolation, extrapolation, recognition, and comparison of change rates.
More than one independent variable.
Surface Graphs
Surface graphs display three dimensional data sets, where X and Y values determine the reference
coordinates for Z values.
•
•
•
Surface – The surface graph displays all data points as a surface, like a rolling wave.
Surface with Sides – A variation of the surface graph, where the surfaces in the graph have
solid sides.
Surface, Honeycombed – A variation of the surface graph, where the surfaces in the graph
have a honeycombed look.
Graphing Your Data
To create a graph, use the New Graph Window menu command in the Window menu.
Creating a Graph using the Graph Wizard
Graphing in MapInfo Professional is done through a two-step graph wizard, similar to the Create
Thematic Map wizard. You must first open in a table MapInfo Professional before graphing its data.
To access the wizard and create a graph:
1. On the Window menu, click New Graph Window. The Create Graph – Step 1 of 2 dialog box
displays. Select the graph type and the graph template to use.
MapInfo Professional 10.5
112
User Guide
Chapter 5: Graphing Your Data
Graphing Your Data
2. Click one of the graph types shown in the Graph group in the left pane. When you select a graph
type, the templates for that graph type display in the Template group.
3. Choose a template from the right pane. Some graph types have several templates to choose
from. Others, such as the bubble and scatter graph types, have only one template.
4. Click Next when you have selected a template. The Create Graph – Step 2 of 2 dialog box
displays. Select the table and the fields from the table to graph. Optionally, choose what column
you want to use for your labels.
L
This dialog box is the same for all graph types.
5. Choose the table you want to graph from the Table drop-down list. The list displays the currently
open tables.
MapInfo Professional 10.5
113
User Guide
Chapter 5: Graphing Your Data
Graphing Your Data
6. Choose the fields from the table you want to graph. Select a field from the Fields from Table list,
and either double-click it, or highlight it (single click) and click the Add button. Both methods will
move the field to the Fields for Graph list. Use the Remove button in the same way to move
fields back to the Fields from Table list.
7. Arrange the fields in the desired order by selecting a field and using the Up and Down buttons to
place it in the position you want.
Some graph types use the first field for axis labels (bar, 3D, column), and other graph types use
the order of the fields to determine X and Y values. In the case of bubble graphs, the field order
also determines the Z value.
8. If applicable, select whether you want to graph your series by row or by column (this is not
available for bubble, histogram, or scatter graphs).
9. Click OK. Your graph displays in a Graph window.
Editing a Graph
Once you create the basic graph, your ability to customize it is unlimited and depends only upon the
message your graph needs to convey. You have complete control over virtually every aspect of your
graph and every item in the Graph window. The customizing options available depend on the graph
type you have selected.
Selecting Graph Objects
To format a graph object, select it by clicking it. When you make a graph selection, you can also
select related graph objects. For example, if you click a series bar in a column graph, then all the
series bars and the corresponding legend marker are selected. If you select an axis label, all the
labels on that axis are selected. All selected items are altered.
If you choose an axis label, then all of the labels on that axis are selected. If you change an attribute
from the Formatting dialog box, then all the selected items are affected.
Shift-click and Ctrl-click have no special meaning when selecting for formatting. When the Graph
Select tool is active, Shift-click does have a special meaning.
Moving and Resizing Graph Objects
To move a graph object, click it in the Graph window and drag it to the desired location. You can
move the titles, data labels, and the legend. When you click on a movable object, the cursor
changes to a crosshair and you can drag the object to a new location. You cannot drag an object
past the edge of the Graph window.
L
If you move the main graph frame, then some of the other objects, like axis title labels, will
move along as well.
MapInfo Professional 10.5
114
User Guide
Chapter 5: Graphing Your Data
Graphing Your Data
You can resize some objects in the Graph window. If it is resizable, then handles display along the
outer edge of the object you select. When you move the mouse over one of the resize handles the
cursor changes shape to indicate the direction in which the object can be resized (east-west, northsouth, northwest-southeast or northeast-southwest).You cannot resize an object past the edge of
the graph window.
L
When you resize the main graph frame, then some of the other objects, like axis title labels,
move as the frame is resized.
To resize the legend, select it to display legend handles. Click and drag on one of the edit handles to
make the legend larger or smaller.
Using the Graph Menu
The Graph menu contains all the editing options to customize your graph. When you create a graph,
the Graph menu displays in the MapInfo Professional menu bar. You can also access the Graph
menu options by right-clicking in the Graph window to display a shortcut menu.
Formatting Graph Objects
On the Graph menu, click Formatting to access the formatting options, which allow you to
customize the line and fill patterns of your graph objects and graph titles. You can also add color
gradients, different textures, and pictures to your graph. You can quickly access the Formatting
dialog box by selecting a graph object and double-clicking in the Graph window. The formatting will
apply to whatever object is selected in the Graph window. It could be the background, the titles, the
axes, the graph series, graph markers, etc. The formatting options that display in the dialog box
depend on what element in the Graph window is selected.
MapInfo Professional 10.5
115
User Guide
Chapter 5: Graphing Your Data
Graphing Your Data
Layout and Display
Go to the General Options command (on the Graph menu, click General Options) to change the
general options for the type of graph you are creating, as well as customize its display. The General
tab displays options that enable you to customize the markers for the type of graph you selected. For
3D graphs, you can change the shape of the risers, and the gap between the risers. For pie graphs,
you can create an exploded pie graph, as well as specify the pie’s rotation, tilt, and depth. For
bubble graphs, you can customize the size and shape of the marker. In column graphs, you can
customize the columns.
Modifying Axis Attributes
The Numeric Axis Grids & Scales dialog box (on the Graph menu, click Grids and Scales) is
used to format graph axes, gridlines, and perform scaling. The tabs on the left of the dialog box
indicate the available axes in the graph: Category Axis, Y1 Axis, Y2 Axis (for dual-axes graphs), X
Axis (for bubble and scatter graphs), and Series Axis (for 3D graphs).
When you select an axis tab, the tabs at the top of the dialog box will change to reflect the available
formatting options for that axis. Each axis is described in this section:
MapInfo Professional 10.5
116
User Guide
Chapter 5: Graphing Your Data
Graphing Your Data
•
•
•
•
•
Category Axis – All graph types, except bubble, histogram, and scatter graphs, have a category
axis. The category axis defines the groups of items that are being graphed. When category axis
labels are displayed, the labels are taken from the first row in your table.
Y1 Axis – All graph types except pie graphs have a Y1 axis, or primary numeric axis. This axis
plots the values from the rows and columns in your table.
Y2 Axis – Area, bar, bubble, column, line, and scatter charts can be drawn on two numeric axes,
Y1 and Y2. When a dual-axes graph is selected, MapInfo Professional automatically divides the
number of series in half and assigns half of the series to one axis and the other half to the
second axis. The two axes can be drawn up or out from the same plane/base line or physically
split into two separate sections on the graph.
X-Axis – Bubble, histogram, and scatter graphs include an X-axis. These graphs have two
numeric axes—a Y1 axis that is drawn on the left side of the graph and an X axis that is drawn
on the bottom of the graph frame.
Series Axis – A series axis is included only in 3D riser and 3D surface graphs. The series axis is
also called a secondary ordinal or O2 axis. In two-dimensional graphs, the series or rows of
objects being graphed are shown in the legend area of the chart. In 3D graphs, these objects are
shown on the series axis, which is on the lower left side of the 3D graph.
Specifying Titles for Your Graph
On the Graph menu, click Titles to specify titles for your graph. In the Titles dialog box, check the
boxes next to the titles that you want to display in the graph.
The text boxes next to those titles become available. You can use the default titles or create your
own. Choose from these titles:
•
•
•
•
•
•
•
Title – Displays the main title of the graph centered over the top of the graph.
Subtitle – Displays the subtitle of the graph directly underneath the main title.
Footnote – Displays a note at the bottom right hand corner of the graph.
Category title – Displays a title for the category axis of the graph above, below, or next to the
category axis labels.
Value title (Y1) – Displays a title for the primary numeric (Y1) axis of your graph. Use the title to
explain what is being plotted on this axis.
Value title (Y2) – Displays a title for the secondary numeric (Y2) axis of your graph. In dual-axes
graphs, the primary (Y1) axis shows some of the groups in the data, and the secondary numeric
(Y2) axis plots other groups of data. Use the title to explain what is being plotted on this axis.
X-Axis title – Displays a title for the X-axis, where applicable. Histogram, bubble, and scatter
graphs include a numeric X-axis.
MapInfo Professional 10.5
117
User Guide
Chapter 5: Graphing Your Data
Graphing Your Data
•
Series Axis – Displays series labels along the lower left side of a 3D graph. Series titles can
further describe the information that is being graphed on this series axis. These titles normally
correspond to the series labels displayed in the legend.
All graphs can include a title, subtitle, and footnote. Most graphs can also include a Category Axis
title and a numeric Y1-Axis title. Other axis titles may be available depending on the graph type.
Titles can be moved from their default positions by clicking and dragging them to the desired
position. To change other elements in the title, such as the font or the text color, select the title
directly in the Graph window and choose the Formatting command in the Graph menu.
Editing a Graph Series
You can apply formatting changes to an individual series in your graph and to the whole graph. The
Series Options command in the Graph menu is available whenever a series is selected in your
graph. If no series is selected, the message "No series is selected" displays.
To format an individual series:
1. Click a riser (area, bar, line, marker, pie slice, etc.) or a legend marker to select a series.
2. On the Graph menu, click Series Options. The Series Options dialog box displays.
3. Make changes in each of the dialog box tabs and click OK. You can also apply changes as you
go by clicking the Apply button. Apply saves your changes to the graph without closing the
dialog box. This enables you to see your changes in the Graph window, continue working, and
experiment with options without having to close and reopen the dialog box.
4. Click OK when you are finished.
The options available in the Series Options dialog box depend on the graph type you have
selected. Each of the dialog box tabs is explained briefly in this section:
•
General – Contains general formatting options for a series for each type of graph. For instance,
in 3D column graphs, you can change the riser shape; in bubble graphs and other graph types
that may use markers such as line graphs, you can change the shape of the markers. In pie
graphs, you can manipulate the individual pie slices. You can detach a slice from the pie, delete
a slice, or restore the pie back to its original state. In many graph types, you can also display the
MapInfo Professional 10.5
118
User Guide
Chapter 5: Graphing Your Data
Working with Multi-Table and Multi-Variable Graphs
selected series as another graph type. For example, if you create a bar graph, you can change a
selected series to display as a line or an area, contrasting that series to the rest of the series in
the graph.
•
•
•
Data Labels – Specify whether you want to display data labels for the selected series and where
you want to place the labels. Data labels show the actual values from your table.
Number – Specify how you want to display data label numbers. You can choose from a number
of categories: general, number, currency, date, time, percentage, fraction, scientific, special, and
custom. This tab is available when the Data Labels box is checked in the Data Labels tab.
Trendlines – Contains formatting and display options for trend lines. This tab is unavailable for
3D and pie graphs. You can display a trend line according to different types of regression:
Linear, Logarithmic, Polynomial, or Exponential. You also have several other display options.
You can display the equation used to create the trend line, show the coefficient values, or specify
that the trend line display in the same color as the series.
Working with Multi-Table and Multi-Variable Graphs
This section of the chapter provides some examples of ways you can customize your graphs. The
first example illustrates some of the ways you can customize a pie graph. The second example
demonstrates how you can customize a 3D graph using the 3D viewing angle feature.
Exploding a Pie Graph
Creating a basic pie graph is easy using the Graph wizard. Simply select the table and the fields you
want to graph. You can also graph a subset of a table, as shown in the next figure, by browsing the
selection, and using the Save Copy As command to save the selection as a permanent .tab file.
MapInfo Professional 10.5
119
User Guide
Chapter 5: Graphing Your Data
Working with Multi-Table and Multi-Variable Graphs
The General Options for pie graphs let you manipulate the look and rotation of the pie slices easily.
The left side of the dialog box shows a preview of what the finished pie graph will look like. You can
change the tilt, or the angle at which you vie the pie. You can give the pie a 3D look by using the Pie
Depth setting.
L
Some of the files described in this example may refer to MapInfo Professional Tutorial data,
which is available on the MapInfo web site, http://goto.pbinsight.com/webtutorials.
You can also rotate the pie or explode the pie. When you explode the pie, you detach all the slices
away from the center. You can also detach an individual slice away from the pie center using the
Series Options (on the Graph menu, click Series).
The following graph shows the same pie graph, based on the General Options settings.
MapInfo Professional 10.5
120
User Guide
Chapter 5: Graphing Your Data
Working with Multi-Table and Multi-Variable Graphs
3D Graphs - Using the 3D Viewing Angle
The 3D Viewing Angle feature displays your 3D graph at different angles, as well as customize other
aspects of the graph’s position, such as its rotation and position in the Graph window. The following
3D graph shows the same selection from the table that was used in the pie graph, but graphs
different columns from the table. This example rotates the angle of the 3D graph and the changes
the thickness of the walls of the 3D cube.
When you choose the 3D Viewing Angle option, preset angles for your graph display. You can
choose one of these, or use the Advanced options to create your own angle, position, and rotation.
The Advanced portion of the dialog box displays additional controls that allow you to scroll through
the presets more quickly, and manipulate the angle and position of the graph manually.
Use the controls along the bottom of the graph preview to scroll through the preset viewing angles.
You can also select one from the drop-down list.
MapInfo Professional 10.5
121
User Guide
Chapter 5: Graphing Your Data
Working with Multi-Table and Multi-Variable Graphs
Rotating Your 3D Graph
Use the options Rotate, Pan, Walls, and Move at the lower right of the dialog box to manipulate the
graph. In the Rotate tab, you can click directly on the arrows to rotate your graph in the direction
indicated by the arrow. A preview of the graph in its new position displays above. You can also
rotate the graph one click at a time using the X, Y, and Z buttons.
2
1
1 Click an arrow to rotate the graph.
2 Click the X, Y, and Z arrows to rotate the graph one click.
Panning Your 3D Graph
Use the Pan tab options to move the graph across the window. Again, click directly on the arrows to
move the graph in the direction indicated by the arrow, or use the X and Y buttons to move the graph
one click at a time. Use the Zoom buttons to zoom the graph in and out.
Customizing Cube Walls
The Walls tab helps you change the dimensions of the 3D graph walls. You can alter the length and
thickness of the walls directly using the arrow keys on the wall image on the left side of the tab, or
use the X, Y, and Z buttons.
MapInfo Professional 10.5
122
User Guide
Chapter 5: Graphing Your Data
Working with Multi-Table and Multi-Variable Graphs
Moving Your 3D Graph at an Angle
The Move tab options are used to move the graph diagonally across the window. Click the arrows on
the diagram in the Move tab to move the graph in the direction indicated by the arrow, or use the X,
Y, and Z buttons. The X button moves your graph from the top left to the bottom right of the window.
The Y button moves your graph from top to bottom. The Z button moves your graph from the bottom
left to the top right of the window.
Above, the same graph that was shown earlier is displayed here using a different preset angle. The
walls of the cube have also been removed, as well as the values for the Value Axis, in the Display
Status tab of the General Options dialog box.
All of the 3D Viewing Angle options have been used in this graph. The graph has been rotated
about 90 degrees from the earlier example. The Pan and Move options have also been used to
position the graph. And the Walls option has been used to increase the thickness of the floor of the
cube.
Choosing a 3D Graph Viewing Angle
To choose a different Viewing Angle for a 3D graph:
1. Select Graph > 3D Viewing Angle to display the Choose a Viewing Angle dialog box:
This dialog box shows a picture of all defined viewing angles. It may contain more or fewer
viewing angle pictures depending on previous selections in the Advanced Options dialog box.
To select one of the defined viewing angles:
2. Select a viewing angle picture.
3. Select the Apply button to apply the Viewing Angle to your 3D graph.
MapInfo Professional 10.5
123
User Guide
Chapter 5: Graphing Your Data
Working with Multi-Table and Multi-Variable Graphs
4. Select the OK button to exit the Choose a Viewing Angle dialog box.
5. Select the Advanced Options button to display additional viewing angle selections.
Selections in Graphs and Their Tables
Selections you make in your graphed table will also be highlighted in your Graph window.
Conversely, using the new Graph Select tool, selections in the Graph window change the current
selection in the graphed table.
Table Selections
In a graphed table, any selections you make in the table with the Select tool will be reflected in the
corresponding Graph window as long as the selected table row or map object corresponds to an
object in the graph. For example, in a bar graph, one or more of the bars will be highlighted. In a pie
graph, one or more of the pie wedges will be highlighted.
The selection in the Graph window uses the same pen and brush styles that are used to highlight
selected objects in the Map window.
Using the Graph Select Tool
When you select objects in a Graph window using the Graph Select tool, you also change the
current selection in the graphed table. Your Graph window selection must correspond to a row in the
table. Your Graph window selection will be reflected in the Map or Browser window.
To select rows in the table being graphed:
1. Click on the Graph Select tool from the Main toolbar.
2. Click on a part of the graph that corresponds to a row in the table (riser bar, pie wedge). MapInfo
Professional updates the current selection.
This change is reflected in Map and Browser windows displaying the same table. If you click on an
area of the graph that does not correspond to a table row, the selection is cancelled (like Query >
Unselect All).
Shift + Click works the same in the Graph window as it does in the Map and Browser windows; it
adds or removes the target item to the selection list.
L
For some graph types there is no relationship between the graph objects and rows in the
table (for example, histogram). For these graph types the Graph Select tool is not available
and the current selection will not be highlighted in the Graph window.
If you select an object in the Graph window that does not correspond to a row in the table, any other
selections in the Graph window are cleared. As in other types of windows, selecting multiple objects
by shift-clicking works the same way in Graph windows—either adding the target object to, or
removing it from, the selection.
MapInfo Professional 10.5
124
User Guide
Chapter 5: Graphing Your Data
Saving a Graph
Selecting graph objects with the Graph Select tool is not the same process as selecting objects in
the Graph window to edit the graph object. The default mode is to select graph objects with the
Select tool in order to edit them. To select graph objects for the purpose of changing the selections
in the table, you must use the Graph Select tool. In some graph types, there is no relationship
between the graph objects and the rows in the table, for example, histograms. The Graph Select tool
is unavailable for these graph types. Selections in the Graph window will not highlight any records or
map objects in the table.
Saving a Graph
Graphs are saved to workspaces. For each Graph window in the workspace, MapInfo Professional
saves a uniquely named .3TF file in the same directory as the workspace. The name of the graph is:
<WORKSPACE NAME>, <WINDOW TITLE>.3TF
The <WORKSPACE NAME> is the root name of the workspace being saved and
<WINDOW TITLE> is the title of the Graph window being saved. For example, if you save a
workspace named “MY WS.WOR” and it contains a Graph window with the title, “Scatter Graph,”
MapInfo Professional creates the graph file “MY WS, SCATTER GRAPH.3TF” in the same directory
as the original workspace, “MY WS.WOR.”
1.
Using Graph Templates
MapInfo Professional stores the various graph template files in folders in the GraphSupport
directory. The GraphSupport directory is located in the MapInfo Professional directory by default in
versions 6.0 and earlier. In MapInfo Professional 7.5 files are stored on a per-user basis. Other
support files containing numerous kinds of fill patterns, as well as the 3D viewing angle files, that
help you format your graph are also located in this directory.
Each type of support file stored in the GraphSupport directory is listed in the next table, according to
the name of the folder in which the files are stored:
Folder Name
File Description
3D Viewing Angles
Files correspond to the preset viewing angles available in the 3D Viewing
Angle dialog box (on the Graph menu, click 3D Viewing Angle).
Gradients
Files correspond to the preset gradients available in the Choose Gradient
dialog box (on the Graph menu, point to Formatting and click Fill tab).
Pictures
Files correspond to the pictures available in the Choose Picture dialog box
(on the Graph menu, point to Formatting and click Fill tab).
MapInfo Professional 10.5
125
User Guide
Chapter 5: Graphing Your Data
Using Graph Templates
Folder Name
File Description
Templates
Contains the available graphing templates listed in the Graph wizard
(Create Graph – step 1 of 2 dialog box).
Textures
Files correspond to the textures available in the Choose Gradient dialog
box (on the Graph menu, point to Formatting and click Fill tab).
Location Preferences
Using the Directory preferences, you can change the location where MapInfo Professional looks for
all the support files. To do so:
1. On the Options menu, point to Preferences and click Directories. The Directory Preferences
dialog box displays.
2. In the Initial Directories for File dialog boxes group, select Graph Support Files.
3. Click Modify. The Choose Directory dialog box displays. It shows the current location of the
Graph Support files. Navigate to the directory where you want to store the files, and click OK.
The new location of the files displays in the Initial Directories list.
4. Click OK to close the Directory Preferences dialog box.
Although the location of the GraphSupport directory can be changed, the names and locations of the
support file folders inside the GraphSupport directory cannot. MapInfo Professional looks in the
GraphSupport directory specifically for the appropriate support folders and files as listed above.
Saving a Graph Template
You can easily add to the available set of templates when you create a graph by saving an existing
Graph window as a template file. For example, you prefer the legend to display on the left side of the
Graph window instead of on the right (the default position). You can make this modification in the
Graph window and then on the Graph menu, click Save As Template.
To save a graph as a template:
1. Make the modifications in the Graph window that you would like to save as a template.
2. On the Graph menu, click Save As Template. The Save Graph Template dialog box displays.
It shows the template folder that corresponds to the type of graph you are saving as a template.
3. Name your graph template and click Save.
The next time you create a Graph window, the saved template file will be available in the Graph
wizard for that graph type.
L
You can save a template file to a location other than the GraphSupport\Templates directory;
however, it will not be available unless you save it to a folder in the Templates directory.
MapInfo Professional 10.5
126
User Guide
Chapter 5: Graphing Your Data
Using Graph Templates
MapInfo Professional 10.5
127
User Guide
Accessing Remote Data
When your data is remote, whether it is a remote Excel file or an Oracle table,
the issue of retrieving it gets more complex. This chapter addresses the special
circumstances that surround remote data access for use with MapInfo
Professional.
Topics in this Section:
•
Understanding Remote Tables and Databases . . . . . . . . . . . . . .129
Accessing Data in Remote Spatial Databases. . . . . . . . . . . . . . .131
For information in using Oracle Workspaces, see Using Oracle
Workspace Tables in MapInfo Professional in the Help System.
6
Chapter 6: Accessing Remote Data
Understanding Remote Tables and Databases
Understanding Remote Tables and Databases
Not all of the data you may need to work with is local. Sometimes you need to graph or display
spatially data that is on several different computers in different locations. And this data can be in
different formats and configurations. What MapInfo Professional has to do is synchronize all of that
data to ensure that it displays properly on a map.
To access data that is located on a remote Oracle or other SQL Server based DBMS systems, your
system requires:
•
•
A database management system such as Oracle, MS Access, SQL Server, etc.
Network support required by your DBMS (Oracle-SQL*NET; MS Access-none required)
If these resources are not in place, you will not be able to access the remote data from MapInfo
Professional. If you try to connect to this data, warning messages display to explain that you do not
have the required DLLs.
Supported Databases and Versions
For a list of spatial database servers, ODBC drivers, and databases that MapInfo Professional
supports, see the MapInfo Professional Install Guide.
To make your database work more productive, MapInfo Professional provides an interface for
opening remote tables in EasyLoader. This utility gives you the ability to save tables to a remote
database using Save Copy As and to create new tables on remote databases. Additionally it gives
you the means to create a new table from existing tables. EasyLoader is available on the Pitney
Bowes Software Inc. web site. You can also open tables of data from the following databases and
make them mappable but only for point data:
About Linked and Live DBMS Tables
A linked table is a MapInfo Professional table that is downloaded from a remote database and
retains links to its remote database table. The remote database table is known as a DBMS table.
When MapInfo Professional downloads a table, it copies the entire contents of the table to the local
machine. Any changes you make to the copy can be committed to the server table at any time. We
often recommend that you use linked tables rather than live tables to improve performance.
L
If you are linking to a large table, it will significantly slow down the performance of your
system.
You can perform most operations on a linked table that you do for a regular MapInfo Professional
table. For instance, you can view, edit, copy, and save a linked table just as you could a regular
MapInfo Professional table. However, there are some things you can’t do to a linked table. For
instance, you can’t pack a linked table. You can’t modify the table structure of a linked table.
You can download tables from a relational database management system, such as Oracle, SQL
Server Spatial, PostGIS, or Access. These downloaded tables can be used stand-alone or remain
linked to the original server database. You can refresh these linked tables to rerun queries on a
MapInfo Professional 10.5
129
User Guide
Chapter 6: Accessing Remote Data
Understanding Remote Tables and Databases
regular basis using the Refresh button or menu button. After editing in MapInfo Professional, the
data in a linked table is saved to the relational database management system in a manner that
resolves any multi-editing conflicts.
A linked table may use one style for all objects within a table, or contain different styles for each row,
called per row styles. There are two requirements for setting up per row styles:
•
•
A row must exist in the DBMS table
You must set up a map catalog entry to activate the row style.
L
Setting up a per row styles is optional.
DBMS Drivers
Before you can access a SQL database, you must have the appropriate DBMS driver for the type of
database, and set up a DBMS data source for the data. The DBMS drivers were installed during
MapInfo Professional installation, or afterwards, using the DBMS Administrator in your Windows
Control Panel. You can install additional DBMS drivers at anytime using the DBMS Administrator. A
DBMS driver is a dynamic–link library (.DLL) file that MapInfo Professional uses to connect to an
SQL database. Each type of SQL database requires a different DBMS driver.
Linked Tables and Metadata
MapInfo Professional stores information about a linked table in the .tab file’s metadata, which is not
displayed on the map. MapInfo Professional uses metadata to manage transactions between
MapInfo Professional and the server database. Two of the most important kinds of information
stored in the metadata include the connection string and the query you build from the DBMS Table
Wizard, or Expert dialog box.
•
For more information, see Using the FInd Command in Remote Tables and Resolving Editing
Conflicts when Saving a Linked Table in the Help System.
About Live Access Tables
You can access remote data as a live access table using MapInfo Professional. It is called a live
access because there is no local copy of the data, that is, all operations against the data go directly
to the server. This differs from linked tables, which download a snapshot from the remote database
into a native MapInfo Professional table.
You can perform most operations on a live access table that you do for a regular MapInfo
Professional table. For example, you can view, edit, copy, and save a live access layer just as you
can a regular MapInfo Professional table. However, you cannot pack or modify a live access table’s
structure.
You can create live access tables with or without a cache. The cache is a memory cache, which
contains only the rows that are in the map display for that window. This optimizes certain operations
such as ToolTips, labeling, etc. on the map. The cache is automatically updated when the view of
the map changes, (for example, zooming or panning).
MapInfo Professional 10.5
130
User Guide
Chapter 6: Accessing Remote Data
Accessing Data in Remote Spatial Databases
When the live access table is creating a new Map window, the initial view is determined by the entry
in the MapInfo_MapCatalog table. The columns DB_X_LL_DB_X_UR_DB_Y_UR describe a
rectangular area that is the initial map display. If the live access table is being added as a layer to an
existing Map window, the layer will be fit to that Map window.
MapInfo Professional stores information about a live access table in a TAB file. This information is
known as metadata. MapInfo Professional uses metadata to store information about the live access
table that is needed to manage transactions between MapInfo Professional and the server
database. Two of the most important kinds of information stored in the metadata include the
connection string and the query you build from the DBMS Table Wizard, or Expert dialog box.
Limitations in Creating a Live Table
This is a list of known problems/issues with live access:
•
•
•
•
•
•
Every table must have a single unique key column.
FastEdit is not supported.
With MS Access if the key is character, it will not display rows where the key value is less than
the full column width for example, if the key is char(5) the value ‘aaaa’ will look like a deleted row.
Changes made by another user are not visible until the data is refreshed from the server. In
addition, if cache is on another user’s updates may not appear until the cache is invalidated by a
pan or zooming out.
There will be a problem if a client-side join (through the SQL Select menu item or MapBasic) is
performed against two or more SpatialWare tables that are stored in different coordinate
systems. This is inefficient (it is better to do the join in the SQL statement that defines the table).
For SQL Server Spatial, you can not access a table, containing geography, that is in more than
one coordinate system.
Limitations of Live Access to Remote DBMS Tables
Using live access tables to determine the number of rows is not appropriate for all tables. It works
best on large tables, where the number of rows remains stable; that is, new insertions or deletions in
the table do not occur on a regular basis.
If the total number of rows stored in the MapCatalog is out of sync with the actual number of rows in
the table, problems occur. The map will always include all of the map objects, but other things may
not work correctly. For example:
•
•
The row count displayed in the Browser will be incorrect.
The MapBasic statement to fetch last will not return the correct row.
Thematic maps, particularly ranged thematic maps, may be wrong.
•
For more information, see Improving Live Access Performance in the Help System.
Accessing Data in Remote Spatial Databases
To use your RDBMS tables with MapInfo Professional most effectively, you need to set them up so
that you can store coordinates or more complex spatial data and then retrieve them. This will also
allow you to geocode your remote table and assign coordinates to each record in the table.
MapInfo Professional 10.5
131
User Guide
Chapter 6: Accessing Remote Data
Accessing Data in Remote Spatial Databases
•
•
•
•
•
There are four prerequisites for storing and retrieving spatial objects in a DBMS table:
Coordinate values for the objects must be stored in columns of the remote table as numbers, or
as a spatial column if the database supports it, such as SpatialWare, or Oracle Spatial. See
Storing Coordinate Values in a Remote Table for these instructions.
A spatial index column may be included to increase performance on queries against the
coordinates. See Creating a Spatial Index Column for these instructions.
You must create a special table on the DBMS system known as the MapInfo_MapCatalog.
(MapInfo Professional creates this automatically when you use the EasyLoader.) You create
only one catalog per database. See Creating a MapInfo_MapCatalog for these instructions.
You must supply information about mappable tables to the MapInfo MapCatalog using the Make
Table Mappable command. (This is for tables the EasyLoader does not upload.) See Making a
Remote Table Mappable for these instructions.
Storing Coordinate Values in a Remote Table
The coordinate values for the spatial data must be stored in columns of the remote table. This is a
data creation task and can be done at any time. Possible methods for adding the spatial columns
include:
•
•
•
•
There may already be existing coordinate data.
Use the EasyLoader application to upload a MapInfo Professional table to a database supported
by MapInfo Professional.
Make a remote table mappable in order to geocode. See Making a Remote Table Mappable in
this chapter.
Add coordinate values to a MapInfo Professional table, export it to a text file, and import it to your
database.
For more information on how to use the EasyLoader tool, please view the Tools section of the Help
System.
Creating a Spatial Index Column
To increase performance on queries against the coordinates, a spatial index column can be
included. This is a data creation task and can be done at any time.
Creating a MapInfo_MapCatalog
Use EasyLoader to create a MapInfo_MapCatalog. MapInfo Professional stores information about
where the spatial columns are located in a special table on the DBMS known as the
MapInfo_MapCatalog. There must be one catalog per database. The application EasyLoader can be
used to create this catalog for each database: Oracle Spatial, SQL Server Spatial, PostGIS, and MS
Access.
These applications will need to be customized for any other DBMS, or you can follow the procedure
for manually creating a map catalog. This is a one-time only task per database and is required
before any tables on that database can be mapped in MapInfo Professional.
MapInfo Professional 10.5
132
User Guide
Chapter 6: Accessing Remote Data
Accessing Data in Remote Spatial Databases
Creating a MapInfo_MapCatalog Automatically
To create a MapCatalog automatically, use the EasyLoader tool. This tool is part of the toolset that
ships with MapInfo Professional and is available from the Tool Manager.
To load the EasyLoader tool:
1. On the Tools menu, click Tool Manager. In the Tool Manager dialog box, select the Loaded
check box next to the EasyLoader tool and click OK. The tool is a command in the Tools menu
for the current MapInfo Professional session.
To have the tool load automatically every time you start MapInfo Professional, select the
Autoload check box next to the tool.
2. Run the EasyLoader tool from the Tools menu. When you upload the first table the
MapInfo_MapCatalog will automatically be created. If the map catalog does not exist, you will
click the Map Catalog button to create it under the MapInfo user. If this user does not exist
EasyLoader will attempt to create it. If a user does not have adequate permissions then the
creation of the MAPINFO.MAPINFO_MAPCATALOG will not succeed, and the table(s) will not
be loaded.
Spatial Index Types
This table lists the supported Spatial Index types.
Spatial Index Type
Type Number
MapInfo MICODE schema (any database)
1
XY schema (any database)
4
Oracle Spatial Geometry
13
SpatialWare for SQL Server
14
Oracle Spatial Annotation Text
16
SQL Server Spatial (for geometry)
17
SQL Server Spatial (for geography)
18
PostGIS for PostgreSQL
19
SQL Server Spatial with M and Z values (for geometry)
20
SQL Server Spatial with M and Z values (for geography)
21
Updating Data Bounds in the MapInfo_MapCatalog
The MapInfo_MapCatalog currently contains the bounds of the data within the table. This is used to
determine the map view if the table is opened as the first map in a window. The bounds are set
either by the EasyLoader when the data is loaded or from the MapInfo Professional tool, Set
Minimum Bounding Rectangle tool.
MapInfo Professional 10.5
133
User Guide
Chapter 6: Accessing Remote Data
Accessing Data in Remote Spatial Databases
The bounds are automatically adjusted when inserting or updating spatial objects. If the object is
outside the MBR, it will expand the MBR and update the MapInfo_MapCatalog. Deleting objects
from the table does not alter the bounds.
Making a Remote Table Mappable
MapInfo Professional holds catalog information about mappable tables from the Make Table
Mappable command. Creating the entry for a table is a once-per-table task and is required before
this specific table can be mapped in MapInfo Professional.
The Make DBMS Table Mappable command makes a remote SQL database table (DBMS table)
mappable in MapInfo Professional. Any MapInfo Professional table may be displayed in a Browser,
but only a mappable table may have graphical objects attached. Only mappable tables can display
in Map windows. Use the Make Table Mappable command only for tables that you cannot upload
with EasyLoader.
Use the Make DBMS Table Mappable command to provide MapInfo Professional with the following
information from the remote database table so you can map the table:
•
•
•
•
•
•
•
The column(s) containing the spatial data to map the table (not applicable to relational Oracle
SDO)
The projection used by the remote database table
The spatial index column from the remote database table (used by MapInfo Professional to
speed access of the spatial data and improve performance)
The symbol to use for objects
Per row styles, if your table is set up for it, and the MapInfo_ MapCatalog has the appropriate
column structure
Object type for Spatial databases
Table Bounds (control the extent of the bounding rectangle for the Map window)
MapInfo Professional takes this information and stores it in a table called the MapInfo_MapCatalog.
Every time you use a DBMS table MapInfo Professional checks the catalog to see if the table is
mappable. As a result, you only have to make a DBMS table mappable once. It will always remain
mappable. However, one spatial index column entry per table is allowed in the Map Catalog.
Therefore, only one spatial column can be mappable at a time. If the table has more than one spatial
column and you want to map another spatial column, you must drop the spatial column currently in
the Map Catalog and make the table mappable using the new column.
L
The projection system is registered in MapInfo Professional’s Map Catalog table when you
make a table mappable. If the registered projection system is different from the data table,
then live access to this table may not work correctly.
Once you have the prerequisites in place you are ready to connect to your data sources and the
database tables you want to work with. If you are not familiar with the details of your remote
database type, discuss your needs with your database administrator to find out the basic information
required to connect to your database.
•
For more information, see Making a DBMS Table Mappable and Changing the Symbol Style in a
Mappable DBMS Table in the Help System.
MapInfo Professional 10.5
134
User Guide
Chapter 6: Accessing Remote Data
Accessing Data in Remote Spatial Databases
The Help System contains these additional related topics:
•
•
•
Understanding Per Row Object Styles
Making a DBMS Table Mappable for Geocoding
Changing the Symbol Style in a Mappable DBMS Table
Opening a Connection to an ODBC Data Source
A data source is the location of a specific database. For example, CUSTOMERS could be the name
of the data source that provides access to one or more Oracle tables located in a specific directory
on a specific network drive. Once connected to the CUSTOMERS data source, you could download
information from any of the Oracle tables into a MapInfo Professional linked table or use the
information directly by opening the table as live access. You could have several data sources, each
providing access to different databases in different locations.
Open Database Connectivity is a standard for accessing disparate database systems. It is the oil
that moves the wheels of inter-database communication. Pitney Bowes Software Inc. is committed
to making this important interface work for your organization.
Before you can download a DBMS table, you must connect to the specific data source where the
data to be downloaded resides.
To connect to a new data source through ODBC:
1. Choose File > Open DBMS Connection. One of the following happens:
•
If you installed the Oracle Spatial (OCI) and ODBC support, this dialog displays. Choose
whether to create an ODBC or Oracle connection and click New. When you select Oracle
Spatial, a different process occurs, see Opening a Connection to an Oracle Spatial Data
Source, p. 137 for these instructions. When you select ODBC, the Select Data Source
dialog box displays.
•
If the ODBC driver is the only one installed, the Select Data Source dialog displays.
MapInfo Professional 10.5
135
User Guide
Chapter 6: Accessing Remote Data
Accessing Data in Remote Spatial Databases
2. Click New to display the Create New Data Source dialog box.
From this wizard dialog box you select a driver and choose a name for the connection.
You can add multiple data sources, each one associating a driver with data you want
to access using the driver. You need to give each data source a name that uniquely
identifies that data source.
3. Select the appropriate driver for this database connection from the list and click Next to display
the next dialog box.
To enter the driver-specific keywords for the database you are connecting to, click the
Advanced button. We recommend you leave the Verify this connection check box selected.
Click OK to continue.
MapInfo Professional 10.5
136
User Guide
Chapter 6: Accessing Remote Data
Accessing Data in Remote Spatial Databases
4. Do one of the following and click Next to continue:
• Type the name you want to use to identify this connection in this field or
• Click the Browse button to identify the location of the connection and save it.
For example, If you create a data source for an Oracle database that contains customer tables,
you might name the data source, "CUSTOMERS".
5. Once you have set up your data source, MapInfo Professional displays the data source names in
the Select Data Source dialog box, for easy selection.
Opening a Connection to an Oracle Spatial Data Source
You can only connect to an Oracle database or the Oracle instant client on the machine if you have
the Oracle client installed and the OCI driver.
To connect to a new data source using the OCI:
1. Choose File > Open DBMS Connection. If you installed the Oracle Spatial (OCI) driver, the
Open DBMS Connection dialog displays.
2. Choose Oracle Spatial and click New. The MapInfo Oracle Connect dialog box displays.
MapInfo Professional 10.5
137
User Guide
Chapter 6: Accessing Remote Data
Accessing Data in Remote Spatial Databases
You may need to speak to your Oracle Database Administrator to get this information.
3. Type your user name and password for the Oracle server connection in the fields provided. Type
the name of the server on which your tables are located in the Server Name field. Click OK to
continue.
4. To access the tables on the selected server, select File > Open and click arrow beside the Files
of type drop-down list. Scroll to the bottom of the list to find the connection you created. For more
details about opening a table from this server, see Opening a Database Table from a
Connection.
Opening a Connection to a PostGIS Data Source
You can only connect to a PostGIS database if you have the psqlODBC driver; drivers are supplied
with PostgreSQL. We recommend using the PostgreSQL ANSI driver.
L
When accessing data in a PostgreSQL/PostGIS database, a table may not display if the
database is in more than one language and the language character sets are not compatible.
To connect to a new data source using the psqlODBC driver:
1. Choose File > Open DBMS Connection. The Open DBMS Connection dialog box displays.
2. Click New. The Select Data Source dialog box displays.
3. Select the Machine Data Source tab, and then click New. The Create New Data Source wizard
displays.
4. Select a type of data source and then click Next.
5. Scroll to the bottom of the list and select PostgreSQL ANSI, and then click Next.
6. Click Finish. The PostgreSQL ANSI ODBC Driver Setup dialog box displays.
MapInfo Professional 10.5
138
User Guide
Chapter 6: Accessing Remote Data
Accessing Data in Remote Spatial Databases
7. Enter information for the following fields:
• Database – The PostGIS database to connect to.
• Server – The server location (the default is localhost).
• User Name – The user name set for the PostGIS database.
• Password – The password set for the PostGIS database.
For the SSL Mode field, use the default settings. For the Port field, use the port number
assigned to the server if different from the default.
8. Click Test to test the connection using your input values.
L
If you are unable to connect, then check the username and password.
9. Click Save.
The data source name displays in the list under the Machine Data Source tab.
Opening a Database Table from a Connection
Once you have opened a connection to a database, the connection is available each time you select
File > Open and click the Files of Type drop-down list. From there you can open live or linked tables
located on that server through the connection you have created.
To open a particular table based on the data source connection:
1. Choose File > Open to display the Open dialog box.
2. From the Files of type drop-down list, select the database connection you created in Opening a
Connection to an ODBC Data Source on page 135.
MapInfo Professional 10.5
139
User Guide
Chapter 6: Accessing Remote Data
Accessing Data in Remote Spatial Databases
This list displays the remote tables available on the selected data source.
Connections you add to the Files of type drop-down list appear at the bottom of the list and
contain a sequential number that indicates the order in which the connection was added.
L
If you do not see the table you are looking for in the list, click the Filter Tables button and
check the filter options to see if your view is restricted. Check the Owner drop-down list
too to see if there are other schemas on the server you selected that may contain the
table you are looking for.
3. Select the table in the list you want to open and click Open. The Open DBMS Table Options
dialog box displays.
MapInfo Professional 10.5
140
User Guide
Chapter 6: Accessing Remote Data
Accessing Data in Remote Spatial Databases
Use this dialog box to select the type of view you want of your remote data.
•
•
Click Standard Mode to open particular rows or columns of the selected table. The
instructions in this description assume you are opening the table using Standard Mode.
Click Expert Mode to create a SQL Query to open particular rows or columns of the selected
table.
4. Click the Column Filter button to specify the columns to download. The Column Picker dialog
box displays.
An asterisk (*) appears in the Selected list when you first open this dialog box. If you
leave the asterisk, MapInfo Professional retrieves all the columns in the table from the
remote database.
a. To move the columns you want to display from the table from the Available group to the
Selected group using the arrow buttons. The single arrow keys move one selected column at
a time. The double arrow buttons move all the columns at once from one list to the other.
b. To change the order of the selected columns in the Selected list, highlight the column you
want to move and click the Up and Down buttons until the column is positioned correctly.
MapInfo Professional 10.5
141
User Guide
Chapter 6: Accessing Remote Data
Accessing Data in Remote Spatial Databases
c. Click OK to complete your selections.
L
If the table is mappable, the Available list also displays an additional column called
OBJECT, which refers to the spatial column. You can select it to download point objects
from the table. If the table is spatialized, MapInfo Professional downloads lines, points,
and polygons depending on what the table contains.
5. Click the Row Filter button to select the row data that you want MapInfo Professional to
download.
Leave this dialog box as it is to retrieve all of the rows pertaining to the columns you
selected.
a. Select the column, operator, and value entries that match the data you want to retrieve from
the selected table.
L
This is the same as specifying the WHERE clause in a SQL query.
b. In the Column list, choose the column(s) from which you want to filter rows.
c. If you are filtering rows for one column, select a column, operator, and value. If filtering rows
on more than one column, select a column from the next drop-down list. This also activates
the next row of fields for data entry.
d. Choose how you would like to filter the rows using the Operator and Value boxes. See Notes
for Completing the Row Picker Query in the Help System for assistance in completing these
entries the way you want them.
Click OK when you have finished filtering the rows.
MapInfo Professional 10.5
142
User Guide
Chapter 6: Accessing Remote Data
Accessing Data in Remote Spatial Databases
6. When you have completed your Standard Mode selections, do one of the following:
•
•
To open a linked table, click Download data (Linked Table) to download the data and
create a linked table. Clear the box for live access.
To open a live access table, click Live Access and choose whether to click the Cache check
box.
Select the Cache check box to keep attributes and objects that have been read in memory. If
you perform an operation such as zooming in they do not need to be fetched from the
database (since MapInfo Professional looks in memory for a record you may not see the
latest updates). If you select the Cache check box, another user’s updates may not appear
until the cache is invalidated by a pan or zoom out operation.
Clear the Cache check box, to retrieve all of the data from the database whenever it is
needed. This option provides the most current data but it is be less efficient.
7. Click OK to retrieve the data you selected and save it to the table name you specified.
•
For more information, see Opening a DBMS Table from the Open Table Dialog Box and Notes
for Completing the Row Picker Query in the Help System.
Read-Only Support Spatial Objects with Z and M Values
Spatial data that is stored in SQL Server Spatial Geometry and Geography field types may have Z
and M values. MapInfo Professional can not edit this type of spatial data and ignores the Z and M
values, so you must view these tables as read-only in MapInfo Professional. If you edit this type of
spatial data in MapInfo Professional, saving the table back to the original SQL Server Spatial table
does not preserve the original Z and M values.
The MapCatalog has the following spatial types for tables with Z and M values:
20 – Geometry read-only support of objects with Z/M values.
21 – Geography read-only support of objects with Z/M values
Creating a New DBMS Table
To create a new DBMS table:
1. Choose File > New Table. The New Table dialog box displays.
2. Specify how you want the table opened, (Browser, Mapper, Current Mapper).
3. Specify whether you want the table structure to be based on an existing table or you want
MapInfo Professional to create a new table structure.
4. Press the Create button. The New Table Structure dialog box displays.
5. Specify the field name, field type, number of characters (width), and whether or not the field is to
be indexed for each field in your new database.
You also indicate whether the table is mappable by associating graphic objects with records and,
if so, whether the map is to be an earth or a non-earth map.
If you are using the structure from another mappable table, then MapInfo Professional sets the
new table projection to the projection of the source table. Collectively, this information is the
structure of your database.
6. Press the Create button to display the Create New Table dialog box.
MapInfo Professional 10.5
143
User Guide
Chapter 6: Accessing Remote Data
Accessing Data in Remote Spatial Databases
7. Select a DBMS database from the Save as type drop-down list. The DBMS connection controls
display, (Owner: box and Filter Tables: button).
8. Specify a file name and press the Save button. The New DBMS Table Options dialog box
displays.
This dialog box has three tabs, General, Spatial, and Styles. However, If you cleared the Make
Table Mappable check box in step 4 then the DBMS Table Options dialog box will only have the
General tab. Press the Help button to display specific information corresponding to the tab you
are currently in.
Follow the instructions listed below, depending upon the tabs that display.
9. Click the General tab and complete the appropriate selections.
TAB file location
Displays the name and path of the .tab file that will be created. You can manually type a
filename or use the Save As dialog box (via Browse button) to choose a filename. MapInfo
Professional uses the last directory where you saved a DBMS .tab when constructing the
default filename full path. If this directory does not exist, then the Remote Tables preference
directory is used. The filename part of the default path is based on the name of the specified
DBMS table name.
Browse (…) button
Displays the Save As dialog box so the user can choose a .tab filename. Initialized with the
text in the .tab filename edit box.
Download Data (Linked Table)/Live Access/Cache buttons
Download Data
When the Download Data (Linked Table button is selected) you have a linked table.
Unchecked provides Live Access. MapInfo Professional will remember the last used settings
and continue to use them until you change the settings.
Cache
When the Cache check box is selected, you are using the local buffer. Access time to data is
faster but you don’t get the most current version.
When the Cache check box is cleared, you are always reading the remote data, which is the
most recent version.
L
The Cache check box should only be enabled if the Live option is selected. Refresh
occurs when you zoom, pan, or pack.
Key Column:
Allows you to specify a key column for the new table. Without a key column a DBMS table
cannot be open as live access and can only be opened read only as Linked.
If the Key Column check box is selected, then the corresponding combo box is enabled. You
can either choose a column that was specified in the New Table Structure dialog box or
specify a new column by typing into the combo box’s edit control.
MapInfo Professional 10.5
144
User Guide
Chapter 6: Accessing Remote Data
Accessing Data in Remote Spatial Databases
By default the Key Column check box is selected and a new column is specified. The default
name of the new column depends on the DBMS connection: MI_PRINX for Oracle Spatial,
SW_MEMBER for all others.
10. Click the Spatial tab and specify the index type and coordinate column selections.
Index Type:
This setting determines the type of spatial indexing used on the table. Types MapInfo
(MICODE) and XY are always available. Server specific types may also be listed. The index
type selection affects the state of the other three controls in this tab.
Index Column:
This control is used to specify the primary spatial index column. It's always available, except
when the index type is XY.
X Coordinate:
This control is used to specify the X or latitude column in the database. It's only available for
MapInfo (MICODE) or XY types. You can either choose a float column that was specified in
the New Table Structure dialog box or specify a new column by typing into the combo box’s
edit control.
Y Coordinate:
This control is used to specify the Y or longitude column in the database. It's only available
for MapInfo (MICODE) or XY types. You can either choose a float column that was specified
in the New Table Structure dialog box or specify a new column by typing into the combo
box’s edit control.
11. Click the Styles tab and complete the appropriate selections.
Per Row Style
Check the Per Row Style box to enable per row symbology. The style info for each object is
maintained in a character column of the table. If unchecked, then the style of all objects in the
table is determined by the default object styles (maintained in the Map Catalog). If Per Row
Style is checked, then the Style Column combo box is enabled. By default Per Row Style is
checked and a new column named MI_STYLE is specified.
Style Column:
You can either choose a character column that was specified in the New Table Structure
dialog box or specify a new column by typing into the combo box’s edit control.
Default Object Styles:
Symbol/Line/Region
The default object styles are used when Per Row Style is not turned on for a table, or the
style info for a particular object does not exist (the style column for that row is empty). The
default style info specified here is entered into the map catalog. The default symbol, line and
region settings within MapInfo Professional are used to initialize these controls.
12. Press OK to open the DBMS table according to your specifications above.
MapInfo Professional 10.5
145
User Guide
Chapter 6: Accessing Remote Data
Accessing Data in Remote Spatial Databases
Refreshing Live and Linked Remote Tables
When you open a remote table as a “Live” table, MapInfo Professional enables the Refresh DBMS
Table
toolbar button so you can refresh the data in that table. This same functionality is
available for linked remote database tables.
You can refresh a MapInfo Professional linked table with the most recent data residing on the
remote database for that linked table.
To refresh a linked or live table:
1. Do one of the following:
• Use the Refresh DBMS Table button on the DBMS toolbar
• On the Table menu, point to Maintenance and click Refresh DBMS Table.
Using either method, the Refresh Table dialog box displays.
2. Choose the name of the table to be refreshed from the refresh table list.
3. Choose OK. The specified table is refreshed.
Unlinking a Table from a Remote Database
You can unlink a table from its remote database with the Unlink DBMS Table command. Unlinking a
table removes the link to the remote database. This command does not work if edits are pending on
the linked table. You must first update any pending edits with the Save Table command. The table
linkage is removed. Fields that were marked non-editable are now editable. The end product is a
normal MapInfo Professional base table.
To unlink a table:
1. On the Table menu, point to Maintenance and click Unlink DBMS Table. The Unlink Table
dialog box displays.
2. Choose the name of the table to be unlinked from the Unlink table list.
3. Choose OK. The specified table is unlinked.
Saving a DBMS Table
You save changes to an MapInfo Professional linked or live table the same way you save a regular
MapInfo Professional table, with the Save Table command.
Saving a linked or live table results saves the records on the remote database. But before MapInfo
Professional allows records from a linked or live table to be updated, it evaluates the records in a
process called conflict resolution.
If MapInfo Professional finds conflicts between the data on the remote database and any records in
the linked table since it was downloaded, the Resolve Conflicts dialog box automatically appears.
Use this dialog box to resolve conflicts.
•
For more information, see Saving Changes Made to a DBMS Table in the Help System.
MapInfo Professional 10.5
146
User Guide
Chapter 6: Accessing Remote Data
Accessing Data in Remote Spatial Databases
Conflict Resolution for Linked or Live Tables
Because the records in a remote table are from a remote database, it is possible that other users
may have changed or deleted them on the remote database since the table was downloaded into
MapInfo Professional. As a result, conflicts may exist between the data residing on the remote
database and the new data that you want to upload to the remote database.
When saving a remote table, if MapInfo Professional finds conflicts between the data on the remote
database and any records in the remote table since it was downloaded, the Resolve Conflicts dialog
box automatically displays. Use this dialog box to resolve conflicts as explained in the next table.
This process will be invoked whenever an attempt to save a remote table detects a conflict in an
update. The dialog box allows the user to choose which fields from the conflicting records will be
used to update the database. Three instances of the record being updated must be considered:
•
•
•
The original server state of the record (the record as it appeared when initially extracted from
the database).
The current local state of the record (the record as it appears in the session of MapInfo
Professional making the update, possibly after editing by the user).
The current server state of the record (the record as it appears in the database at the time of
the update).
A conflict exists when the original state of the record does not match the server state. This implies
that another user has updated this database since it was extracted by MapInfo Professional.
The Conflict Resolution dialog box displays once for each conflicting record. At any point in this
process, you may choose to leave this interactive mode and have the rest of the conflicts resolved
automatically. In that case, you can use all local values or all server values to resolve the conflicts in
the records.
For each conflict found during a commit, a modal dialog box displays. This box will display enough
information for you to decide which data values to use to update the row in question.
Type of conflict
Default resolution
Value changed on server, local value unchanged
Use server value
Value changed on server, local value changed
Use local value
Click OK to save the selected values to update this record.
Column
Shows the name of the column in the record that has data which is in conflict and needs to be
resolved. If the column name is too long and does not fit into the list box, a truncated
representation will be shown instead. Its full value displays in the Column field.
Original DBMS
Shows the original data as it appeared when extracted from the database. If the original data
is too long and does not fit into the list box, a truncated representation will be shown instead.
Its full value can be displayed in the Original field.
MapInfo Professional 10.5
147
User Guide
Chapter 6: Accessing Remote Data
Accessing Data in Remote Spatial Databases
Current MapInfo Professional
Shows the data as it appears in the MapInfo Professional linked table you are trying to save.
The MapInfo Professional field will be blank if the record has been deleted from the MapInfo
Professional database. If the data from the MapInfo Professional linked table is too long and
does not fit into the list box, a truncated representation will be shown instead. Its full value
can be displayed in the MapInfo Professional field.
Current DBMS
Shows data as it appears in the remote database at the time of the update. (This data might
have been changed by another user since it was downloaded into an MapInfo Professional
linked table.) The Current field will be blank if the record has been deleted on the remote
database, after being downloaded into an MapInfo Professional linked table. If the current
data from the remote database is too long and does not fit into the list box, a truncated
representation will be shown instead. Its full value can be displayed in the Current field.
Current MapInfo Professional
Select this check box to update the remote database with the value from the MapInfo
Professional linked table.
If the current record on the database or the MapInfo Professional record was deleted, then
this check box is not available. Instead, you must use the MapInfo Professional or Current
button.
Current DBMS
Select to retain the current value on the remote database. If the current record on the
database or the MapInfo Professional record was deleted, then this check box is not
available. Instead, you must use the MapInfo Professional or Current button.
MapInfo button
This button selects all the MapInfo Professional values. If the record you are trying to resolve
was deleted from the MapInfo Professional database, selecting the MapInfo button will
delete the record from the remote database. If the record you are trying to resolve was
deleted from the remote database, selecting the MapInfo button will insert the new record
into the remote database.
Current button
This button selects all the current DBMS values. If the record you are trying to resolve was
deleted from the MapInfo Professional database, selecting the Current button will ignore the
deletion and retain the current record in the remote database. If the record you are trying to
resolve was deleted from the remote database, selecting the MapInfo button will insert the
new record into the remote database.
Column
Shows the full name of the column highlighted in the list box.
Original DBMS
Shows the full value of the original data highlighted in the list box.
Current MapInfo
Shows the full value of the MapInfo Professional data highlighted in the list box.
Current DBMS
Shows the full value of the current remote database data highlighted in the list box.
MapInfo Professional 10.5
148
User Guide
Chapter 6: Accessing Remote Data
Accessing Data in Remote Spatial Databases
Stop Commit
The Stop Commit button terminates the entire update. A second dialog box confirms that
this is what you really want.
Automatic
The Automatic button causes the interactive conflict resolution to end. A dialog box displays
to allow you to select the automatic conflict-resolution modes you want to use for the
remainder of this update. You can select one two automatic modes from the dialog box. You
can accept MapInfo Professional values, or the values currently residing on the remote
database.
•
For more information, see Saving a Copy of a Table to a DBMS Table in the Help System.
Disconnecting from a Remote Database
Disconnecting from a remote database server is a simple operation.
To disconnect from a remote database server:
1. From the DBMS Toolbar, do one of the following:
• Click the Disconnect DBMS
button.
• On the File menu, click Close DBMS Connection.
Both operations display the Close DBMS Connection dialog box. The Connection list displays
all the open connections.
2. Select the connection(s) you want to close and click OK. The selected connection(s) close.
Working with Styles in DBMS Tables
Using Per Row Styles for DBMS Table Layers
Per Row Styles allows the use of different object styles on a remote database. You can modify the
styles of individual objects or groups of objects and save them to a DBMS table. To use Per Row
Styles, the DBMS table must be set up correctly, and your MapInfo MapCatalog must have the
appropriate structure:
•
•
•
The MapCatalog must contain columns that support the use of styles. They are:
RENDITIONTYPE, RENDITIONCOLUMN, and RENDITIONTABLE.
The map table itself must have a character column wide enough to store the complete style
string. Style strings vary in width. We recommend a minimum of 50 characters be provided. If
you plan to use custom symbols, which use much longer strings, allow 200 characters.
The entry for the table in the MapCatalog must be set correctly. This means that the
RENDITIONTYPE is 1, and the RENDITIONCOLUMN contains the name of the column that will
contain the style string. This entry is set by EasyLoader if the MapCatalog contains the new
columns, or it may be set using the Make Table Mappable function.
MapInfo Professional 10.5
149
User Guide
Chapter 6: Accessing Remote Data
Accessing Data in Remote Spatial Databases
Changing the Symbol Style in a Mappable DBMS Table
The Change DBMS Table Symbol command allows you to change the symbol attributes for the point
objects in a mappable DBMS table.
1. On the Table menu, point to Maintenance and click Change DBMS Table Symbol. The Select
DBMS Table is displayed. The dialog box only displays mappable DBMS tables.
2. Select a DBMS table to display the Change Table Object Style dialog box. Use the dialog box to
specify new style attributes for the objects in the selected table.
3. You must close, reopen, and refresh the linked table for the style change to take effect.
Converting Unsupported Geometries in Oracle, SQL Server SpatialWare,
SQL Server Spatial, and PostGIS
Some times when you are creating a Map in MapInfo Professional and you are storing the results in
Oracle, SQL Server Spatialware, SQL Server Spatial, or PostGIS, you create maps which use
geometries that are not supported by these DBMS engines.
•
•
•
•
Oracle does not support arcs, ellipses, rectangles, and rounded rectangles.
SQL Server Spatial does not support arcs, and lines that do not have distinct points.
SQL Server SpatialWare does not support arcs, ellipses, and rounded rectangles.
PostGIS does not support arcs, ellipses, rectangles, and rounded rectangles.
L
If you have created a map you do not want to lose but cannot save to the DBMS of your
choice due to unsupported geometries, then use the Save As command and save the map
without the unsupported geometries.
Oracle Geometry Conversion Behavior
If you try to save a map with unsupported spatial geometry types in Oracle, these are the results:
•
Spatial Geometry Types with All Unsupported Objects: If you have created a map that might
contain all of the unsupported objects and you are trying to save to Oracle, this message
displays:
Table has unsupported objects (rounded rectangles, rectangles,
ellipses or arcs). Convert to regions and/or polylines?
Click Yes to convert the unsupported objects to regions or polylines; you would select No to
decline to convert the unsupported objects. If you decline, you cannot save the map you have
created to the Oracle database. A confirmation message explains that the operation is canceled.
•
Spatial Geometry types with Region Objects Only: If you have created a map that contains
region objects only and you are trying to save to Oracle, this message displays:
Table has unsupported objects (rounded rectangles, rectangles, or
ellipses). Convert to regions?
Click Yes to convert the unsupported objects to regions; you would select No to decline to
convert the unsupported objects. If you decline, you cannot save the map you have created to
the Oracle database.
MapInfo Professional 10.5
150
User Guide
Chapter 6: Accessing Remote Data
Accessing Data in Remote Spatial Databases
•
For Spatial Geometry types with Line Objects Only: If you have created a map that contains
line objects only and you are trying to save to Oracle, this message displays:
Arc is an unsupported object. Convert to polylines?
Click Yes to convert the unsupported objects to polylines; you would select No to decline to
convert the unsupported objects. If you decline, you cannot save the map you have created to
the Oracle database.
SQL Server Spatial and SQL Server SpatialWare Geometry Conversion Behavior
If you try to save a map with unsupported spatial geometry types in SQL Server Spatial or SQL
Server SpatialWare, these are the results:
•
Spatial Geometry Types with All Unsupported Objects: If you have created a map that might
contain all of the unsupported objects and you are trying to save to SQL Server Spatial or SQL
Server SpatialWare, this message displays:
Table has unsupported objects (rounded rectangles, ellipses or
arcs). Convert to regions and/or polylines?
Click Yes to convert the unsupported objects to regions or polylines; you would select No to
decline to convert the unsupported objects. If you decline, you cannot save the map you have
created to the SQL Server Spatial or SQL Server SpatialWare database.
•
Spatial Geometry types with Region Objects Only: If you have created a map that contains
region objects only and you are trying to save to SQL Server Spatial or SQL Server SpatialWare,
this message displays:
Table has unsupported objects (rounded rectangles or ellipses).
Convert to regions?
Click Yes to convert the unsupported objects to regions; you would select No to decline to
convert the unsupported objects. If you decline, you cannot save the map you have created to
the SQL Server Spatial or SQL Server SpatialWare database.
•
For Spatial Geometry types with Line Objects Only: If you have created a map that contains
line objects only and you are trying to save to SQL Server Spatial or SQL Server SpatialWare,
this message displays:
Arc is an unsupported object. Convert to polylines?
Click Yes to convert the unsupported objects to polylines; you would select No to decline to
convert the unsupported objects. If you decline, you cannot save the map you have created to
the SQL Server Spatial or SQL Server SpatialWare database.
PostGIS Geometry Conversion Behavior
If you try to save a map with unsupported spatial geometry types in PostGIS, these are the results:
•
Spatial Geometry Types with All Unsupported Objects: If you have created a map that might
contain all of the unsupported objects and you are trying to save to PostGIS, this message
displays:
Table has unsupported objects (rounded rectangles, ellipses or
arcs). Convert to regions and/or polylines?
Click Yes to convert the unsupported objects to regions or polylines; you would select No to
decline to convert the unsupported objects. If you decline, you cannot save the map you have
created to the PostGIS database.
MapInfo Professional 10.5
151
User Guide
Chapter 6: Accessing Remote Data
Accessing Data in Remote Spatial Databases
•
Spatial Geometry types with Region Objects Only: If you have created a map that contains
region objects only and you are trying to save to PostGIS, this message displays:
Table has unsupported objects (rounded rectangles or ellipses).
Convert to regions?
Click Yes to convert the unsupported objects to regions; you would select No to decline to
convert the unsupported objects. If you decline, you cannot save the map you have created to
the PostGIS database.
•
For Spatial Geometry types with Line Objects Only: If you have created a map that contains
line objects only and you are trying to save to PostGIS, this message displays:
Arc is an unsupported object. Convert to polylines?
Click Yes to convert the unsupported objects to polylines; you would select No to decline to
convert the unsupported objects. If you decline, you cannot save the map you have created to
the SQL Server Spatial database.
•
For Spatial Geometry of type Rectangle: If you have created a map that contains rectangle
objects and you are trying to save to PostGIS, this message displays:
Cannot upload Object - Rectangle object type is not supported in this
table. Operation canceled.
Click OK. You cannot save the map you have created to the PostGIS database.
Supporting Oracle Spatial
Oracle Spatial is an implementation of a spatial database from Oracle Corporation. You can install it
in addition to the MapInfo Professional ODBC Connectivity component. Although it has some
similarities to the previous Oracle SDO relational implementation, it is significantly different. Oracle
Spatial maintains the Oracle SDO implementation via a relational schema. However, MapInfo
Professional does not support the Oracle SDO relational schema via the Oracle Call Interface (OCI).
MapInfo Professional does support simultaneous connections to Oracle Spatial through the OCI and
to other databases through ODBC.
The Multipoint and Collection object types are translated into the Spatial Objects Oracle
MULTIPOINT and COLLECTION, respectively, via Oracle OCI and vice versa. However, Oracle's
COLLECTION object is broader in scope than MapInfo Professional’s Collection, which only allows
one REGION, one polyline and one multipoint. Therefore, conversion from MapInfo Professional
object to Oracle objects and the conversion from Oracle objects to MapInfo Professional objects
may not be a one-to-one translation.
The following table shows the relationship between MapInfo Professional objects and Oracle
objects.
Oracle Spatial Objects
MapInfo Professional Objects
MULTIPOINT
Multipoint
COLLECTION
Collection
Point (cluster)
Multipoint
Line String
Polyline
MapInfo Professional 10.5
152
User Guide
Chapter 6: Accessing Remote Data
Accessing Data in Remote Spatial Databases
Oracle Spatial Objects
MapInfo Professional Objects
Multiple Line String
Polygon
REGION
Multiple Polygons
The table indicates how Oracle Spatial objects are translated into MapInfo Professional objects. All
point elements in an Oracle COLLECTION will be translated into one multipoint in a MapInfo
Professional Collection; all Oracle Line objects (including single and multiple) will be translated into
one MapInfo Professional polyline; and all Oracle Polygons (including single and multiple) will be
translated into one MapInfo Professional REGION. Therefore, when an Oracle COLLECTION is
modified and then saved back into Oracle Server by using MapInfo Professional, the original
structure of the Oracle COLLECTION object may be changed if it is more complicated than the
MapInfo Professional Collection.
Oracle Spatial Requirements
To connect to Oracle Spatial within MapInfo Professional, you must have the Oracle Spatial or
Oracle 9i and 9i release 2, or 10G client installed. See your Oracle documentation for detailed
information.
Primary Key used for New Table Creation or When Saving a Remote Copy
An Unique key ensures that an entry does not match any other entry from a different record. If a
record does not contain any value, no error is reported. A Primary key requires that every record
contains a unique value in that field. By making these values Primary keys, we enforce that every
record has a value in this field.
Primary Key Auto-Increment for Oracle Databases
The Primary auto-increment feature manages the Primary key value for you. When you add a new
record to a remote Oracle table, MapInfo Professional locks the table, checks for the highest value
of the Primary key of the table, increments it by one (1), and then puts that value in the Primary key
field. SQL Server Spatial users do not require this feature as the server-side software manages the
Primary key automatically.
Use the Auto Key check box in the Open DBMS Table Option dialog box to enable this feature.
When you select the Auto Key check box, the Primary key field is not editable and the Unique key is
automatically incremented. If you do not select this check box, the Primary key field remains
editable, which supports backwards compatibility.
To access this feature:
1. From the File menu, click Open and select an Oracle database from the Files of Type dropdown list. Click OK to display the Open DBMS Table Options dialog box.
2. Select the Auto Key option to increment the Primary key of the selected table automatically for
any new records.
MapInfo Professional 10.5
153
User Guide
Chapter 6: Accessing Remote Data
Accessing Data in Remote Spatial Databases
3. Click OK to continue.
Oracle Object Map Verification Supporting Object/Map Validation
The Check Regions command enables you to remove region line segments that intersect each
other. You can also think of this as nodes within a single polygon of a region where the polygon
intersects itself, as when a node has more than 2 line segments emanating from it.
These cases can be broken down into two other instances.
•
•
If a polygon has 2 looped sections, and the path traced by the nodes of the polygon follow a
cursive figure 8 pattern, then we call this a Figure 8 polygon.
If the same 2 looped polygon can trace its path as a cursive capital letter B, then we call this a
Bow Tie polygon.
We think of Figure 8 as worse than Bow Tie because the area of a Figure 8 is always incorrect, while
the area of a Bow Tie can be correct and accurate. Both Figure 8's and Bow Ties are detected.
Supporting SpatialWare
SpatialWare is a Pitney Bowes Software Inc. Corporation product that helps users store, access,
manage, and manipulate spatial data as a standard part of their business data. You can query both
spatial and non-spatial data within a single SQL Server query using SpatialWare. All of the strengths
of SQL Server as a relational database are extended to spatial data using SpatialWare. Spatial data
may for example be directly managed and edited by many different users simultaneously.
Bound Objects in SpatialWare Spatial Queries
For both linked and live access tables, spatial objects in SpatialWare and Oracle Spatial queries are
now submitted as a bound (binary) object. This change has been made for all implementations of
SpatialWare: Oracle and Oracle Spatial. Previously, a string was generated for the object. Because
of the limitations on the string size, polygon complexity was also limited. Submitting spatial objects
as bound objects removes this limitation. The string describing the spatial object will be stored in the
.tab files and reconstructed into a bound object when the table is opened. The SW SPW lib will be
used to construct the bound object from the SpatialWare string.
Creating Legends from/for a Live Table
You can retrieve unique styles from the table using the Create Legend wizard. You can retrieve
styles from the map catalog, if performance is your primary concern, but if you prefer a more visually
descriptive and appealing graphical representation of the unique map styles in your live table, you
can create legends from a live table instead.
When are unique map styles available for a live table?
In general, remote databases have no consistent way of storing styles for geographic data. MapInfo
Professional gives you two different ways of associating styles with geographic data for remote
databases. The first way is to specify a common style for a database table in the map catalog, which
is used for all records in that database table. The second way is to have an additional column for the
MapInfo Professional 10.5
154
User Guide
Chapter 6: Accessing Remote Data
Accessing Data in Remote Spatial Databases
database table that specifies a style for each record in that table. (MapInfo Professional uses the
map catalog to keep track of the style column for a database table.) Unique map styles are available
for a database table when it has this designated style column.
To see this functionality:
1. Open a remote DBMS connection and select a live table for display.
2. From the Map menu, click Create Legend to display the Create Legend Step 1 of 3 dialog box.
3. Select a layer to create a legend from and click Next to display the Create Legend Step 2 of 3
dialog box. For purposes of this demonstration, click Next to display the Create Legend Step 3 of
3 dialog box.
4. In the Styles from box, there are three options. The first option, map catalog, provides the
existing support and is still the default for live tables.
•
•
•
Select map catalog to retrieve the default styles for the selected legend frame from the map
catalog. Use this option when you are concerned with performance. Retrieving map styles
from live tables on a remote database can take a long time, but retrieving a default style from
the map catalog can be significantly faster. Remember that styles in the map catalog may not
be as visually descriptive as the other options. This is the default option for live tables, but is
disabled for other types of tables.
Select unique map styles to retrieve all unique object styles for the live access table.
MapInfo Professional retrieves all unique map styles from the database table for a more
visually appealing legend. For extremely large tables, this option can take longer than the
first option. This option is selected by default when the legend frame is not a live access
table.
Select unique values in a column of the selected table to retrieve the styles associated with
the values saved in a particular column in the database table for a more visually appealing
legend. For extremely large tables, this option can take longer than the first option.
5. Then click Save frame setting to Metadata to preserve the choice you made in this dialog box.
When you re-open this dialog box the settings from the metadata are used as default values
instead of the system set default values. There is legend metadata for the Styles from radio
buttons that we preserve.
•
•
•
•
File Data Source — Displays all file DSNs (data source names) and subdirectories
contained within the directory displayed in the Look In box. Double-clicking a DSN connects
to the data source.
Look In — Displays the current directory in which the subdirectories and file DSNs display.
Click the Down Arrow to the right of the text box to display the entire path.
DSN Name — Displays the file DSN name selected in the File Data Sources list, or you can
enter a new file DSN name.
New — Adds a new file data source. If you click this button, the Create New Data Source
dialog box appears with a list of drivers. Choose the driver for which you are adding a file
DSN. After you click Next, you may specify the keywords for the file DSN. See Opening a
Connection to an ODBC Data Source on page 135, for instructions on creating a new data
source.
6. If your connection type is Oracle Spatial, the MapInfo Professional Oracle Connect dialog box
displays.
MapInfo Professional 10.5
155
User Guide
Chapter 6: Accessing Remote Data
Accessing Data in Remote Spatial Databases
7. Enter the server name, user name, and password, and then click OK.
When you have chosen or created a connection the Open DBMS dialog box displays. It contains
a list of tables for that connection, which displays in the Tables field. The directory path of the
database connection or the database name also displays. This field is not present for data
sources that do not provide this information.
8. Click the name of the table you want to download to highlight it.
9. As an optional step, use the Filter button to select which types of tables to list. The default
shows Tables, View, and Synonyms, and hides System tables.
10. Click Open. The Open DBMS Table Options dialog box displays.
For data sources that make use of owners, such as Oracle, the Owner field is activated. It allows
you to list tables owned by different users.
•
See Troubleshooting DBMS Table Issues in the Help System.
MapInfo Professional 10.5
156
User Guide
Drawing and Editing
Objects
The drawing and editing capabilities in MapInfo Professional allow you to create
and customize an unlimited variety of objects for your maps. Easy-to-use
drawing tools and commands are accessible from the Drawing Toolbar. You
can also display nodes, line directions and centroids to give you better control
when editing objects.
Topics in this Section:
Understanding the Drawing and Editing Tools . . . . . . . . . . . . . .158
Drawing Objects . . . . . . . . . . . . . . . . . . . . . . . . . . . . . . . . . . . . . . .160
Drawing Polygons and Polylines . . . . . . . . . . . . . . . . . . . . . . . . .162
Drawing Symbols . . . . . . . . . . . . . . . . . . . . . . . . . . . . . . . . . . . . . .165
Working with Text on the Map. . . . . . . . . . . . . . . . . . . . . . . . . . . .169
Editing Objects . . . . . . . . . . . . . . . . . . . . . . . . . . . . . . . . . . . . . . . .170
7
Chapter 7: Drawing and Editing Objects
Understanding the Drawing and Editing Tools
Understanding the Drawing and Editing Tools
MapInfo Professional has a complete set of drawing tools and editing commands. These tools allow
you to draw and modify objects on your map. You can also use these tools to customize the colors,
fill patterns, line types, symbols, and text on your map.
However, these tools and commands give you more than the ability to modify your map. You can
draw a variety of objects that you can use to perform powerful geographic analyses. For example,
you can draw circles, polygons, and other bounded objects. You can then search for records within
those boundaries.
L
You can only draw and edit objects on a map when the layer the object is on is editable.
We have covered making a layer editable in depth elsewhere in this User Guide. See Making the
Layers “Editable” on page 60.
L
•
We have increased the size of the allowed objects in MapInfo Professional. That is, we have
increased the number of nodes permitted per object for regions, polylines, and multipoints
and we have increased the number of polygons allowed in a multipolygon region and
increase the number of polylines in a multiple segment polyline.
For more general information, see Understanding the Drawing and Editing Tools in the Help
System.
Using the Drawing and Editing Commands
There are nine drawing tools, each located in the Drawing toolbar, which you can review in
Reviewing the Drawing Toolbar on page 39. The Drawing toolbar contains six additional buttons
to aid you in drawing and editing.
Icon
Tool
Button
Reshape
Description
Toggle in and out of Reshape mode with this button when you want to add,
delete, or move nodes in an editable layer (also available on the Edit menu).
Add Node The Add Node button allows you to put additional nodes on an object for
more precise editing.
Line Style
Displays the Line Style dialog box where you can change the color, width,
and type of selected line objects or set new defaults for future objects.
Region
Style
Displays the Region Style dialog box where you can change the fill pattern
and border of selected region objects or set new defaults for future objects.
MapInfo Professional 10.5
158
User Guide
Chapter 7: Drawing and Editing Objects
Understanding the Drawing and Editing Tools
Icon
Tool
Button
Description
Symbol
Style
Displays the Symbol Style dialog box where you can change the symbol
type, color, and size of selected objects or set new defaults for future
objects.
Text Style
Displays the Text Style dialog box where you can change the font, size,
color, and attributes of selected text or set new defaults for future text and
labels.
Adding a Node
Nodes can be added only to lines, polylines, and regions.
The maximum number of nodes for regions and polylines is 1,048,572 nodes for a single polygon
region or polyline. The limit drops by seven nodes for every two additional polygons.
To add a node:
1. Choose Drawing Toolbar > Add Node button.
2. Move the cursor to the point on the segment where you want to add a node.
3. Click to add the node. Press the Backspace key to delete the last node added.
4. Choose Edit > New Row, a new row is added to the bottom of the table.
Adding Nodes to an Object (Overlay Nodes Command)
To add nodes to an existing object:
1. Select one or more objects in the editable map layer of the active Map window. These are the
objects to which you want to add nodes.
2. Choose Objects > Set Target. The objects you selected in Step 1 appear in a different style to
indicate that they are the editing targets.
3. Select one or more objects from any layer of the active Map window. Presumably, these are
objects that intersect your target object(s).
4. Choose Objects > Overlay Nodes.
MapInfo Professional adds nodes, if appropriate, to the target object(s).
When you choose Overlay Nodes, MapInfo Professional adds nodes to the current target objects.
MapInfo Professional calculates all points where the target objects intersect the currently selected
objects; MapInfo Professional then adds nodes to the target objects at the points of intersection
unless the target objects already have nodes at those locations. If the target objects do not intersect
the selected objects, MapInfo Professional does not add any nodes.
MapInfo Professional 10.5
159
User Guide
Chapter 7: Drawing and Editing Objects
Drawing Objects
If you use Overlay Nodes to add nodes to a line, MapInfo Professional converts the line to a
polyline. If you use Overlay Nodes to add nodes to an ellipse, rectangle or rounded rectangle
object, MapInfo Professional converts the object to a region. Overlay Nodes does not affect text or
point objects, and you may not use point or text objects to add nodes to other objects.
Drawing Objects
Drawing objects in MapInfo Professional is easy. Once you have made the layer editable, choose
the appropriate tool. Using the shape tools, you can draw arcs, ellipses, circles, lines, rectangles,
and rounded rectangles on your map. You can either draw the object directly on the Cosmetic Layer
(and save it to another or new layer later) or make a map layer editable and draw the objects there.
Once you have drawn the object, you can move the object, delete it, copy it to the Clipboard, or
paste it to another Map window.
Also, you can delete the last node of the object by pressing the Backspace key. If there is only one
node left in the object, it will not be deleted.
Specifying an Object's Geographic Attributes
If the selected object is editable (resides in an editable layer) then you can specify attributes for the
object by accessing that Objects Attributes dialog box.
L
If the object is not editable then you can only access a read-only dialog box.
To specify an object's geographical attributes:
1. Make the layer containing the map object editable. Choose Map > Layer Control and click the
Editable
icon to make the layer editable.
2. Select the map object.
3. Do one of the following:
• Choose Edit > Get Info.
• Double-click the map object with the Select tool.
The Object Attributes dialog box displays.
4. Type in attributes as appropriate.
5. Click OK.
Use the Help search option to locate information for a specific map object (for example, Arcs, Points,
Polygons etc.).
MapInfo Professional 10.5
160
User Guide
Chapter 7: Drawing and Editing Objects
Drawing Objects
Reverting to a Previous Version
Use Revert Table in the File menu to access a previous version of a table when you have made
changes that you do not want to make permanent and haven't saved yet. Revert Table replaces the
selected table currently in memory with the last version saved.
To revert to a previous version:
1. Choose File > Revert Table to display the Revert Table dialog box. Here you can choose the
table to revert to (that is, return to its previous state).
2. Once you have chosen a table to revert, MapInfo Professional prompts you on whether you wish
to discard the changes you have made in the table.
3. Click Discard. MapInfo Professional discards the changes you have made to the table.
However, if you have second thoughts, click Cancel.
•
For instructions on drawing specific objects such as lines, polylines, squares, etc., see Drawing
Objects in the Help System.
Using the Ruler Window as You Draw
The Ruler window will show the distance of line segments as you draw, as well as the cumulative
distance of the drawn object. If necessary, a rubber-banding line displays to show what points are
being used to compute the distance. The Ruler window also displays what type of calculation is used
to compute the distance: Spherical or Cartesian. The type of calculation depends on the projection
of the map.
The following drawing tools will display a rubber-banding line:
•
•
•
•
Arc
Ellipse
Rectangle
Rounded Rectangle
You can also use the Ruler window with the Marquee Select and Radius Select tools. Just click the
Ruler tool to display the Ruler window.
If the Ruler window is not active, the drawing and selection tools noted above do not display
distance. The rubber-banding line does not display.
•
For more instructions, see the Measuring the Distance between Two Points topic in the Help
System.
Object Styles
MapInfo Professional draws objects using the default color, fill pattern, line type, symbol, and text
settings for the layer you are drawing on. The default style can be set in the Styles Preferences
dialog box.
To change the style of an existing object:
1. Choose Map > Layer Control and click the Editable
MapInfo Professional 10.5
161
icon to make the layer editable.
User Guide
Chapter 7: Drawing and Editing Objects
Drawing Polygons and Polylines
2. Select the object and choose the appropriate style command from the Options menu.
The style commands are also available on the Drawing Toolbar. These commands also set the
styles for any subsequent objects to be drawn on the layer.
3. Save your changes.
For closed shapes such as circles and squares, you can change the fill pattern and color, the style
and color of the border, and the line width of the border. For arcs and lines, you can change the type
of line, its color, and the width of the line. In addition, you can use interleaved line styles to create the
appearance of intersections for overlapping intersections and lines within a single layer. Interleaved
line styles are available for use with lines of the same style and color (they can be different widths).
Interleaved line styles are not available for solid lines or borders.
Any edits to an object’s default settings will be applied during the entire work session until you make
new changes. To save the settings, you must save the table where the object resides.
You can also change the display of an object in Layer Control. In the Layer Control window, select
the layer and then click the Layer Properties button. In the Layer Properties dialog box, under the
Layer Display tab, check the Style Override check box. Click the Style button to bring up the
appropriate style dialog box.
L
•
The settings you specify are temporary unless you save the table to a workspace.
For more information, see Using Interleaved Line Styles in the Help System.
Printing Fill Patterns
When it comes to printing objects, some fill patterns print faster than others. In general, the fill
patterns on the top row of the pattern list in the Pattern drop-down list print the fastest. The
difference in printing speed varies from printer to printer. The fill patterns on the top row are also the
ones most likely to plot correctly on pen plotters, although results depend on which plotter driver you
use. For more coaching on printing fill patterns, review the MapInfo Professional Printer Guide,
which is located in the Documentation subfolder of your installation directory. To review the list of fill
patterns available in the MapInfo Professional product, see Fill Patterns Used in MapInfo
Professional in the MapInfo Professional Help System.
Drawing Polygons and Polylines
Drawing polygons is different than drawing other shapes because you are creating a region on
which you can perform other editing and analysis.
For instance, you want to create school districts for your map. You have a street map of your town to
guide you in defining the school district boundaries.
To create a polygon:
1. Choose the Polygon tool. The tool becomes a cross hair.
2. Click a starting point for the polygon.
MapInfo Professional 10.5
162
User Guide
Chapter 7: Drawing and Editing Objects
Drawing Polygons and Polylines
3. Continue to click to add segments to the polygon.
4. When you are ready to complete the object, double-click the last end point.
You can delete the last node by pressing the Backspace key.
L
If there is only one node left in the object it will not be deleted.
You can then use the Combine command to combine this region with another, reshape the region,
etc.
Polylines are made up of multiple line segments that are treated as one object. Unlike lines created
with the Line tool, you can smooth polylines into a continuous curve using the Smooth command.
Again, you can delete the last node by pressing the Backspace key.
L
If there is only one node left in the object it will not be deleted.
Drawing Orthogonal Polygons
You can draw orthogonal (right angle) polygon line segments when you press the Ctrl key. Using
this key you can draw the polygon at 45 degree increments relative to the slope of the last line
segment. This functionality works for Add Line, Add Polyline, the Ruler Tool, Custom Polyline and
Custom Polygon tools, and the Add Polygon operations.
This functionality is useful when you want to draw perpendicular lines at an angle rather than
horizontal to the map.
L
Snap and Autotrace functionality must be turned off to use this feature, because when these
features are activated, the Ctrl and Shift keys have other purposes. The Shift and Ctrl keys
also do not operate when you are using the Polygon Select tool.
To see this functionality:
1. From the File menu, click Open and select a map to display.
2. Choose Map > Layer Control and click the Editable
3. Select the Polygon
L
icon to make the layer editable.
tool from the Drawing toolbar.
This works with any of the Line, Polyline, the Ruler Tool, Custom Polyline and Custom
Polygon tools as well, we are just using the Polygon tool as an example.
4. Click and draw a single line in any direction other than horizontal following these directions:
•
•
To draw the next segment perpendicular to the last segment, press Ctrl while dragging the
cursor.
To draw the next segment perpendicular to horizontal, press Shift while dragging the cursor.
MapInfo Professional 10.5
163
User Guide
Chapter 7: Drawing and Editing Objects
Drawing Polygons and Polylines
Tracing Polylines and Polygons
When you are drawing a new polyline or polygon, you can use Autotrace to trace nodes from
existing polylines or polygons. The Autotrace tool is only in effect when you are using a
polygeometric tool (Add Polyline, Add Polygon, or Select Polygon) and Snap is on.
To trace the nodes of an existing polyline or polygon:
1. Press the S key to activate Snap Mode.
2. Press the T key to activate Autotrace.
3. Click on the first node of the polyline/polygon you want to trace.
4. Move the mouse to another node of the same object. Follow the procedure below for the type of
object you are tracing:
•
•
Polyline: Hold down the Shift key or the Ctrl key and click.
Polygon: Hold down the Shift key for the shorter set of nodes or the Ctrl key for the longer
set of nodes and click.
Pressing the Shift or Ctrl keys highlights the trace path. Click to automatically trace the
segments between the nodes and add them to the polyline/polygon you are drawing.
5. Continue until you have traced the entire polygon/polyline and right-click to end.
L
Autotrace only one object at a time; clicking nodes in different objects will produce a straight
line between the two nodes.
Converting a Polyline to a Region
To convert a polyline into a region:
1. Make the Map window active.
2. Choose Map > Layer Control and click the Editable
icon to make the layer editable.
3. Select the polylines you want to convert to a region.
4. On the Objects menu, click Enclose. The Create Region Objects From Enclosed Areas dialog
box displays.
5. Click OK to convert the polyline you selected to a region.
You can also convert regions to polylines. For these instructions, see Converting Regions to
Polylines on page 181.
Splitting Polylines at Nodes
A single-section polyline can be split into two polylines at a selected node.
To split a single-section polyline:
1. From an editable layer, select a single-section polyline
2. Click the Reshape button from the Drawing tools.
MapInfo Professional 10.5
164
User Guide
Chapter 7: Drawing and Editing Objects
Drawing Symbols
3. Select one node (other than the first or last node).
4. Select the Objects menu, then Polyline Split at Node
5. If a layer is not a cosmetic layer or if the polyline is in the Layout window, the Data
Disaggregation dialog box will appear. Here the user can specify how data is disaggregated.
6. After selecting the data disaggregation method, click OK. The selected polyline will be split at the
node into two polylines.
Error messages display under the following conditions:
•
•
•
•
•
You did not select a node of the polyline.
You selected a beginning or ending node of the polyline.
You selected more than one node of the polyline.
The object that you selected is not a polyline object.
You attempted to split a multi-segmented polyline (only single-section polylines can be split).
Converting Objects into Polyline Objects
If a region contains lakes or islands, and you convert that region to a polyline, the polyline has
multiple sections. Each lake or island comprises one section of the polyline. When you convert a
circle or ellipse into a polyline, the polyline contains 102 nodes. When you convert an arc into an
ellipse, the number of nodes depends on the starting and ending angle of the arc. If the arc spans
180 degrees (for example, the starting angle is zero and the ending angle is 180), a polyline based
on the arc will contain 52 nodes; if the arc spans 90 degrees, a polyline based on the arc will contain
26 nodes; etc.
The Help System contains these related topics:
•
•
•
Displaying Distance while Drawing Objects
Displaying Distance, Length, Perimeter, and Area Calculations
Specifying Distance, Length, Perimeter, and Area Calculations for a Particular Map
Drawing Symbols
Symbols on your maps make your map more expressive and easier to understand. This section
explains how to change a style currently used by MapInfo Professional and create your own custom
symbols. We also discuss in detail the rules governing symbols.
To draw symbols, make the layer you want to draw the symbols to editable and choose the Symbol
tool. Place the cursor where you want the symbol to be and click. The symbol displays using the
default symbol style settings.
The Help System contains these related topics:
•
•
•
Adding Point Symbols to your Map
Specifying Symbol Styles of Point Objects
Changing the Location of Point Symbols
MapInfo Professional 10.5
165
User Guide
Chapter 7: Drawing and Editing Objects
Drawing Symbols
Changing a Symbol Style on a Map
To change a symbol’s style on a map:
1. Select the symbol with an appropriate selection tool.
2. Do one of the following:
•
•
Click the Symbol Style button
On the Options menu, click Symbol Style
Using either method, the Symbol Style dialog box displays.
L
The options in the Symbol Style dialog box may be different depending upon the size and
complexity of the image.
Here you can change the symbol, font, color, and size, as well as create background effects and
bold face for symbols.
Select the Display at Actual Size check box to see the symbol you selected at the size it was
originally created.
Click the Reload button to refresh the list of custom symbols stored in the Application Data
CUSTSYMB directory. Select this button if you added a new custom symbol and do not see the
symbol(s) in the list.
Click the Full View button to display the entire view of custom symbols in a separate window.
This button displays only when you select the Custom Symbols font type. You use this button
when the preview is too large to display completely in the sample area.
3. Make the desired changes, and click OK.
The symbol displays with the style changes you specified. These settings also apply to any
subsequent symbols you draw until you change the settings.
MapInfo Professional 10.5
166
User Guide
Chapter 7: Drawing and Editing Objects
Drawing Symbols
Supported Fonts for Symbols
You have many options when drawing symbols. We support a number of TrueType fonts that carry
their own symbol sets. We have also organized a number of symbol fonts around different
industries, such as real estate and transportation, making it easy for you to find the symbols you
need. MapInfo Professional supports the following fonts:
•
•
•
•
•
•
•
•
•
•
•
MapInfo Cartographic
MapInfo Transportation
MapInfo Real Estate
MapInfo Miscellaneous
MapInfo 3.0 Compatible Symbols (vector symbols, available as a True Type font in MapInfo
Professional): the 36 shapes from the MapInfo symbol set
MapInfo Oil & Gas
MapInfo Weather
MapInfo Arrows
Installed font symbols: symbols available from the installed fonts that offer a symbol set
ERS Fonts (For more about these fonts, see Homeland Security Symbols in the Help
System.)
Custom symbols: from here you can access user-created bitmap symbols which you have
saved to the CUSTSYMB directory. This directory is created during MapInfo Professional
installation. See Working with Custom Symbols on page 167 for more about this process.
The MapInfo Symbols font is a TrueType font. When you use these symbols, the Background and
Effects options in the Symbol Style dialog box are unavailable.
Working with Custom Symbols
You can create and use your own custom bitmaps as symbols in MapInfo Professional. To access
these custom symbols, place them in the CUSTSYMB directory and select them from the Custom
Symbols option in the Font list of the Symbol Style dialog box (Options > Symbol Style). All of the
custom symbols in MapInfo Professional are stored in the CUSTSYMB directory. If you cannot find
this directory, there are a couple of places you could check. The location of this file depends largely
on the administration of your computer, the version of MapInfo Professional you use, and the
location of your installation directory.
Usually, this directory is located in Program Files\MapInfo\Professional\ (or one of its subdirectories)
or in \Documents and Settings\user’s login directory\Applications Data\MapInfo\MapInfo\version
number\. If you cannot find this directory, click Start and Search and search for \CUSTSYMB on
your system.
L
If you add custom symbols while you are working in MapInfo Professional, open the Symbol
Style dialog box and click the Reload button to ensure that the new symbol(s) you have
added display. Otherwise, you have to exit MapInfo Professional and re-enter it to get the
new symbols to display in the Custom Symbols list.
MapInfo Professional 10.5
167
User Guide
Chapter 7: Drawing and Editing Objects
Drawing Symbols
When you change the style of a custom symbol, the Effects options in the Symbol Style dialog box
change. You can either show a background or apply a color.
•
•
•
Show Background displays the custom symbol with the background color with which it was
created.
Apply Color replaces all non-white pixels with a color you choose from the color palette.
Display at Actual Size shows the symbol at its actual size.
When you are creating extended custom symbols we recommend you check the Show
Background check box if you do not require transparency. This setting improves performance
significantly during exporting and Drag and Drop operations.
MapInfo Professional ships with custom symbols that you can use to enhance your maps.
The Help System contains the following related topics:
•
•
•
Understanding the Custom Symbol Types
Understanding the Custom Symbol Sizes, Shape, and Color Rules
Adding User-Defined Custom Symbols
Creating a Custom Symbol
To create a custom symbol:
1. Create your own custom symbol and save it as a bitmap.
2. Place the bitmap in the directory you have assigned for symbols.
3. Restart MapInfo Professional if it is running.
4. Open your map and make the map layer where you want to place the symbol editable. Choose
Map > Layer Control and click the Editable
icon to make the layer editable.
5. Choose Options > Symbol Style to display the Symbol Style dialog box.
6. Click the Font drop-down menu and choose Custom Symbols.
7. You must click the Reload button to view the newly added custom symbol.
8. Select your custom symbol and choose OK.
9. Click on the map using the Symbol tool to display your custom symbol.
L
The bitmap file has to be 256 color and under 128k in size. Bitmaps should also be the same
dimension in x and y.
For more information, see Finding the Custom Symbol Directory in the Help System.
MapInfo Professional 10.5
168
User Guide
Chapter 7: Drawing and Editing Objects
Working with Text on the Map
Displaying Overlapping Symbols
When point objects display at the same coordinate, you can miss the significance of their proximity
because the data overlaps each other, preventing you from making the connection.
The Dispersed Groups symbol font gives you a way to display symbols that represent different
organizations, events, or services that occupy the same coordinate location without overlapping
each other. When you zoom out from the coordinate point, these symbols display around the
coordinate point side by side. This font is installed when you install MapInfo Professional.
This symbol style is useful in several industries:
•
•
•
Crime mapping: See multiple incidents at the same address and for traffic incident analysis
Insurance: See multiple policy holders, policies, claims, or inspection requirements at the
same address
• Wireless telecom: See multiple assets on the same mast/tower
• Health care: See multiple incidents at the same address
• Retail: See multiple attributes of a retail store, for example what internal franchised
departments it contains or specific services that it offers.
For specific instructions, see Displaying Overlapping Symbols in the Help System.
Working with Text on the Map
Although the labeling feature takes care of most of your text needs, you will still need to create text
objects with the Text tool to annotate your map or layout (for example, map titles and subtitles).
Unlike labels, text objects have no connection to data.
To create text, make sure the layer you want to draw the text to is editable and choose the Text tool.
The cursor changes to an I-beam. Place the cursor where you want the text to be and type in the text
you want.
To enter text onto a map:
1. Click the Text
button in the Drawing toolbar. The cursor turns into an I-beam when moved
over the active window.
2. Click the cursor at the place on the map, layout, or data displayed in the Browser window where
you want to enter the text. A blinking cursor appears. In a Browser, press Tab to move to the
next cell.
3. Type the desired text. The text will appear at the blinking cursor as you type.
4. When you want to move to a new line of text press Enter.
5. When you are finished entering text, press Esc or click the Select
and click the mouse somewhere else on the Map or Layout.
L
button in the Main toolbar
The font used is the current font, as indicated in Options > Text Style.
MapInfo Professional 10.5
169
User Guide
Chapter 7: Drawing and Editing Objects
Editing Objects
To change the style of the text:
1. Select the text with the Select tool.
2. Do one of the following:
• Click the Text Style
button in the Drawing toolbar
• Choose Options > Text Style
Using either method, the Text Style dialog box displays where you can change the font, the size,
color and create various effects such as haloing or drop shadows.
These settings will remain in effect for any text you subsequently draw on the map until you
change them.
3. To save changes, on the File menu, click Save. To save objects drawn to the Cosmetic Layer,
on the Map menu, click Save Cosmetic Objects.
Editing Objects
1. In all likelihood, you will need to change or edit some of the objects you have drawn or mapped.
To begin this process, you need to make the layer that you want to change editable (on the Map
menu, click Layer Control, and then click the Editable icon for the layer).
To edit an object:
1. Select the object with the Select tool.
If the object is a line, edit handles appear at either endpoint.
If the object is a boundary or region, edit handles appear at the outer corners of the object.
2. Drag the object to a new position or change its line style, fill pattern, or symbol.
3. On the File menu, click Save to save your changes.
To delete an object:
1. Click the object with the Select tool.
2. Do one of the following:
• On the Edit menu, click Clear or on the Edit menu, click Cut.
• Press the Delete key.
Using either method, MapInfo Professional deletes the object. To view an object’s nodes,
centroids, and line direction when editing and drawing, set the conditions in the (Layer Control)
Layer Properties dialog box.
MapInfo Professional 10.5
170
User Guide
Chapter 7: Drawing and Editing Objects
Editing Objects
Positioning and Sizing your Map Objects
To move an object to a new location, make the object’s layer editable and click the object to select it.
Hold down the mouse button for at least one second until the cursor turns into a four-headed arrow.
Drag the object to its new location and release the button. The object maintains its shape.
To move an object (in an editable layer) one pixel at a time, click it and press and hold the Ctrl key
and press the Arrow button corresponding to the direction you want the object to move. To move
the object 10 pixels at a time, press and hold the Ctrl and Shift keys and press the Arrow button
corresponding to the direction you want the object to move.
Also, if you click the on the fifth edit handle (rotate handle) and hold down the mouse button, you can
rotate the highlighted box to the desired angle. A rubber banding box is drawn representing the
bounds of the rotated object. If you press and hold Shift key while the rubber banding box is being
drawn, the rotation will be limited to 45 degree increments.
Moving Objects on the Map
You can move selected objects within its editable map layer easily.
To move an object on the map:
1. Click your map to make it active.
2. Make the layer where the object is located editable. Choose Map > Layer Control and click the
Editable
icon to make the layer editable.
3. Select the object(s) using the Select tool.
If you select more than one object at a time to move, the objects move in the same way. Take
care to ensure that you do not move an object off the map or off land by mistake.
L
When you move the objects, you move them all at once, maintaining their positions
relative to one another.
4. Do one or all of the following:
•
•
•
To move the selected object(s) using the mouse, hold down the mouse button and drag the
object to its new location
To move the selected object(s) one screen pixel at a time, press and hold the Ctrl key and
press the Arrow key in the direction you want the object(s) to move
To move the selected object(s) 10 screen pixels at a time, press and hold the Ctrl and Shift
keys and press the Arrow key in the direction you want the object(s) to move
L
Since the moves are made in screen pixels, the zoom level affects how far the object is
moved.
Offsetting Objects on the Map
The Offset feature makes a copy of the object(s) you select from the original source object(s) and
saves them in the original data file.
MapInfo Professional 10.5
171
User Guide
Chapter 7: Drawing and Editing Objects
Editing Objects
You can both move and offset the objects you select using this process. The difference between
these two operations is whether MapInfo Professional makes a copy of the data (as in the case of
copy) or simply moves the objects and stores the new value in the original table.
To move/offset selected objects on the map:
1. Click your map to make it active.
2. Make sure a layer is editable. Choose Map > Layer Control and click the Editable
make the layer editable.
icon to
The offset/move functionality is available when any layer is editable, not just when the objects
you want to move or offset are in the editable layer. However, you can only move an object
within its editable layer. Copy is always permitted as long as a layer is editable.
3. Select the object(s) using the Select tool.
4. On the Objects menu, click Offset to display the Offset Objects dialog box.
5. To move your selected objects, enter or select from the following options and click OK to apply
the changes. To copy your selected objects to offset them, enter or select from the following
options and click Next. Then go to step 6.
•
Angle — To offset your selected object at an angle, type the angle (in degrees) in this field.
The new object is created based on the original object and is offset in the direction of the
MapInfo Professional 10.5
172
User Guide
Chapter 7: Drawing and Editing Objects
Editing Objects
•
angle you specified, measured from the positive X-axis. If you enter a positive angle, the
object is offset counterclockwise; if you enter a negative angle, the object is offset clockwise.
Distance/Units — To set the offset distance and units, type the distance and select the units
in the Distance box. The list of units is as follows: inches, links, feet, U.S. Survey feet, yards,
rods, chains, miles, nautical miles, millimeters, centimeters, meters, and kilometers.
L
•
•
•
MapInfo Professional takes the default units from the map window in which you've
selected the object.
Create Copy — Click this option to create a copy of the selected object(s) in the data. When
you complete this process, MapInfo Professional saves the copy to the editable layer.
Move Objects — Click this option to move the object without creating a copy in the data. You
can only move an object within its own editable layer. When you move objects, the Data
Aggregation dialog box does not display, since you are only moving the data within the layer.
Copy or Move Distance Using — The option you select in this box depends largely upon
the projection of your source map. If your map has a latitude/longitude projection, MapInfo
Professional enables the Spherical type only. If you are working with a non-Earth projection,
MapInfo Professional enables the Cartesian type only.
When you click Spherical, MapInfo Professional calculates the copy/move distance by
mapping the data into a Latitude/Longitude On Earth projection.
When you click Cartesian, MapInfo Professional calculates the copy/move distance by
considering the data to be projected to a flat surface and distances are measured using
Cartesian distance calculations.
6. The Data Aggregation dialog box displays if one of these conditions are true:
•
•
•
You clicked the Create Copy option
You selected objects in a different table from the table associated with the editable layer
The editable layer is not the cosmetic layer and has no text associated with the geographical
objects in it
You may notice that the only controls available to you in this dialog box are Blank, Value, and
No Data.
Type a value you will remember in the Value field of this dialog box. For more information about
data aggregation, see Aggregating and Disaggregating Data on page 280.
7. Click OK to copy the data and offset the objects you selected.
Rotating Objects on the Map
To rotate an object or objects by a specific angle, use the Rotate Objects tool, which is available
whenever you have selected an object(s) in an editable layer in a Map or Layout window.
To rotate an object or objects in a Map or Layout window:
1. On your editable layer, select the object(s) you want to rotate.
2. On the Objects menu, click Rotate to display the Rotate Objects dialog box.
MapInfo Professional 10.5
173
User Guide
Chapter 7: Drawing and Editing Objects
Editing Objects
1
3. In this dialog box, you specify the angle and the anchor point of the rotation. Type the rotation
angle in the Rotation field.
L
The rotation angle can be positive (counter clockwise) or negative (clockwise).
4. Determine the anchor point by doing one of the following:
•
Accept the default anchor point of the selected object(s) by leaving the X and Y coordinates
that display in these field as they are
L
•
•
The default anchor point varies depending upon how many objects you have selected
and the kind of objects they are. See Understanding an Object’s Default Anchor Point
on page 175 for more about default anchor points.
Type new entries in the X and Y coordinate fields to select a new anchor point
Click the Pick from Map button and click the anchor point you want on the Map or Layout
window. Click the mouse button only once to establish this point.
L
When the Pick from Map button is disabled, you can select locations directly from the
open map. If a map is not open, you can select another tool (like the Select tool) and use
that tool instead of the Pick from Map functionality.
To return to the default anchor point, click the Reset Anchor button.
5. Decide whether or not you want to lock the anchor point. Click the Lock Anchor Point Position
check box to lock the anchor point.
When you lock the anchor point, you ensure that the anchor point will not be recalculated when
you return to the Map or Layout window. If you do not lock the anchor point, MapInfo
Professional recalculates the anchor point based on the rotated selection. Once the objects are
rotated, they may have a different anchor point.
L
You cannot maintain an anchor point lock when you change the selection from the Map
window to the Layout window or from the Layout to the Map window.
6. When you have completed these entries or selections, click OK to rotate your object(s).
MapInfo Professional 10.5
174
User Guide
Chapter 7: Drawing and Editing Objects
Editing Objects
Understanding an Object’s Default Anchor Point
When rotating objects in an editable layer, the default anchor varies depending upon how many
objects you are rotating and the kind of objects you select. If you select:
•
•
•
A single object (not a polyline), the default anchor point is the object's centroid
A single polyline or several objects, the default anchor point is the center of the polyline’s or the
selected objects minimum bounding rectangle (MBR)
Multiple objects, the default anchor point is the center of the MBR of the selected objects
Changing your Map Object Attributes
When you double-click a region, line, point or text object with the Select tool, MapInfo Professional
displays an Object Attribute dialog box. This dialog box gives you the object’s size, its position, and
other information specific to the object.
For example, if you double-click a region, MapInfo Professional displays the perimeter, centroid, and
area. It also shows the type of distance calculation that was used to obtain these values.
If the layer is Selectable but not editable, you can only view these attributes. If the layer is also
editable, then you can change these attributes by typing new values into the text boxes of the dialog
box. The illustration above shows the Object Attribute dialog box for a region object in an editable
layer. You can also access this dialog box on the Edit menu (click Get Info).
Changing an object’s size and position with the Object Attribute dialog box gives you much greater
control over its exact size and position than you have through drawing it on the screen. For example,
you have a list of ten radio towers and their X and Y coordinates. You could geocode these points
using the Create Points command. However, if you bring up the Points Object Attribute dialog box
and type the new X and Y coordinates, you can create ten points with the Symbol tool and then
individually place them in the correct location.
You can also use the Text Object Attribute dialog box to change the point’s actual text. For example,
you have typed the title “World Population” on a Map window. You want to fix your typographical
error. Bring up the Object Attribute dialog box for the text object. You can correct your error in the
box that displays the text.
•
For more information, see Changing Attributes for Multiple Layers in the Help System.
MapInfo Professional 10.5
175
User Guide
Chapter 7: Drawing and Editing Objects
Editing Objects
Reshaping Map Objects
You can reshape regions, polylines, lines, arcs and points. A region is an object created with the
Polygon tool. You cannot reshape objects created with the Rectangle tool, the Rounded Rectangle
tool, or the Ellipse tool.
To reshape an object:
1. Select an object with the Select tool.
2. Do one of the following:
• On the Edit menu, click Reshape
• Use the Reshape button on the Drawing toolbar.
You are now in Reshape mode. MapInfo Professional draws nodes at every juncture where two
polyline or polygon line segments meet.
3. To reshape the object, move the nodes, add nodes, or delete nodes from the object.
To move a node, click it and, while holding down the mouse button, drag the node to the desired
location. The line segments connected to the node are moved to a new position.
To add a node, click the Add Node tool from the Drawing Toolbar, position the cursor where you
want to add the node, and click the mouse button. MapInfo Professional adds a node. You can
move this node or delete it, just as you would any node.
To delete a node, position the cursor over the node, click it, and press the Delete key. To delete
the last node when creating a polyline or polygon, click the Backspace key.
The Reshape command is very useful when you are creating sales territories or other merged
boundaries. For example, you are merging postal code boundaries together to create school
districts. Some postal code boundaries fall into more than one school district. Use the Reshape
command to reshape the school district to incorporate a section of a postal code boundary.
Selecting Multiple Nodes
Reshape mode allows you to easily select nodes of an existing object and copy and paste them,
drag them to reshape the object, delete them, etc. To trace an existing object, we recommend that
you use the autotrace feature, which is explained in the next section, Snap to Nodes. The following
illustrations show how to copy the border between Kentucky and Indiana.
1
2
1 Select the object. Click Reshape mode to display the nodes. 2 Select the nodes you
want to copy.
MapInfo Professional 10.5
176
User Guide
Chapter 7: Drawing and Editing Objects
Editing Objects
3
4
3 Choose Copy and Paste to display the new objects with edit handles.
4 Click and drag the object to move to another location.
To reshape an object (such as the state of Kentucky):
1. Select Kentucky to enable Reshape mode.
2. Select the first node with the Select tool. Shift-click the last node to be copied. MapInfo
Professional selects all nodes between following the shortest route. (To select all nodes except
those between the shortest distance, use Ctrl-click with the Select tool.)
3. On the Edit menu, click Copy to copy the nodes to the clipboard.
4. Paste the duplicate nodes onto the map. On the File menu, click Paste. The object you copied is
drawn on top of the original object as a polyline.
5. To move the polyline click it and drag the polyline to a new location.
Using “Snap To” to Select Nodes and Centroids
You can use nodes to reshape an object and align objects with each another. MapInfo Professional
refers to this process as snapping to a node. In the Map window, regions, polylines, lines, arcs and
rectangles all have nodes that can be attached (or snapped) to each other. When the Snap mode is
enabled, MapInfo Professional searches for nodes and centroids as you move around a window.
MapInfo Professional automatically snaps the cursor to a node or centroid when the cursor comes
within the snap tolerance of the node. The crosshairs display when the node is “snapped to”.
L
You can also use the snap to capability to snap to visible centroids in region objects.
To toggle Snap to Nodes, press the S key. The Status Bar displays with the word “SNAP” when
Snap mode is activated. When you activate the Snap mode, a circle displays around your cursor
showing the size of the tolerance of the Snap mode in pixels. The S key acts like a toggle on/off
switch. You can set the snap tolerance in pixels in the Map Window Preferences dialog box. The
Snap Tolerance field allows you to specify a tolerance. If you set the snap tolerance to 3 pixels,
whenever you move the cursor within 3 pixels of a node, the cursor will snap to the node.
Snap mode works in the Map Window and Layout window (but not raster layers). It works with all
MapInfo Professional tools in the Main and Drawing toolbars except Pan, Drag Map, and Text tool.
Additionally, snap mode works on object types, including regions, points, multipoints, collection
objects, lines and polylines, rectangles, and arcs. It is not available for text objects, ellipses, and
rounded rectangles. You set the Snap in one window at a time and can save it with your workspace.
MapInfo Professional 10.5
177
User Guide
Chapter 7: Drawing and Editing Objects
Editing Objects
Snap to Nodes applies to all selectable layers—this is useful if you are drawing an object in one
layer and want to attach it to an object in another layer. If you do not want to snap to objects in
certain layers, make those layers unselectable.
Snap and Thin Settings Saved in Metadata
The Snap and Thin settings remove self-intersections and overlaps in your data based on values
you establish. When you complete your selections and entries in the Set Values for Node Snap &
Thinning dialog box, MapInfo Professional saves these values to the table’s metadata. This allows
the Snap and Thin changes to be retrieved after the table is saved or you have left MapInfo
Professional.
Setting Snap Preferences for a Visible Snap Area
The Map Window Preferences dialog box has a Display Snap Radius check box that controls
whether or not the snap radius displays when Snap mode is on. The snap tolerance (in pixels) can
also be selected.
•
From the Options menu, select Preferences, then Map Window to display the Map
Preferences dialog box.
On the Editing tab, under the Digitizing Options section, you can change the snap tolerance to make
the snap radius larger or smaller (measured in pixels).
If you clear Display Snap Radius check box, then the radius does not display when snap mode is
turned on. Remember to click OK to save your preferences.
MapInfo Professional 10.5
178
User Guide
Chapter 7: Drawing and Editing Objects
Editing Objects
Move Duplicate Nodes
In most maps, nodes of various objects are usually connected, especially for adjoining streets and
boundaries that share a common border. Using the Move Duplicate Nodes Option under Map
Window Preferences, you can specify where MapInfo Professional looks for connected nodes in
order to move them in unison. Choose the None of the Layers button to turn the option off. Choose
the Same Layer button so that connected nodes in the same layer are moved when one of them is
moved.
Autotracing Objects
You can trace the nodes of an object, for example, the Yucatan in Mexico using the Polyline or
Polygon tools. This makes it easier to digitize objects that share a border because you don't have to
re-digitize the shared border. You can also use this feature to trace an existing polygon/polyline
network, for example, a street, a county, or some other polyline or boundary. A Status Bar entry
displays showing that this mode is enabled.
To trace a border:
1. Open a Map layer you want to trace a polygon or polyline on.
2. Make the layer editable.
3. Press the S key to turn on the Snap process and the T key to turn on the Autotrace functionality.
4. Select the Polygon
you want to trace.
or Polyline
tool from the Drawing toolbar and select the first node
5. Drag the mouse along the nodes of the line or object you want to trace.
The rules that apply to AutoTrace are:
•
•
To enable the AutoTrace mode, you must use the Polygon
or Polyline
You must press S to enable the Snap feature to use the AutoTrace feature
MapInfo Professional 10.5
179
tool
User Guide
Chapter 7: Drawing and Editing Objects
Editing Objects
You can use the Shift/Ctrl key functionality for this mode. When you AutoTrace a polygon, the path
contains the least number of nodes necessary to complete the AutoTrace, which is similar to the
Shift key behavior. If you want to trace the longer path, press the Ctrl key to override default
AutoTrace direction. When you are autotracing a closed polyline, the trace line never crosses the
start and end points of the polyline (so the Ctrl key has no effect).
AutoTrace entry in Status Bar.
Smoothing and Unsmoothing Lines
You can use the Smooth command to convert polyline angles into polyline curves.
To smooth a polyline angle into a polyline curve:
•
•
Click a polyline with the Select tool and on the Objects menu, click Smooth. MapInfo
Professional smoothes the line so that it appears to be one continuous line with curves
instead of angles.
To undo the process choose either the Undo Smooth command or on the Objects menu,
click Unsmooth.
Both the Smooth and Unsmooth commands can be used only on polylines. A polyline is a line drawn
with the Polyline tool. Smooth and Unsmooth do not work with objects drawn with the Line tool. If
you attempt to smooth or unsmooth any object besides a polyline, MapInfo Professional displays a
warning message.
MapInfo Professional 10.5
180
User Guide
Chapter 7: Drawing and Editing Objects
Editing Objects
Converting Regions to Polylines
You may find it necessary, on occasion, to change an object into a polyline or a polyline into a region
during an editing session. You can do so simply by selecting the object and on the Objects menu,
click Convert to Region or Convert to Polyline.
For instance, you select a group of nodes that you want to copy and paste elsewhere on your map.
MapInfo Professional treats the group as a polyline and copies it to the clipboard. After you paste the
polyline on your map, you can convert it to a region on the Objects menu, click Convert to Region.
If you want to create a buffer zone within one mile of a boundary, meaning you want a zone that
extends one mile from the boundary to the outside and to the inside, you must first convert the
region to a polyline and then create the buffer. If you first create the buffer on the region, you will
include too much territory in the buffer (the entire region in the buffer plus the one mile buffer that
extends outside of the region).
Converting objects to polylines and regions allows you to perform node-editing operations on objects
that ordinarily do not allow node editing. For example, you cannot add nodes to a rectangle object. If,
however, you first convert the rectangle into a polyline or region, you can then add nodes to the
object.
The Help System contains these related topics:
•
•
•
•
•
Editing Street Maps (StreetPro)
Adding a Segment to an Existing Street
Adding a New Street
Renaming a Street
Editing Street Colors
Merging One Map into Another
There are two ways to merge layers from one Map window to another:
1. You can use the Drag Map Window functionality to drag the layers of an existing Map window
onto the another Map window. To see this method, see Merging Maps using the Drag Map
Window Tool in the Help System.
2. You can copy the map layers you want from one map to the other in the Layer Control window.
To see this method, see Merging Maps from Layer Control in the Help System.
When you merge the layers from the source map on top of the destination map, the destination map
settings take precedence. This means that the clip regions and coordinate systems, for example, are
based on the settings in the destination map. If the destination map does not allow raster
reprojection and the source map has a raster layer, the coordinate system of destination map could
change.
Consider this example of a vector map and a raster map. Many times you want to add detail to a
map by merging it with another open map. You can think of the map you are dragging or copying
layers from as the source map.
MapInfo Professional 10.5
181
User Guide
Chapter 7: Drawing and Editing Objects
Editing Objects
Figure: Alaska Raster Map (Source Map)
You can think of the map that you are dragging or copying the layers to as the destination map.
Figure: Alaska Vector Map (Destination Map)
L
•
MapInfo Professional does not copy the Cosmetic layer objects or thematic layers from a
source map to the new window, so any symbols or features you have created there do not
merge.
For more information, see Merging Maps using the Drag Map Window Tool and Merging Maps
from Layer Control in the Help System.
MapInfo Professional 10.5
182
User Guide
Selecting and Querying
Data
This chapter presents the ins and outs of selecting records from tables. As you
use MapInfo Professional you will find yourself selecting records quite often.
This chapter covers an overview of selecting and querying methods using tools
from the Main toolbar.
Topics in this Section:
Selecting Your Data in MapInfo Professional . . . . . . . . . . . . . . .184
Querying Your Data in MapInfo Professional . . . . . . . . . . . . . . .193
8
Chapter 8: Selecting and Querying Data
Selecting Your Data in MapInfo Professional
Selecting Your Data in MapInfo Professional
While MapInfo Professional allows you to attach data to objects on a map, its true analytical power is
its ability to group and organize data. Once your data is broken down into logical groups, you can
analyze it based on one or more variables.
For example, you have a basket of fruit. You want to organize the fruit into different categories,
based on one or more variables:
•
•
•
Put all the apples into one group
Put all the citrus fruit into one group (oranges, lemons, grapefruit)
Put all the fruit that begins with a vowel into one group (oranges, apples, apricots)
There are many different ways that you could group the fruit. Some fruit would fall into more than
one category (oranges are citrus fruit and also begin with a vowel). You could also use more than
one variable to group your fruit — put all the citrus fruit that begins with a vowel into one group.
MapInfo Professional can retrieve information or even individual records from within your data. We
refer to the record or records that are retrieved this way as selections. A selection is a subset of data
that has been collected based on one or more variables.
For example, you have a table of customer records. You could create a subset of all customers who
live within a 50 mile radius of Prague. Or, you could create a subset of all customers who purchased
over $1000 of merchandise. Or, you could create a subset of all customers whose last name begins
with the letter “B”.
The statements above used to create these subsets are known as queries. A query is just another
word for a question — which of my customers spent more than $1,000? Which of my customers
lives within 50 miles of Prague?
MapInfo Professional 10.5
184
User Guide
Chapter 8: Selecting and Querying Data
Selecting Your Data in MapInfo Professional
As with the fruit example, there are many different ways to group your data. Some data records will
obviously fall into more than one category. You could also use more than one variable to group your
data. Which of my customers lives within 50 miles of Prague and purchased over $1000 of
merchandise? This section gives you some examples and some practical applications of “selecting”
in MapInfo Professional.
Characteristics of Selections
Selections are temporary tables. When you make a selection, MapInfo Professional creates this
temporary table (called a selection) to store the records you’ve selected.
You can perform many of the tasks with a selection table that you can perform with a permanent
(base) table such as:
•
•
•
•
View it in a Browser, a Map window (if it has graphic objects), a Graph or a Layout window.
Cut and copy it into the clipboard and paste it into another table, or even into another application.
(See Setting your Clipboard to Copy Maps in to Word, Excel, or PowerPoint on page 169.)
Use it to edit a table. If you want to edit only certain records in a table, you can get those records
into a selection and then edit that selection.
Make a further selection from it.
To convert selections into permanent tables, on the File menu, click Save Copy As. Once you’ve
saved the temporary selection table as a permanent table, you can treat the new table like any other
table. Selection tables are totally dependent on the table from which they were created. If you close
a base table, all associated selection tables are deleted.
MapInfo Professional 10.5
185
User Guide
Chapter 8: Selecting and Querying Data
Selecting Your Data in MapInfo Professional
Selection Commands and Tool Descriptions
MapInfo Professional gives you a number of commands and tools for making selections. They fall
into two categories:
•
•
Selecting from the screen: Select tool, Radius Select tool, Boundary Select tool, Polygon
Select tool, Marquee Select tool, Invert Selection tool, Select All command. To select records
with the tools, click or encircle the associated graphic objects. To select records from a layer
at the same time, on the Query menu, click Select All. Or, select a layer on the map, rightclick to display the context pop-up menu, and select Select All from Selected Layer.
Selecting with queries: Select, SQL Select. When you select records with either of these
methods, you create a logical expression that MapInfo Professional uses to select the
records. For example, the expression SALES > 20000 means that MapInfo Professional will
select only those records with sales higher than $20,000. We discuss Select and SQL Select
in more detail in Using Select to Create Queries on page 201 and Using SQL Select to
Query Data on page 204).
1. Choose Table > Import to display the Import File dialog box. Choose OS MasterMap (*.GML)
from the Files of type drop-down list and navigate to its location.
2. Select a GML file to import. Click Open. The GML Import dialog box displays.
Selecting from the Screen
To select objects from the screen, the layer that contains the objects must be Selectable. To make a
layer selectable, on the Map menu, click Layer Control. In the Layer Control widow, click the
Selectable
icon to make the layer selectable.
When you select map objects in a Selectable layer, MapInfo Professional highlights the objects
using the settings defined in the Highlight Control section of the Preferences dialog box (Options
menu). When you select map objects in an Editable layer, MapInfo Professional places edit handles
(small squares) around the extents of the object you selected.
If you have more than one Selectable layer in a Map window, MapInfo Professional selects objects
from the topmost Selectable layer.
For example, you have a Selectable layer of county boundaries and a Selectable layer of state
boundaries. If the county boundaries are in the topmost layer in the Map window, MapInfo
Professional selects objects from the county layer. If the state boundaries are in the topmost layer in
the Map window, MapInfo Professional selects objects from the states layer. When you use the
Select tool, MapInfo Professional also displays InfoTips for the topmost Selectable layer. As you
move your cursor over the objects, InfoTips display the object’s label expression. You can turn off
the InfoTips in the Map window Preferences (on the Options menu, point to Preferences and click
Map window).
Likewise, if you perform a boundary search, the boundary object that you want to search should be
in the topmost layer.
MapInfo Professional 10.5
186
User Guide
Chapter 8: Selecting and Querying Data
Selecting Your Data in MapInfo Professional
For example, you have a layer of postal code boundaries and a layer of state boundaries. If you
want to select all objects that fall within a postal code boundary, the postal code layer should be the
topmost boundary layer. If you want to select all objects that fall within a given state, the state layer
should be the topmost boundary layer. You can reorder the layers by selecting the Map menu, and
clicking Layer Control.
You can select objects from tables other than the topmost table, by holding down the Ctrl key when
you are selecting an object. For example, say you have three selectable layers, such as STATES,
COUNTIES, and CITIES. If you want to select objects in the STATES table, but it is the bottom layer
in the Map window, do the following:
1. Hold down the Ctrl key and click the map with the Select tool. You are now in the second layer.
2. Hold down the Ctrl key and click the map again with the Select tool. You are now selecting
objects from the third layer, the STATES layer.
Selecting a Single Object from a Map or Layout
Making selections is a basic MapInfo Professional operation, using the Select tool is only one way of
making selections.
The tool must be active before you can use it; activate the tool by clicking on it. The tool's icon is
highlighted in the Main toolbar and the cursor becomes a pointer. If you are editing records in a
browser, the cursor becomes an I-beam.
To select a single object from a map or layout:
1. Click the Select
button in the Main toolbar.
2. Click the object.
The layer where the object is located has to be selectable in the Map window. When an object is
selected it is highlighted according to the settings you specified in Options > Preferences.
•
•
•
When the layer is editable, the selected object is surrounded by edit handles and is colored and
patterned as it was originally defined.
When you select another object, the first object is unselected.
To select a number of objects from a map or layout, hold the Shift key down and click the
desired objects with the Select tool.
Selecting Tools
MapInfo Professional includes several tools on the Main toolbar to allow you to choose records for
further viewing and analysis, including the Select tool, Radius Select tool, Marquee Select tool,
Polygon Select tool, Boundary Select tool, and Invert Selection tool. Each tool is discussed in the
next section.
Using the Select Tool
Use the Select tool to select objects one at a time or to select all objects that are generally in the
same area of the Map window. You select an object by clicking it using the mouse.
MapInfo Professional 10.5
187
User Guide
Chapter 8: Selecting and Querying Data
Selecting Your Data in MapInfo Professional
To select an object using the Select tool:
1. Make the layer that you want to select objects from selectable. On the Map menu, click Layer
Control and click the Selectable
icon for the layer.
2. Choose the Select button from the Main toolbar.
3. Click an object in the Map window. If that object’s layer is selectable, MapInfo Professional
highlights the object. If the layer is editable, MapInfo Professional puts edit handles around the
extents of the object. If the layer is neither editable nor selectable, MapInfo Professional does not
allow you to select the object.
4. On the Window menu, click New Browser Window to display selected records in a Browser.
Choose Selection from the list of tables. MapInfo Professional creates a Browser of the new
temporary table. To select records from the Browser, simply click each record with the Select
tool.
To select multiple objects individually:
1. Click the first object to select it.
2. Hold down the Shift key and click another object. MapInfo Professional selects that object, too. If
you select a second object without holding down the Shift key, MapInfo Professional unselects
the first object and selects the second object.
•
For additional instructions, see Selecting the Next Selectable Object Beneath the Current Object
in the Help System.
Using the Unselect All Tool
Use the Unselect All to deselect all of the selected objects. You use this most often when you have
selected too many objects and want to start over.
To select an object using the Select tool:
•
Choose the Unselect All button from the Main toolbar.
Deselecting Objects and Removing Objects from the Selection
To deselect an object or remove it from the selection:
•
Hold the Shift key down and then click the object. When you click, the object is removed from
the selection set.
To deselect all objects:
•
•
Choose Query > Unselect All or click someplace on the map where there are no objects.
For additional information, see Moving Selected Objects and Rotating Selected Objects in the
Help System.
MapInfo Professional 10.5
188
User Guide
Chapter 8: Selecting and Querying Data
Selecting Your Data in MapInfo Professional
Using the Radius Select Tool
The Radius Select tool is used to select all objects that fall within a given radius. For example, you
have a table of blood donors and a table of blood donation sites. Using the Radius Select tool, you
could create a temporary list of blood donors that live within a one-half-mile radius of each blood
donation site.
The Radius Select tool selects all objects whose centroid falls within the circle. The object doesn’t
have to be completely bounded by the circle.
To select objects within a radius:
1. Make the layer you want to select objects from selectable. On the Map menu, click Layer
Control and click the Selectable
icon for the layer. Make sure the layer is either at the top of
the list, or that the layers above they layer you want are not selectable.
2. Choose the Radius Select tool from the Main toolbar. The cursor becomes a hand when moved
over the Map window.
3. Click a place on the map that you would like to use as the center point of your radius search. For
example, if you want to select all the homes of all of the children that live within three blocks of
the school, click the school icon and use that as the center point.
4. Hold down the mouse button and drag the mouse away from the center point. MapInfo
Professional draws a circle around the point and reports the radius of the circle in the Status Bar
(lower left corner of the screen).
5. When you have the desired radius release the mouse button. MapInfo Professional highlights all
map objects that fall within that circle.
MapInfo Professional 10.5
189
User Guide
Chapter 8: Selecting and Querying Data
Selecting Your Data in MapInfo Professional
6. To see a list of all the records that fall within that circle, choose New Browser Window from the
Window menu. Choose Selection from the list of tables. MapInfo Professional creates a
Browser of the new selection table.
Using the Marquee Select Tool
The Marquee Select tool is used to select objects within a rectangle. By clicking and dragging using
the Marquee tool, you create a dotted rectangle, or marquee box around objects you want to select.
All Selectable objects in the topmost Selectable layer will be included in the marquee box.
L
To select objects from another layer, you must turn off selectable in Layer Control for the
upper layers. Only objects from one layer at a time are selected.
To select objects within a rectangle:
1. Make the layer that you want to select objects from selectable. On the Map menu, click Layer
Control and click the Selectable
icon for the layer.
2. Choose the Marquee Select tool from the Main toolbar. The cursor becomes a hand when
moved over the Map window.
3. Click a place on the map outside of the area you want to include in the marquee box.
4. Hold down the mouse button and drag the mouse to form a dotted rectangle around the points
you want to select.
5. When you have reached the desired rectangle size, release the mouse button. MapInfo
Professional highlights all map objects that fall within that rectangle.
6. To see a list of all the selected records, on the Window menu, click New Browser Window.
Choose Selection from the list of tables. MapInfo Professional creates a Browser of the new
selection table.
Adding Objects to the Selection Set
Use the Shift key with the Marquee Select tool when you wish to add newly selected objects to the
previous selection.
MapInfo Professional 10.5
190
User Guide
Chapter 8: Selecting and Querying Data
Selecting Your Data in MapInfo Professional
Using the Polygon Select Tool
The Polygon Select tool selects map objects within a polygon that you draw on a map.
To select objects with the Polygon Select tool:
1. Make the layer that you want to select from selectable. On the Map menu, click Layer Control
and click the Selectable
icon for the layer.
2. Choose the Polygon Select tool from the Main toolbar. The cursor becomes a pointing hand
when moved over the Map window.
3. Click the map location at which you want to place the first end point of the polygon. Move the
cursor over your map in any direction. MapInfo Professional draws a line from the point where
you clicked to the cursor.
4. Click to create another endpoint. Continue to move the cursor and click until you have the
desired number of sides to your polygon.
5. To close the polygon, make your last click as close as possible to the first click. MapInfo
Professional closes the polygon and selects the objects that are within it.
L
Press Shift while using the Polygon Select tool to add newly selected objects to the
previous selection.
Using the Boundary Select Tool
If you want to select objects that fall within a given region or boundary, use the Boundary Select tool.
When you use this tool, MapInfo Professional selects all objects within any boundary on the map,
such as state or county boundaries, police precincts, or sales territories.
For example, you have a layer of states and a layer of retailers. Using the Boundary Select tool, you
could click a state and create a temporary list of all the retailers in that state.
To select objects within a region:
1. Make the layer that you want to select objects from selectable. On the Map menu, click Layer
Control and click the Selectable
icon for the layer.
2. Choose the Boundary Select tool from the Main toolbar. The cursor becomes a cross hair when
moved over the Map window.
3. Click within a boundary object. MapInfo Professional selects all objects that fall within that
boundary.
4. To see a list of all the records that fall within that boundary, on the Window menu, click New
Browser Window. Choose Selection from the list of tables. MapInfo Professional creates a
Browser of the new selection table.
MapInfo Professional 10.5
191
User Guide
Chapter 8: Selecting and Querying Data
Selecting Your Data in MapInfo Professional
Using the Invert Selection Tool
The Invert Selection tool is a convenient way to select many objects at once. You simply select the
few objects that you don’t want, and then invert the selection to select all the objects you do want.
1. Make the map layer that you want to select from selectable. On the Map menu, click Layer
Control and click the Selectable
icon for the layer.
2. Make the Select tool active, and click one or two map objects.
3. Click the Invert Selection tool. MapInfo Professional selects all the objects that are not part of
the current selection, and cancels the current selection. You can also find Invert Selection in the
Query menu.
Unselecting Objects or Records
You may choose to:
•
•
•
Unselect one object or record from a group of selected objects or records.
Unselect a group of selected objects or records.
Unselect all selected objects.
To cancel the selection of one object or record from a group of selected objects or records, hold
down the Shift key and click the object or record with the Select tool. When you click it, the selection
is cancelled.
To cancel the selection of all selected objects, you can either click the Map window where there are
no objects or choose the Unselect All command from the Query menu.
MapInfo Professional 10.5
192
User Guide
Chapter 8: Selecting and Querying Data
Querying Your Data in MapInfo Professional
Querying Your Data in MapInfo Professional
A query is a mathematical question that you pose to your database to collect information. In MapInfo
Professional, there are two query builders available under the Query menu, Select and SQL Select.
Figure: SQL Query to Determine Homes Affected by Airport Noise Pollution
In the case of Select, you can pose a question of a single table. For example,
•
•
Which of my customers spent more than $20,000?
Which of my customers live in Vermont?
In the case of SQL Select, you can ask your question from one or several table(s) of information and
perform these tasks:
•
•
•
•
Derive new columns – columns that calculate new values based on the contents of your
existing columns.
Aggregate your data so that you see only a listing of subtotals instead of seeing your entire
table.
Combine two or more tables into one results table.
Show only the columns and rows that interest you.
MapInfo Professional 10.5
193
User Guide
Chapter 8: Selecting and Querying Data
Querying Your Data in MapInfo Professional
Selecting and Using Queries
Select allows you to query a table. It allows you to select records and objects from a table according
to their attributes. You can use it to highlight objects in a Map or Browser window that meet certain
criteria. You can also create a results table that you can browse, map, or graph like any other table.
For instance, by formulating queries with Select, you can ask MapInfo Professional to:
•
•
•
•
•
Show only postal code regions where the average household income is above $65,000.
Show only postal code regions where the median age is 42.
Show only the postal code regions where the household income is above $65,000 and the
median age is 42.
Show only records for all orders received in July or September.
Show cities of over 100,000 people in Texas, California and Florida.
When you are working in a Browser, MapInfo Professional highlights the records meeting the criteria
of the query. When you are working in a Map window, the graphic objects of the chosen records are
highlighted. When you are working in both windows, the objects in both are highlighted. In all cases,
MapInfo Professional automatically creates a working table called Selection that contains the results
of the query. You can browse, map, or graph this table like any other table. The table can also be
saved as a separate table with Save Copy As.
Finding an Object or Street Address
To find an object or street address:
Your tables must be mappable and indexed. If you need to set up these components, see File >
New Table (Import) or Table > Maintenance > Table Structure.
1. Choose Query > Find, a Find dialog box displays.
2. Click the Search table drop-down list and choose a table from which to search.
3. Click the for objects in column drop-down list and choose the column containing the location
information of the objects you are looking for.
You now have the option of refining the search. Use this option when you are trying to find an
object or address whose name is not unique and is used for other objects or locations.
For example, when you are searching for the town of Ipswich in Great Britain, do you want
Ipswich in Suffolk county or Ipswich in Essex county. Refining the search by county allows you to
specify the county for each town, rather than just the town name.
•
•
Optional - Click the Refine search with table drop-down list and choose a refining table (the
table must contain regions, such as states, counties, census tracts etc.).
Optional - Click the using boundary name column drop-down list and choose your refining
column, the column containing the name of the boundary.
4. Check the Find in Front Window Only check box when you want the Find operation executed
only in the Front Window. When this check box is unchecked, the Find operation is executed in
all windows. When checked, if features are found, they will be marked with a symbol in a Map
Window. If the Browser window is the active window, it will be scrolled so the record appears in
the Browser view.
When you have finished defining where to look for your search data and selecting between the
front most map and all maps then specify what data to look for.
MapInfo Professional 10.5
194
User Guide
Chapter 8: Selecting and Querying Data
Querying Your Data in MapInfo Professional
5. Click OK. The Find dialog box displays. This dialog box allows you to specify what data to look
for.
The name of the column that you specified in the first Find dialog box is listed to the left of the list
box (for example, Street). When locating a street address, type in "# Name", such as "30 Elm St"
or "1045 Templar Blvd." What you type in depends on geocoding preferences specified in
Options > Preferences > Address Matching.
L
MapInfo Professional comes with a text file called MAPINFOW.ABB [MapInfo
Professional Abbreviations], that contains a list of common street abbreviations, such as
"St" for "Street" and "Blvd." for "Boulevard," and so forth. These help MapInfo
Professional to obtain exact matches. To familiarize yourself with the MAPINFOW.ABB
file, you can take a look at its contents in the Notepad Text Editor.
6. Type the name of the object or address you are searching for in this box. If you have used the
Refine option in the first dialog box, a second column name is listed (for example, ZIP).
7. Type the name of the refining boundary in this box. If MapInfo Professional cannot find an exact
match for the object you specified, it lists possible matches.
8. Click Up or Down to move to other pages and choose a specific entry from the list.
9. Click OK and the find is initiated.
You can also use the Find command to locate street intersections. When you type in the name
of the object to be found in the second Find dialog box (enter object name to find), separate the
two items by a double ampersand (&&). For example, to find the intersection of Congress Street
and Christie Street, type "Congress Street && Christie Street."
Finding and Displaying a Selected Object
When you create a query or a SQL query, you may want to see the results of that query visually on
the map.
To find and display a selected object:
1. Do one of the following:
• From the Query menu, select Select to display the Select dialog box
• From the Query menu, select SQL Select to display the SQL Select dialog box
The Find Results in Current Map Window check box displays in both dialog boxes.
MapInfo Professional 10.5
195
User Guide
Chapter 8: Selecting and Querying Data
Querying Your Data in MapInfo Professional
2. Create your query and verify that it is correct, selecting the open table that you want to query.
3. Select the Find Results in Current Map Window check box to display the results upon
completion.
4. Click OK to display the results.
•
For more information, see Selecting All Objects from a Table in the Help System.
Figure: Query Results of Urban Population > Rural Population
Making Queries using the Select Command
MapInfo Professional has two commands for selecting objects through querying: Select and SQL
Select. Select is simpler and SQL Select is more powerful.
To make a query:
1. Choose Query > Select. The Select dialog box displays.
2. Click on the Select records from table drop-down list and choose the table from which to select
the records.
3. Type your query expression in the that satisfy box, or click the Assist button to display the
Expression dialog box which helps you write an expression.
4. Type a name in the Store Results in table box for the temporary table that stores the results of
your query or choose selection (the default). If Selection is chosen, MapInfo Professional
automatically names the table Query 1, Query 2 etc.
5. To sort the query by the value in some column (optional) click the Sort results by column dropdown list and choose the column containing the value you want to sort with.
MapInfo Professional 10.5
196
User Guide
Chapter 8: Selecting and Querying Data
Querying Your Data in MapInfo Professional
6. Click OK. A Browser window of your query results displays if the Browse Results box is
checked.
You can use Select to highlight objects in a map or a table that meet certain criteria and create a
results table that you can browse, map, or graph like any other table.
•
•
•
When you are working in a Browser window, the records meeting the criteria of the query are
highlighted.
When you are working in a map, the graphic objects of the chosen records are highlighted.
When you are working with both a Map window and a Browser window, the objects and the
records are highlighted.
In all cases, a working table is automatically created called Query 3. This table contains the results
of the query. You can map, or graph this table like any other table. The table can also be saved as a
separate table with Save Copy As.
•
For more information, see Saving Queries and Loading Templates in the Help System.
Making Queries using the SQL Select Command
To create a query using SQL Select:
1. Open the table you wish to query, if you haven't already done so. The table that you query is
known as the base table. If you use SQL Select to perform a query on the World table, the World
table is your base table.
2. Choose Query > SQL Select. Fill in the portions of the SQL Select dialog box that meet your
needs. When you click OK, MapInfo Professional performs the query.
MapInfo Professional extracts data from your base table, stores the query results in a special,
temporary table, known as the results table. The results table contains only the rows and
columns that meet your criteria. The default name of the results table is Selection (although you
can specify a different results table name in the Into Table Named field in the SQL Select dialog
box).
3. Open a Map window and/or a Browser window if you want to see the query results. By default,
MapInfo Professional displays the results table in a Browser window automatically (unless you
clear the Browse Results check box in the SQL Select dialog box).
If your results table is called Selection (the default name), the Browser window shows a different
table name, such as Query1 or Query2. This is because the moment you Browse the Selection
table, MapInfo Professional takes a "snapshot" of the table, and names the snapshot Queryn
(where n is a number, one or greater). MapInfo Professional takes the snapshot because
"Selection" is a special table name; Selection dynamically changes every time you select or deselect rows.
In the SQL Select dialog box, you can enter a different name for your results table (e.g. you can
name your results table My_Query). This prevents MapInfo Professional from renaming your
results table Queryn.
4. MapInfo Professional automatically selects all rows in the results table. Thus, after you perform
SQL Select, you can perform operations on the entire set of selected rows. For example, you
could apply a different fill color to all selected rows (by choosing Options > Region Style), or
you could cut or copy all selected rows.
MapInfo Professional 10.5
197
User Guide
Chapter 8: Selecting and Querying Data
Querying Your Data in MapInfo Professional
5. Usually, any alterations you make to the results table are automatically applied to your original
(base) table. For example, if you use SQL Select to select some of the rows from the Orders
table, and then you delete some of the rows from your results table, MapInfo Professional
deletes the corresponding rows from your base table (Orders). However, if your query produces
subtotals, you can alter the results table without affecting the base table.
6. Choose File > Save As if you want to make a permanent copy of the results table. If you do not
perform Save As, the results table will be deleted when you exit MapInfo Professional.
•
For more information, see Using the SQL Select Dialog Box’s Where Condition Field, Updating a
SQL Select Query Table and Using the SQL Select Dialog Box’s Select Columns Field
Templates in the Help System.
Displaying Query Results Quickly
When you create a query or a SQL query, you can display the results visually on the map.
To find and display the results of a query automatically:
1. Do one of the following:
•
•
From the Query menu, select Select to display the Select dialog box
From the Query menu, select SQL Select to display the SQL Select dialog box
The Find Results in Current Map Window check box displays in both dialog boxes. If
there are no open Map windows, this check box is disabled. You cannot save this
check box setting to a template. This option is cleared by default.
2. Create your query and verify that it is correct, selecting the open table that you want to query.
3. Select the Find Results in Current Map Window check box to display the results. Click OK.
•
For more information, see Choosing Which Columns Appear in the Results Table and Creating
Statistical Calculations in the Help System.
Creating Query Expressions
To perform a Select query, you must create an expression. An expression is a logical statement that
is used to ask your question. For example, you have a table of apartments for rent. If you want to
create a temporary table of all apartments that cost less than $800 a month, you could use the
expression:
•
RENT < 800
MapInfo Professional 10.5
198
User Guide
Chapter 8: Selecting and Querying Data
Querying Your Data in MapInfo Professional
where RENT is the name of a numeric column that contains the per month rent rate.
MapInfo Professional searches the apartment table for all records that satisfy this condition and puts
those records in a temporary table that you can map, browse, graph or carry out additional queries.
You can also perform mathematical operations on your data. For example, you want to create a
temporary table of all apartments that have a total cost of less than $800. Total cost is equal to the
sum of the rent and the monthly utilities.
You could use the expression:
•
RENT + UTILITIES < 800
You are telling MapInfo Professional to add the number in the RENT column and the number in the
UTILITIES column and then compare that number to 800.
For more information, see Creating Expressions on page 428 for details in creating a variety of
expressions.
Specifying an Expression
There are two ways of creating an expression. The first method is to type in the expression directly.
When you are creating very simple expressions, this method is usually faster. The second method is
to press the Assist button in the Select dialog box and build your expression using the pop ups in
the Expression dialog box. This method is particularly useful when you are just learning how to build
expressions or when you are building very complex expressions.
To specify an expression:
1. Choose Query > Select. The Select dialog box displays.
2. Click the Assist button. The Expression dialog box displays.
3. Type your expression directly into this box, or choose from the drop-down list selections to
create an expression.
4. Click Verify to verify that your expression is valid.
5. Click OK to return to the Select dialog box.
6. Click OK to run the expression.
The Expression dialog box gives you three drop-down lists that you can use to build your
expression: columns, operators, and functions.
MapInfo Professional 10.5
199
User Guide
Chapter 8: Selecting and Querying Data
Querying Your Data in MapInfo Professional
Columns
This pop up lists every column in the table from which you are selecting. If the table contains derived
columns from previous queries, those columns will also be listed.
Operators
This pop up contains mathematical and logical operation symbols. The mathematical operators in
this pop up include addition, subtraction, multiplication, division, greater than, less than, and equal
signs. You can use these symbols to create mathematical formulas. For example, from your table of
sales representatives you want to select those sales representatives who, on the average, gross
more than $2000 per month. Gross sales is computed by adding together sales and commission.
You have two columns in your table: TOTAL_SALES, which is total sales for the year for each
representative and COMMISSION, which is total commission for the year for each representative.
You could build the following expression:
•
(TOTAL_SALES + COMMISSION) / 12 < 2000
This expression tells MapInfo Professional to add the number in the TOTAL_SALES column with the
number in the COMMISSION column. However, this gives you gross sales for the year. We want
average gross sales for the month. Therefore, we divide the sum by 12, which will give us a monthly
average. We then compare that figure with 2000.
The Operators pop up also includes logical operators conjunctions AND, NOT, OR and LIKE. The
LIKE operator can be used with two wildcard characters: ‘%’ and ‘_’. The ‘%’ character matches zero
or more characters. The ‘_’ character matches only one character.
Functions
This pop up contains mathematical functions that take one or more parameters and return a value.
You use functions to perform basic mathematical functions on the data in that column. For example:
•
abs(<number>)
takes the absolute value of the numbers in the specified column.
For example, a meteorologist wants to select all days where the temperature in her city was more
than 10 degrees warmer or cooler than the national average. She has a column in her table,
AVG_DIFF, that contains the difference between the national average and city average.
She could create the following expression:
•
AVG_DIFF < –10 Or AVG_DIFF > 10
This expression tells MapInfo Professional to select all records that have an average difference less
than -10 or greater than +10. However, she could also create the following expression:
•
abs(AVG_DIFF) > 10
This expression tells MapInfo Professional to select all records where the absolute value of the
average difference is greater than ten.
The Functions pop up contains many other functions, including area, perimeter, sin, cos, and daterelated functions. For a complete list of functions, see Creating Expressions on page 428.
MapInfo Professional 10.5
200
User Guide
Chapter 8: Selecting and Querying Data
Querying Your Data in MapInfo Professional
Verify
This button reviews the expression you have created and verifies that it is valid. This is particularly
helpful if you are new to writing expressions.
Using Select to Create Queries
In general the process for selecting objects using Select is:
1. On the Query menu, click Select to display the Select dialog box.
1
2
3
4
1 Select the table from which to select records.
2 Create the expression to select records.
3 Choose a storage place for results.
4 Choose column for sorting.
2. To see a list of the records you have selected, select the Browse Results check box. MapInfo
Professional creates a Browser of the new selection table.
3. To display the query results in the currently active Map window, select Find Results in Current
Map Window. If there are no open Map windows, this check box is disabled. You cannot save
this check box setting to a template. This option is cleared by default.
4. Click OK to begin the query.
MapInfo Professional names the table Query1. It will name the next temporary selection table
Query2. You can override MapInfo Professional’s default name and give the selection a descriptive
name. Type the new name into the Store Results in Table box. The table can also be saved as a
separate table with Save Copy As.
Example: Selecting
MapInfo Professional makes finding information and locations easy. You can use the Select feature
to create subset databases. As an example, we use the WORLD table to select countries with a
literacy rate greater than 90%.
1. Open the WORLD.TAB table.
2. On the Query menu, click Select to display the Select dialog box.
MapInfo Professional 10.5
201
User Guide
Chapter 8: Selecting and Querying Data
Querying Your Data in MapInfo Professional
3. Complete the Select dialog box:
•
•
Select Records from Table — From the Select records from table drop-down list, choose
World.
Assist — Click the Assist button to display the Expression dialog box.
4. Complete the Expression dialog box as shown in the figure:
From the Columns drop-down list, choose Literacy.
From the Operators drop-down list, choose > (the greater than sign).
Type 90.
Click Verify to confirm the syntax of your expression. Click OK to close the Verify dialog box.
5. Click OK to close the Expression dialog box. The Select dialog box redisplays.
6. Select the Browse Results check box.
7. Click OK. MapInfo Professional creates a Browser that contains the selections. Notice that the
selections display in both the World map and Browser.
MapInfo Professional 10.5
202
User Guide
Chapter 8: Selecting and Querying Data
Querying Your Data in MapInfo Professional
Making a New Table Using a Subset of a File
Many of the data sets that are used with MapInfo Professional include more objects and information
than necessary for some projects. In many cases it is easier to work with a subset of the complete
data product. For example, if you were tracking crime statistics for a county by census tract, you
would not need the census tracts for the entire state.
There are two ways to create a new table that will contain a subset of the records from an existing
file. You can interactively select the objects representing the records you would like to put in the new
table using one of the select tools. Or, you can use the SQL Select command to choose a subset of
objects based on an SQL function. For an example using the SQL Select command, see Example 1
— Computing Population Density Using Area on page 205. Saving the resulting table is the
same procedure, whether you choose the objects interactively or use an SQL select statement.
L
Many of the queries on the following pages can be done either by using the SQL Select
command or through the simpler Select command. Because SQL Select is more versatile
and more commonly used, the SQL Select dialog box is used in the following examples.
Interactively Selecting Objects
1. On the File menu, click Open and open the table in a Map window.
2. Select the objects that will make up the subset with the Select tool, Radius Search Selector
tool, or Polygon Search Selector tool. Shift-click to select multiple objects.
MapInfo Professional 10.5
203
User Guide
Chapter 8: Selecting and Querying Data
Querying Your Data in MapInfo Professional
3. On the File menu, click Save Copy As and save the Selection table. The table can be saved
with any filename.
Using SQL Select to Query Data
A selection is a subset of data rows in a table, chosen based on the contents of one or more
columns from the table. You create selections by formulating questions, or queries, about your data.
How many customers live in the state of Idaho? Which police precinct has the highest rate of violent
crime? MapInfo Professional stores the results of these questions in temporary tables called query
tables.
In the first part of this chapter, we discussed selections and query tables as a result of using Query
Select command. We now turn our attention to an extremely powerful and useful feature in MapInfo
Professional, querying by SQL Select.
While MapInfo Professional’s Select command lets you formulate sophisticated queries, SQL Select
goes even further. The records in the query table generated by the Select command don’t have any
information in them that isn’t contained in the records of the base table. They are, in fact, the same
records. They have been arranged so that they can be viewed together.
With SQL Select you can create query tables containing information that was only implicit in the
base table(s).
MapInfo Professional 10.5
204
User Guide
Chapter 8: Selecting and Querying Data
Querying Your Data in MapInfo Professional
The SQL Select dialog box is one of the most elaborate ones in MapInfo Professional. But don’t be
intimidated. Once you learn what each box is used for, it is fairly simple to create powerful selection
statements. You can type directly into the boxes or you can use the pop up menus on the right to
enter items into the boxes.
The easiest way to describe the dialog box is to walk you through an example, step-by-step. This
example uses data from the WORLD table included in MapInfo Professional, so you can try out this
SQL Select exercise yourself. We have included a brief description of the parts of the dialog box with
each step. A complete description of each box is given after the example.
L
Expanding the text controls is no guarantee that the resulting query can be handled by
MapInfo Professional. You can still receive the Query too complex error when adding larger
queries.
Example 1 — Computing Population Density Using Area
In this example, we’ll use the world map to create a table of all the countries that have a population
density of over 500 people per square mile.
The following formula computes population density:
•
POPULATION / AREA
While the WORLD table has a population column (pop_1994), it does not include a column for
country area. However, since the WORLD table has graphic objects associated with the records,
MapInfo Professional can compute the total area for each country.
Open the WORLD.TAB table, and maximize its display by clicking the window’s maximize button.
On the Query menu, click SQL Select to display the SQL Select dialog box.
To complete the SQL Select dialog box:
1. In the From Tables box, choose WORLD from the Tables drop-down list.
You can specify more than one table in an SQL statement. This example uses only one table,
WORLD.
2. You should fill in the From Tables box before you fill in the Select Columns box. MapInfo
Professional uses the tables in the From Tables box to generate the list of columns in the
Columns drop-down list.
3. Place your cursor in the Select Columns box and delete the asterisk (*). In this example, we will
specify a list of columns to be included in the resulting query table, instead of including all
columns.
L
An asterisk (*) in the Select Columns box means by default that all columns would be
queried.
Remember, the query table is the temporary table that MapInfo Professional creates to store the
results of the query.
4. Select Country from the Columns drop-down list.
MapInfo Professional 10.5
205
User Guide
Chapter 8: Selecting and Querying Data
Querying Your Data in MapInfo Professional
5. Select pop_1994 from the Columns drop-down list.
Now, we need to compute population density. Remember, population density is computed by
dividing population by area. There is no Area column in the table. However, there is a function,
Area, which will compute the area of any mappable object. Since the WORLD table is mappable,
MapInfo Professional can compute the area of each country and, therefore, the population
density of each country.
6. Select the division sign (/) from the Operators list.
7. Select Area from the Functions popup.
This creates a derived column. A derived column is a column that contains the results of
calculations performed on another column or columns. When MapInfo Professional creates the
query table, it will include two columns: the Country column and the pop_1994/Area(obj, “sq
mi”) column, which is our population density column. MapInfo Professional includes a units
statement with all geographic functions. If you wanted MapInfo Professional to return the area in
square kilometers, you would change “sq mi” to “sq km.”
Now, we need to build an expression that selects only those countries whose population density
is over 500 people per square mile.
8. Tab to the Where Condition box and select pop_1994 from the Columns drop-down list.
9. Select the division sign (/) from the Operators drop-down list.
10. Select Area from the Functions pop up.
11. Select the greater than sign (>) from the Operators drop-down list.
12. Type the number 500.
We have now built the expression “Select all countries whose population density
(pop_1994/Area(obj, “sq mi”)) is more than (>) 500 people per square mile.”
13. Leave the Group by Columns box blank.
14. Tab to the Order by Columns box and select Country from the Columns list.
The Order by Columns box allows you to specify the order the records in the query table will
display. By selecting Country, MapInfo Professional will list the records in alphabetical order,
according to country name.
15. Tab to the Into Table Named box and type DENSITY.
By default, MapInfo Professional names the query table Query1. Subsequent query tables will be
named Query2, Query3, and so on. You can change the name of the query table by typing in a
new table name in the Into Table Named box. MapInfo Professional will name the query table
DENSITY.
16. Click Verify. MapInfo Professional checks the syntax of your SQL statement. If there are any
errors in your statement, MapInfo Professional gives you an error message telling you what the
error is and which box contains the error.
17. Select the Browse Results check box to create a Browser of the query table. If you do not select
Browse Results, MapInfo Professional still creates the temporary query table but doesn’t display
it. If you wanted to display the table after the fact, choose the Browse option in the Window
menu and select DENSITY from the drop-down list.
MapInfo Professional 10.5
206
User Guide
Chapter 8: Selecting and Querying Data
Querying Your Data in MapInfo Professional
18. To display the query results in the currently active Map window, select Find Results in Current
Map Window. If there are no open Map windows, this check box is disabled. You cannot save
this check box setting to a template. This option is cleared by default.
19. Click OK to create the following table.
The first column contains the country name. The second column contains the population density.
Note that the countries are listed in alphabetical order (Order By: Country) and the population
density for each country listed is over 500 people per square mile (pop_1994/ Area(obj, “sq mi”)
> 500).
Example 2 — Computing Population Density with SQL
To set up an SQL Select statement that selects only those states with a high population density, do
the following:
1. On the File menu, click Open Table and open the STATES table in a Map window.
MapInfo Professional 10.5
207
User Guide
Chapter 8: Selecting and Querying Data
Querying Your Data in MapInfo Professional
2. On the Query menu, click SQL Select and fill in the SQL Select dialog box.
This creates a new table, HIDENSTY, that contains only those states with a relatively high
population density (population divided by total area). The asterisk (*) in the Select Columns box
transfers all of the columns in the STATES table to the HIDENSTY table.
3. On the File menu, click Save Copy As and save the Selection table. The table can be saved
with any filename.
For additional examples, see the following Help System topics:
•
•
•
Examples of Group by Columns
Example - Using the Group by Columns Field to Subtotal the Results Table
Example - Using the Order by Columns Field to Sort the Results Table
Saving Queries
Any query created using the Select or SQL Select commands can be saved as a MapInfo
Professional query table. Query tables consist of a .tab file and a .QRY file. After you have executed
a Select or SQL Select statement, on the File menu, click Save Query to save the query as a table.
When you open this table, the tables on which the query is based are re-opened and the query is reexecuted.
L
Queries made against other queries cannot be saved as a table or in a workspace.
MapInfo Professional 10.5
208
User Guide
Chapter 8: Selecting and Querying Data
Querying Your Data in MapInfo Professional
Saving Queries to Workspaces
You can also save queries in workspaces. When you open a workspace that contains a query, the
query will execute and any windows created by the query will redisplay. Unlike saving a query as a
table, a separate .tab file is not created when you save a query to a workspace.
L
To save queries to a workspace, the Save Queries in Workspaces check box must be
selected in the Startup preferences. MapInfo Professional selects this check box by default.
Activating Save Query when Using a Workspace
To activate the Save Query option when using a workspace, you must activate the Save Queries in
Workspaces option in the Startup Preferences dialog box.
1. Choose Options > Preferences > Startup. The Startup Preferences dialog box displays.
2. Check the Save Queries in Workspaces option (default setting).
3. Click OK.
If you selected this option and open a workspace, the associated queries are regenerated. A
separate MapInfo Professional table (.tab) file for the queries is not created.
L
Only queries created using the SQL Select or Select commands are saved in a workspace.
Using Date- and Time-Based Data in Maps and Queries
If you maintain time- or date/time-specific data, you may be interested in querying that information
and displaying it visually in your MapInfo maps. We have added new Time and DateTime data types
to allow you to display that data thematically and as part of a query analysis. You could use this new
data type for many types of projects, such as to display crime information based on Date and Time
or to post schedules based on resource availability on a particular date. Additionally if you use
Access, Excel, dBase, and remote databases and you have not been able to use the date and time
based information in the past, we are providing a way for you to use that information in MapInfo
Professional. In the past, when you converted this type of information into a MapInfo format, the
information either was interpreted incorrectly, it was truncated, or it did not translate at all.
These new data types have been added in many places throughout MapInfo Professional and show
up in the lists of your Query dialog boxes. However what is most important is that you understand
how this data is now interpreted when bringing it into MapInfo format.
Using the New Data Types
You can convert existing fields with time or time/date information into the new format so you can use
them for querying and thematic maps.
To convert your data:
1. Open the data you want to convert in MapInfo Professional.
MapInfo Professional 10.5
209
User Guide
Chapter 8: Selecting and Querying Data
Querying Your Data in MapInfo Professional
2. Chose Table > Maintenance > Table Structure and select the table for which you want to
change the data type. The Modify Table Structure dialog box displays.
3. To change the ArrivalTime field from a character field to a Time field, click the Type drop-down
arrow and select the Time type.
4. Click OK to save your change.
Adding Time or DateTime Data Types to Existing Data
If you have existing data and want to add Time or DateTime content to it, check the table below to
ensure that the data is in a format that MapInfo Professional can recognize as Time or DateTime.
Time and DateTime Data Formats
Enter:
To Format for Time:
To Format for DateTime:
Date
Not Applicable.
yyyyMMdd
Sets value to the specified Date at midnight.
Time
HHmmssfff.
Can also use the locale settings
for a Time string.
HHmmssfff
Sets value to current date at specified Time. Can
also use the locale settings for Date and Time
strings separated by a space.
DateTime
yyyyMMddHHmmssfff
Sets value to Time portion of
DateTime value.
yyyyMMddHHmmssfff
MapInfo Professional 10.5
210
User Guide
Chapter 8: Selecting and Querying Data
Querying Your Data in MapInfo Professional
where:
HH refers to hours, mm refers to minutes, ss refers to seconds, ff refers to fractions of seconds,
yyyy refers to years, MM refers to month, dd refers to date
Converting Existing Data to Time or DateTime Data Types
If you have Time or DateTime data in your tables already, check to see if it is in the format you want
by checking the Time and DateTime Data Formats. If you have a lot of data and it is not in the
format you require for your tasks, you can use one of the MapBasic conversion functions to assist
you with this process.
Converting
Date
Time
DateTime
String
Assumes the form
yyyyMMdd or locale
settings for a date string
if Date format is "local"
or the U.S. form if Date
format is "US". *
String can be in the
form HHmmssfff or
can use the locale
settings for a Time
string. **
String can be in the form
yyyyMMddHHmmssfff or
can use the locale settings
for Date and Time strings
separated by a space. ***
Number
Assumes the form
yyyyMMdd. If any
portion of the Date is
invalid the value is set to
null. May display this
error: "Could not convert
data."
Assumes the form
HHmmssfff. If any
portion of the Time is
invalid the value is set
to null and display this
error: "Could not
convert data."
Assumes the form
yyyyMMddHHmmssfff. If
any portion of the DateTime
is invalid the value is set to
null and display this error:
"Could not convert data."
Date
No conversion
Sets value to null and
display this error:
"Could not convert
data."
Sets value to the specified
Date at midnight.
Time
Sets value to null. May
display this error: "Could
not convert data."
No conversion
Sets value to current date at
specified Time.
DateTime
Sets value to Date
portion of DateTime
value.
Sets value to Time
portion of DateTime
value.
No conversion
Additional Notes for Converting a String
* to a Date
If the year is last in the current Date format, you can omit it and MapInfo Professional will assume
the current year. If the data specifies a two-digit year, MapInfo Professional assigns the century
based on the current Date Window. If the Date is invalid the value is set to null and MapInfo
Professional may display this error: "Could not convert data."
MapInfo Professional 10.5
211
User Guide
Chapter 8: Selecting and Querying Data
Querying Your Data in MapInfo Professional
** to a Time
MapInfo Professional accepts both military and AM/PM forms. The data can specify the entire locale
in AM or PM strings or use just the first character of each. The data may omit the milliseconds,
seconds, and minutes if the lower-order portions are also omitted. If the Time is invalid the value is
set to null and MapInfo Professional may display this error: "Could not convert data."
*** to a DateTime
The conversion rules for Date and Time apply for the respective portions of the string. If the data
omits the Time portion, MapInfo Professional assumes midnight. If the DateTime is invalid the value
is set to null and MapInfo Professional may display this error: "Could not convert data."
Additional Notes for Converting a Number to a String
# The conversion rules for Date and Time apply for the respective portions of the string. If the data
omits the Time portion MapInfo Professional assumes the Time is midnight. If the DateTime is
invalid the value is set to null and MapInfo Professional may display this error: "Could not convert
data.".
If you have a lot of data and it is not in the format you require for your tasks, you can use one of the
MapBasic conversion functions to assist you with this process.
Creating a DateTime Column from Two Separate Columns
To create a DateTime column from a Date column and a Time column:
1. Open your data in MapInfo Professional Browser window. We use CrimeActivity.TAB from the
Introductory Data on your DVD.
2. Choose Table > Maintenance > Table Structure to display the Modify Table Structure dialog
box.
3. Click Add Field and type a Date_Time label in the Name field.
4. Select Date/Time in the Type drop-down list and click OK.
MapInfo Professional 10.5
212
User Guide
Chapter 8: Selecting and Querying Data
Querying Your Data in MapInfo Professional
5. Select Table > Update Column to display the Update Column dialog box.
6. Select the table name in the Table to Update drop-down list.
7. Select the name of the new column you just created in the Column to Update drop-down list.
8. Select the table name again in the Get Value from Table drop-down list.
9. Click the Assist button to display the Expressions dialog box.
10. Use the Column drop-down list to create the following expression and click OK:
DateColumnName + TimeColumnName
For more about using math expressions with Time and Date information, see Using
the Arithmetic Operators with the New Data Types on page 215.
11. Click OK to update the new column with the Date and Time information.
MapInfo Professional 10.5
213
User Guide
Chapter 8: Selecting and Querying Data
Querying Your Data in MapInfo Professional
Creating Thematic Maps using Time and Time/Date Data Types
For ranged thematic maps, Time values will be able to be rounded by seconds, minutes, and hours.
The default is seconds. When you select None, MapInfo Professional does not round the electing
the seconds and displays a granularity of milliseconds.
L
If your data is on a remote database, you may be interested in the Time and DateTime Data
Type Support for Remote Databases in the Help System.
To create a thematic map using DateTime information:
1. Open your data in MapInfo Professional Browser window. Use the appropriate background map
to give your data perspective. Here we use the Great Britain data in the Introductory Data on the
MapInfo Professional DVD.
2. Choose Query > SQL Select to display the SQL Select dialog box.
3. Place your cursor in the from Tables field and select the table name that contains the DateTime
data in the from Tables drop-down list. For our example we used the CrimeActivity table.
4. To find out the location of crimes between April 10, 2003 and April 10, 2004 and between the
hours of 12 and 8 p.m., we entered this text in the where Condition box:
Crime_Date between "04/10/2003" and "04/10/2004" And Crime_Time between
"12:00:00 PM" and "08:00:00 PM"
5. Select the Browse Results and Find Results in Current Map Window check boxes to display
the results.
6. Click OK to create the query and display the results.
MapInfo Professional 10.5
214
User Guide
Chapter 8: Selecting and Querying Data
Querying Your Data in MapInfo Professional
We used the UKCrimeExample data to create this map. This data is available in the
Introductory Data/World/Europe/UKCrimeExample folder of the Data on the tMapInfo
Professional DVD.
Using the Arithmetic Operators with the New Data Types
You can use the addition and subtraction operators with the new data types as follows:
Data type
Operator
Data type
Result
Notes
Time
minus (-)
Time
Number
The number represents the number of
seconds between two times as a floating
point number. The fractional part of the
result represents milliseconds.
Time
+ or -
Number
Time
The number represents the seconds to
add to the first Time. The Time wraps
around midnight so that 11:59 PM + 120
seconds equals 12:01 AM.
DateTime
minus (-)
DateTime
Number
The number represents the number of
days between two DateTimes as a floating
point number. The fractional part of the
result is the fractional portion of a day, as
in today at noon minus today at midnight
equals one half day.
DateTime
+ or -
Number
DateTime
The number represents the number of
days to add to the first Time.
MapInfo Professional 10.5
215
User Guide
Chapter 8: Selecting and Querying Data
Querying Your Data in MapInfo Professional
Using the Comparison Operators with the New Data Types
The comparison operators are =, <>, <, >, <=, >= and should all work as expected for the Time and
DateTime values. For Time values, the smallest Time is "12:00:00.000 AM" while the largest Time is
"11:59:59.999 PM".
The "Between" operator works as expected for DateTime values. For Time values, we support wraparound comparisons. For example:
TimeValue Between "2:00 AM" And "10:00 PM" is true if the TimeValue is greater than or equal
to "2:00 AM" and less than or equal to "10:00 PM"
TimeValue Between "10:00 PM" And "2:00 AM" is true if the TimeValue is greater than or equal
to "10:00 PM" and less than or equal to "11:59:59.999" or greater than or equal to "12:00 AM"
and less than or equal to "2:00 AM"
Using the Logical Operators with the New Data Types
A Time or DateTime field with a value is true, while the same field with a null value indicates false.
The behavior of the logical operators And, Or, and Not should follow logically from this.
Interpreting Excel Data
Using Excel you can format numeric cells as Dates and/or Times. In previous versions, MapInfo
Professional supported Date fields with the format 'y' (year), 'm' (month), or 'd' (day). Time fields
within the format 'h' (hour) or 's' (second) were treated as Float fields. Fields with Date and Time
format codes were treated as a Date field and the Time information was ignored. Excel determines
the meaning of the ’m’ format code as either ’month’ or ’minute’ based on the rest of the format code.
With the introduction of these new data types:
Fields registered with
Are Treated As...
Date format but not Time format
Date fields
Time format but not Date format
Time fields
Date format and Time format
DateTime fields
L
If you want to use both the Date and Time data from tables registered with earlier versions of
MapInfo Professional, you can re-register the tables.
The Help System contains these related topics:
•
•
Ensuring that Dates Display Correctly for Excel for Macintosh Tables
Controlling how MapInfo Professional Handles Mixed Data Type Columns
MapInfo Professional 10.5
216
User Guide
Chapter 8: Selecting and Querying Data
Querying Your Data in MapInfo Professional
Interpreting Microsoft Access Data
Access data uses a DateTime type, but not separate Date or Time types. In the past, MapInfo
Professional interpreted these fields as Date fields. With the introduction of these new data types,
MapInfo Professional registers the Access DateTime type fields as DateTime fields.
L
The Date fields in any of your existing MapInfo Professional files are still treated as Date
fields until you re-register them to use the new DateTime data type.
When you save a MapInfo table to Access format, MapInfo Professional writes Date, Time, and
DateTime fields as Access DateTime fields. The .tab file itself maintains the Date, Time, and
DateTime types so when you reopen the file, the Date, Time, or DateTime data displays. If you
attempt to open these .tab files using a non-MapInfo application, these fields display as DateTime.
Interpreting dBase Data
The dBase format supports Date fields but does not explicitly support Time or DateTime fields.
Therefore, when you register an existing dBase file, there will be no Time or DateTime fields. When
you save or export a MapInfo table with Time or DateTime fields to a dBase file, Time and DateTime
fields are written out as character fields of length 9 and 17, respectively so that the data is written out
in numeric formats.
When you save a new MapInfo table to dBase format, the .tab file maintains the Time and DateTime
types so that when you reopen it the data will displays as either Time or DateTime. If you attempt to
open these .tab files using a non-MapInfo application, these fields display as character fields.
Related topics in the Help System:
•
•
Time and DateTime Data Type Support for Remote Databases
Interpreting ASCII and CSV Data
Using Templates for Queries
Query templates enable you to save Select or SQL Select statements as templates and reload them.
This saves you the trouble of having to rebuild a query each time you want to use it. Both the Select
and SQL Select dialog boxes have Load Template and Save Template options to enable you to do
this easily. Query templates are useful for re-creating a query with an updated version of the table
used in the original query, or for executing a query on a table that has the same fields as the table on
which the query statement was created.
Loading a Template
You can load any saved query template.
To load a query template:
1. In the Select or SQL Select dialog boxes, lick the Load Template button. The Load Dialog From
Query File dialog box displays. It lists the .QRY files.
MapInfo Professional 10.5
217
User Guide
Chapter 8: Selecting and Querying Data
Querying Your Data in MapInfo Professional
2. Select the .QRY file you want to use, and click Open. The Select or SQL Select dialog box
displays with the values from the template already filled in. Simply execute your query to create
the query browser.
Renaming a Template
Rename a template by selecting and clicking the template name; enter a new name up to 64
characters.
Saving a Template
After you have finished writing your Select or SQL Select query, you can save the query as a
template.
To save a query as a template:
1. In the Select or SQL Select dialog boxes, click the Save Template button to save the query to a
template, or query file. The Save Dialog to Query File displays.
2. Give the query file a name, select a folder, and click Save. Query files are saved with a .QRY
extension and are saved in the directory specified in the Directories preferences.
L
The query does not need to be complete or syntactically correct to save it to a template.
Deleting a Template
To delete a template:
•
Select the template name and press the Delete key. A dialog box displays prompting you to
confirm or cancel the operation. If no templates of the given type exist, a button to restore a
default template displays.
Deriving Columns
A derived column is a column in a query table whose contents are created by applying an
expression to the values of columns already existing in some base table. In the example above,
population density was a derived column. By default, the Select Columns box contains an asterisk
(*), indicating that all of the columns in the base table are to be included in the query table. If you
don’t want all of those columns, you should delete the asterisk and list only those columns that you
want to use. You aren’t limited to creating one derived column. You can create as many derived
columns as you want. Note that the more derived columns you create, the longer it will take MapInfo
Professional to execute the query.
You can also create derived columns based on the aggregate functions count, sum, avg, wtavg,
max, and min. For example:
•
sum(Population)
would give you the population for the entire world.
•
sum(Area(obj), “sq mi”)
MapInfo Professional 10.5
218
User Guide
Chapter 8: Selecting and Querying Data
Querying Your Data in MapInfo Professional
would give you the area for the entire world.
Creating Column Aliases
When MapInfo Professional creates a derived column, it uses the expression itself as the name for
that derived column, which can be awkward. You can, however, specify an alias for the column. For
example, the population density column in our DENSITY Browser was titled:
•
Population / Area(obj, “sq mi”)
To rename the column, add the new name to the Select Columns box when listing the columns.
The alias must follow the expression. It must also be separated from the expression by a blank
space and enclosed in quotes. For example:
•
Country, Population / Area(obj, “sq mi”) “POP_DENSITY”
When MapInfo Professional creates the temporary query table, the population density column will
now be named POP_DENSITY.
You can use aliases to rename any column in a table, not just derived columns. For example, if each
country in your table is a separate sales territory for your corporation, you might want to rename the
Country column “TERRITORY”. The procedure is identical:
•
Country “TERRITORY”, Population / Area(obj, “sq mi”) “POP_DENSITY”
For another example, see Example — Computing Total World Population Density in the Help
System.
Aggregating Data
When you aggregate data, you perform a mathematical operation on all of a column’s values in all of
the records in your table. Unlike the Select command, which only allows you to perform
mathematical functions on individual records, SQL allows you to aggregate (or summarize) data
across records.
MapInfo Professional looks for each unique set of data values in the specified column or columns
and creates one row for each such unique set. When you aggregate data, you need to specify:
•
•
How the records will be grouped.
How the data will be aggregated (summarized).
For example, you have a table of sales representatives and their sales figures for the past three
months:
SALES_REP
MONTH
SALES
John
May
1200
Cathy
May
900
Julie
May
1100
MapInfo Professional 10.5
219
User Guide
Chapter 8: Selecting and Querying Data
Querying Your Data in MapInfo Professional
SALES_REP
MONTH
SALES
John
June
900
Cathy
June
1400
Julie
June
600
John
July
1200
Cathy
July
700
Julie
July
1000
MapInfo Professional could also compute the total sales for each representative by specifying in the
SQL Select dialog box:
•
•
Select Columns: SALES_REP, sum(SALES)
Group by Columns: SALES_REP
SALES_REP
sum(SALES)
John
3300
Cathy
3000
Julie
2700
or MapInfo Professional could compute the average sales for each representative:
•
•
Select Columns: SALES_REP, avg(SALES)
Group by Columns: SALES_REP
SALES_REP
avg(SALES)
John
1100
Cathy
1000
Julie
900
or MapInfo Professional could compute the total sales for each month:
•
•
Select Columns: MONTH, sum(SALES)
Group by Columns: MONTH
MapInfo Professional 10.5
220
User Guide
Chapter 8: Selecting and Querying Data
Querying Your Data in MapInfo Professional
MONTH
sum(SALES)
May
3200
June
2900
July
2900
MapInfo Professional has six aggregate functions:
•
•
•
•
•
•
Count(*): counts the number of records in a group. It takes * as its argument because it
applies to the record as a whole, and not to any particular field in the record.
Sum (expression): calculates the sum of the values in <expression> for all group records.
Average (expression): calculates the average of the values in <expression> for all the
records in a group.
WtAvg (expression): calculates the weighted average of the values in <expression> for all
the records in a group.
Max (expression): finds the highest value in <expression> for all records in a group.
Min (expression): finds the lowest value in <expression> for all records in a group.
For more about grouping and ordering your data, see the Help System.
Joining Tables Using SQL Select
When performing an SQL Select operation with multiple tables, MapInfo Professional needs to join
information from the records in the various tables. You may have a map table containing only
graphic objects and their names and a table of statistical data for some geographic region. You want
to display the statistical data on the map table. You could use SQL Select to create a query table in
which your statistical data and map data are joined in one table.
Whenever you are working with multiple tables, you must put a statement in the Where Condition
telling MapInfo Professional how to match up the rows in the different tables. For example, you have
the WORLD table that contains countries and a table of economic statistics (Eco_Stats), also broken
down by country.
You want to create a query table that contains both sets of data:
•
•
•
Select Columns: * (an asterisk indicates include all columns in the query table)
From Tables: World, Eco_Stats
Where Condition: World.Country = Eco_Stats.Country
The two columns that you want to match do not have to have the same name. For example, you
have a table of international customers (Int_Cust) that contains a sales territory column
(TERRITORY). This column contains continent names, since your company breaks up its sales
territories according to continent. If you wanted to temporarily join the two tables:
•
•
•
Select Columns: *
From Tables: World, Int_Cust
Where Condition: World.Continent = Int_Cust.TERRITORY
MapInfo Professional 10.5
221
User Guide
Chapter 8: Selecting and Querying Data
Querying Your Data in MapInfo Professional
For an example, see Example — Total Population and Area by Continent in the Help System.
Using the Where Condition
The order of fields used in the Join does not matter. Either of the following syntaxes is acceptable:
Select * from A,B where A.field1 = B.field1
Select * from A,B where B.field1 = A.field1
However, keep in mind that when you switch the order of geographic operands, the geographic
operator must also change. The following statements will produce identical results:
Select * from states, cities where states.obj contains cities.obj
Select * from states, cities where cities.obj within states.obj
Order of Clauses
The order in which Join clauses are performed does not matter. For example, each of the following
are valid clauses:
Select * from Us_custg,States,City_125
where States.state = City_125.state and States.state = Us_custg.state and
Us_custg.order_amt > 10000
Select * from Us_custg,States,City_125
where States.state = City_125.state and States.state = US.custg.state and
Us_custg.order_amt > 10000
Select * from Us_custg,States,City_125
MapInfo Professional 10.5
222
User Guide
Chapter 8: Selecting and Querying Data
Querying Your Data in MapInfo Professional
where Us_custg.state = States.state and Us_custg.order_amt > 10000 and
States.state = City_125.state
L
Some of the data used in this example is from the MapInfo Professional Tutorial, which is
only available from the Pitney Bowes Software Inc. web site,
http://go.pbinsight.com/webtutorials.
Error Handling
If an invalid Where condition that uses an OR as a logical operator is detected, MapInfo Professional
will indicate an error has occurred. Usually this error will display whenever MapInfo Professional
cannot find a join between two tables. For example, if you have specified the following incorrect
condition:
Select * from A,B where A.field1 = B.field1
or A.field1 = B.field2
This error message displays:
No join specified between A and B. Invalid join condition in Where
clause
Joining Tables Geographically (Using Geographic Operators)
When two tables have graphic objects, MapInfo Professional can join the tables based on the spatial
relationship between those objects. Thus, even if your tables do not share a common column, you
may be able to join the tables.
Geographic operators allow you to select objects on the basis of their spatial relationship to some
other object. MapInfo Professional has a special column name you use with geographical operators:
"obj" or "object". This column name refers to the graphic objects that are attached to your table.
The geographic operators go between the objects being specified. Select the geographic operators
from the Operators drop-down list.
The following table lists the geographic operators:
Contains
Contains Entire
Within
Entirely Within
Intersects
MapInfo Professional 10.5
Object A Contains Object B if B's centroid is anywhere within A's
boundary.
Object A Contains Entire Object B if B's boundary is entirely within A's
boundary.
Object A is Within Object B if its centroid is inside B's boundary.
Object A is Entirely Within Object B if A's boundary is entirely within
B's boundary.
Object A Intersects Object B if they have at least one point in
common or if one of them is entirely within the other.
223
User Guide
Chapter 8: Selecting and Querying Data
Querying Your Data in MapInfo Professional
The difference between Contains and Within on the one hand, and Contains Entire and Entirely
Within on the other, hinges on how the geographic comparison is made. For Contains and Within,
the comparison is based on object centroids. For Contains Entirely and Entirely Within, the
comparisons are based on the whole object.
The following graphic illustrates this point:
Object A contains Object B
Object B within Object A
Object A contains Object B
Object B within Object A
Object A contains Entire
Object B
Object B entirely Within
Object A
Object A intersects Object B
Object B intersects Object A
In each case, object A contains object B because the centroid of object B is inside the boundary of
object A. However, in the cases at the left and in the middle, part of object B is outside the boundary
of object A. Only in the case to the right is all of object B inside object A. Only in this case could we
assert "object A Contains Entire Object B" or "Object B Entirely Within Object A." Further, if A
contains entire B, then A contains B, and If A is entirely within B then A is within B.
MapInfo Professional can perform a simple Contains or Within comparison more rapidly than a
Contains Entire or Entirely Within. Therefore, unless you are absolutely sure that objects are
completely inside other objects, you should use Contains and Within rather than Contains Entire
or Entirely Within.
Geographic operators provide a way of joining tables. When there are no columns in the tables on
which you can base your join, you can use a geographical operator to specify the join (in the Where
Condition field). If you want to perform a query that involves both a Cities table and a States table,
you can join the tables using either of the following expressions:
1. Cities.obj within States.obj
2. States.obj contains Cities.obj
In either case, MapInfo Professional finds the cities within each state and then associates a row for a
city with the row for the state that contains it. In the same SQL Select query, you could also use
aggregate functions to count the number of cities per state or to summarize city-based data on a
statewide basis.
MapInfo Professional 10.5
224
User Guide
Chapter 8: Selecting and Querying Data
Querying Your Data in MapInfo Professional
When you have a table of counties and one of customers, where counties are polygons and
customers are points, you could specify a geographic join using either of the following geographic
expressions:
1. Customer.obj within County.obj
2. County.obj contains Customer.obj
Geographic operators are particularly useful in conjunction with subselects.
Additional related help topics:
•
•
Joining Tables by the Order of the Rows
Performing Subselects
Joining Two or More Tables
Typically, you store your information in several different tables. You have your own data files, and
you may also have various databases of statistical information that you purchased from MapInfo
Professional. SQL Select allows you to create relational joins so that you can bring information from
these various tables together into a single results table.
When you want to join two tables, you must determine whether one of the columns in the first table
contains values that match one of the columns in the second table. Imagine that you have a table of
counties that has demographic information--the population of people in various age ranges, ethnic
groups, and occupational categories in each county. You may also have a database containing
information about customer orders. You want to examine these two tables and see if certain kinds of
orders come from counties having certain demographic characteristics. Perhaps you want to select
counties according to combinations of orders and demographic characteristics. To do this you have
to be able to join the two tables.
Suppose the counties table contains the name of the county. Similarly, one of the columns in the
order table contains the name of the county in which the order originated. Thus, these two tables
have one field in common, the county name. MapInfo Professional can use that common field to join
the two tables.
CountyName
Pop_1980
Pop_1990
Order #
Customer
County
Foster
23,789
27,135
478001
Francis
Foster
Williamette
35,456
34,846
478002
James
Foster
Mason
147,101
151,201
478003
Wickwire
Mason
Counties Table Orders Table
Within the SQL Select dialog box, you use the Where Condition field to tell MapInfo Professional
how to join the two tables. The SQL Select dialog box might look like this:
Select Columns: *
From Tables: Counties, Orders
Where Condition: Counties.CountyName = Orders.County
MapInfo Professional 10.5
225
User Guide
Chapter 8: Selecting and Querying Data
Querying Your Data in MapInfo Professional
The order of the table names (in the From Tables field) is important. If both tables contain map
objects, the results table will only retain the map objects from the first table listed in the From Tables
field. Furthermore, when the query is complete, MapInfo Professional automatically selects some or
all of the rows from whichever table is listed first in the From Tables field. Thus, in the preceding
example, MapInfo Professional will select some or all of the rows from the Counties table. The
results table will also include data copied from the Orders table, but the Orders table will not be
selected per se.
When you join two tables, the number of rows in the results table depends on how well the two
tables match up. Suppose you have an Orders table with 10,000 rows, and you join the Orders table
to the States table, which has fifty rows. The results table may contain as many as 10,000 rows.
However, if some of the rows in the Orders table fail to match any of the rows in the States table, the
results table will contain fewer than 10,000 rows. Thus, if 400 of the rows in the Orders table do not
have a state name (perhaps due to data-entry errors), and if the relational join relies on the state
name, the results table may only contain 9,600 rows.
You can use Update Column to modify the results of an SQL Select multi-table join. When you want
to update a column in one table with information from another table, you can:
1. Join the tables with SQL Select.
2. Use Update Column on Selection. The update automatically takes effect in the appropriate base
table.
•
For more information, see Performing Outer Joins and Using the Instr Function to Find Data in
the Help System.
Finding Duplicate Values in a Column
Often data is entered into tables by many different users. Sometimes data is repeated, or there is
common information in several different records. This section explains how to find all rows in a table
that, for a given column, share a value with another row. This is accomplished by performing two
SQL Select statements.
The first SQL Select statement produces a query table with two columns. The first column is a list of
all unique values in the data column and the second column lists the number of times that each
unique value occurs. The second SQL statement compares each data column value with all rows in
the Query table where the count is greater than one.
In the next example, there is a table EMPLOYEE that has two columns Id_Num and Name.
To find the duplicate values, perform the two SQL Selects, modifying them where indicated.
1. On the Query menu, click SQL Select and fill in the SQL Select dialog box.
MapInfo Professional 10.5
226
User Guide
Chapter 8: Selecting and Querying Data
Querying Your Data in MapInfo Professional
Substitute the name of your data column for ID_Num and the name of your table for
EMPLOYEE. The number 1 in the Group By Columns box will group the row by ID_Num (the first
column). The 2 Desc in the Order by Columns box will arrange the records in descending order
based on the values in the count(*) field (the second column).
This SQL Select statement returns a query table with two columns. The first column contains
every identification number possessed by at least one employee. The second column contains
the number of employees that have that identification number. The rows are sorted by the
number of employees that have each id number (for example, the count).
2. On the Query menu, click SQL Select and fill in the dialog box.
Also, change EMPLOYEE to the name of your table and ID_Num to the name of your data column.
In the example, the SQL statement returns a query table containing all of the rows from EMPLOYEE
with duplicated data column values. The where condition selects all rows from EMPLOYEE that
have an identification number that is the same as one of the ID numbers in the Count_By_ID query
table. This sub-select finds all identification numbers that occur more than once.
Calculating the Distance to a Fixed Point
In MapInfo Professional it is possible to calculate the distance from one point to another. This
example shows how to calculate the distance from a fixed point to every point in a geocoded table
and store the result in another table.
1. Determine the location of the fixed point. To find the position of a symbol on the map,
double-click the symbol with the Select tool. In this example, the X value is -101.697209 and the
Y value is 35.550036.
MapInfo Professional 10.5
227
User Guide
Chapter 8: Selecting and Querying Data
Querying Your Data in MapInfo Professional
2. On the Query menu, click SQL Select and fill in the SQL Select dialog box, substituting your X
and Y values for the values mentioned above
As in the previous SQL query, replace EMPLOYEE with the name of your table, and ID_Num
with the name of the relevant column from your table.
3. Click OK. The resulting query table contains last names and first names plus a new column
called DISTANCE which records the distance between the fixed location (-101.697209,
36.550036) and the point associated with each row of the table.
4. To save the results in a permanent table, on the File menu, click Save Copy As, and save the
CUSTDIST table.
•
For instructions on entering SQL queries using the Expert button, see the Help System.
MapInfo Professional 10.5
228
User Guide
Creating Thematic Maps,
Legends, and Other
Maps
Thematic mapping is a powerful way to analyze and visualize your data. You
give graphic form to your data so that you can see it on a map. Patterns and
trends that are almost impossible to detect in lists of data reveal themselves
clearly when you use thematic shading to display the data on a map.
You can create thematic maps with MapInfo Professional using the following
methods: ranges of values, graduated symbols, dot density, individual values,
bar and pie charts and continuous grid. There are also several variations on and
options within these methods, such as bivariate thematic mapping and inflection
point, that give you even more ways to analyze your data.
Topics in this Section:
MapInfo Professional in Action. . . . . . . . . . . . . . . . . . . . . . . . . . .230
Using Thematic Mapping to Analyze Information . . . . . . . . . . . .230
Types of Thematic Maps . . . . . . . . . . . . . . . . . . . . . . . . . . . . . . . .234
Working with Thematic Maps and Legends. . . . . . . . . . . . . . . . .252
Updating Columns using Thematic Mapping . . . . . . . . . . . . . . .255
Working with Legends . . . . . . . . . . . . . . . . . . . . . . . . . . . . . . . . . .260
Working with Grid Surface Maps . . . . . . . . . . . . . . . . . . . . . . . . .265
For clarification of the uses of thematic maps in MapInfo Professional, see
MapInfo Professional in Action in the Help System.
The Help System also contains these related topics:
•
•
Bivariate Thematic Mapping
Working with 3D and Prism Maps
9
Chapter 9: Creating Thematic Maps, Legends, and Other Maps
MapInfo Professional in Action
MapInfo Professional in Action
Since you have all the tools you need to make effective and useful maps, it is time to talk about what
makes a map effective and useful. Whatever you need your map to say, whether it is to convey
information, calculate distances between health care providers and their patients, or get a count of
the number of customers that live within a given radius of an outlet location, MapInfo Professional
can help you do that. By making selections from your table, you can extract information from sets
and subsets of your data or see patterns and distributions, getting answers to such questions as:
Which of my customers bought more than $5000 of equipment? Which of my customers is located
within a 200 mile radius of my warehouse? Which of my customers bought more than $5000 of
equipment and is located within a 200 mile radius of my warehouse? For more on selecting, see
Selecting Your Data in MapInfo Professional on page 184, and Querying Your Data in MapInfo
Professional on page 193.
MapInfo Professional refers to this grouping of like information as thematic mapping.
•
For an example, see Can You Give Me an Example in the Help System.
Using Thematic Mapping to Analyze Information
Thematic mapping is the process of enhancing your map according to a particular theme. At the
cornerstone of the theme is the data in your table. Themes represent your data with shades of color,
fill patterns, symbols, bar and pie charts, and grids.
With MapInfo Professional, you create different thematic maps by assigning these colors, patterns,
or symbols to map objects according to specific values in your table. MapInfo Professional’s bar and
pie charts allow you to make data comparisons for each record. Grids allow you to see continuous
change of your data across an area.
The Thematic Map feature uses a wizard made up of a series of three dialog boxes to help you
choose the type of thematic map you want, the table(s) and fields that will be used to construct the
map, and a variety of options to customize your map.
MapInfo Professional 10.5
230
User Guide
Chapter 9: Creating Thematic Maps, Legends, and Other Maps
Using Thematic Mapping to Analyze Information
MapInfo Professional’s thematic templates make it easy to start constructing a theme. Just choose a
template that represents the type of thematic map you want. The templates are fully customizable
and can be saved as new templates for future thematic mapping needs. More than 40 templates
ship with MapInfo Professional.
Figure: Comparison of Senior Population to Total U.S. Population
Planning Your Thematic Map
Before you create a thematic map, it is important to know about the elements that make up a
thematic map and how to put them together. This section will discuss thematic variables, where you
can obtain your data, using data from the same table or another table, and the arrangement and
display of thematic layers.
What is a Thematic Variable
The data that you display on your thematic map is called the thematic variable. Depending on the
type of thematic analysis you are performing, your map can show one or more thematic variables.
Ranges of values, grid shading, graduated symbols, dot density, and individual values maps all
examine one variable. With bar or pie charts, you can display more than one thematic variable at a
time.
A thematic variable can also be an expression. Choose Expression from the field list in place of a
data field to construct a statement that derives information from the data in your table(s). Although
an expression can be made up of more than one variable (for example, POP_1990 – POP_1980),
for purposes of thematic mapping, a complete expression is equivalent to one thematic variable.
See Querying Your Data in MapInfo Professional on page 193, and Creating Expressions in the
MapInfo Professional User Guide, which is located in the Documentation subfolder of your
installation directory, for more detailed information.
You can also create bivariate thematic maps, where one map object, such as a symbol, represents
two different pieces of data. The symbol color, for example, can represent one thematic variable,
and the symbol size can represent another.
MapInfo Professional 10.5
231
User Guide
Chapter 9: Creating Thematic Maps, Legends, and Other Maps
Using Thematic Mapping to Analyze Information
Where to Obtain the Data
Before you begin your thematic map, you need to decide what information you want to display and
locate where that information resides. It can either be in the table on which you are basing the map,
or it can be in another table.
If the data is in the same table on which you are basing the map, choose the desired field directly in
the Field list box in the Thematic – Step 2 of 3 dialog box.
If the data is in another table, you must first bring the data into the table on which you’re basing the
thematic map. This requires creating a temporary column using Update Column.
Each situation is described in the next few sections.
Using Data from the Same Table
If you are using data from the same table, choose the table and field on which you want to base your
thematic map in the Thematic – Step 2 of 3 dialog box.
For example, you have a table of parking meters that contains the location of the parking meter and
the last time the parking meter was emptied. Using Individual Values you want to shade the parking
meter symbols according to the last time each meter was emptied. MapInfo Professional will assign
a color to each time. In Step 2 of 3, choose the parking meter table as your table, and choose the
field that contains the time each meter was emptied.
Using Data from a Different Table
The Join feature within the Thematic – Step 2 of 3 dialog box enables you to use data from other
open tables to create a thematic map. Choose Join in the Field list box to display the Update
Column dialog box where you can create a temporary column in the base table.
The temporary column can contain data taken directly from the other table, or you can aggregate the
data to create derived information for the temporary column.
For example, you have two tables: a table of county boundaries and a table of police stations. You
want to shade the table of county boundaries according to the number of police stations in each
county.
To do this, all the information you want to use must be in the county table. Therefore, you must add
police station data to this table.
Using Update Column, you create a temporary column in the county boundaries table that will store
the police station information. To create this column, the two tables must have a link so that MapInfo
Professional can access the data that goes into the temporary column. The link can either be a
matching field (like county name), or you can make the link geographically (police stations contained
within counties).
An example later in this chapter explains more about Update Column.
•
For details on how thematic mapping works, see Methods of Thematic Mapping in the Help
System.
MapInfo Professional 10.5
232
User Guide
Chapter 9: Creating Thematic Maps, Legends, and Other Maps
Using Thematic Mapping to Analyze Information
Methods of Thematic Mapping
When you create a thematic map in MapInfo Professional, the thematic shading is added to your
map as a separate layer. It is drawn on top of the base map layer.
Separating Thematic Layers
Separating thematic layers from the base map layer provides you with several important options:
•
•
•
Graduated symbol thematic maps do not require that your base map contain point objects.
Instead, graduated symbol objects are built regardless of the map object type. Therefore, even if
your base map contains region or line objects, you will still be able to create a graduated
symbols map.
You can have multiple thematic layers per base map layer. In some cases, you do not have to
add another base layer to the map to create another thematic layer. You can display more than
one thematic layer at a time, as well as perform bivariate thematic mapping.
You can use Layer Control to turn the display on or off for a given thematic layer. The layer it is
based on can continue to display. You can also set individual zoom layers on thematic maps.
Ordering of Thematic Layers
To display thematic layers properly, they must be in a specific order. This is especially important
when you want to display more than one thematic layer at a time. For example, you would want pie
or bar charts for an area map to display on top of regions that are shaded in order to see them.
The following lists the order of map layers from top to bottom (note that map layers are drawn from
the bottom up):
1. Pies, Bars, or Graduated Symbol thematic layer.
2. Dot Density thematic layer.
3. Ranged thematic layer – where Color or Size Attributes are applied.
4. Ranged (or Individual Value) thematic layer – where All Attributes are applied.
5. Major layer or base layer.
6. Grid thematic layer.
When you create a new thematic layer, MapInfo Professional automatically inserts it into its proper
place.
Displaying Thematic Layers
You can turn the display on and off for thematic layers the same way you can for other map layers.
All the display settings in Layer Control are also applicable to thematic layers, enabling you to set a
zoom level for each thematic layer. You can also access the Modify Thematic Map dialog box
through Layer Control by double-click the thematic layer.
MapInfo Professional 10.5
233
User Guide
Chapter 9: Creating Thematic Maps, Legends, and Other Maps
Using Thematic Mapping to Analyze Information
Figure: Layer Control (Showing Thematic Layer above Base Map)
Thematic layers are displayed in the list with this naming convention:
<Thematic type> with/by <variable-list>
The type of thematic map is noted first, followed by the list of variables used to create the map. For
example, a pie thematic layer that uses commuting data is listed this way:
Pies with ComAlone, ComCarpool...
The variable list is truncated if there is not enough room to display each variable in your analysis.
Types of Thematic Maps
With MapInfo Professional you can create seven types of thematic maps:
•
•
•
•
•
•
•
Ranges
Bar Charts
Pie Charts
Granulated
Dot Density
Individual
Grid
Each has its own purpose and unique attributes. For example, using Ranges of Values, you could
thematically shade a map of the world according to population density. You could shade the
countries with graduated shades of red, the darkest red representing the most densely populated
countries, and the palest red representing the least densely populated countries. At a glance you
can see the distribution of the world’s population.
You are not limited to representing numeric values with thematic mapping. Nominal values also may
be shaded thematically. For example, you have a table of underground cables. Those cables that
haven’t been serviced in the past six months are labeled priority status. Using Individual Values, you
can shade the cables according to their repair status. All records with the same value will be shaded
the same. See the individual sections later in this chapter for more information on each type of
thematic map. They offer general information on the methods available for creating thematic maps.
For more information on any of these methods and options, see Thematic Mapping in the Online
Help.
MapInfo Professional 10.5
234
User Guide
Chapter 9: Creating Thematic Maps, Legends, and Other Maps
Using Thematic Mapping to Analyze Information
Ranged Maps
When you create a ranged thematic map, MapInfo Professional groups all records into ranges and
assigns each record’s object the color, symbol, or line for its corresponding range. For example, if
you wanted to visualize the population of the world by growth rate, you would shade countries
according to their reported growth rate amounts.
With the Ranged map feature, MapInfo Professional groups the growth rate amounts into ranges.
For example, in the next table, all countries that had growth rates between zero and one percent are
grouped into one range. Countries that had growth rates between one and 2.2 are grouped in a
separate range. Countries that have rates between 2.2 and 3.1 are in a third range, and those
countries reporting greater than 3.1 are in a fourth range.
Figure: Ranged Map
All records are assigned to a range and then assigned a color based on that range. For example, the
countries with the higher growth rates are shaded in red. The other ranges are shaded in lighter
shades of red to light green and finally darker green. When you display the map, the colors make it
readily apparent which locations have the highest growth rate in relation to their neighbors.
Ranges are also useful when the size of the region is not directly related to the magnitude of the
data values. In our population density example in this section, we see that countries that are small in
size can be very densely populated, and countries that are large in size may not be densely
populated. Differences like these are more readily apparent when the regions are shaded in this
manner.
Types of Ranged Values
MapInfo Professional can create ranges automatically using five methods: Equal Count, Equal
Ranges, Natural Break (Standard Deviation), Quantile, and Custom. To set ranges manually, use
Custom.
Equal Count has the same number of records in each range. If you want MapInfo Professional to
group 100 records into 4 ranges using Equal Count, MapInfo Professional computes the ranges so
that approximately 25 records fall into each range, depending on the rounding factor you set.
MapInfo Professional 10.5
235
User Guide
Chapter 9: Creating Thematic Maps, Legends, and Other Maps
Using Thematic Mapping to Analyze Information
When using Equal Count (or any other range method), it’s important to watch out for any extreme
data values that might affect your thematic map (in statistics, these values are referred to as
outliers). For example, if you tell MapInfo Professional to shade according to Equal Count with this
database:
John
5000
Andrea
7000
Penny
6000
Kyle
5500
Miguel
4500
Angela
7500
Linda
5000
Elroy
6000
Ben
100
Mark
7000
Ben and Miguel are grouped in the same range (since they have the two lowest values). This may
not produce the results you want since the value for Ben is so much lower than any of the other
values.
Equal Ranges divides records across ranges of equal size. For example, you have a field in your
table with data values ranging from 1 to 100. You want to create a thematic map with four equal size
ranges. MapInfo Professional produces ranges 1–25, 25–50, 50–75, and 75–100. (Since ranges use
“=>” and “<=”, they need to overlap.)
Keep in mind that MapInfo Professional may create ranges with no data records, depending on the
distribution of your data. For example, if you tell MapInfo Professional to shade the following
database according to Equal Ranges:
John
100
Andrea
90
Penny
6
Kyle
1
Miguel
4
Angela
92
Linda
95
Elroy
89
Ben
10
Mark
10
MapInfo Professional creates four ranges (1–25, 25–50, 50–75, and 75–100). Notice, however, that
only two of those ranges (1–25 and 75–100) actually contain records.
Natural Break and Quantile are two ways to show data that is not evenly distributed.
Natural Break creates ranges according to an algorithm that uses the average of each range to
distribute the data more evenly across the ranges. It distributes the values so that the average of
each range is as close as possible to each of the range values in that range. This ensures that the
ranges are well-represented by their averages, and that data values within each of the ranges are
fairly close together. MapInfo Professional bases its Natural Break algorithm on the procedure
described by Jenks and Caspall in their article "Error on Choroplethic Maps: Definition,
Measurement, Reduction" from the Annals of American Geographers, June, 1971.
MapInfo Professional 10.5
236
User Guide
Chapter 9: Creating Thematic Maps, Legends, and Other Maps
Using Thematic Mapping to Analyze Information
Quantiling enables you to build ranges that determine the distribution of a thematic variable across
a segment of your data. For example, you can quantile state population by urban population to
illustrate how urban population is distributed across the United States. Your legend will not indicate
that you have used Quantile to build your ranges. You can customize the legend so that it shows
which field you used to quantile the table.
When you create ranges using Standard Deviation, the middle range breaks at the mean of your
values, and the ranges above and below the middle range are one standard deviation above or
below the mean. You can also define your own ranges using Custom.
The Help System contains the following related topics:
•
•
•
•
•
•
•
Creating a Map by a Range of Values
Customizing a Range Map
Customizing the Ranges of a Range Map
Customizing the Styles of a Range Map
Customizing Range Styles and Inflection Points
Customizing the Legend of a Range Map
Modifying a Thematic Map
Bar Chart Maps
Unlike thematic maps for single variables such as ranges of values or graduated symbols, a
thematic bar chart map allows you to examine more than one variable per record at a time. A bar
chart is built for every map object at the centroid of the object, enabling you to analyze the thematic
variables in a particular chart by comparing the height of the bars. You can also examine the same
variable across all the charts in your map.
You can customize the color of each bar, create a frame around each chart, and fill the empty space
inside the frame with a pattern or color. In addition, you can change the bar chart’s orientation, such
as displaying horizontal bars instead of vertical (the default). You can also control where to display
the chart: over the object’s centroid (the default) or any of eight other locations.
You can also change the type of bar chart. In our example, you can create a multi-bar chart, where
each thematic variable has its own bar, or a stacked bar chart with each thematic variable on top of
one another, or a graduated bar chart, where the bars are graduated in size based on some value.
You can also scale the bars in a multi-bar chart independently from one another. To show negative
values in a bar chart map, the bars extend in the opposite direction to the chart’s orientation. Note
that negative values do not display in stacked bar charts.
MapInfo Professional 10.5
237
User Guide
Chapter 9: Creating Thematic Maps, Legends, and Other Maps
Using Thematic Mapping to Analyze Information
Figure: Bar Chart Map
The Help System contains the following related topics:
•
•
•
•
Creating a Bar Chart Map
Customizing Bar Chart Styles on your Map
Customizing the Legend of a Bar Chart
Modifying a Thematic Map
Pie Chart Maps
Thematic maps using pie charts enables you to examine more than one variable per record at a
time. Like comparing the height of the bars in bar charts, in pie charts you compare the wedges in a
single pie, or examine a particular wedge across all pies. Pie charts enable you to compare parts of
a whole.
Both pie and bar charts are particularly useful for analyzing demographic data. For example, you
have a table of demographic information for the United States. Your table shows the populations of
several major demographic groups. Using pie charts, you can show the population of each
demographic group, and see what fraction of the pie it makes up in each pie. This enables you to
see the distribution of demographic groups on a per state basis, or across the entire United States.
MapInfo Professional 10.5
238
User Guide
Chapter 9: Creating Thematic Maps, Legends, and Other Maps
Using Thematic Mapping to Analyze Information
You can also look at one demographic group and see how the population of the group varies in
different states. For best results, use no more than four to six pie wedges per pie chart in your
analysis.
You can customize the color of each pie wedge as well as the borders of the wedges and the whole
pie. You can also specify the angle at which you want to place the first pie wedge, and whether the
variables go in a clockwise or counterclockwise direction. Like bar charts, you can also change the
pie’s orientation. The default is to place the pie over the centroid of the object.
You can choose from graduated pies or half pies. Graduated pies graduate the size of the pies
according to the sum of their components. Half pies distribute your data across half a pie instead.
The Help System contains the following related topics:
•
•
•
•
Creating a Pie Chart
Customizing a Pie Chart
Customizing the Legend of a Pie Chart
Modifying a Thematic Map
Graduated Symbol Maps
Graduated symbol maps use symbols to represent different values. You can use graduated symbols
regardless of the type of map object with which you are working.
For instance, use graduated symbols to show the number of housing units by city. When you select
the graduated symbols option, MapInfo Professional varies the size of each symbol according to the
value in the sales order field.
You can also represent how much interest each customer has expressed in a given product by
assigning a symbol whose size is proportional to the customer’s interest.
MapInfo Professional 10.5
239
User Guide
Chapter 9: Creating Thematic Maps, Legends, and Other Maps
Using Thematic Mapping to Analyze Information
Graduated symbols maps work best when you use numeric data. If you are working with a layer of
restaurants, it makes no sense to create graduated symbols based on the type of cuisine each
restaurant serves. However, graduated symbols are appropriate when you want to show the relative
number of housing units by city as in the next figure.
Figure: Graduated Symbol Map
There are three attributes you can customize on a graduated symbols map: the color, type, and size
of the symbol. To change the symbol’s attributes in Thematic Step 3 of 3, choose Customize
Settings and click the symbol icon in the Customize Graduated Symbols dialog box to access the
Symbol Style dialog box. The default symbol is a red circle.
tIn the Customize Graduated Symbols dialog box, the size of the symbol in the Symbol box is the
size for the value listed in the at Value box. All values between the high value and zero have
interpolated point sizes. If you want the symbols at the low end to be larger, increase the point size.
You can also display symbols for negative data values. To change it, click Options in the Customize
Graduated Symbols dialog box. There is a separate symbol picker so that you can make this symbol
as distinct from the symbol for positive values as you want. When you click the icon a different
Symbol Style dialog box displays, enabling you to choose a different symbol type, change the color
or the size, or change any combination of the three attributes. The default symbol for negative
values is a blue circle, and all values between zero and the low value (a negative number) also have
interpolated point sizes.
The Help System contains the following related topics:
•
•
•
Creating a Graduated Symbols Map
Customizing a Graduated Symbols Map
Customizing the Styles of a Graduated Symbols Map
MapInfo Professional 10.5
240
User Guide
Chapter 9: Creating Thematic Maps, Legends, and Other Maps
Using Thematic Mapping to Analyze Information
•
•
Customizing the Legend of a Graduated Symbols Map
Modifying a Thematic Map
Dot Density Maps
Dot density maps use dots to represent the data value associated with a boundary or region. The
total number of dots in a region represents that region’s data value. If you have 10,000 senior
citizens in a county, and each dot represents 100 senior citizens, there would be 100 dots in the
county boundary.
Dot density is particularly useful for showing raw data where one dot represents a large number of
something: population, number of fast food restaurants, number of distributors who carry a brand of
soda, etc.
For example, if you have a table of age demographics broken down into postal codes, you could use
the dot density option to show the concentration of small children in each postal code boundary.
1
1 Rensselaer County
There are three customizing options for dot density maps. You can specify the value of one dot. For
example, you have a table of population statistics, broken down by county. There are 10,000 preschool students in Rensselaer County, New York. If you display Rensselaer County according to the
number of pre-school students using the dot density method, each dot could represent 200 students.
In that case, there would be 50 dots in Rensselaer County. You can specify the number of units
each dot represents using the Customize Dot Density Settings dialog box.
When you increase the value each dot represents, you decrease the number of dots that display on
the map. You could modify your dot density map so that one dot represents 400 students. In that
case, there would only be 25 dots in Rensselaer County.
A second option is to change the size of the dots according to your needs, either large or small. If
you are working with large populations, or large counts of something, make the dot size smaller so
that the distribution of dots is easier to see.
MapInfo Professional 10.5
241
User Guide
Chapter 9: Creating Thematic Maps, Legends, and Other Maps
Using Thematic Mapping to Analyze Information
Conversely, if your working with a small data set, making the dot size larger might illustrate your
analysis more clearly.
L
Distribution of dots is random within the region. If you shade states according to population,
the dots for New York are spread out throughout the state; they are not concentrated in New
York City, where the majority of the state’s population lives.
Thirdly, in the Customize Dot Density Settings dialog box, change the color of the dot to either red or
black to add more variety to the final map. In this dialog box, you can select Circle or Square dot
thematics and specify the dot density width (in pixels) of the square or circle. In general, squares
look clearer at small sizes. At larger sizes, it may be more appropriate to use circles. You can create
multiple dot density maps on the same layer by varying these options.
In the Creating a Thematic Map - Step 3 of 3 dialog box, select the Customize Settings button to
display the Customize Dot Density Setting dialog box. Here you can change the number of units that
each dot represents, and also select the dot shape (square or circle) size, and color. You can specify
a circle size from 2 to 25 pixels in width. For a square, the size can range from 1 to 25 pixels.
Figure: Customize Dot Density Settings
More Dot Density Choices for Thematic Maps
For thematic maps, you can select Circle or Square dot thematics and specify the dot density width
(in pixels) of the square or circle. In general, squares look clearer at small sizes. At larger sizes, it
may be more appropriate to use circles.
In the Creating a Thematic Map - Step 3 of 3 dialog box, select the Customize Settings button to
display the Customize Dot Density Setting dialog box. Here you can change the number of units that
each dot represents, and also select the dot shape (square or circle) size, and color. You can specify
a circle size from 2 to 25 pixels in width. For a square, the size can range from 1 to 25 pixels.
The Help System contains the following related topics:
•
•
•
•
•
Creating a Dot Density Map
Customizing a Dot Density Map
Customizing the Styles of a Dot Density Map
Customizing the Legend of a Dot Density Map
Modifying a Thematic Map
MapInfo Professional 10.5
242
User Guide
Chapter 9: Creating Thematic Maps, Legends, and Other Maps
Using Thematic Mapping to Analyze Information
Individual Value Maps
Individual Value maps show points, lines, or boundaries that are shaded by individual values
contained in a particular field. You can use both numerical and nominal values in individual values
maps. MapInfo Professional gives each unique value its own color or symbol. When an individual
values map uses symbol types, the symbols are taken from the base table.
For example, a soft drink distributor maintains a table of the supermarkets that buy soft drinks from
him. Each supermarket sells the distributor’s brand of soft drink for a different price. If the distributor
shades the supermarket points by price, using individual values, all stores that sell the soft drink for
49 cents are shaded one color, all stores that sell the soft drink for 51 cents are shaded another
color, and so on. Each unique value is assigned its own color. The distributor is able to see the price
distribution among the supermarkets and can determine where he should increase his sales volume,
based on the price.
If you are shading your points, lines or boundaries using nominal data, you can shade only by
individual values. Nominal data is either non-numerical data (name, type of cuisine served, or brand
of automobile sold) or numeric data where the numbers represent non-numeric data like an ID
number. Dates are considered numeric data and can be used in both ranged and individual values
maps.
For example, you have the results from a consumer survey. One question on the survey reads
“What is your favorite Sunday afternoon activity?” The possible responses are:
1. Sleeping
2. Watching TV
3. Taking a drive
4. Reading
5. Playing or watching sports
MapInfo Professional 10.5
243
User Guide
Chapter 9: Creating Thematic Maps, Legends, and Other Maps
Using Thematic Mapping to Analyze Information
6. Visiting museums or art galleries
7. Going to the movies
You want to shade each consumer point with the response for the favorite Sunday activity. The
SUNDAY column of your table contains the number that corresponds to the consumer’s favorite
activity. However, the numbers in this column do not represent quantitative values. Going to the
movies is not greater than Playing or watching sports even though 7 > 5. When numbers are used
as names instead of values, you must shade your objects by individual values. The numbers are
only used to reference the pastimes so color can be assigned to them.
The Help System contains the following related topics:
•
•
•
•
•
•
Creating an Individual Values Map
Customizing an Individual Values Map
Customizing the Styles of an Individual Values Map
Customizing the Legend of an Individual Values Map
Custom Sort Order for Individual Value Thematic Legends
Modifying a Thematic Map
Important Notes:
When you are creating and merging theme templates:
•
•
•
•
MapInfo Professional saves the custom label order only when the option to Save Individual
Value categories is selected in the Save Theme to a Template dialog box. This implies that
when you create a theme based on a template, MapInfo Professional applies the custom label
order only when the thematic expression creates the same categories as those in the template.
When you are merging theme templates, the custom label order from the source template is
applied to the current theme only when the option to Merge Individual categories is selected in
the Merge a Template to a Theme dialog box and the template and current theme have the same
number of categories.
Saving a Template - The entry for theme templates in the Options > Preferences > Directories
dialog box allows you to designate the directory where theme templates reside.
For more information, see Saving Individual Categories in a Theme Template for an Existing
Thematic Map and Saving Individual Categories in a Theme Template when Creating a
Thematic Map in the Help System.
Grid Surface Maps
A grid surface theme is a continuous raster grid produced by an interpolation of point data. MapInfo
Professional takes a data column or expression from a table and passes those centroids and their
data values to an interpolator. The interpolator produces a raster grid file, which appears as a raster
table in a Map window.
Grid mapping displays data as continuous color gradations across the map. This type of thematic
map is produced by an interpolation of point data from the source table. A grid file is generated from
the data interpolation and displayed as a raster image in a Map window.
The Help System contains these related topics:
•
Working with Grid Thematic Layers
MapInfo Professional 10.5
244
User Guide
Chapter 9: Creating Thematic Maps, Legends, and Other Maps
Creating a Thematic Map
•
•
Spreading Inflections by Equal Cell Count
Modifying a Thematic Map
Creating a Thematic Map
There are many kinds of thematic maps, but the process for creating each type of map is the same.
In this section, we cover the creation of thematic maps in general terms. You can find more specific
instructions for creating specific types of thematic maps in the Help System.
Step 1: Choosing a Type of Thematic Template
Templates allow you to make a thematic map based on values and settings. In our default types, you
can alter these settings and/or save them as a new template you can use again. When you first
create a thematic map, you select a template that you can modify to suit your requirements. You
cannot create a theme without using an existing theme template.
Template Sort by Name
Displays available templates in alphabetical order according to their name.
Template Sort by Time
Displays available templates according to the time they were created or last modified.
Preview Legend Sample (Template Type)
Displays a sample legend for the template type.
Use Customized Legend Text
Displays customized text for the legend. If enabled, the template has custom titles or range labels.
Check to use the custom text.
Cancel Button
Cancels the options dialog box and returns to the map.
Next Button
Continue to next step.
Range Template
Displays your data according to the ranges you set. Ranges are shaded with colors and/or patterns.
Choose from templates displayed as shaded lines, points or regions. Ranged thematic maps allow
you to illustrate data values across points, lines and regions. They are used to show a relationship
between the data values and geographical area (e.g. sales figures, household income) or to present
ratio information such as population density (population divided by area). Ratio information can be
shown in other types of thematic maps when you choose Expression in Step 2.
MapInfo Professional 10.5
245
User Guide
Chapter 9: Creating Thematic Maps, Legends, and Other Maps
Creating a Thematic Map
Bar Chart Template
Displays a bar chart of your thematic variables for each record in your table. Use bar charts to
analyze multiple variables per record on the map. Make comparisons between the size of the bars in
each chart to obtain information about a record in the table set, or compare one bar in all the bar
charts to draw conclusions about a variable across all of the records, or compare the height of the
bar charts to obtain information about the entire table. To indicate a negative value in a bar chart,
bars extend in the direction opposite to the charts orientation. Negative values do not display in
stacked bar charts.
Pie Chart Template
Displays a pie chart of your thematic variables for each record in your table. Pie charts are multivariable. Use pie charts on the map to analyze more than one variable at a time. You can compare
the size of the pie wedges in each chart to obtain information about a record in the table, or compare
one pie wedge in all of the pie charts to draw conclusions about a variable across all the records, or
compare the diameter of the pie charts to obtain information about the entire data set.
Graduated Template
Displays a symbol for each record in your table, the size of which is directly proportional to your data
values. A graduated symbol map shows data points with specific numerical values. It is useful for
illustrating quantitative information, such as high-to-low rankings. The size of the symbols is
proportional to the data values of the points. Points that have larger data values appear larger, and
points that have smaller data values appear smaller.
•
For instructions on creating a Graduated Symbols thematic map, see Creating a Graduated
Symbols Thematic Map in the Help System.
Dot Density Template
Displays the data values as dots on your map, where each dot is equal to a number, and the total
number of dots in a region is proportional to the data value for that region. A dot density map allows
you to examine raw counts of data (e.g. population). Each dot represents a number of units. That
number, multiplied by the total number of dots in the region, equals the data value for that region.
•
For instructions on creating a Dot Density thematic map, see Creating a Dot Density Thematic
Map in the Help System.
Individual Values Template
Shades records according to individual data values. Individual value templates are multi-variable.
Choose from shaded lines, points or regions. A thematic map that draws map objects according to
individual values is useful when you want to emphasize categorical differences in the data rather
than show quantitative information (e.g. types of stores in a given area, zoning classifications in a
given area etc.).
•
For instructions on creating a Individual Values thematic map, see Creating an Individual Values
Thematic Map in the Help System.
Grid Template
Grid mapping displays data as continuous color gradations across the map. This type of thematic is
produced by an interpolation of point data from the source table. A grid file is generated from the
data interpolation and displayed as a raster image in a Map window.
MapInfo Professional 10.5
246
User Guide
Chapter 9: Creating Thematic Maps, Legends, and Other Maps
Creating a Thematic Map
Step 2: Choosing Thematic Values
Choose the map layer on which you want to base the map, and the field or expression from which
you want to obtain the data values (thematic variable).
A thematic variable can be the data value that is associated with the graphic objects (regions, lines,
and points) displayed in your map, such as the values in a column like Pop_1990, Buy_Power, or
Median Age.
You can also obtain your thematic variable from another table using Table > Update Column.
Update Column creates a temporary column in your base table where you can aggregate or
calculate information about your data.
You can also use an expression for your thematic variable. For example, you could use the following
expression to display population density:
Pop_1990/Area(obj, "sq mi")
You can access the Expression dialog box in Step 2 of creating a thematic map. See the Help
topics, Using Expressions in a Thematic Map and Creating Expressions for more information.
Your map may have more than one variable, depending on the thematic method you choose. Pie
and Bar chart maps contain more than one variable; the other five types of thematic maps contain
one variable. Depending on your choice of a one-variable or multi-variable thematic map, one of two
Create Thematic Map- Step 2 of 3 dialog boxes displays.
One-Variable Thematic Maps
Ranged, graduated symbol, dot density, individual value, and grid thematic maps examine one
variable. The Create Thematic Map - Step 2 of 3 dialog box that displays for these kinds of maps
asks you to choose only a table and one field or expression.
1. Choose a table from the Table drop-down list. The drop-down list displays the tables that are
mapped in the active Map window.
2. Choose the table on which you want to base the map.
If you have objects selected in the Map window, the Selection from TABLE item also displays in
the list. This enables you to create a thematic map based on the selected items without having to
map the selection. You can also base your thematic map on a mapped query table.
3. Choose a field from the Field drop-down list. The drop-down list displays all the numeric fields in
the table you selected from the Table list. Choose the field or expression that contains the data
values.
4. Select the Ignore Zeroes or Blanks check box to ignore zero values and blank values in the
table. Because you are creating a thematic map based on one field in a table, any zero or blank
values in that field will cause the whole record to be ignored. If you are creating a grid map, you
can choose a table of regions to clip the grid against.
5. Choose Next to go on to Step 3 - Customizing Your Thematic Map.
MapInfo Professional 10.5
247
User Guide
Chapter 9: Creating Thematic Maps, Legends, and Other Maps
Creating a Thematic Map
Multi-Variable Thematic Maps
Pie and Bar Chart thematic maps allow you to analyze more than one variable at a time. In the
Create Thematic Map - Step 2 of 3 dialog box, you choose the fields or expressions you want to use
as the variables, and list them in an order that best suits your analysis. You can use up to 8 variables
in a bar or pie chart thematic map.
To create a multi-variable thematic map in the Create Thematic Map - Step 2 of 3 dialog box:
1. Choose the table on which you want to base the map from the Table drop-down list. The dropdown list displays the tables that are mapped in the active Map window.
If you have objects selected in the Map window, the Selection from TABLE item also displays in
the list. This enables you to create a thematic map based on the selected items without having to
map the selection.
Fields from TABLE displays all the numeric fields in the table you selected from the Table list.
2. Choose the field, or create an expression that contains the data values.
Fields for Pie/Bar Chart indicates the fields or expressions you have chosen for your pie or bar
chart thematic map. The order of the variables in the Field for the Pie/Bar Chart list is the order
in which the variables appear in the legend.
•
•
For bar chart thematic maps, the order in which the variables display in the legend is the
order in which the bars display from left to right on the map.
For pie chart maps, the first variable in the legend corresponds to the pie wedge that begins
at the angle specified in the Customize Pie Style dialog box.
3. To display the Customize Pie Style dialog box, click Styles in the Create Thematic Map - Step 3
of 3 dialog box.
•
•
•
•
Click Up to move the selected field or expression up one place in the Fields for Pie/Bar
Chart list. Up is unavailable when the selected item is the first item in the list.
Click Down to move the selected field or expression down one place in the Fields for
Pie/Bar Chart list. Down is unavailable when the selected item is the last item in the list.
Click the Right Arrow button to move the selected field in the Fields from TABLE list to the
Fields for Pie/Bar Chart list.
Click the Left Arrow button to move the selected field in the Fields for Pie/Bar Chart list to
the Fields from TABLE list.
4. Choose Next to go on to Step 3.
Step 3: Customizing Your Thematic Map
The last step allows you to customize your thematic map, or create the map based on the default
settings. You can also preview the map's legend before you display the map, and change the
legend's label order. Use these features:
Preview Legend Sample (Thematic Map)
Displays a sample legend of the thematic map you are creating.
Customize
The buttons in the Customize group enable you to change the default settings of particular aspects
of your thematic map. For more information see the Help topic, Modifying A Thematic Map.
MapInfo Professional 10.5
248
User Guide
Chapter 9: Creating Thematic Maps, Legends, and Other Maps
Creating a Thematic Map
Settings
Allows you to customize settings on a ranged map. This option is available for ranged and grid
maps.
Styles
Enables you to customize style attributes such as color and size. This option is available for ranged,
pie, bar, and individual value maps.
Legend
Enables you to customize your legend. This option is available for all types of thematic maps. For
instructions on this process, see the Customizing the Legend of a Thematic Map topic in the Help
System.
Number of Columns
Use this field to indicate the number of columns in which you want the legend entries to display.
Legend Label Order
Determines the order in which range and value labels (for ranged and individual values maps) and
field labels (for all other thematic maps) appear in the legend. If you are creating a ranged map, the
order you specify is also shown in the Customize Range Styles dialog box. Use these entries to
indicate whether the legend entries should display in Ascending or Descending or alphabetical
order. Click Custom to select a custom label order and to enable the Order button.
Order
Use this button to display the Customize Legend Label Order dialog box. Here you can click an entry
in the list and use the Move Up and Move Down buttons to properly position the label entries until
they are in the order you want. Click OK to save the custom order.
Associate Theme with Table
The options you select in this group determine the default theme display for the current map.
Save As Default Theme View
Use this check box to save this theme to the map’s metadata so that the theme you have chosen
displays each time you open the map.
L
To ensure that this feature works, you must set the Automatically Open Default Theme
option in the Map Window Preferences dialog box.
Remove Default Theme View
Use this check box to remove the saved default theme from the map’s metadata.
Template
The buttons in the Templates group enable you to specify a name for a template, save the thematic
map as a template, and when modifying an existing theme merge the thematic map with another
template.
Save As
Displays the Save Theme to a Template dialog box. Type a unique name or select an existing name
and overwrite it. If you overwrite an existing template, you are prompted to confirm this action.
MapInfo Professional 10.5
249
User Guide
Chapter 9: Creating Thematic Maps, Legends, and Other Maps
Creating a Thematic Map
Merge
The Merge button is enabled only when you are modifying an existing theme, not when you are
creating a thematic map.
When you click OK a thematic map is created based on either the default or customized settings.
Customizing the Legend of a Thematic Map
To customize the legend for a thematic map, choose the Legend button in the Create Thematic Map
- Step 3 of 3 dialog box. It displays the Customize Legend dialog box where you can customize the
legend's title, subtitle, fonts, or range labels. You can also specify if you want to display a legend for
this thematic layer.
•
For more information, see Customizing the Legend of a Thematic Map, Showing or Hiding a
Legend, and Deleting a Frame from a Legend in the Help System.
Saving a Theme to a Map Window
To save a thematic map to a Map window’s table, you must select the Automatically Open Default
Theme check box in the Map Window Preferences dialog box.
•
For more information, see Saving a Theme to a Map Window in the Help System.
Thematic Maps as Layers
If you have created a thematic map, it will be listed in Map > Layer Control as a separate layer.
Thematic layer names are indented and display above their corresponding data layers in the layer
list. You can modify the attributes of the thematic map through Layer Control.
L
A Grid thematic layer will not be indented in the Layer Control window; a grid thematic layer
is a read-only layer.
To modify the attributes of a thematic Map:
1. Choose Map > Layer Control. The Layer Control window displays.
2. Double-click the thematic layer. The Modify Thematic Layer dialog box displays.
3. Change the thematic settings, style, or legends from this dialog box.
4. Click OK. The map redraws with your changes.
L
The availability of certain dialog boxes depends on the type of thematic map you are
altering.
For a full discussion of altering thematic maps, see Modifying a Thematic Map.
MapInfo Professional 10.5
250
User Guide
Chapter 9: Creating Thematic Maps, Legends, and Other Maps
Changing the Display Parameters of a Map
Changing the Display Parameters of a Map
Changing a Map's Proportions
When you want to change the proportions of a map, resize the original Map window. MapInfo
Professional automatically transmits that change to the layout frame. You cannot change a map's
proportions by moving the edges of the frame over the map. MapInfo Professional simply resizes the
map, preserving its view.
Changing Your View of a Map
You change a map's zoom level by specifying certain parameters in the Change View dialog box.
To change a map's zoom level do one of the following:
1. Choose Map > Change View. The Change View dialog box displays.
2. Click the Change View button on the Main toolbar. The Change View dialog box displays.
The Change View dialog box allows you to set various parameters of the map including:
3. Display the current zoom, scale or cursor position in the status bar (the default unit of distance is
miles which is specified in Map > Options).
4. Change the zoom, scale, and the center point of the current map view.
5. Behavior of the map when you resize the window.
6. Resize the map to fit the new window, keeping the view the same.
7. Set the map to preserve the current scale, so that resizing the window has the effect of letting
you see more or less of the map.
Resetting the Map Scale
You can use a frame's Frame Object dialog box to size the map so that it has a specific scale. For
example, when you want one inch to equal 50 miles, type 50 into the Scale box, the map is rescaled
so that one inch on the Layout page equals 50 miles.
This example assumes the map distance units are in miles and the Layout paper units are in inches.
To reset the map scale:
1. Click the layout, making it the active window.
2. Double-click the map frame to bring up the Object Frame dialog box.
3. Set the map scale to the desired value.
MapInfo Professional 10.5
251
User Guide
Chapter 9: Creating Thematic Maps, Legends, and Other Maps
Working with Thematic Maps and Legends
Working with Thematic Maps and Legends
This section covers changing and saving thematic map information and thematic legends.
Modifying a Thematic Map
Once you create your theme, it is likely that you will want to change something about it. MapInfo
Professional provides two ways to reach the Modify Thematic Map dialog box where you can
customize a variety of settings, styles, and legend components.
To modify a thematic map, do one of the following:
•
•
On the Map menu, click Modify Thematic Map
Double-click the theme’s legend frame within the legend window to display the dialog box.
When you are modifying a map, a quick way to change a number of settings at once is to change the
template of the current theme.
To merge a template into your current map:
1. On the Map menu, click Modify Thematic Map to display the Modify Thematic Map dialog box.
2. In the Modify Thematic Map dialog box, click the Merge button in the Templates group. The
Merge a Template into the Current Theme dialog box displays with a list of the same type
templates as your theme (all range of values templates, for example.)
3. Choose the new template and click OK to return to the Modify Thematic Map dialog box.
4. Click OK again to display the map with the new thematic template. The settings in this template
will be applied to your theme.
The Merge feature is only available once you have created the thematic map.
Using the Theme Templates
You can use the theme templates for region ranges, region individual values, point ranges, and grid
elevations. Some of the new region range templates are sequential (variations on a particular color
to show intensity), and some are color diverging (starting with one color and moving to other
complementary colors) and each has its purpose. Sequential templates are helpful when you are
showing a progression of data, that is, when the data is straight forward. An example might be
population.
MapInfo Professional 10.5
252
User Guide
Chapter 9: Creating Thematic Maps, Legends, and Other Maps
Working with Thematic Maps and Legends
Figure: Sequential Template Example
Diverging templates are useful when showing data that diverges more dramatically. An example
might be world literacy rates:
Figure: Divergent Theme Example
The areas in green are areas we do not have data for.
Saving Your Thematic Settings
MapInfo Professional provides a way to save your themes and the templates from which you created
them.
Saving Thematic Map Layers
To save your thematic maps, on the File menu, click Save Workspace. A workspace is a listing of
all the tables and settings used in a map. When you open the workspace, MapInfo Professional
opens the tables and re-creates the thematic map. If you close a table or Map window without saving
MapInfo Professional 10.5
253
User Guide
Chapter 9: Creating Thematic Maps, Legends, and Other Maps
Working with Thematic Maps and Legends
your session to a workspace, MapInfo Professional displays the Save Map Objects dialog box and
prompts you to do so. The dialog box indicates what types of objects will be lost (for example,
thematic layers, label layers) if you do not save your session to a workspace. You can turn off the
warning prompt in Map Window preferences.
Saving Thematic Templates
Every thematic map begins with a template from which you can then customize for your particular
needs. These settings can be saved for future use. In the Create Thematic Map – Step 3 of 3,
choose the Save As button in the Template group box. The Save Theme to a Template dialog box
displays. To save your new settings to the existing template, click OK. To retain both the new and
the original template, type a different name into the Name field. To recover any template that ships
with MapInfo Professional, copy it from the \THMTMPLT directory on the product DVD. Templates
have the extension .THM. In MapInfo Professional files are stored on a per-user basis.
For individual value themes you can also save the actual categories in a theme template. For
example, if you choose to build an individual value theme on a table to show land usage, you can
assign a different region style to each type of land usage (commercial, forest, residential, farm land
etc.). You may then want to take those same assignments and apply them to another table. You can
do this by storing the category in a template, it will be associated appropriately when the template is
applied to the second table.
To save individual categories in a theme template when creating a new thematic map or for an
existing thematic map, from the Modify Thematic Map dialog box press the Save As button and
specify a template Name. Check the Save Individual Value Categories box and click OK. A
template is saved that can be used to apply the stored individual categories to a second table. When
you choose Map menu and click Create Thematic Map the template's name will appear in the
Template Name field of the Create Thematic Map - Step 1 of 3 dialog box.
Creating a Theme Legend
To create a theme legend:
1. Display a thematic layer.
2. Choose Map > Create Legend. The Create Legend Step 1 of 3 dialog box displays.
3. Proceed to the Create Legend Step 3 of 3 dialog box.
Only title/subtitles can be set for theme frames. If a theme layer is selected, the title/subtitle
currently set for the thematic legend displays; you may edit these.
The other options are not available. Changing a theme legend's title/subtitle affects all
occurrences of the thematic legend. Additionally, fonts designated in the Create Legend Step 2
of 3 dialog box are not applied to thematic legends.
Using Theme Legends in the Cartographic Legend Window
To use a theme legend in the Cartographic Legend window:
1. Make a thematic map the active Map window and choose Map > Create Legend. The Create
Legend Step 1 of 3 dialog box displays.
MapInfo Professional 10.5
254
User Guide
Chapter 9: Creating Thematic Maps, Legends, and Other Maps
Updating Columns using Thematic Mapping
2. Select the thematic layer as one of the legend frames you want to include in the legend. Select
any other layers you want to include. Click Next. The Create Legend Step 2 of 3 dialog box
displays.
3. Fill in the Legend Properties and Legend Frame defaults. Click Next. The Create Legend Step 3
of 3 dialog box displays.
4. Select the theme frame to edit the title and subtitle(s). Click Finish when you are ready to display
the legend.
Only title/subtitles can be set for theme frames. If a theme layer is selected, the title/subtitle currently
set for the thematic legend displays; you may edit these. The other options are not available.
Changing a theme legend's title/subtitle affects all occurrences of the thematic legend. Additionally,
fonts designated in Step 2 of 3 will not be applied to thematic legends.
Updating Columns using Thematic Mapping
As explained earlier in this chapter, you can use data from another table to construct your thematic
map using Update Column. Update Column creates a temporary column in your base table and
automatically inserts data into it for your map. This data can be a field taken directly from another
table, or aggregated from other data.
For example, you have a table of U.S. state boundaries and a table of U.S. city point locations.
Using ranges of values you want to shade the STATES table according to the percentage of each
state’s population living in urban areas. For MapInfo Professional to calculate this percentage, the
population for the cities must be in the STATES table.
L
Some of the files used in this example may be from the MapInfo Professional Tutorial data
and is only available from the Pitney Bowes Software Inc. web site,
http://go.pbinsight.com/webtutorials.
To create a temporary column using Update Column:
1. Open the base table (USA.TAB) and the city table (USCTY153.TAB).
2. On the Map menu, click Create Thematic Map. The Create Thematic Map Step 1 of 3
displays.
MapInfo Professional 10.5
255
User Guide
Chapter 9: Creating Thematic Maps, Legends, and Other Maps
Updating Columns using Thematic Mapping
3. Choose Ranges and select a template name from the list. This is the style of the thematic map
you are creating. Click Next to display the Create Thematic Map Step 2 of 3 dialog box.
4. Choose USA, since this is the table you want to shade and in the Field drop-down list, choose
Join. The Update Column for Thematic dialog box displays.
Table to Update is already set to STATES and Column to Update is automatically set to Add
new temporary column.
MapInfo Professional 10.5
256
User Guide
Chapter 9: Creating Thematic Maps, Legends, and Other Maps
Updating Columns using Thematic Mapping
5. Select the CITY_125 in the Get Value From Table box. If that is the only other table open,
MapInfo Professional automatically displays its title in the list box.
L
When you create a temporary column for a thematic map, the field must be a numeric
field. This is true for all thematic maps except individual values.
Since in our example, we are looking for the percentage of the population living in urban areas in
the United States, we need to calculate the total of the CITY_125 population; that is, we must
calculate the total of the population of each city in a each state. We need to put that sum into the
temporary column.
6. In the Calculate box choose Sum. In the of box, choose Tot_pop.
To put the data from the CITY_125 table into the temporary column of the STATES table, there
must be a link between the two tables that MapInfo Professional can use to access the data.
MapInfo Professional can often make this link automatically. In this example, both our tables
have a State field.
7. Click Join to display the Specify Join dialog box.
When you choose Join in the Update Column for Thematic dialog box, you can see that MapInfo
Professional has already set up the Specify Join dialog box with the STATE fields from both
tables. If the join were not calculated automatically it would be necessary to specify the matching
fields or geographic join.
8. Choose OK. MapInfo Professional calculates the sum and returns you to the Thematic – Step 2
of 3 dialog box. The Field list box displays the temporary column you created: SumOfTot_pop.
However, before we create the map, we still need to calculate the percentage of the total
population of each state that is urban. That information does not exist as a field in the table, so
you must build an expression to generate it.
9. In the Field drop-down list, select Expression. The Expression dialog box displays.
The expression SumOfTot_pop/Pop_1990 * 100 will give you the answer as a percent.
MapInfo Professional 10.5
257
User Guide
Chapter 9: Creating Thematic Maps, Legends, and Other Maps
Updating Columns using Thematic Mapping
10. In the Type an expression box, type:
SumOfTot_pop/Pop_1990*100
11. Choose Verify to ensure that your syntax is correct, and then choose OK. The Create Thematic
– Step 2 of 3 dialog box redisplays showing the expression you created. Choose Next to go on
to the Create Thematic Map Step 3 of 3 dialog box.
12. Click the Ranges button and choose either Equal Count or Equal Ranges to customize the
ranges, whichever gives you the best representation of your data. Use Round By to round to a
decimal place or whole number. Customize the styles to best illustrate your analysis by clicking
the Styles button. Customize your legend by clicking the Legend button.
13. Click OK to display your map in a Map window.
MapInfo Professional 10.5
258
User Guide
Chapter 9: Creating Thematic Maps, Legends, and Other Maps
Updating Columns using Thematic Mapping
For details about using point or line objects to represent thematic variables, see Bivariate Thematic
Mapping in the MapInfo Professional Help System.
Adding Temporary Columns
Use Update Column to add temporary columns to a table by using data from another table.
To add a temporary column:
1. Open at least two tables.
2. Choose Table > Update Column. The Update Column dialog box displays.
3. Choose the table to which the temporary column will be added in the Table to Update list.
4. Choose the table from which MapInfo Professional will retrieve the update information in the Get
Value from Table list.
5. To add a temporary column, select the Add new temporary column option from the Column to
Update list.
If necessary, specify the information MapInfo Professional will need to associate the data (join)
in the two tables by using their common tabular or graphic data.
6. Choose how to produce the column data by specifying how to calculate the information based on
columns and expressions at the Calculate and of lists.
7. Select the Browse Results check box to display the table with its new temporary column in
browser format.
8. Click OK. The temporary column is added based on the specified information.
When you make changes to the data table, the new temporary column is automatically updated.
To save the table with its new temporary columns, use File > Save As. If the temporary columns
are added to a table in a workspace, the changes are automatically saved when you save the
workspace.
MapInfo Professional 10.5
259
User Guide
Chapter 9: Creating Thematic Maps, Legends, and Other Maps
Working with Legends
The Help System contains the following topics about Bivariate Thematic Mapping:
•
•
•
•
•
•
•
•
•
•
Types of Bivariate Maps
Creating a Transparent Bivariate Layer (Ranged Theme)
Creating a Transparent Bivariate Layer (Individual Value Theme
Setting the Default Behavior of the Replace Layer Style Check Box
Example of Bivariate Thematic Mapping
Using an Inflection Point to Show Distinction
Example of an Inflection Point Map
Controlling the Number of Inflection Values
Applying Rounding Factors to Inflection Values
Spreading Inflections by Equal Cell Count
Working with Legends
Legends are an important part of making your map understandable to your audience. In MapInfo
Professional, you can create two kinds of legends: cartographic and theme legends. Theme legends
are those associated with thematic maps. Cartographic legends enable you to create a legend for
any map layer(s) in your Map window. The combination of the two types makes it possible to provide
cartographic data for all of your map layers.
Creating a Legend Window
You can create a Legend window based on layers in the active Map window.
•
•
•
The first dialog box allows you to select the layers that will appear in the legend window
The second dialog box allows you to set options for each frame in the legend window
The third dialog box allows you to create attribute driven legends, save frame settings to
metadata, create the Legend with joined information.
To create a legend window:
1. Choose Map > Create Legend. The Create Legend - Step 1 of 3 dialog box displays.
The primary function of this step is to choose the layers that will contribute to the legend. The
legend will have one frame for each layer that appears in the destination list box "Legend
Frames". By default, all layers that can contribute to the legend will appear in the “Legend
Frames” list box. The frames will be drawn in the order which they appear in the list, so Up and
Down buttons are provided for reordering.
By default, all layers are selected and appear in the Legend Frames list box. If you want to
choose specific layers for the cartographic legend you are creating use the Remove button to
move the layer name to the Layers list box. Any layer you move to the Layers list box will not be
included in the legend.
L
A layer must contain style attributes to appear in the list box; therefore raster layers are
not included in the list box.
MapInfo Professional 10.5
260
User Guide
Chapter 9: Creating Thematic Maps, Legends, and Other Maps
Working with Legends
2. Complete the Create Legend - Step 1 of 3 dialog box selecting the layers that will contribute to
the legend. Press the dialog box’s Help button for specific dialog box field information.
3. Do one of the following:
•
•
Choose Finish and a legend is created using one frame for each layer listed in the Legend
Frame List box.
Choose Next to display the Create Legend - Step 2 of 3 dialog box.
4. Specify the legend properties and legend frame defaults. Press the dialog box’s Help button for
specific dialog box field information.
5. Do one of the following:
• Click Finish to display the legend.
• Choose Next to display the Create Legend - Step 3 of 3 dialog box.
You can create legends based on unique map styles, or by unique values in an attribute column.
Text descriptions can be generated from attribute columns and/or expressions. Additionally, the
process by which the legend was generated can be saved to the map table metadata as a
default that will be invoked when the legend is next created. The metadata defaults are used to
initialize the Create Legend Step - 3 of 3 dialog box. Override metadata defaults and select your
own settings in the dialog box and save your changes by writing them to the map table metadata
6. Complete the Create Legend - Step 3 of 3 dialog box attributes for each Legend Frame. Click
Finish to display the legend.
•
For more specific information, see Creating a Legend Window and Modifying the Legend
Window Properties in the Help System.
You can save the Legend window to the map table metadata as a default that will be invoked when
the legend is next created. The metadata defaults are used to initialize the Create Legend Step 3
dialog box. To override metadata defaults, select your own settings in the dialog box and save your
changes by writing them to the map table metadata.
What are Cartographic Legends?
Cartographic legends display cartographic data for a map layer. A legend is created for each layer in
your Map window that you choose to include in the legend. Cartographic legends can be displayed
in a layout, expanding MapInfo Professional’s presentation capabilities. You can create a legend for
an individual layer, giving it particular emphasis, or you can place legends for several layers in one
legend window. You can also customize many elements of the cartographic legend and the legend
window, including the window title, legend frame borders, and the legend title and subtitle.
Here is a brief description of how to create a cartographic legend:
1. On the Map menu, click Create Legend. The Create Legend – Step 1 of 3 dialog box displays.
2. Select the layers you want to use in the legend and click Next. The Create Legend – Step 2 of 3
dialog box displays.
3. Specify the legend properties and legend frame defaults and click Finish or click Next to select
and set attributes for each legend frame.
•
•
If you click Finish, your legend displays.
If you click Next, the Create Legend – Step 3 of 3 dialog box displays.
MapInfo Professional 10.5
261
User Guide
Chapter 9: Creating Thematic Maps, Legends, and Other Maps
Working with Legends
4. Specify the legend frames and give titles to them in the fields provided and click Finish to display
your legend. For more details on the options available in the cartographic legend feature, see
Creating a Cartographic Legend on page 317 or see About Cartographic Legends in the Help
System.
Customizing a Thematic Legend
To customize the legend for a thematic map, choose the Legend button in the Create Thematic Map
- Step 3 of 3 dialog box. It displays the Customize Legend dialog box where you can customize the
legend's title, subtitle, fonts, or range labels. You can also specify if you want to display a legend for
this thematic layer.
To customize a legend:
1. Choose File > Open.
2. Choose the map tables with which you want to work.
3. Choose Map > Create Thematic Map to display the Create Thematic Map - Step 1 of 3 dialog
box.
4. Choose one of the thematic style buttons and choose Next. The Create Thematic Map - Step 2
of 3 dialog box displays.
5. Choose the table on which you want to base the shading, and choose the fields or expressions
containing the data values. Different prompts display depending on what type of thematic map
you selected.
6. Choose Next. The Create Thematic Map - Step 3 of 3 dialog box displays.
7. Choose Legend to display the Customize Legend dialog box.
8. Choose the items you want to customize and make the desired changes.
•
For specific instructions, see Customizing a Thematic Legend and Displaying or Hiding a
Floating Thematic Legend in the Help System.
Selecting the Sample Size for a Cartographic Legend Window
You can control the sample legend sizes that appear in Cartographic Legend windows. This feature
does not affect Thematic Legend windows. When creating Legends, the Create Legend window Step 2 of 3 dialog box allows you to select a Small or Large Style Sample Size. When adding
frames to a Legend window, the style sample size is indicated. The default is Large.
MapInfo Professional 10.5
262
User Guide
Chapter 9: Creating Thematic Maps, Legends, and Other Maps
Working with Legends
To change the style sample size of an existing Cartographic Legend window:
1. From the Legend menu, select Refresh to display the Refresh Legend window.
2. Select Refresh Style Sample Size and select either Small or Large.
3. Click OK to refresh the legend.
You can also change the default value for style sample size shown in Create Legend - Step 2 of 3.
In the Legend Preferences window (Options > Preferences > Legends), select either Small or
Large Style Sample Size. The initial default is Large. After changing the preferences, you can
Refresh Styles through the user interface.
MapInfo Professional 10.5
263
User Guide
Chapter 9: Creating Thematic Maps, Legends, and Other Maps
Working with Legends
•
For more information, see Metadata Support for Cartographic Legends in the Help System.
What are Thematic Legends?
Theme legends are created automatically when you create a thematic map. They provide a key of
the colors, symbols, and styles used in the map. Their display is controlled via the Show/Hide
Theme Legend Window command in the Options menu. Use the appropriate command in the Map
menu to modify them (on the Map menu, click Modify Thematic Map), or simply double-click the
legend to display the Modify Thematic Map dialog box. If a theme legend is part of a cartographic
legend, and you click it to modify it, the Modify Thematic Map dialog box displays. Click the Legend
button to modify the legend. For more on theme legends and thematic mapping, see Using
Thematic Mapping to Analyze Information on page 230.
Aligning Thematic Legends and Legend Frames
You can align frames in a thematic legend and align titles within frames in a thematic legend.
Additionally you can align titles and labels in both cartographic and thematic frames in the same
way.
The Help System contains these related topics:
•
•
•
•
•
Selecting Column Alignment Options within a Legend Window
Changing the Number of Columns in a Legend Frame
Selecting Thematic Legend Swatch Sizes
Selecting a Custom Sort Order for Individual Value Thematic Legends
Creating Custom Labels for Legends
Important Notes for Creating and Merging Theme Templates:
When you are creating and merging theme templates:
•
MapInfo Professional saves the custom label order only when the option to Save Individual
Value categories is selected in the Save Theme to a Template dialog box. This implies that
when you create a theme based on a template, MapInfo Professional applies the custom label
order only when the thematic expression creates the same categories as those in the template.
MapInfo Professional 10.5
264
User Guide
Chapter 9: Creating Thematic Maps, Legends, and Other Maps
Working with Grid Surface Maps
•
•
When you are merging theme templates, the custom label order from the source template is
applied to the current theme only when the option to Merge Individual categories is selected in
the Merge a Template to a Theme dialog box and the template and current theme have the same
number of categories.
For more information, see Creating Custom Labels for Legends in the Help System.
Working with Grid Surface Maps
The thematic maps we have discussed are based on vector layers. MapInfo Professional takes
thematic mapping to a new level with a method that displays data as continuous color gradations
across the map. This type of thematic mapping, known as grid mapping or surface theme mapping,
is produced by an interpolating point data from the source table. MapInfo Professional generates a
grid file from the data interpolation and displays it as a raster image in a Map window.
Grid theme maps are appropriate analytical tools in traditional GIS environments and other
industries where the data points have measured values that reflect those locations. For example,
use grid shading to illustrate temperature changes, snowfall amounts, or change in elevation.
The next figure shows the light to dark gradual transition across the United States, which represents
low to high average annual temperatures. The continuous shading allows you to derive
measurements at places other than where measurements were taken.
Figure: Grid Surface Thematic Map
Grid Image Files
Grid mapping produces a file type called a grid image. When you create a grid thematic map using
MapInfo Professional’s grid handler, MapInfo Professional generates a default file name of
tablename_fieldname with the extension .MIG (for example, USELEV_ELEVFEET.MIG). In the Step
2 of 3 dialog box MapInfo Professional displays the path and the root file name, where you can
change it as necessary.
MapInfo Professional 10.5
265
User Guide
Chapter 9: Creating Thematic Maps, Legends, and Other Maps
Working with Grid Surface Maps
MapInfo Professional contains one read/write grid handler and a Grid Engine tool kit that shows you
how to create your own. Once you have written a grid engine, you place this file in your MapInfo
Professional application directory and set the preference in the Map Window dialog box. Specifically,
to set the default grid writeable handler, go to the Map window preferences and specify your grid
handler file. The available handler formats depend on what grid handlers have been installed.
Changing the default grid handler will change the default file extension of the grid file name.
Grid files are stored by default in the data directory specified as a preference. Grid files can be
opened from the File menu, click Open command like other MapInfo Professional supported file
types.
When you open a table that has a grid filename associated with it, MapInfo Professional searches
for the file if it cannot find it immediately. For example, the search capability can simplify opening
tables if your .tab file refers to an image that resides on a DVD drive, and different letters are used to
designate the DVD drive on different systems.
MapInfo Professional uses the following search order:
1. Search for the file where specified by the FILE tag in the .tab file.
2. Search for the file in the same directory as the .tab file.
3. Search for the file in the Table Search path specified in the Directories preferences.
MapInfo Professional either opens the table as though it found the file in the specified location, or it
will report an error because the file could not be found in any location.
Working with Grid Handlers
In addition to the MapInfo Professional read/write grid handler (*.MIG) we also supply READ-ONLY
grid handlers to support the direct opening of the following grid file formats:
•
•
•
•
DEM–USGS ASCII(*.DEM)
DTED–levels 1, 2, and 3 (*.DT0, *.DT1, *.DT2)
GTOPO30 (*.DEM)
MapInfo Vertical Mapper (*.GRD, *.GRC)
You can open these grid file types directly from the Open dialog box. You will see the file extensions
listed next to the Grid Image file type in the Files of Type drop-down list in the bottom of the dialog
box. Because the handlers are read-only, they cannot be used to create grid files during the
thematic mapping process.
If the relief shading option is enabled (Create Thematic Map Step 3 of 3 > Styles > Grid
Appearance), a separate file will be created to store the hill shade information. The hillshade file is
stored in the same location as the grid file and has the same base name as the grid but with the
extension “.MIH”. If the grid file is read-only, for example, it’s located on a DVD, the .MIH files will be
created in the same location as the .tab file. The .tab file will contain a new metadata key, for
example:
"\Grid\Hillshade File" = "d:\tmp\AntiochSouth.MIH"
MapInfo Professional 10.5
266
User Guide
Chapter 9: Creating Thematic Maps, Legends, and Other Maps
Working with Grid Surface Maps
Vertical Mapper Grid Handler
MapInfo Professional also includes the Vertical Mapper Grid handler to enable users who have not
purchased the full Vertical Mapper add-on product to open, view, and print Vertical Mapper Grid
(*.GRD, *.GRC) format files.
The Vertical Mapper Grid files can also be opened directly in MapInfo Professional. The *.GRD or
*.GRC extension is listed with the other Grid Image formats in the Files of Type drop-down list.
Currently, grids using the Vertical Mapper handler cannot be modified in the Modify Thematic Map
dialog box. They are read-only. They must be created or modified in the Vertical Mapper source
application, which is available from Pitney Bowes Software Inc.. In addition, you cannot create .GRD
or .GRC files in MapInfo Professional, however, you can convert *.GRD files to *.MIG files with
GRIDTOOLS.MBX.
The Help System contains these related topics:
•
•
•
•
•
•
•
•
•
Creating Custom Read/Write Grid Handlers
IDW Interpolator
TIN Interpolator
Grid Appearance
Inflection Methods
Relief Shading
Grid Translucency
Final Adjustments
Zoom Layering
MapInfo Professional 10.5
267
User Guide
Buffering and Working
with Objects
Two of the most important features in MapInfo Professional are buffers and the
tools we provide to work with objects. Buffers allow you to create grouping
areas around objects, lines and regions, which is important for providing a visual
analysis. You can edit and manipulate objects in a wide variety of ways. The Set
Target editing model allows you to apply a wide range of editing operations to
an object or a series of objects. Using MapInfo Professional you can also create
territories and create objects. This chapter covers these topics and discusses
the advanced topics of enclosing, checking, and cleaning objects.
Topics in this Section:
Buffering Your Data . . . . . . . . . . . . . . . . . . . . . . . . . . . . . . . . . . . .269
Editing Objects using the Set Target Model . . . . . . . . . . . . . . . .277
Creating Territories by Combining Objects . . . . . . . . . . . . . . . . .285
Creating and Manipulating Objects . . . . . . . . . . . . . . . . . . . . . . .288
10
Chapter 10: Buffering and Working with Objects
Buffering Your Data
Buffering Your Data
If you would like to search for all underground cable wires that are buried within 440 yards of
Interstate 490 or you would like to contact all families with pre-school age children who live within
five miles of a proposed school district, buffering is the tool for you.
Understanding Buffers
A buffer is a region that surrounds a line object, another region, symbol, or any other object in a Map
window. For example, you can create a buffer region that surrounds Interstate 90 by 440 yards on
either side. You can create a buffer region that surrounds the proposed school district by five miles
on all borders. Both the 440 yards and five miles are their respective regions’ buffer radii. The buffer
table is then joined to data associated with the original buffered objects.
L
The maximum buffer resolution is 500 segments per circle. This affects the entry you can
make in the Smoothness field of the Buffer Objects dialog box.
Creating a Buffer
To buffer objects:
1. Select the objects that you want to buffer. Make sure there is an editable layer in the Map
window. The output buffered objects will be placed in that layer.
L
There are certain table variables that you need to be aware of that will determine the
aggregation method used in joining the table of buffers to data associated with the
original objects. See Table Variables for this information.
2. On the Objects menu, click Buffer. The Buffer Objects dialog box displays.
MapInfo Professional 10.5
269
User Guide
Chapter 10: Buffering and Working with Objects
Buffering Your Data
MapInfo Professional 10.5
270
User Guide
Chapter 10: Buffering and Working with Objects
Buffering Your Data
3. Select appropriate buffer radius, segments per circle, distance type calculation to use, and buffer
method as described.
•
•
•
•
•
•
•
Radius — The radius is the width of the buffer you want to create around the object you
selected. The Value and the From Column radio buttons give you different ways to specify
that width.
Value — Type a value into this field if the radius of the buffer you want to create is a specific
distance. Examples might include 10 feet, 20 kilometers, 50 chains.
From Column — Select this radio button if the buffer you want to create is specified in a
particular column or is to be calculated by an expression. Then select the column or choose
Expression from the drop-down list.
If you select Expression, the Expression dialog box displays. Specify the expression you
want MapInfo Professional to use to calculate the buffer radius and click OK to return to the
Buffer Objects dialog box.
Units — Select the units for the buffer from this drop-down list. Options include: inches, links,
feet, US Survey feet, yards, rods, chains, miles, nautical miles, millimeters, centimeters,
meters, kilometers.
Smoothness — Type the number of segments per circle that determines the resolution of
the curves in the buffer polygon. You can enter a number between 3 and 500. The default
value is 12 segments per circle. If making adjustments, a value of 24 yields good results.
The more segments you enter, the smoother the curve. The fewer segments, the more
jagged the curve. More segments produce a smoother curve; fewer segments make a more
jagged curve.
L
•
•
•
•
Creating a buffer is time consuming. The higher the smoothness (more segments),
the longer it takes to create a buffer.
One buffer of all objects — Select this option to create one buffer for all of the objects you
have selected. For example, if you are buffering Pennsylvania, New York and New
Hampshire, one buffer will be created for all three of these objects.
One buffer for each object — Select this option to create one buffer for each object you
have selected. For example, if you are buffering Pennsylvania, New York and New
Hampshire, each object will have a separate buffer.
Buffer Width Distance using Spherical — Select this option if you want the buffer to take
into account the curvature of the Earth. Using this method, MapInfo Professional converts the
data to Latitude/Longitude and then creates a mathematical calculation of the buffer. You
cannot use this method for non-Earth projections.
Buffer Width Distance using Cartesian — Select this option if you want the buffer to be
calculated as if the map is on a flat plane. Cartesian coordinates are a pair of numbers, (x, y),
defining the position of a point in a two-dimensional space by its perpendicular projection
onto two axes which are at right angles to each other. If you are using a Latitude/Longitude
projection, this option is disabled.
4. When you have completed your entries and selections in this dialog box, press the Next button.
The standard Data Aggregation dialog box displays.
L
If the editable layer is the Cosmetic layer, the Data Aggregation dialog box will not display
because there is no data in the layer to aggregate. The OK button displays in place of the
Next button. Press OK to begin the buffer operation.
MapInfo Professional 10.5
271
User Guide
Chapter 10: Buffering and Working with Objects
Buffering Your Data
5. Highlight each of the columns to complete the fields in this dialog box.
•
•
•
•
No Change — Select this option to keep the value for the selected column in the target row
unchanged. This option only displays when you combine objects into a target object.
Blank — Select this option to store blank values in the selected column(s). To store blank
values in all displayed columns, select the No Data check box. Only choose the Blank option
to blank out individual columns.
Value — Select this option to store the value that displays in the edit field in the new row.
When you select this option, enter an appropriate value in the field.
No Data — Check this check box if you want no data aggregated to any column.
6. After setting the appropriate data aggregation parameters, click OK. MapInfo Professional
calculates the buffer according to the parameters you set and creates the new objects in the
editable layer. The original objects remain unchanged. Once MapInfo Professional has created
the buffer region, it puts it in the editable layer.
MapInfo Professional 10.5
272
User Guide
Chapter 10: Buffering and Working with Objects
Buffering Your Data
Table Variables
If the table containing the selected table and the editable table are either the same table, or contain
the exact same table structure (same number of columns with each column in both tables having the
same name and data type), then the Sum and Average radio buttons do not display. The data is
taken from the current selection, and the results are placed in the editable layer.
If the table containing the selection objects and the editable table are different, and the table
structures are different, then the Sum and Average radio buttons are displayed. In this case, the
data aggregation for the editable destination table column is initially blank, and you need to select
the column from the input selection table to derive the data from.
Saving your Buffer as a New Layer
You can create a buffer and save it as a new table (layer) or as part of another layer in your map.
See Saving your Voronoi Polygon as a New Layer in the Help System. This process is also similar to
the Combine Using Column process, except that there is no “Group By” functionality for buffers.
L
The table must be mappable to use this feature.
To create the buffer as a distinct layer:
1. To create a selection to buffer, select the object in the map. This step is not required if you want
to buffer all objects in a particular table.
2. On the Table menu, click Buffer. The Table Buffer dialog box displays.
3. Do one of the following:
•
•
To buffer the selected object, leave the Selection object selected in the Buffer objects in
table drop-down list box.
To buffer objects from a particular table, select the table in the Buffer objects in table dropdown list box.
4. Select the type of table you want to place the buffer into from the Store results in Table dropdown list box. Select one of the following:
• New table — allows you to save the buffer in a new table
• <tablenames> — allows you to save the buffer in one of the currently open tables
After you make this selection, click Next to continue.
L
You cannot save a buffer to the Cosmetic Layer.
MapInfo Professional 10.5
273
User Guide
Chapter 10: Buffering and Working with Objects
Buffering Your Data
5. Do one of the following:
•
•
If you chose the New table option, go to Saving a Buffer to a New Table in the Help System.
If you chose <tablenames>, go to Saving a Buffer to an Existing Table in the Help System.
Buffer Radius
The buffer radius determines the dimensions of the buffer region. For example, if you want to create
a region that covers an area one mile on either side of a freeway, set your buffer radius to 1 mile. If
you choose to use a field from the table or an expression, MapInfo Professional will calculate the
radius of the buffer based on that value.
You can set the radius to be a constant value or you can choose a data value from the table to be
used as the radius. For example, to create buffers around major cities that reflect the size of their
population, choose the population field as the value.
You can go even further to calculate the buffer radius using an expression. For instance, you want to
create buffers around cities showing the population density. Since you do not have a field containing
population density, you will need to write an expression that can calculate density from population
and area. This is no different than writing an expression for thematic mapping or query selection.
Buffering - Setting the Number of Segments per Circle
The number of segments per circle determines the level of detail in the buffer region. The more
segments per circle, the higher the level of detail. The default level is 12 segments per circle.
Buffer Width Distance
MapInfo Professional’s buffering feature calculates the buffer width to create a buffer that is some
measured distance from the outline of the object. This distance is calculated using either the
Spherical or Cartesian method.
Spherical calculations measure distance according to the curved surface of the Earth. This means
that the distance from the boundary of the original object to the boundary of the new buffered object
may vary from node to node.
Cartesian calculations measure distance on data that has been projected onto a flat, X-Y plane. This
produces buffers that are exact in width, as long as the data is not in a Latitude/Longitude projection.
The availability of the Spherical and Cartesian buttons depends on the type of calculation that is
appropriate to the table’s projection. The Cartesian button will not be available if the table is in a
Latitude/Longitude projection. Conversely, the Spherical button will not be available if the table is in
a Non-Earth projection.
Buffer Methods
You can create a single buffer to include all selected objects, or create individual buffers for each
object. There are two ways you can buffer multiple objects at the same time. The first method is to
create one buffer for all objects. Buffers are produced around each input object, and the resulting
buffer objects are combined into a single output object.
MapInfo Professional 10.5
274
User Guide
Chapter 10: Buffering and Working with Objects
Buffering Your Data
The more powerful method is to create one buffer for each object. For example, you have a layer of
satellite offices. You would like to create a five-mile radius buffer around every satellite office
symbol. You select all office symbols (with either the Select All command or Select tool), on the
Objects menu, click Buffer, and select the option to create one buffer for each object. MapInfo
Professional creates five mile buffer polygons around each point. With this method, MapInfo
Professional considers the resulting buffers as individual region objects and does not combine them
into one. Once you create a buffer region, you can search for objects within it, as with any other
boundary.
About Buffer Calculations
Buffer functionality uses a Width setting to create a Buffer that is some measured distance from the
outline of the object. Using Latitude/Longitude data, the perfect buffer width, as defined in native
Latitude/Longitude decimal degrees, may change on different portions of an object. This is because
the width is provided in some flat measurement unit, (for example, miles, meters), and the decimal
degree to measurement transformation will vary depending on the location on the earth. For
example, a mile spans a larger number of latitude degrees as you move toward the poles of the
earth and away from the equator.
MapInfo Professional calculates a native decimal degree width (converting from the input
measurement unit) for one location in the object, typically the center of the bounding box. Thus, the
measured On Earth (Spherical) distance from the boundary of the original input object to the
boundary of the new buffered object may vary slightly from node to node. On small objects the
distance may be negligible. On objects that span a large distance, such as the United States, the
distance variation may be measurable.
In MapInfo Professional, you can produce Cartesian calculated buffers. Using this option, the data is
considered to be in a flat-projected coordinate system, and the measured buffer widths are
calculated using Cartesian distances. This produces exact buffers (as measured by the Cartesian
Distance functions) as long as the data in not in a Latitude/Longitude projection.
Types of Buffers
There are two basic types of buffers that we support in MapInfo Professional.
•
•
Concentric ring buffers allow you to create circles around map object(s) or point(s) and
compute aggregated values for underlying data that occur within each ring. You would use
concentric ring buffers to determine the number of customers within a certain radius of a store or
other location.
Convex hull buffers create a region object that represents a polygon based on the nodes from
the input object. You can think of the convex hull polygon as an operator which places a rubber
band around all of the points. It will consist of the minimum number of points so that all points lie
on or inside the polygon. With convex hull buffers, no inside angle is greater than 180 degrees.
For specific instructions, see Specifying Buffer Calculations in the Help System.
MapInfo Professional 10.5
275
User Guide
Chapter 10: Buffering and Working with Objects
Buffering Your Data
Concentric Ring Buffers
In the Creating a Buffer on page 269, you learned how to create a buffer around one or more
objects. Concentric ring buffers allow you to create multiple buffers of different width (radii) around
an object or a set of selected objects. The Concentric Ring Buffer tool can assist you in creating this
type of buffer.
•
For specific access instructions, see Concentric Ring Buffer Tool in the Help System.
To create concentric ring buffers:
1. In the Map window, select the object(s) you want to place buffers around.
2. On the Tools menu, point to Concentric Ring Buffers and click Create Concentric Ring
Buffers. The Concentric Ring Buffers dialog box displays.
3. To add a ring, specify the radius in the Radius field and click Add Ring. Continue this until you
have added all of the rings you want from the smallest to largest.
4. Select the units of each radius in the Units drop-down list.
5. To set the smoothness of the ring buffer, type a number between 3 and 500 in the Smoothness
field. The larger the number, the smoother and less jagged the curves of the ring.
6. Type the table name and select the path in which you want to store this buffer information.
MapInfo Professional stores the concentric ring buffer information into this table including the
columns containing the ring number, radius value, radius units, area, and area units for each
ring.
7. When you have finished the buffer settings, click OK.
Use the Modify Ring and Delete Ring buttons to change the ring settings, or click Clear All to start all
over and create new concentric rings. To change the style of a buffer ring, select it in the Buffer Radii
list, and use the style buttons to change the fill pattern and line style for the buffer. You can also
collect data within each buffer ring using the Calculate Ring Statistics button.
MapInfo Professional 10.5
276
User Guide
Chapter 10: Buffering and Working with Objects
Editing Objects using the Set Target Model
Convex Hull Buffers
The Convex Hull command provides another means of creating a polygon around a selected object
or objects. Convex Hull is similar to creating a buffer in several ways. Like a buffer, the Convex Hull
command always creates an object from the input objects, and it will place the result objects into the
editable layer. In addition, you have a choice to create one convex hull object from all of the input
objects, or to create one convex hull object for each input object.
The resulting region object(s) are based on the nodes from the input object. The Convex Hull
operation can be thought of as an operator that places a rubber band around all of the points. It
consists of a minimal set of points such that all other points lie on or inside the polygon. Since the
polygon is convex, no interior angles are greater than 180 degrees. No attribute data is aggregated
in this operation. To use Convex Hull, a Map window must be active, it must have an editable layer,
and objects in the editable layer must be selected.
To create convex hull objects:
1. On the Objects menu, click Convex Hull. The Create Convex Hull dialog box displays.
2. Select the type of convex hull objects you want to create. You have two options:
•
•
One output object for all input objects button is the default setting. It creates one convex
hull object around all of the selected objects.
One output object for each input object button creates a convex hull object around each
selected object.
3. Click OK. Your map redisplays. The convex hull object(s) is displayed over the input objects. If
you want to save this data, save the editable table. The convex hull object is selected when it
displays.
4. To change the fill of the convex hull object, do one of the following:
•
•
Double-click it to display the Region Object dialog box. Click the Style icon at the bottom of
the dialog box to display the Region Style dialog box. Make any changes you like and click
OK.
Select the convex hull object, if it is not already, and on the Options menu, click Region
Style. The Region Style dialog box displays. Make the changes you want and click OK.
Editing Objects using the Set Target Model
With MapInfo Professional’s advanced set target editing functionality, you can combine, split, erase
map objects, and overlay nodes using a “Set Target – Apply Action” editing model. This model
allows you to use objects from the same table or another table to create new objects. Sophisticated
data aggregation methods allow you to calculate new data values that match the new objects.
MapInfo Professional 10.5
277
User Guide
Chapter 10: Buffering and Working with Objects
Editing Objects using the Set Target Model
The Set Target editing model in MapInfo Professional allows you to set a map object as the target
for editing, then create a modifying object that will act as the cookie cutter that overlays the target
and performs the editing action on the target. Set Target is located under the Objects menu.
Figure: Buffered retail locations showing market penetration
The Set Target model for editing map objects can be broadly described as a three-step process:
1. Set the object you want to edit as the target.
2. Choose and select another object or objects to act as the modifying object for the editing
operation. You can also create a new object.
3. Perform the edit operation (combine, split, erase, erase outside, or overlay nodes).
A new object (or objects) is created in place of the target object.
The following table describes valid cutter/target objects for supported object processing operations:
Object Type
Split, Erase, Erase
Outside
Overlay Nodes
Cutter
Target
Closed
X
X
Linear
X
X
Cutter
X
Combine
Target
Other
non-target
Target
X
X
X
X
X
X
X
X
X
Text
Points
MapInfo Professional 10.5
278
User Guide
Chapter 10: Buffering and Working with Objects
Editing Objects using the Set Target Model
Object Type
Overlay Nodes
Cutter
Target
Split, Erase, Erase
Outside
Cutter
Combine
Target
Other
non-target
Target
Multipoints
X
X
X
Collections
X
X
X
You are not limited to working with map objects in the same layer. While the target objects must be
in the Editable layer, you can choose the modifying objects from another layer.
The set target process is essentially the same whether you want to combine objects or create new
objects by splitting objects or erasing portions of objects. Each operation is discussed individually in
this chapter.
In addition to creating new map objects, the Set Target model allows you to control how the data
associated with the target object will be transferred to the new object or objects. The next section
discusses a number of data aggregation and disaggregation methods that give you tremendous
flexibility with editing map objects.
•
For specific instructions, see Setting a Map Object as a Target in the Help System.
Understanding Object Size
Many customers use the contouring process to create signal coverage maps, which requires large
object sizes to create highly detailed coverage areas. To accommodate this need, we have
increased the limit on number of nodes and the number of polygons or polylines that can be stored
in objects.
Theoretically, the size of an object is only limited by the amount of memory in the system, but for
practical reasons, a limit is imposed to work within limits of file size and most system memory limits.
Currently, the object size limit is 1,073,741,823 bytes in memory. This limit is imposed so that an
object of this size can be saved into a MAP file. All MapInfo Professional files have a theoretical limit
of 2GB, but due to header size and other required Map file contents, the actual size limit has to be
somewhat less.
The node limit is 134,217,724 nodes in any object. This is the actual number of nodes that can fit
into this 2GB memory size limit. It will be difficult to reach this node limit because memory allocation
may prohibit it. It may not be possible to create a Map this size on a computer being used to
accommodate an object this size; the program may throw an error when you try it.
Keep these notes in mind:
•
•
•
For regions, the theoretical maximum number of polygons in a multi-polygon region or
collection is 20,648,881 polygons that can fit into the size limit for all objects given above.
For polyline objects, the theoretical maximum number of segments in a multi-segment
polyline is 24,403,223 that can fit into the size limit for all objects given above.
For multipoint objects, the theoretical maximum number of nodes is 134,217,724 that can fit
into the size limit for all objects given above.
MapInfo Professional 10.5
279
User Guide
Chapter 10: Buffering and Working with Objects
Editing Objects using the Set Target Model
Aggregating and Disaggregating Data
If you have data attached to map objects that will be edited, you can proportion the data for each
field to match the new object(s). This is called data aggregation or disaggregation, depending on
whether you are combining or splitting objects. MapInfo Professional calculates new data values for
the object depending on how you specify the aggregation or disaggregation.
When combining objects, you can choose from several methods of data aggregation, including:
•
•
•
•
•
Sum – adds the field values from the original objects to create a total for the field in the new
object.
Average – averages the field values from the original objects.
Weighted average – gives more weight to one value over another when averaging. You can
choose a numeric field in your table as the weighting factor or choose area (where the
weighted average is based on the relative geographic area of the regions to be combined).
Value – stores a specific value in the field of the new object.
No Change – maintains the value of the target object in the new object.
When splitting or erasing portions of a map object, you can choose from:
•
•
•
Blank – removes the original value of the target object.
Value – maintains the original value of the target object.
Area proportion – removes a portion of the original value based on the size of the new
object.
With any of the editing operations under Set Target, you can elect not to bring over any data at all by
choosing the No Data check box. You might do this, for instance, if you are only editing map objects
for presentation purposes and do not need any data associated with the objects.
The Data Aggregation (or Disaggregation) dialog box displays after you have set the target, chosen
the modifying object, and chosen an editing operation. In these dialog boxes, you must specify how
you want the data calculated for each field. Once you are satisfied with the aggregation method, you
can carry out the editing operation.
Clipping a Region of a Map
You can use Map > Set Clip Region to isolate a region of a map for display and/or printing. The
clipped region may be a pre-defined map region, such as a state, or you can use a drawing tool to
define a region. Use the Select tool to select a pre-defined region or a region that you defined.
Thematic maps and seamless layers, labels, and points displayed on the map will be included in the
clipped region.
•
For specific instructions, see Clipping a Region of a Map and Setting Clip Region Options on the
Fly in the Help System.
To toggle between the map and the clipped region, you may find it useful to use the Clip Region On
/Off command.
L
To clip a raster image, use an object created in the cosmetic layer, or an object from an
existing vector layer.
MapInfo Professional 10.5
280
User Guide
Chapter 10: Buffering and Working with Objects
Editing Objects using the Set Target Model
•
For specific instructions, see Saving a Clipped Region of a Map in the Help System.
Overview of Combining Map Objects
When you choose Combine, MapInfo Professional performs two operations:
1. MapInfo Professional geographically combines the selected objects. The new object represents
the geographic union of the original objects. Therefore, if you select two adjacent region objects
and choose Combine, MapInfo Professional combines the regions into a single object, and the
border between the regions disappears.
2. MapInfo Professional performs data aggregation. Data aggregation is a process where MapInfo
Professional calculates what the column values for the new object should be, based on sums or
averages of the values of the original objects.
Perhaps you have a table of sales territories, and the table contains demographic information about
the number of households per territory. Using the Combine command, you can combine two of the
sales territories into one, large territory. In the same operation, MapInfo Professional also can
calculate the number of households in the new territory by adding the values from each of the
original territories.
Combining Objects with Set Target
The Combine operation can work in conjunction with the target feature of MapInfo Professional’s
Edit menu. Before you choose Combine, you can select one map object, and designate that object
as the editing target. You can then select additional map objects and choose Combine to combine
the selected objects with the target. If you set a target before you choose Combine, the Combine
operation is more flexible, allowing you to combine objects from different tables.
You should assign a target object if one of the objects you are combining is more important than any
of the other objects. For example, if you want to add small, unnamed islands to an existing
"mainland" region, you should make the mainland region the target object. If you designate the
mainland region as the target, MapInfo Professional is able to retain the mainland region's name
after the objects are combined.
Using Combine with Set Target allows the mainland region to retain its name after the objects are
combined. You can only set one object as the target at a time when using Combine with Set Target.
The modifying object can consist of more than one object.
Keep in mind that the Objects Combine command works with selected map objects. To apply the
combine operation to an entire table, use Select All in the Query menu. To combine into groups
rather than objects, or output to a separate table, use Combine Objects Using Column in the Table
menu.
To combine map objects using Set Target:
1. Select one object in an editable layer to be the target object.
2. On the Objects menu, click Set Target. The object displays in a different style to indicate that it
is the target object.
3. Select (or create and select) one or more map objects from any layer in the Map window. This is
the modifying object.
MapInfo Professional 10.5
281
User Guide
Chapter 10: Buffering and Working with Objects
Editing Objects using the Set Target Model
4. On the Objects menu, click Combine. The Data Aggregation dialog box displays.
5. Choose the appropriate aggregation method (or No Data) for each field in the Destination list.
See the definitions for these methods in Aggregating and Disaggregating Data on page 280.
L
To select more than one field in the Data Aggregation dialog box at a time, use these
keystrokes:
• Shift-click to apply the same method to consecutive fields
• Ctrl-click for non-consecutive fields.
When you have chosen the aggregation methods for each field, click OK.
6. Select one or more columns by clicking in the list at the top of the Data Aggregation dialog box.
7. Choose a data aggregation method: Blank, No Change, Value, Sum, Average, or Weighted
Average. (Depending on whether you specified an editing target, some of these aggregation
methods may not be available.) MapInfo Professional updates the column list in the upper half of
the dialog box to show the chosen method.
•
•
For example, if you choose Average, you are telling MapInfo Professional to calculate the
average of the column values of all the selected objects. This average is stored in the column
of the new row.
Aggregation methods are described below.
8. Repeat steps 6 and 7 for all columns in your table and click OK.
•
To simplify this process, select multiple columns at one time by Shift-clicking and/or Ctrlclicking in the list of columns. If you select multiple columns, and then choose an aggregation
method, MapInfo Professional applies that method to all selected columns.
MapInfo Professional 10.5
282
User Guide
Chapter 10: Buffering and Working with Objects
Editing Objects using the Set Target Model
If your table contains a large number of columns, it can be time-consuming to specify aggregation
methods for all columns. However, MapInfo Professional remembers your aggregation methods for
the remainder of your session; thus, the next time you choose Combine, you do not need to
respecify all aggregation options.
MapInfo Professional computes the new object and displays it as a single object. Use the Info tool to
view the aggregated data (if any) associated with the object.
•
For more information, see Combining Points, Linear, and Closed Objects into a Single Object
and Specifying Collection Object Attributes in the Help System.
Default Data Aggregation Methods
When the Data Aggregation dialog box first appears, MapInfo Professional automatically assigns a
default aggregation method to every column in the table. For numeric columns (Integer, Small
Integer, Float, or Decimal), MapInfo Professional assigns Sum as the default aggregation method.
For all other types of columns, MapInfo Professional assigns Value as the default method.
You could simply choose OK, without changing any of the default aggregation methods. However,
there is no guarantee that the default aggregation methods will produce meaningful results. By
default, MapInfo Professional uses the Sum method for all numeric columns; however, depending
on your data, it may not make sense to total all of your columns.
For example, perhaps your table contains demographic information, such as median income
statistics. If two adjacent regions have different median income values ($30,000 and $35,000), and
you combine the two regions, it does not make sense to total the two values; instead, you should
choose Average or Weighted Average as the aggregation method.
Clearing a Target
If you do not want to edit an object after it has been set as the target, use Clear Target. The object
will no longer be highlighted or marked for editing. An object will also be cleared as a target
automatically if it has been deleted or modified by Combine, Erase, Erase Outside, Split, Overlay
Nodes, or if you have chosen a new target.
To clear a target:
•
Choose Objects > Clear Target.
Combining Objects with Different Table Structures
If the tables you are combining have the same table structure, the process we have discussed in
Combining Objects with Set Target on page 281 works perfectly. When you are working with two
tables with different table structures, the Data Disaggregation options are slightly different. When the
input table has a different table structure from the output table, the Data Aggregation dialog box
displays a Column Name field to accommodate the table structure.
MapInfo Professional 10.5
283
User Guide
Chapter 10: Buffering and Working with Objects
Editing Objects using the Set Target Model
1
1 Column Name field
The Area Proportion radio button is active if the selected field is numeric. Also the Value entry field
is enabled when you select the Value radio button and the drop-down list contains “none”.
Splitting Objects
Splitting Objects allows you to divide the target object into smaller objects, using another object as a
cutter. You can also combine objects into territories using redistricting. For more about the
redistricting process, see Redistricting — Grouping Map Objects into Districts in the MapInfo
Professional Help System. For example, you might use Split to separate a large territory into smaller
units.
You can split either closed objects (regions, ellipses, rectangles, or rounded rectangles) or open
objects (polylines, lines and arcs) using the Split command. You cannot use Split on points or text
objects or to cut objects that are not in editable layers.
•
For specific instructions, see Splitting Objects in the Help System.
Proportioning Associated Data after Using Split
After using Objects > Split, you may want to proportion (disaggregate) the associated data. Data
disaggregation splits the data associated with a map object into smaller parts to match the new map
objects. For instance, you may want to split a state into regions and have the data previously
associated with the entire state proportioned for each new region. When you initiate the Split
command, a Data Disaggregation dialog box appears that allows you to specify how the data will be
proportioned.
Splitting Map Objects Using a Polyline
You can split multipoints and collections, as well as closed objects (regions, ellipses, rectangles, and
rounded rectangles), and linear objects (polylines, lines and arcs) using the Polyline Split command.
As mentioned previously, splitting objects requires that the cutter be a closed object. With Split
Using Polyline, the polyline cutter will first be transformed into a region suitable for the cutter
operation. The region created will be displayed for acceptance. The polyline(s) used as the cutter
MapInfo Professional 10.5
284
User Guide
Chapter 10: Buffering and Working with Objects
Creating Territories by Combining Objects
must be contiguous and non-branching. In general, if the cutter polylines were to be combined, the
result would be a one single section polyline. If the cutters are not polylines, and are not contiguous
and non-branching, then an error will occur, and the operation will be cancelled.
L
•
You cannot use Polyline Split on text objects or to cut objects that are not in editable layers.
For specific instructions, see Splitting MapObjects Using a Polyline in the Help System.
Creating Territories by Combining Objects
Creating territories is one of the most common tasks performed with MapInfo Professional. Most
people create territories by combining two or more smaller regions to create a larger one. Police
departments combine postal code boundaries to create precinct boundaries. Sales managers
combine county boundaries or state boundaries to create sales territories. Political analysts combine
census tract boundaries to create voting districts.
Remember, when you are combining regions, you are also combining the data associated with the
regions. If you combine regions without somehow aggregating the data associated with the regions,
that data will be lost. For some applications, you might not want to save your data. For example, you
are merging census tract boundaries to create school districts. The census tract data is of no interest
to you; you merely want the boundaries. There is no reason to aggregate the data, but you would
want to apportion the demographic data. For most tasks, you’ll want to save the data associated with
the regions.
MapInfo Professional gives you three methods for combining regions.
1. The first method, Combine, works with objects that are selected.
2. The second method, Combine Objects Using Column, is used to combine objects into groups
based on a specified column.
3. The third method, Redistricting, is covered in Redistricting — Grouping Map Objects into
Districts.
Most frequently, the Combine Regions options are your easiest and quickest options for combining
regions and creating territories.
Combining Selected Objects
When you choose to combine objects, MapInfo Professional performs two operations:
•
•
MapInfo Professional geographically combines the selected objects. The new object
represents the geographical union of the original objects and the border between the regions
disappears.
MapInfo Professional performs data aggregation. As described earlier in this chapter, data
aggregation is a process where MapInfo Professional calculates what the column values for
the new object should be, based on sums or averages of the original objects.
MapInfo Professional 10.5
285
User Guide
Chapter 10: Buffering and Working with Objects
Creating Territories by Combining Objects
Your setup of the Layer Control window depends on whether you want to copy the result object to
another layer (and, thus, save the original objects) or combine the objects in the original layer (and,
thus, lose the original objects).
If you want to copy the result object, make the region’s layer Selectable and another layer Editable.
Specify a target object, then select the objects using any selection method and on the Objects
menu, click Combine. This will display the Data Aggregation dialog box where you tell MapInfo
Professional how to combine the data. Fill in this dialog box and click OK to combine the objects to
combine the objects’ data. This method was discussed earlier in this chapter.
If you want to combine objects in the original layer, make sure that the layer is editable, select the
objects in the layer, and on the Objects menu, click Combine. Do not set a target. The Data
Aggregation dialog box displays. After the operation is complete, a new object will be added to the
layer, and the original objects will be deleted.
Combining Objects Using Column
Combine Objects Using Column allows you to modify geographic data to create new map objects
that contain data about the group. This feature is similar to redistricting in that it groups objects
together, but goes beyond redistricting to combine a copy of the relevant objects while leaving the
original objects untouched.
To access Combine Objects Using Column:
1. On the Table menu, click Combine Objects Using Column.
For example, you have a layer of states. You want to combine the state boundaries to create
sales territories. The data record associated with each state looks like this:
SALES_REP
STATE
CUSTOMERS
AVG_SALES
Benita
West Virginia
1782
24231.4
Benita
Ohio
121
33265.0
• SALES_REP: Sales representative assigned to that state
• CUSTOMERS: Number of customers per state
• AVG_SALES: Average spent per customer
You would like to aggregate the data in the following manner:
• SALES_REP: Combine all records that list Benita as the sales representative
• CUSTOMERS Sum up the number of customers in the sales territory
• AVG_SALES: Average the amount spent per customer in the sales territory
When performing a Combine Objects Using Column operation, you must specify which column
contains the grouping information. In the preceding example, the grouping information is located
in the SALES_REP column. We want to combine all of Benita’s individual territories into one
large territory.
1. Choose the appropriate column from the Group Objects by Column popup. In our example, you
would choose the SALES_REP column from the Group Objects By Column popup. MapInfo
MapInfo Professional 10.5
286
User Guide
Chapter 10: Buffering and Working with Objects
Creating Territories by Combining Objects
Professional combines all records that have common data in the column. In other words,
MapInfo Professional combines all records that have the same sales representative.
2. Specify the table and the grouping column.
•
•
If you chose <New> from the Store results in table drop-down list to create a new table for
the combined objects, a series of dialog boxes prompt you to create the new table.
If you specified an existing table, you need to specify how to combine the data. To aggregate
your data, click Next to display the Data Aggregation dialog box.
3. Once you have completed both dialog boxes, press OK. MapInfo Professional combines the
records based on the column specified in the Group Objects By Column list. MapInfo
Professional also aggregates the data and combines any objects associated with the records.
•
For specific instructions, see Combining Object Using Column in the Help System.
Creating a Voronoi Polygon
The Voronoi polygon is a partition of space into cells. Voronoi takes points and produces regions
(cells) as output where each cell contains exactly one point. Each cell is an area in which the
contained points are closer to the enclosed site than to any others. Use Voronoi to generate these
polygons from a designated set of points. It is useful for dividing areas of responsibilities for field
offices or possibly postal zones. It ultimately gives you the areas that are closest to your point of
interest. You can create a Voronoi polygon within the same layer, or select points from one layer and
place the Voronoi polygon in another layer.
•
For specific instructions and additional related topics, see Creating a Voronoi Polygon in the
Help System.
MapInfo Professional 10.5
287
User Guide
Chapter 10: Buffering and Working with Objects
Creating and Manipulating Objects
Grouping Objects using Multipoint and Collection Object Types
The Multipoint and Collection object types allow you to group multiple objects into a single object.
One way to create multipoints and collections is by using the Combine command (on the Objects
menu, click Combine). These object types aid in the translation and live access of other GIS data
formats, such as ArcView Shape Files, and are more compatible with GIS standards. This is
particularly useful for sharing maps with others using different software.
A Multipoint object consists of a number of points that have been grouped into a single object. The
Multipoint object displays in a Browser window as a single record, and all the points within the object
have the same symbol. One method you can use to create a multipoint object is to select a group of
point objects and combine them.
A Collection object consists of multipoint objects, zero or one polyline objects, and zero or one
region objects that have been grouped into a single object.
MapInfo Professional automatically converts homogeneous Collection objects to a more specific
type, for example, a Collection object that contains only polylines is automatically converted to a
multi-polyline object.
•
For specific instructions and additional related topics, see Grouping Objects using Multipoint and
Collection Object Types in the Help System.
Creating and Manipulating Objects
The operations in this section do not make use of a target object to perform analysis or data
aggregation. These tasks use selections to create new objects so that you can perform further
mapping operations on those objects. The results of the operation are placed in the editable layer.
The original objects remain unchanged.
See the Help System for related topics including:
•
•
•
•
•
•
•
•
•
•
•
•
Enclosing Objects
Checking Regions
Cleaning Objects
Snapping Nodes and Thinning Objects
Disaggregating Objects
Erasing Objects
Adding Nodes to an Object
Displaying and Selecting an Object's Nodes
Moving an Object's Nodes
Copying and Pasting an Object's Nodes
Deleting an Object’s Nodes
Checking Regions/Tables for Incorrect Data
MapInfo Professional 10.5
288
User Guide
Stylizing Your Map for
Presentations and
Publishing
Most of us do not get to make maps solely for our own use. We use the maps
we create in MapInfo Professional to create presentations, to publish them on
the web, or to include as part of another document. This chapter will help you
create presentation quality maps and prepare you for printing and exporting
your work.
Topics in this Section:
Changing a Map’s Style . . . . . . . . . . . . . . . . . . . . . . . . . . . . . . . . .290
Labeling Your Map . . . . . . . . . . . . . . . . . . . . . . . . . . . . . . . . . . . . .294
Adding an Adornment to the Map. . . . . . . . . . . . . . . . . . . . . . . . .305
Working with Layouts . . . . . . . . . . . . . . . . . . . . . . . . . . . . . . . . . .306
Creating a Cartographic Legend. . . . . . . . . . . . . . . . . . . . . . . . . .317
Printing and Exporting Your Results . . . . . . . . . . . . . . . . . . . . . .318
11
Chapter 11: Stylizing Your Map for Presentations and Publishing
Changing a Map’s Style
Changing a Map’s Style
Changing the look of the map is an important part of making it more effective. In this section, we
review how to change the way your map looks one piece at a time. For a more comprehensive
change in your map’s appearance, see Create Thematic Maps in the Help System.
Changing a Region’s Style
To change the style of a region:
1. Do one of the following:
•
To change the style of one region, click the region and on the Options menu, click Region
Style from the main menu.
• To change the style of all regions in the same layer, choose Map > Layer Control and click
the layer’s Style Override swatch.
Using either method the Region Style dialog box displays.
This dialog box includes a Preview button when launched from the Layer Control.
2. Make the region changes you want to see in your map window in this dialog box and click OK to
save them.
•
•
•
•
Fill — These are the fill options you have in the Region Style dialog box.
Pattern — Choose a palette for patterns. If you do not want to use a pattern, choose the
letter N, for none; the foreground and background color are disabled. If you choose the solid
black pattern, the background color is disabled.
Color — Choose a color for the object(s)’ foreground. The Sample box displays the pattern
using the foreground color you chose. The foreground color is applied to the part of the
pattern that displays as black. Therefore, to make the object a solid color, choose the solid
black pattern in the Fill Pattern palette and a color from the Foreground Color palette. The
color you chose displays in the Sample box as a solid-colored region.
Background Color — Select the check box to display a background color; clear for a
“transparent” background. Choose a color for the object’s background. The background color
MapInfo Professional 10.5
290
User Guide
Chapter 11: Stylizing Your Map for Presentations and Publishing
Changing a Map’s Style
•
•
•
•
•
•
is applied to the part of the pattern that displays as white. Background color is grayed if you
chose the solid pattern.
Border — These are the border options you have in the Region Style dialog box.
Style — Choose the border line style.
Color — Choose the border line color.
Width — Choose the border line width. In the Pixels field, enter a number from 1-7, each
number represents a line width in pixels. In the Points field, select or enter a point size.
Sample — Displays the sample of the pattern and color selections you have made.
For more information, see Creating Custom Colors in the Help System.
Changing a Line’s Style
To change the style of a line:
1. Do one of the following to display the Line Style dialog box:
•
•
To change the style of one line, click the line and on the Options menu, click Line Style from
the Main menu.
To change the style of all lines in the same layer, choose Map > Layer Control and click the
layer’s Style Override swatch.
This dialog box includes a Preview button when launched from the Layer Control.
2. Make the line style changes you want to see in your map window in this dialog box and click OK
to save them.
•
•
•
•
Style — Select the new line style from the drop-down list.
Color — Choose a color for the line from this drop-down list. The Sample box displays the
pattern using the color and line style you select.
Width (in Pixels and Points) — Choose the line width from one of these drop-down lists. In
the Pixels field, select a width of the line in pixels. In the Points field, select a point size from
the drop-down list, or enter a point size.
Interleaved — If you select a line style that uses multiple passes to create it, MapInfo
Professional enables the Interleaved check box. Keep in mind these notes:
The Interleaved option is not enabled for solid lines
The Interleaved option is not activated for borders
The Interleaved option is not appropriate for all multiple pass lines
MapInfo Professional 10.5
291
User Guide
Chapter 11: Stylizing Your Map for Presentations and Publishing
Changing a Map’s Style
Changing a Symbol’s Style
To change the style of a symbol:
1. Do one of the following:
•
To change the style of one symbol, click the symbol and on the Options menu, click Symbol
Style from the main menu.
• To change the style of all symbols in the same layer, choose Map > Layer Control and click
the layer’s Style Override swatch.
Using either method the Symbol Style dialog box displays.
This dialog box includes a Preview button when launched from the Layer Control.
MapInfo Professional 10.5
292
User Guide
Chapter 11: Stylizing Your Map for Presentations and Publishing
Changing a Map’s Style
2. Complete your selections and entries in this dialog box and click OK.
•
•
•
•
•
•
•
•
•
•
Font — Choose a font from the drop-down list. In addition to the symbol sets, the list displays
any fonts installed on Windows. The Custom Symbols category lists those bitmaps you have
created and saved to the CUSTSYMB directory.
Size — Choose a size or type a different point size. The maximum size is 240 points.
Symbol — Choose a symbol type from the symbol palette.
Color — Choose a color from this list for the symbol.
Reload — Click this button when you have added your own custom symbols to update the
list. If you restarted MapInfo Professional since adding the new custom symbols you do not
need to select the Reload button.
Full View — Click this button to display large images in a separate window.
Rotation Angle — Specify number of degrees the symbol should be rotated; 0-360.
Background — In this box, you can specify a background. Select one of these:
None: Click this option to display no background.
Halo: Click this option to display the symbol with a white border outline.
Border: Click this option to display the symbol with a black border outline.
Effects — In this box, you can specify special effects for the symbol. Not all of these options
display all the time. You can select one or more of these:
Bold: Click this check box to draw the symbol in boldface.
Drop Shadow: Click this check box to draw a drop shadow under the symbol.
Show Background: Click this check box to display the custom bitmap symbol with the
background with which it was created.
Apply Color: Click this check box to replace all non-white bitmap pixels with the color you
select from the Color palette.
Display at Actual Size: Click this check box to display the image at the actual size.
Sample — When you select a symbol style, it displays in this box to show you a sample of
the symbol using the designated selections.
Changing the Text Style
To change the style of text:
1. Do one of the following:
•
To change the style of one text entry, click the text and on the Options menu, click Text
Style from the main menu.
• To change the style of all text entries in the same layer, choose Map > Layer Control and
double-click the layer. In the Layer Properties dialog box, click the Style button on the Label
Display tab.
Using either method the Text Style dialog box displays.
MapInfo Professional 10.5
293
User Guide
Chapter 11: Stylizing Your Map for Presentations and Publishing
Labeling Your Map
2. Make your selections and entries in this dialog box and click OK.
•
•
•
•
Font — Choose a font from the Font drop-down list.
Size — Choose a point size from the Point Size drop-down list.
Text Color — Display the color palette; choose a text color.
Background — In this box, you can specify background options for the selected text. You
can select only one of these options:
None — Set no specific background for the selected text.
Halo — Display the text outlined in a designated color.
Box — Surround the text with a box in a designated color.
Color — Display the color palette; select a color to halo or box the text.
• Effects — In this box, you can specify special effects for the selected text. Not all of these
options display all the time. You can select one or more of these:
Bold — Select this check box to display text in boldface.
Italic — Select this check box to display text in italic.
Underline — Select this check box to display text underlined.
All Caps — Select this check box to display text in all upper case letters.
Shadow — Select this check box to display a grey “drop” shadow under the text.
Expanded — Select this check box to insert double spaces between each letter in the text.
• Sample — The results of the options you choose show in this box.
Click Preview to display your settings on the map, and then click OK to apply them.
Labeling Your Map
The labeling features in MapInfo Professional make it easier for you to display, edit, and save labels.
You can specify whether to display labels automatically when you display the map or display the
map without labels. You can edit automatic labels, use the customizing options to make your labels
unique, and create individual labels with the Label tool. Haloing and positioning options enable you
to get the precise look you want for your labels.
MapInfo Professional 10.5
294
User Guide
Chapter 11: Stylizing Your Map for Presentations and Publishing
Labeling Your Map
Designing Your Labels
The design of the label feature in MapInfo Professional is important for understanding how to create
and manipulate labels on your map. Most important among the design elements are the following:
•
•
•
•
Labels are not drawn to the Cosmetic layer.
Labels are attributes of geographic objects in the map layer. The text is based on data
associated with that object.
Labels are always selectable and editable.
Labels are saved to a workspace.
Labels are attributes of geographic objects in the map layer. They are not drawn to the Cosmetic
layer and they are not Cosmetic objects. Their drawn location is based on the location of the
geographic object’s centroid and additional information such as anchor point and offset controlled in
the Label Options dialog box.
As attributes, labels are dynamically connected to their map objects. If the layer is closed or is made
invisible, the labels no longer display. If the data or geographic information changes, the labels
change. If you create an expression for your labels and change the expression, the current labels
are dynamically replaced with new ones.
Labels are always selectable and editable, so you do not have to make the map layer editable or
selectable to work with them. And, since labels are not Cosmetic objects, you do not have to
remember to make the Cosmetic layer selectable or editable to label your map. They are already
part of the map layer.
Saving labels is easy. Because labels are attributes of the map object, you do not have to remember
to save them to a separate table. Any label edits you have pending, or changes you have made to
the Label Options settings, are easily saved to a workspace.
You can label your map automatically through Layer Control’s Layer Properties dialog box. All global
settings for labels are controlled in the Label Options dialog box.
Choosing the Label Content
When you label your map automatically, or interactively using the Label tool, the content of the
labels is determined by the data associated with the geographic object. You can obtain the labels
from the columns in your table, or the derived result of an expression using the column information.
If the column information or an expression does not suit your needs, you can edit the label content or
type in new text. See Editing Labels on page 303 for more information.
Text you create yourself using the Text tool is a text object and behaves like other objects you draw
on your map such as squares and circles. Although labels are no longer text objects, text objects are
still useful for additional map annotation such as titles. For information on text objects, see Working
with Text on the Map on page 169.
The Autolabeler tool, available from the Tool Manager (on the Tools menu, click Tool Manager),
creates labels as text objects in the Cosmetic Layer. This application may be useful if you need to
create labels that can be transferred to a permanent table. In addition, you can create text objects
and convert labels into text objects using another tool from the Tool Manager set, the Labeler tool,
which is explained later in this chapter.
MapInfo Professional 10.5
295
User Guide
Chapter 11: Stylizing Your Map for Presentations and Publishing
Labeling Your Map
Labeling with a Column
The content of labels is controlled in the Label with drop-down list in the Label Options dialog box.
You can label an object with any column from its associated table. For example, you can label the
STATES table with the state name, abbreviation, 1990 population, or any other field in the STATES
table. Simply choose a column from the list, and the objects in that layer will be labeled with the
information contained in that column.
L
You can only set a Label with expression on a single layer. After selecting multiple layers in
the Layer list, the Label with list disables and shows a message that says Mixed.
Labeling with Expressions
You can also label objects with an expression. Select Expression from the drop-down list in the
Label Options dialog box. Create the expression in the Expression dialog box. You can type the
expression directly or use the drop-down lists to create it. For example, you want to label the
countries of Africa with their name and population density on two lines. Your table contains the
country names and population figures for each country. To figure the population density, divide
population by each country’s area. You can let MapInfo Professional calculate the area of each
country using the Area function in the Expression dialog box. To create the expression, in Layer
Control, double-click the Africa layer and click the Label Display tab. Select Expression from the
Label with drop-down list. The Expression dialog box displays. Using the drop-down lists, create the
following expression:
Country + Chr$(13) + POPULATION / Area(Object, “sq mi”)
The Chr$(13) function adds a carriage return to the first line. Using the Label tool, click a country.
MapInfo Professional labels it with the result of the expression.
•
For instructions and examples of this topic, see Creating Labels using Expressions in the Help
System.
Saving Labels to a Workspace
Both automatic and interactive labels are saved as part of a workspace.
To save your objects:
1. Choose File > Save Workspace. The Save Workspace dialog box displays. The Save
Workspace dialog box allows you to save information about the tables and windows used in your
current session.
2. Select the drive, folder, and file where you want the workspace saved.
3. Type a name for your workspace.
4. Click Save.
MapInfo Professional 10.5
296
User Guide
Chapter 11: Stylizing Your Map for Presentations and Publishing
Labeling Your Map
Packing a Table with Customized Labels
Note that packing a table that contains customized labels can corrupt the labels. For example, you
delete one or more rows from your table and save the table. Then you create a map with customized
labels and save the labels to a workspace. You pack the table to purge the deleted rows. Since the
Pack command closes the Map window, you’ll need to reload the workspace. When you do so, your
labels are corrupted.
This problem occurs most often when the deleted rows are located near the top of the Browser. To
avoid the problem, pack the table before you create the labels.
Using AutoLabeling
In addition to label content, you control the position, display and look of automatic labels in Layer
Control. The settings in the Label Options dialog box allow you to set conditions for displaying
labels, in what style they will display, and in what position for all the objects in the layer.
Controlling Label Display
The Auto Label attribute in Layer Control is off by default for all map layers.
To activate labels for a layer(s):
•
Select one or more layers in the Layer Control window and then click the Automatic Labels
icon. The map redraws with labels for your layer selections.
You can easily turn the display of automatic labels on or off. In Layer Control, by clicking Automatic
Labels. Any settings you have specified in the Layer Properties dialog box on the Label Display tab
are deactivated. You can also click Off in the Visibility group on the Labeling Rules tab. Either way,
when you go back to your map, the labels no longer display. These settings also apply to labels you
have edited.
To make changes to the labels of a selected layer:
1. Double-click a layer in the Layer Control window. The Layer Properties dialog box displays.
MapInfo Professional 10.5
297
User Guide
Chapter 11: Stylizing Your Map for Presentations and Publishing
Labeling Your Map
2. Click the Label Display and Labeling Rules tabs to select the appropriate options for your new
labels.
3. Click OK to save your changes.
Options on the Label Display tab include the following.
•
•
•
•
•
•
•
Label with – Choose the column that you want reflected in the label. You can only set a Label
with expression on a single layer. After selecting multiple layers in the Layer list, the Label with
list disables and shows a message that says Mixed.
Text Style button – Click the Text Style button to display the Text Style dialog box.
Translucency – Use this slider bar to indicate the translucency of the selected object.
Translucency can be set between 0-100%. A 0% translucency is completely opaque (or cannot
be seen through). A 100% translucency is completely transparent (or completely invisible).
Label Lines – Select a line type, or no line type, to attach the label to the anchor point.
None – Do not display a line with the label.
Simple – Create a callout by using a simple line that connects the label to the anchor point.
Label lines display after you move the label from where it was originally created.
Arrow – Create a callout by using an arrow and line that connects the label to anchor point.
Label lines display after you move the label from where it was originally created.
MapInfo Professional 10.5
298
User Guide
Chapter 11: Stylizing Your Map for Presentations and Publishing
Labeling Your Map
•
Default Position buttons – Use the default position (Anchor Point) buttons and the label offset
to specify the label’s placement. The anchor point is the label’s position relative to the map
object.
Click one of the buttons to select an anchor point. The default anchor point varies with the type of
map object you are labeling: Regions default to Center, Lines default to Above Center, and
Points default to Right.
Anchor
Point
Button
Position
Description
Upper Left
Places the label above and to the left of the anchor point.
Upper Center
Centers the label directly above the anchor point.
Upper Right
Places the label above and to the right of the anchor point.
Left
Places the label directly to the left of the anchor point.
Center
Centers the label at the anchor point.
Right
Places the label directly to the right of the anchor point.
Lower Left
Places the label below and to the left of the anchor point.
Lower Center
Centers the label directly below the anchor point.
Lower Right
Places the label below and to the right of the anchor point.
The anchor point is an ongoing attribute of the label. For example, if you anchor a point
object’s label at Center Left and you increase the label’s font size, the text will grow to
the left. This way, the text can never overwrite the point.
•
•
Horizontal labels – Select to display all labels horizontally.
Rotate label with segments – Select to run the label text parallel to the line segment. Using this
option, a horizontal polyline would display parallel horizontal labels and a vertical polyline would
display vertical street labels.
MapInfo Professional 10.5
299
User Guide
Chapter 11: Stylizing Your Map for Presentations and Publishing
Labeling Your Map
•
Curve labels along segments – Select to display the label along the curve of the polyline or arc
segment.
L
•
If you are working with a layer that has line objects such as a street map, select Rotate
labels with line or Curve labels along segments to position the labels along the lines.
Label offset – Designate number of points (a measurement of text size) label should be placed
from the anchor point.
L
The label’s anchor point and offset move a label with respect to its current location and
the current zoom. Whenever you want to make minor adjustments to the label’s position,
you should use these two options.
Options on the Labeling Rules tab include the following.
•
•
•
•
Visibility On – Check to allow display of labels.
Visibility Off – Check to prevent display of automatic labels; labels added using the Label Tool
will display.
Maximum number of labels – Enter the maximum number of labels that will display; labels are
selected from the designated table in the order in which they are entered in the table. For
example, if the designated table is the States table, and you enter 10, the first ten states listed in
the table will be labeled.
Display only within zoom range – Select to display labels within a specified zoom range, much
the same way that you display map layers within a certain zoom range. When labeling a dense
table of streets such as a StreetPro Display layer, only a few of the streets will be labeled when
the map is zoomed out.
L
•
•
•
•
•
•
•
When a layer is outside of its zoom range, the layer name is dimmed and there is an
asterisk (*) beside the Visible On/Off check box. If the zoom range is set to Display only
within zoom range and the map's zoom level is out of the label's min/max zoom range,
then the Automatic Labels do not display in the map.
Min Zoom – Specify the minimum distance at which the selected layer is visible.
Max Zoom – Specify the maximum distance at which the selected layer is visible.
Discard Overlapping Text – Select to remove labels that overlap each other.
When overlaps occur try other positions – Select to avoid overlapping labels and display more
label options. When labels would overlap, MapInfo Professional tries to place conflicting labels in
other positions around the object the label is describing.
Allow overlapping text – Select allow labels to be drawn on top of each other. Some labels do
not display because they overlap labels that are have been given higher priority on the map.
Allow duplicate text – Check to allow duplicate labels for different objects to display, for
example, Portland, OR and Portland, ME. This option is also used with street maps to label
street segments individually.
Label partial objects – Check to label polylines and objects whose centroids are not visible in
the Map window. This feature only applies to autolabels. Also, when you customize a label, the
location of the label will not change.
MapInfo Professional 10.5
300
User Guide
Chapter 11: Stylizing Your Map for Presentations and Publishing
Labeling Your Map
•
Curved labels may extend beyond line by – Use this slider bar to indicate the amount a label
may extend beyond the end of a line (such as a street) The default amount is 40%.
L
You must set this value for each polyline layer whose labels you want to extend. You can
set the same or different extensions for each layer, as is appropriate for your data. This
feature is not available for the Horizontal labels or the Rotate labels with segments
placement options.
You can also select and drag a label to move it, but this is not recommended because you are
actually moving the label location on the map. If you drag a label a few pixels, the distance you move
it is in the current map units, regardless of the zoom. For example, if you are displaying a map of the
United States and drag New York state’s label a few pixels, at that zoom, the label looks fine.
However, if the Map Units distance is in miles and you zoom in on New York state, the label will
display much farther away than at the previous zoom.
In a table sorted alphabetically by street (like the StreetPro Display layer) this often means that
streets with names beginning with A, B, or C are almost the only labeled streets on your map.
Labeling effectively gives a small side street like “Aberdeen Street” priority over “State Highway 177”
or other major roads that might actually be useful in navigating or orienting a viewer. This will be
true for any dense StreetPro Display layer.
A Note Affecting Label Priority
Labels display following the order of records in the table. To change the order of priority for
displaying labels, save a copy of the table, sorted in order of priority—most important record first—
and use that table for labeling instead of the original.
•
•
See Using Curved Labels for more information in the Help System.
See Set Font Anti-Aliasing Options for Labels for more information in the Help System.
Creating Call Outs
Callouts are labels with lines pointing to the objects they are labeling. They are very useful when
there are many labels in a relatively small area. For example, if you are labeling a map of Europe,
where there are many small countries that are relatively close together, you can use callouts to
make the labels easier to read.
1. Choose Map > Layer Control to display the Layer Control window.
2. Click the Editable
icon to make the Cosmetic Layer editable.
3. Click the Text button in the Drawing toolbar.
4. Position the Text tool where you want the arrow or line to point and type the text you want as the
call-out.
5. Double-click the text with the Select tool. The Text Object Attribute dialog box displays.
MapInfo Professional 10.5
301
User Guide
Chapter 11: Stylizing Your Map for Presentations and Publishing
Labeling Your Map
6. Choose Simple Line or Arrow Line.
L
Arrow Line has an arrow at one end of the line. A Simple Line does not.
7. Click OK.
8. Select the text object and position it where you please. A line is drawn from the new position of
the text object to its original position.
L
You can double-click the text and set the label line in the Text Object dialog box.
Label Styles
The Text Style dialog box gives you a number of choices for label and text object styles. You can
also change the styles of multiple selected labels at a time.
To make style changes for all the labels, click the Style button in the Label Options dialog box to
display the Text Style dialog box.
To change the styles of a selected label or labels, select the label(s) and either on the Options
menu, click Text Style, or click the Text Style button in the Drawing toolbar to display the Text Style
dialog box. If you change the styles of multiple labels at once, hold down the Shift key as you select
each label.
Make the style changes you want. When you return to the map, the selected labels display with the
style changes you specified. The available styles are explained in the next table.
Option
Description
Bold
Uses bold text to create the label.
Italic
Uses italic text to create the label.
Underline
Places a line underneath the text.
All Caps
TEXT DISPLAYS IN ALL CAPITAL LETTERS.
Shadow
Creates a shadow behind the text. (not shown)
Expanded
A space is placed between each character in the label
o r t e x t o b j e c t.
There are also three background options.
•
•
•
Click None to have no background.
Choose Halo to create a halo effect around the text. This puts the text into relief from
whatever it covers (for example, part of a region, or a street, etc.).
Click Box to create a background box behind the text.
MapInfo Professional 10.5
302
User Guide
Chapter 11: Stylizing Your Map for Presentations and Publishing
Labeling Your Map
When you choose either the Box or Halo backgrounds, the Color list is activated. Click it to display
a palette of colors for the halo or the background. The color you choose corresponds to the button
that is currently activated. The color displays in the box and in the Sample. Click OK to accept a
color.
Labeling Interactively
Although you will probably do most of your labeling automatically, you will need interactive labeling
to edit and create individual labels.
Editing Labels
It is very easy to edit individual labels, either those you have displayed automatically or those you
have created interactively with the Label tool. Using the Select tool, double-click the label. The Label
Style dialog box displays. The changes you make in Label Style dialog box apply only to the
selected label. Changes you want to apply to all the labels must be done through Label Display tab
and Labeling Rules tab in the Layer Properties dialog box (choose Map > Layer Control and
double-click on a layer in the list).
.
The Label Style dialog box allows you to make changes to the text, position, and angle of the labels.
You can also make changes to callouts, add, or delete them.
To change the label content, simply type the new label text into the Text box. The other controls in
this dialog box work the same way as in the Label Options dialog box.
Moving a selected label is the same as moving other objects; simply drag them with the mouse. If
you move a label that has a callout, the line will reappear automatically after you move the label.
You can also rotate the label manually about its anchor point. When you select the label, use the
rotation edit handle that appears to the lower right of the label.
•
For more information, see Moving Labels You Created Manually in the Help System.
MapInfo Professional 10.5
303
User Guide
Chapter 11: Stylizing Your Map for Presentations and Publishing
Labeling Your Map
Using Text Objects as Labels
While labels in MapInfo Professional are attributes of the map layer, text objects look like labels but
behave like other annotations you draw on the map. They are stored in the Cosmetic layer, and you
can save them to a table.
The Labeler tool in the MapInfo Professional Tool Manager helps you use text objects to perform
several common labeling tasks:
•
•
•
Convert labels into text objects, so that they can be saved in a permanent table.
Create labels for only the currently-selected objects.
Draw text objects one at a time using the Text Label button. This allows you to create
multiple annotations for a single map feature, which is something you cannot do using labels.
Creating Labels with the Labeler Tool
Use the Labeler tool to create individual labels. First, make sure that the layer containing the objects
you want to label is selectable. Click the Labeler tool to activate it, and click a map object. MapInfo
Professional labels the object with the column or expression you specified for that layer in the Map
menu, point to Layer Control. Double-click on the layer to display the Layer Properties dialog and
make changes on the Label Display tab and Labeling Rules tab. Remember that InfoTips are active
for the Labeler tool, so you can view the object’s label before you actually label the object.
•
For more information about the Labeler tool, see the Tools section of the Help System.
Saving Labels
Whenever you manually edit automatic labels (including deleting using the Edit menu, and click
Clear or press the Delete key), change the settings on automatic labels, or create labels with the
Label tool, you will need to save your map to a workspace to have them display in your next session.
For example, label settings are deactivated by default. click the Automatic Labels icon in Layer
Control to display automatic labels on your map and do not save the change when you close the
table. The next time you display your map, the labels do not display because the settings go back to
the defaults. As with the other Layer Control options, label settings are temporary unless you save
the table to a workspace.
Manually edited labels and labels created with the Label tool behave differently. These are edits to
the table, not temporary settings. If you close a window or a table and you have label edits pending,
MapInfo Professional will specifically prompt you to save the session to a workspace.
This also applies to labels you have deleted using the Edit menu, click Clear or press the Delete
key. You may not have any labels visible on your map, but because deleting a label is an editing
operation, MapInfo Professional will ask you if you want to save the edits to a workspace.
•
For more information, see Removing Labels in the Help System.
MapInfo Professional 10.5
304
User Guide
Chapter 11: Stylizing Your Map for Presentations and Publishing
Adding an Adornment to the Map
Adding an Adornment to the Map
MapInfo Professional provides map adornments, such as scale bar, to place and anchor in a map or
layout window. The scale or geographic position of the map does not affect the position or size of an
adornment, so it remains stationary when zooming or panning the map. However, the properties and
visual representation of an adornment, such as a map scale, may change as the map projection or
scale changes.
Adornments are drawn as the topmost elements on a map, on top of any labels and on top of the
cosmetic layer. Adornments may display with a border and a background. You can move
adornments anywhere on the map by clicking and dragging them with the mouse cursor.
You can pre-set adornment properties, such as the default position and style, in the Map
Preferences dialog box, Options > Preferences > Map Window, under the Adornments tab.
Adding a Scale Bar to Represent Map Scale
The map scale bar shows the scale of map representation relative to the portion of the Earth’s
surface it displays. The scale bar also has the option to show the cartographic scale of the map.
About Map Scale
A map represents a portion of the Earth's surface, so each map has a scale that indicates the
relationship between a distance on the map and the distance on the ground. The scale is a ratio or
representative fraction (RF). It can be expressed as 1/100,000 or 1:100,000. In this example, one
centimeter on the map equals 100,000 centimeters (1 kilometer) on the earth. It also means that one
inch on the map is equal to 100,000 inches on the land (8,333 feet, 4 inches or about 1.6 miles). Or
even 1 paperclip on the map is equal to 100,000 paperclips on the ground. Common RFs include
1:63,360 (1 inch to 1 mile) and 1:1,000,000 (1 cm to 10 km).
In MapInfo Professional, a map scale that does not include distance units, such as 1:63,360 or
1:1,000,000, is called a cartographic scale.
Maps are often known as large scale or small scale. A large scale map shows greater detail and has
a larger representative fraction (RF) of 1:50,000 or greater (for example, 1:10,000). A small scale
map shows more of the earth’s surface and has a small RF, such as 1:250,000 to 1:7,500,000. Maps
between 1:50,000 to 1:250,000 are an intermediate scale. Maps of the world that fit on to a normal
sheet of paper are very small scale, about 1 to 100 million.
The scale bar adjusts as you zoom and pan the map to accurately reflect the new map view.
See the Help System for these related topics:
•
•
•
Adding a Scale Bar to the Map
Adding a Cartographic Scale to the Scale Bar
Resetting the Scale Bar or Cartographic Scale Value
MapInfo Professional 10.5
305
User Guide
Chapter 11: Stylizing Your Map for Presentations and Publishing
Working with Layouts
Working with Layouts
Once you have created the perfect map, MapInfo Professional gives you the tools you need to
create high-quality presentations or output. Using the Layout window, you can create and customize
a page layout that shows off your maps, browsers and graphs.
.
What is a Layout Window?
MapInfo Professional’s Layout window is a page layout feature that allows you to combine your Map,
Browser and Graph windows on a page and arrange them for output. You can add any currently
open window to the layout and move and resize it to find the best look to show off your work. Add
text such as titles and labels to pull the entire presentation together.
While you can print individual Map, Browser, and Graph windows directly without the Layout window
(on the File menu, click Print), you can only print a thematic legend by first adding it to a Layout
window. You can also print the data contained in the Info tool, statistics and message windows from
the Layout Window.
The Layout window is available as soon as you open MapInfo Professional. On the Window menu,
click New Layout window to access it. When the Layout window is active, MapInfo Professional puts
a Layout menu on the menu bar, allowing access to a number of layout features.
When you add your windows to the Layout window, MapInfo Professional places them inside layout
frames. Using frames to hold your maps and browsers allows you to resize and reposition your
windows with ease. The contents of the frame match the contents of the corresponding Map,
Browser or Graph window.
The Layout window provides dynamic linking between it and a parent window. For instance, if you
change the zoom in a Map window, that map will be updated in the Layout window once you make
the Layout window active again.
MapInfo Professional 10.5
306
User Guide
Chapter 11: Stylizing Your Map for Presentations and Publishing
Working with Layouts
The rest of this chapter is devoted to learning how best to create a layout, move around in the
Layout window, and customize your layout using a variety of options.
Working in the Layout Window
The Layout window functionality includes a number of options to help make it easier to design and
create your layouts.
Adding a Maximized Window to a Layout
You can put a maximized Map window into a frame in a Layout. The frame object’s dimensions are
created according to the Map window’s size instead of the page layout size. MapInfo Professional
also allows the map’s image to completely fill the frame, preserving the map’s center and zoom
settings. If you double-click on the frame, you will notice that the Frame Object dialog box has a
check box: Fill Frame with Contents. This allows the map image to fill the entire frame. The box is
checked by default for all Map windows in frames.
Aligning Objects in the Layout Window
To align one or more objects in the Layout window:
1. Do one of the following:
•
•
•
Choose one object
Hold down the Shift key and click several objects
In the File menu, click Select All to select all of the objects in the Layout
2. Choose Layout > Align Objects. The Align Objects dialog box displays. Use the dialog box's
drop-down lists to specify your vertical and horizontal settings.
3. Choose the desired horizontal and vertical settings.
4. Click OK. The selected objects align according to the settings you specified.
L
Your alignment settings are saved from one use to the next within a session. Be sure to
check both the vertical and horizontal settings before you click OK.
Getting Around in the Layout Window
The Layout window includes a rule along the top and left side of the window to assist you when
resizing and positioning frames. To hide the rule, on the Layout menu, click Options. The Layout
Display Options dialog box displays. Clear the Show Rules check box.
If you are creating a multi-page layout, MapInfo Professional displays the page breaks by default. If
you wish to turn off the page breaks, clear the Show Page Breaks box in the Options dialog box.
Controlling Zoom Level
MapInfo Professional displays the Layout window at a zoom level that is a fraction of the actual size
of the printed layout. The zoom level is represented as a percent of actual size in the lower left
corner of the status bar.
MapInfo Professional 10.5
307
User Guide
Chapter 11: Stylizing Your Map for Presentations and Publishing
Working with Layouts
In order to better position or resize layout objects, you may want to change the zoom level of the
Layout window to see more detail. Keep in mind that you are changing the overall zoom of the
Layout window, not the zoom of individual windows in frames. (If you want to change the zoom level
on a frame containing a Map window, change the zoom for the Map window itself.)
There are four ways to change the zoom level of the Layout window:
•
•
•
•
Use the Zoom-in and Zoom-out tools. These tools work exactly as they do in the Map window.
You can click the Layout window with the tools or draw a marquee box around the areas of the
Layout window.
On the Layout menu, click Change Zoom to set the zoom. You can set the zoom anywhere
between 6.3% and 800%.
Use the number keys (1–8) on your keyboard to set the zoom level. As the numbers increase,
the zoom increases geometrically. For example, press 1 to get a zoom of 6.3%, press 2 to get a
zoom of 12.5%, and press 3 to get a zoom of 25%. (Remember to use the number keypad, and
make sure Num Lock is on.)
Use the View commands in the Layout menu: View Actual Size, View Entire Layout,
Previous View.
Ordering Overlapping Objects
You may add enough windows to the Layout window to cause objects to overlap one another. In the
Layout window all objects are ordered from front to back. Think of them as being stacked in the
Layout. When you draw a new object, it is automatically the front most object, even if it is not
overlapping any other objects in the layout. To display your objects properly, you may need to bring
an object forward in front of other objects.
You can use the Bring to Front and Send to Back commands to change the order of objects. Click an
object with the Select tool. Choose the Bring to Front option to move the object into the foreground.
Choose the Send to Back object to move the object into the background.
When you select an object using the Ctrl key along with the Select tool, MapInfo Professional
selects the object one layer down. Selecting again chooses the next layer.
Before You Create a Layout
The first step in generating quality output is creating good Map windows. MapInfo Professional is set
up to do a great deal of on-screen data entry, object editing, geocoding, and geographic analysis.
There are many windows available to work with that can be easily arranged on the screen. When
you prepare any MapInfo Professional window for output using a Layout window, you must change
the way you think of using MapInfo Professional.
For example, in a MapInfo Professional session, if you want two views of a map, you may simply use
the Grabber tool and shift to a different location, and then return via Map menu (click Previous
View). To get two views of the same map for a Layout, you must have two separate Map windows.
There are many techniques that can be used to prepare the windows to make output easier.
MapInfo Professional 10.5
308
User Guide
Chapter 11: Stylizing Your Map for Presentations and Publishing
Working with Layouts
Creating Multiple Views of the Same Map
One very popular way to display maps is to have a detailed map with an inset of an overview map
representing the general area. For example, government planners have a detailed flood plain map
thematically shaded for an area around a major city. They want to include an inset map showing the
location of that city in relation to the entire region. We can simulate this exercise with the
WORLD.TAB table included with MapInfo Professional.
L
Some of the files described in this example may refer to MapInfo Professional Tutorial data,
which is available on the Pitney Bowes Software Inc. web site,
http://go.pbinsight.com/webtutorials.
To create multiple views of the same map:
1. Open the WORLD.tab and WORLDCAP.TAB tables from the MapInfo/Data/World directory. The
tables display in a Map window.
2. Choose the area you want to show in detail and zoom in on it. The Map window contains the
detailed view.
3. As stated previously, there must be a separate Map window for each view you want to include in
a layout. Instead of re-opening the tables to re-create the Map window, on the Map menu, click
Clone View to create a duplicate Map window.
4. A new Map window displays. Zoom out on this map to create the overview map.
MapInfo Professional 10.5
309
User Guide
Chapter 11: Stylizing Your Map for Presentations and Publishing
Working with Layouts
The new Map window is independent of the original Map window. You may add or
remove layers without changing the original map.
Getting Labels Right for your Layout Window
There are many considerations in getting labels to look good on your maps. As with changing views
of the map, there is a significant difference between using labels in a MapInfo Professional session
and using them in a layout. Labeling in a MapInfo Professional session is best handled by clicking
Automatic Labels for a layer in Layer Control.
When you create a map to place in a Layout window, you usually need to spend more time making
your labels look aesthetically pleasing. It is also more likely that you will want to save these labels to
a separate layer. With the default labeling, label styles can be changed; however, customized labels
are not saved in their own layer for future use or editing. To create labels that can be easily saved,
use AUTOLABEL.MBX or LABELER.MBX. These MapBasic applications allow you to create labels
that can be saved to a separate layer for future use.
For instructions on using the AutoLabeler tool, see the Tools section of the Help System.
Creating a Layout Window
Creating a layout involves adding your Map, Legend, Graph, and Browser windows to the Layout
window, positioning these items where you want them, and adding any annotations such as text and
titles so that your final layout presents the message you want to send.
You bring your windows into the Layout window by adding them to placeholders, or frames. A frame
is a graphic object through which you can view a window. Each frame may contain the contents of
one Map, Graph, Browser, or Legend window.
MapInfo Professional 10.5
310
User Guide
Chapter 11: Stylizing Your Map for Presentations and Publishing
Working with Layouts
First, decide what you want to put in the Layout window. You can choose whether you want to
display all, some, or none of your open windows.
To create a Layout window:
1. Choose Window > New Layout Window.
When no windows are open, MapInfo Professional creates a blank Layout. When there are
windows open, MapInfo Professional displays the New Layout Window dialog box.
2. Choose one of the options.
Situation
Description
One Frame
for Window
MapInfo Professional places a single open frame in the center of the layout. You
select the contents of this frame through the drop-down menu that lists all open
windows.
If you choose a Map or Graph window from this list and there is an active map
legend, MapInfo Professional automatically places the legend in the layout. You
can reposition or delete this legend from the layout. Legends are positioned in the
same way as Map, Browser, and Graph windows. Their relative locations are
preserved on the screen.
Frames for
all Currently
open
Windows
This option tells MapInfo Professional to place all open windows in the layout.
Since MapInfo Professional places windows in the approximate location and size
as they appear in the MapInfo Professional window, you should arrange and size
the windows before you bring them into the layout.
No Frames
If you prefer, you can create a blank layout by choosing the No Frames option. If
you do not have any windows open, choosing New Layout Window automatically
creates a blank layout. The New Layout Window dialog box does not display.
Since a frame is a graphic object, you can:
• Reposition it using the Select tool.
• Change its fill, and the line style of its border.
• Copy or cut the frame and paste it into another Layout window.
You can also position frames so that they overlap one another or overlap other graphic objects.
To change which window is displayed in a frame, double-click the frame with the Select tool. Use
the drop-down list in the Frame Object dialog box to change the frame’s contents.
1. Click OK. MapInfo Professional opens and displays that Layout.
When MapInfo Professional first opens a Layout, it sets the page size and orientation (portrait or
landscape) according to the current setting for your printer. The current setting for your printer is
determined by the printer specifications designated in Options > Preferences > Printer. You can
change the printer settings for the active Layout window through File > Page Setup, or by using the
Set Window Printer command in the MapBasic window. When you later open that Layout when the
printer setup is different, the Layout uses the page size and orientation for that printer setup. The
sizes and positions of objects in the Layout are the same, but the way the Layout is broken into
pages is different.
MapInfo Professional 10.5
311
User Guide
Chapter 11: Stylizing Your Map for Presentations and Publishing
Working with Layouts
After you create a Layout, that Layout is the currently active window. MapInfo Professional places
the Layout menu item on the menu bar. Use the Layout menu to choose your layout options.
Adding a Maximized Map Window to a Layout
You can place a maximized Map window into a frame in a Layout. The frame object’s dimensions
are created according to the Map window’s size instead of the page layout size. MapInfo
Professional also allows the map’s image to completely fill the frame, preserving the map’s center
and zoom settings. If you double-click the frame, you will notice that the Fill Frame with Map check
box in the Frame Object dialog box is checked. This allows the map image to fill the entire frame.
The box is checked by default for all Map windows in frames.
Adding a Map to a Layout
After you have created a layout, you may decide that you want to add other maps to it. You do not
have to create a new layout to do this. You can create frames by hand to contain other windows.
Use the Frame tool to draw window frames where you want them. The Frame tool is available
whenever the Layout window is active.
To add a window to a layout you are already working with:
1. Click the Frame button in the Drawing toolbar and the cursor becomes a small cross.
2. Move the cursor to where you want to begin drawing.
3. Click and hold the mouse button and drag the cursor diagonally until the dashed box outlines the
area where you want the frame.
4. Release the mouse button. When there are no windows open, an empty frame displays with "No
Window" inside. When there are one or more open windows, the Frame Object dialog box
displays.
MapInfo Professional 10.5
312
User Guide
Chapter 11: Stylizing Your Map for Presentations and Publishing
Working with Layouts
This dialog box is slightly different for each type of frame. The Map Scale options are
only available when you select a Map window in the frame.
L
The Fill Frame check box does not display for Browser, Cartographic Legend, and Graph
windows.
The Frame Object dialog box allows you to change the width, height, and center of the frame and
to set a specific scale for a map. When there are several windows open on the screen, MapInfo
Professional displays its choice in the Window drop-down list. This list allows you to choose
which window you would like in your frame.
5. In the Window drop-down list, select the window you want to add and review the options for
creating this frame.
•
•
Bounds X1, Y2 and X2, Y2 — Use these fields to define the x and y boundaries for the new
frame. When you change bounds entries, the Center, Width, and Height entries change
accordingly. When you change the bounds entries, the Map Scale changes as well.
Center X, Y — Use these fields to define and adjust the center point of your new frame.
L
•
•
When you make a change to the Center X or Y entries, the Width and Height bounds
do not change.
Width, Height — Use these fields to adjust the width and height of the new frame.
Change Map Zoom — Click this radio button to implement the correct map scale without
changing the size of the frame. This option changes the zoom of the actual Map window so
that the Layout frame is in the correct scale. This option is selected by default. Type the scale
MapInfo Professional 10.5
313
User Guide
Chapter 11: Stylizing Your Map for Presentations and Publishing
Working with Layouts
you want within this frame in the Scale. The units are set by the Paper Unit setting in the
System Preferences dialog box.
For example:
Map Scale = Scale field entry x (Frame width / Map window width)
L
Changing the map scale with this option will not change the values in the Bounds
fields or the Width and Height fields because there is no change to the size of the
frame, only the look of the map within the frame. To undo the change to the map
zoom, return to the Map window and click Previous View.
6. Select one of these options:
•
•
Resize Frame — Click this radio button to change the size of the frame based on the data
you enter into the Scale field. When you change this entry, the bounds, Center, Width, and
Height entries change accordingly.
Fill Frame with Contents — Click this check box to display as much of the Map window as
fits in the frame. When you do not select this button, the frame may be only partially filled but
it will have the same contents as the window it contains.
7. Click OK to choose MapInfo Professional's choice and that window is placed into the frame.
8. Choose a window from the dialog box's Window drop-down list.
9. Click OK and the window is placed in the frame.
L
When you click the Change Map Zoom or Resize Frame radio button, you set your
selection as the default for the rest of the session. If you change it during the session, the
change becomes the default.
Once you have created a frame, you treat it much like any other graphic object. You can change its
size and position, its line style and fill pattern, and you can cut, copy, and paste it.
•
You can access instructions for making a frame transparent in the Help System.
Using Legends in a Layout
You can use both cartographic and theme legends in your layout. Both types of windows display in
the layout at the same size as they do on the MapInfo Professional desktop.
When you resize a legend frame to make it smaller, it crops the legend rather than shrinking it to fit.
The text styles (for example, font, size) used in the cartographic and theme legend windows are
preserved in the layout.
Adding a legend to the Layout window is a different process, depending on the type of legend. You
can add a theme legend to a layout even when no theme legend displays in the MapInfo
Professional desktop.
To do this, make sure the Layout window is active and click the Frame button.
1. In the Layout window, click and drag to draw the frame for your theme legend. When you release
the mouse, the Frame Object dialog box displays.
MapInfo Professional 10.5
314
User Guide
Chapter 11: Stylizing Your Map for Presentations and Publishing
Working with Layouts
2. In the Window drop-down list, select the theme legend and click OK. The theme legend displays
in the layout frame. This is also how you add other types of windows on your desktop to the
current layout.
In cartographic legends, you must create the legend on your desktop (on the Map menu, click
Create Legend) before you can add it to the Layout window.
Moving Frames in a Layout Window
Once you have brought in the windows you wish to include in the layout, you can reposition or resize
them to create a professional looking product.
To move a frame:
1. Click the frame with the Select tool and hold down the mouse button.
2. When the cursor becomes a four-headed arrow (after about one second), drag the frame to the
new location and release the mouse button.
Aligning Objects in a Layout Window
MapInfo Professional includes a command to help you perfectly align objects in the Layout window.
You can align objects to each other horizontally and vertically or to the Layout window itself.
Choose the objects you want to align and on the Layout menu, click Align Objects. The Align
Object dialog box displays.
Specify the appropriate vertical and horizontal alignment. Choose from the following options:
Horizontal Alignment
Vertical Alignment
Don’t change alignment
Don’t change alignment
Align left edges of
Align top edges of
Align center of
Align center of
Align right edges of
Align bottom edges of
Distribute
Distribute
Each alignment can be performed with respect to each object or to the entire layout. When you
choose the entire layout, the objects are aligned with respect to the top, bottom, left, and right edges
or margins of the layout.
If you want to align objects with respect to each other, the objects are aligned with respect to an
imaginary rectangle, called the bounding rectangle, that completely encloses the objects. The
horizontal and vertical settings you choose position the objects at the top, bottom, left, right, and
horizontal or vertical center lines of the bounding rectangle, rather than at the edges of the layout.
The Distribute option tells MapInfo Professional to distribute the vertical and horizontal space
between objects evenly. You can perform multiple alignments in one layout.
MapInfo Professional 10.5
315
User Guide
Chapter 11: Stylizing Your Map for Presentations and Publishing
Working with Layouts
•
For more examples, see Examples of Aligning Objects in a Layout Window in the Help System.
Setting the Map Scale for a Layout Window
One of the most difficult tasks in generating good output is setting the scale of the map. There are
two ways to set the map scale. The first method is to choose Map menu and click Change View.
This scale setting affects the on-screen scale of your map according to your monitor size. This scale
setting isn’t used as often, because generally the scale on screen does not need to be exact. Use
the on-screen scale when you are making a presentation that will be viewed directly in MapInfo
Professional.
L
The Map Window Preference setting Use Cartographic Scale affects the entries in the
Change View dialog box.
Accurate scale is more important on the printed map. To get the correct scale for output, you must
coordinate the Map window with the Layout window. You must also decide on the desired end result.
For example, you may want a map that has a 1:25000 scale and fits in a nine inch Layout frame. If
this is the case, you will have to alter the zoom level of your map to fit these conditions. Or, in the
case where you must show a set distance across the map, you may have to allow for a larger page
size. The following two formulas will help you set the right map zoom, scale, and frame width.
Limiting Frame Size When Setting the Layout Scale
The following formula calculates the zoom that must be set in your Map window in order to have a
map meet set scale and frame width criteria.
((Frame Width in Inches * Scale)/12) /5280 = Map Zoom in Miles
For example, you need to make a map that will be in a scale of 1:24000 and fit in an eight inch
frame. You need to determine the zoom level that will accommodate the map scale and frame width.
Calculate the following:
((8 * 24000) / 12) / 5280) = 3.03
On the Map menu, click Change View and enter 3.03 miles as your new zoom level.
Limiting Map Zoom when Setting the Layout Scale
The following formula calculates the number of inches to make the frame for a map in order to meet
set scale and zoom level criteria.
(Map Zoom in Miles * 5280 * 12) / Scale = Necessary Frame Width
For example, you need to make a map that will be in a scale of 1:100000, and you must view a
twenty mile zoom level. You need to determine the frame size that will accommodate the scale and
zoom.
Calculate the following:
(20 * 5280 * 12) / 100000 = 12.67
MapInfo Professional 10.5
316
User Guide
Chapter 11: Stylizing Your Map for Presentations and Publishing
Creating a Cartographic Legend
Your frame needs to be 12.67 inches wide. If your printer is not large enough to handle this, change
your layout size to spread over two pages.
•
For more information, see Creating a Simple Scale Bar in the Help System.
Cloning a Map View
You can create a second view of your map with the Clone View command. Clone View creates a
duplicate Map window that you can then alter to create a different view of your map, for example, a
street map of a city and a zoomed in view of a major intersection, or use a different kind of thematic
analysis for each view. It is particularly useful when you are creating a Layout and you want to
present side-by-side views of the same location.
L
Cloned windows in a workspace are written as MapBasic commands to the .WOR file. These
command statements cannot exceed 32,000 bytes.
Now that you have completed your professional looking layout, printing is a simple matter.
Creating a Cartographic Legend
You can utilize the cartographic legend feature in a variety of ways. This feature enables you to
create a legend for any map layer(s) in your Map window. Many of the elements in the
cartographic legend and legend window can be customized, allowing you to enhance your map
presentation. You have the added proficiency of being able to use the table metadata in your
cartographic legend text as well as save legend attributes to the metadata. You are also able to
align all of the legend frames in your Map window. Furthermore, the cartographic legend feature
has the ability to join tables “on-the-fly”, thus allowing you to obtain legend feature descriptions
from another table while you are creating the legend.
What is a Cartographic Legend?
Cartographic legends are based on the map layers in your Map window. Each legend in the legend
window corresponds to a layer on the map, and each legend is enclosed in a legend frame within the
legend window. The attributes for each legend frame, such as the title and label styles can be
derived from several sources. These are:
•
•
•
•
Map table metadata
Map table attributes
Joined tables
Manual creation
A legend frame is another way to refer to a particular layer’s legend. You can create an individual
legend window for each layer in your map, or you can have several legend frames in one legend
window. The properties for each legend frame can be edited individually.
•
For instructions, see Creating a Cartographic Legend or Changing a Cartographic Legend in the
Help System.
MapInfo Professional 10.5
317
User Guide
Chapter 11: Stylizing Your Map for Presentations and Publishing
Printing and Exporting Your Results
Steps to Creating a Cartographic Legend
To create a legend, follow these steps:
1. Selecting Layers
The layers listed in the Legend Frames group of the Create Legend – Step 1 of 3 dialog box are
all the layers that will be included in your legend. All the layers in your Map window are included
by default.
2. Defining Window Properties and Frame Defaults
In Step 2 of the Create Legend wizard, you specify the settings for your Legend window and the
default settings for the legend frames.
3. Legend Attributes
The Create Legend wizard allows you to create attribute-driven legends. This makes creating
text descriptions easier because they can be automatically generated from values in an attribute
column. In addition, the process by which the legend is generated can be saved to the map table
metadata in the underlying map layer, or from a joined table. The metadata is then used as the
default attribute settings for the selected legend frame. These settings can be different for each
frame. The metadata defaults override the Legend Frame defaults in Step 2 of the wizard. If no
metadata keys exist in the table, the Legend Frame defaults from Step 2 are used as the default
values.
•
For more information and related topics, see Creating a Cartographic Legend and Saving
Legend Attributes to Metadata in the Help System.
Printing and Exporting Your Results
This section covers the printing and exporting options in MapInfo Professional.
Printing Your Project
When you need to create presentation materials, you can print out the MapInfo Professional layouts
you have created.
Page Setup
First check that your page setup is what you want. Any changes to the page setup will likely affect
the layout, so it is a good idea to view the effect of the changes on your layout before printing. On the
File menu, click Page Setup. Here, you can specify the page orientation (portrait or landscape) and
margins. You can also specify the paper size and its source.
In addition, you can override your default printer setting and choose a different printer for this print
job. Click the Printer button to display the Page Setup dialog box for your printer. The printer that
initially displays is the default printer that you set in the Printer preferences (on the Options menu,
point to Preferences and click Printer). This will either be the Windows default printer, or the
MapInfo Professional preferred printer that you selected. Make any changes you want to the printer
and its properties, and click OK. The settings available in the Printer Properties dialog box will vary
according to the printer you are using.
MapInfo Professional 10.5
318
User Guide
Chapter 11: Stylizing Your Map for Presentations and Publishing
Printing and Exporting Your Results
Printing Options
Changes you make to these settings override the default settings from the Output Preferences.
When you are ready to print:
1. Make sure the Layout window is active. On the File menu, click Print. The Print dialog box
displays.
2. Choose the number of copies you want to print and whether you want all pages or a specific
range of pages to print. As in the Page Setup dialog box, the Print dialog box also allows you to
override the default printer settings.
3. Click the Name drop-down list in the Print dialog box to select a printer. All of the printers
available on your system display in the list. You can specify printer properties here as well, plus
specify whether to print to a file.
4. To use the advanced print settings to take advantage of additional output options that help you
control transparency and color, particularly for raster images, click the Advanced button. The
Advanced Printing Options dialog box displays.
a. Indicate using which print Output Methods would you want to print your Layout:
Print Directly to Device — Click this option to print your image file directly from MapInfo
Professional. This check box is checked by default.
Print Using Enhanced Metafile (EMF) — Use this option to generate an enhanced metafile
of your MapInfo Professional image before sending it to the printer. This option takes
advantage of current technology to shrink the spool size and print your file quicker without
sacrificing quality.
Output Method/Print Using Offscreen Bitmap (OSBM) — Click this option to generate an
offscreen bitmap of your MapInfo Professional image before sending it to the printer.
Offscreen bitmap is invoked depending upon the type of translucent content in the map and
enhanced rendering state of the window. However, setting OSBM from this window means
that while printing Offscreen bitmaps (OSBM) will be selected regardless of the translucency
and anti alias settings.
MapInfo Professional 10.5
319
User Guide
Chapter 11: Stylizing Your Map for Presentations and Publishing
Printing and Exporting Your Results
b. Indicate how you want to handle transparency. If you have transparent vector fill patterns and
symbols, check the Internal Handling for Transparent Vector Fills and Symbols box to
have MapInfo Professional handle the transparency internally.
If you are using transparency in a raster image, clear the Use ROP Method to Display
Transparent Raster box to have MapInfo Professional handle the transparency internally.
The image will be broken down into small rectangular regions that do not contain
transparency. It is recommended that you check this option because printers do not always
handle transparent raster images correctly. This method may produce large plot files.
c. If you are using 24-bit, true color raster images, select the Print Raster in True Color When
Possible check box, and select a dither method from the Dither Method list.
L
The Print Border for Map Window check box is not available for Layout windows.
You can control the border for each frame by selecting the frame and setting by
selecting the Options menu, clicking Region Style.
d. Click OK to return to the Print dialog box.
5. Click OK to print.
More and more often, users want to export their maps electronically to files rather than print them.
Exporting a Layout
The easiest way to make electronic copies of maps and layouts from MapInfo Professional is to use
the Save Window As command. You can export to Windows Bitmap, Windows Metafile, Windows
Enhanced Metafile, JPEG File Interchange Format, JPEG 2000, Portable Network Graphics Format,
Tagged Image file Format (TIFF), CMYK, and Photoshop 3.0. When using the Save Window As
command, keep in mind that all additions and edits must be made in the Map window. When you
have the Map window the way you want it, then create the Layout window. You can use the
advanced export options to produce better quality output. The same transparency and raster options
are available when you print your Layout as when you export the Layout. Click the Advanced button
in the Save Window As dialog box to display the Advanced Exporting Options dialog box. The same
check box settings are available.
MapInfo Professional 10.5
320
User Guide
Chapter 11: Stylizing Your Map for Presentations and Publishing
Printing and Exporting Your Results
Changes you make to the Advanced Export settings override the default settings in the Output
preferences. See Setting your Output Setting Preferences on page 186 for more.
Save Window As Supports Raster Formats
You can save your map images as GIF, TIFF LZW, and TIFF CCITT Group 4 images.
To save your data as a raster format:
1. Open a Map, Layout, Browser or Graph window you want to save in the new format.
2. From the File menu, click Save Window As to display the Save Window to File dialog box.
3. Select the type you want to save it in from the Save as type drop-down list.
•
•
•
GIF
TIFF LZW
TIFF CCITT Group 4
4. Type the name of the file in the Filename field and click Save to save your entries.
Creating an Encapsulated Postscript File
If the available Save Window As formats are not appropriate for your needs, or you want to use the
options in the Layout window, you may want to send your output to an encapsulated postscript
(EPS) file. This file type is widely used by service bureaus and print shops. There is not a set export
or save command for EPS files. You must set up a postscript printer driver and print the map or
layout to a file.
1. From the Windows Control Panel, select Printers.
2. In Printer Setup choose Add Printer. The Add Printer Wizard displays.
3. Follow the wizard for the setup. Choose a postscript printer from the printer list, and select FILE
as the available port. Enable the option to specify EPS.
4. Once the postscript driver is installed on your system, use that printer to print the map or layout
to a file from MapInfo Professional.
5. From the File menu, select Print. The Print dialog box displays.
6. Under printer name, select the postscript printer. Click OK.
7. The Print to File dialog box displays. Give your file a name and choose Save.
Smoothing the Edges of Images During Export
To give you more control over map images when exporting MapInfo Professional maps, you can use
anti-aliasing methods. This is particularly important when you are saving maps created in MapInfo
Professional for use in other Windows-based applications, in particular in slide presentations or for
web pages.
MapInfo Professional 10.5
321
User Guide
Chapter 11: Stylizing Your Map for Presentations and Publishing
Printing and Exporting Your Results
We have added the ability to smooth or anti-alias images during the export process. You can use
this capability with all types of windows such as Map windows, layouts, legends, and graphs.
L
You cannot anti-alias images you are exporting to .EMF or .WMF format, because these are
not true raster formats.
There are three smoothing options you can use to customize your raster image:
1. Smooth using a Filter value. You can set a flag that selects one of six filters that allow you to
choose the direction the filter is applied to the image from.
2. Smooth using a Mask value. You can select a value that indicates the size of the area you want
to smooth. For example, to create a 3x3 pixel mask value, you would enter a 3 in this field. This
would limit the amount of change in the color of the pixels. Typically mask sizes would be 2-3
pixels when exporting at screen resolution. If you are exporting at a higher resolution, a larger
mask might be appropriate.
3. Smooth using a Threshold value. You can select a threshold value to indicate which pixels to
smooth. Each pixel in an image has a value based on its color. The smaller the pixel value, the
darker the color. Select this option to smooth all of the pixels above the threshold you enter in
this field. When you set this value to 0, MapInfo Professional will smooth all of the pixels.
You must either set a global preference for these anti-aliasing options or set them locally during the
export process (using the Advanced button).
To set the anti-aliasing preference for exporting images:
1. From the Options menu, select Preferences and Output Settings to display the Output
Preferences dialog box.
2. Click the Exporting tab to display the anti-aliasing options.
3. To use anti-aliasing automatically, select the Use Anti-aliasing check box and select from these
options:
Smooth using a Filter value
Choose a filter for the smoothing you want to use. Select from these filters:
•
•
•
•
•
•
Vertically and Horizontally (Smooths the image vertically and horizontally)
All Directions (1) (Smooths the image in all directions)
All Directions (2) (Smooths the image in all directions using a different algorithm)
Diagonally (Smooths the image diagonally)
Horizontally (Smooths the image horizontally)
Vertically (Smooths the image vertically)
Smooth using a Mask value
Choose the pixel size of the mask you want MapInfo Professional to use in this field. For
example, to create a 3x3 pixel mask value, you would enter a 3 in this field. This would limit
the amount of change in the color of the pixels to the three pixels around the basic pixel.
MapInfo Professional 10.5
322
User Guide
Chapter 11: Stylizing Your Map for Presentations and Publishing
Printing and Exporting Your Results
Smooth using a Threshold value
Select a threshold value to indicate which pixels to smooth. Colors are 0 for black and 255 for
white (in an 8 bit image). Entering a low number changes the look of your map by smoothing
the darker colors and the lighter colors. Choosing a higher number changes the way the
lighter colors display.
To set the anti-aliasing options locally during export:
1. When you have completed your work on a window, select the File > Save Window As menu
option. The Save Window to File dialog box displays.
2. Type the name and indicate the path of the file you are saving in this dialog box. Click Save to
continue. The Save Window As dialog box displays.
If you are exporting an EMF or WMF image, the Use Anti-Aliasing check box is
disabled.
3. Select the Use Anti-aliasing check box and do one of the following:
•
•
Click Save to use the anti-aliasing options you selected in the Output Preferences dialog box
Click Advanced and choose new anti-aliasing options for this particular map. Click OK to
return to the Save Window As dialog box. Click Save to save these settings and the file.
L
If you do not select the Use Anti-aliasing check box, the anti-aliasing options in the
Advanced Exporting Options dialog box are disabled.
MapInfo Professional 10.5
323
User Guide
Registering Raster
Images
Raster images can provide context to your maps by giving them detail and
definition. This chapter reviews the details of registering and working with raster
image files.
Topics in this Section:
Working with Raster Images . . . . . . . . . . . . . . . . . . . . . . . . . . . . .325
Opening a Raster Image . . . . . . . . . . . . . . . . . . . . . . . . . . . . . . . .328
Printing/Exporting Translucent Raster Images . . . . . . . . . . . . . .333
12
Chapter 12: Registering Raster Images
Working with Raster Images
Working with Raster Images
There are a number of ways you can obtain raster image files. If you have a scanner and scanner
software, you can use the scanner to create raster image files. MapInfo Professional can read and
display the raster image files created with the scanner software.
Some graphics software packages let you save or export images into raster file formats, such as
TIFF (Tagged Image File Format). So if you can create a TIFF file with your draw or paint package,
you can display it in MapInfo Professional.
You can also purchase raster images from MapInfo Professional or other commercial vendors.
Some data vendors also offer scanning services.
Determining Map Coordinates
When registering your raster image, you need to know the map coordinates that correspond to your
image. If your raster map image shows a graticule (a grid of longitude/latitude lines), you can
determine map coordinates by noting the longitude/latitude labels along the graticule.
If your map does not show a graticule, you may be able to determine map coordinates by locating
prominent map features, for example, the Northwest corner of a region, and then using another
MapInfo Professional table as a reference to determine the coordinates of those prominent features.
For a discussion of this process, see Choosing Control Points from an Existing Map in the Help
System.
An Introduction to Raster Image Registration
What Is a Raster Image?
A raster image is a type of computerized image that consists of row after row of tiny dots (pixels). If
you have a scanner and scanner software, you can create a raster image by scanning a paper map.
After you scan a map image and store the image in a file, you can display the file using MapInfo
Professional.
There are many different raster image file formats. MapInfo Professional can read the following
types of raster image files: JPEG, GIF, TIFF, PCX, BMP, TGA (Targa), and BIL (SPOT satellite).
What Does It Mean To Register a Raster Image?
When you register a raster map image, you enter map coordinates (e.g. longitude/latitude degrees),
and you indicate which locations on the raster image correspond to those coordinates. You must
register each raster image before displaying the image in MapInfo Professional, so that MapInfo
Professional can perform geographic calculations, such as distance and area calculations, when
displaying the raster map.
The first time you open a raster image file within MapInfo Professional, MapInfo Professional
displays the Register Raster Image dialog box. By completing this dialog box, you tell MapInfo
Professional how to register the raster image and determine the coordinate system for the image.
MapInfo Professional 10.5
325
User Guide
Chapter 12: Registering Raster Images
Working with Raster Images
MapInfo Professional stores the raster image's registration information in a table file for future reuse. The next time you run MapInfo Professional, you can re-open the raster table without repeating
the registration process. Thus, you only need to register each raster image once.
Raster image files provided by MapInfo Professional are already registered. You do not need to
perform the registration process when you display the sample raster data included with MapInfo
Professional.
Understanding Raster Images in MapInfo Professional
Using raster image files, you can bring paper maps, photographs, and other graphic images into
MapInfo Professional. For example, if you work with paper maps, you probably want to use those
paper maps as the foundation for the maps you create in MapInfo Professional. Once you scan your
paper map into a raster image file, you then can display it in a Map window.
Using Raster Images as a Backdrop for MapInfo Professional Maps
Using a raster image as the base layer of your map gives you a detailed backdrop for your other
map layers. You can easily change the size, scale, or center point of the displayed image. For
example, if you want to enlarge part of the image, use the Zoom-in tool. Keep in mind, however, that
as you increase the image’s size, the display will become grainier if you exceed a 1-1 pixel ratio.
Each pixel in the image becomes more distinct, causing the image to look more like a series of
blocks instead of the intended picture.
Using Raster Images as a Stand-Alone Image
You may have a satellite image of topography that would be impossible to duplicate as a vector
image that you want to use for a presentation. You can display the image in MapInfo Professional
and then incorporate it into a page layout.
Map Editing with Raster Images
Once you have superimposed map layers on top of your raster image, you can use the raster image
as a reference while you edit your map layers. The process of editing based on a screen image is
known as heads-up digitizing. (To minimize image distortion, only digitize from map images with
known projections or rectified aerial photographs.)
Placing a Logo on a Page Layout with Raster Images
Most raster images displayed in MapInfo Professional are images of paper maps or aerial
photographs, but almost any image can be scanned and made into a raster image. For example,
with an image like your company logo, you can open and display the raster file in MapInfo
Professional without registering it because control point coordinates are irrelevant. You can then
place it in a frame in a Layout window and incorporate the logo into your page layout.
MapInfo Professional 10.5
326
User Guide
Chapter 12: Registering Raster Images
Working with Raster Images
Raster Image Format Details
There are many different raster image file formats. MapInfo Professional can read the following
types of raster files:
•
•
•
•
•
•
•
•
•
•
•
•
•
•
•
•
•
•
•
•
•
•
•
filename.ADF (ArcInfo coverage Data File)
filename.ASC (ASCII text file)
filename.BIL (SPOT satellite images)
filename.BMP (Windows bitmap)
filename.* (CADRG format)
filename.* (CIB format)
filename.ECW (ECW 2.0 format handler)
filename.EMF (Enhanced Metafile) format
filename.FLT (Image Filter)
filename.GEN (ADRG format)
filename.GEN (ASRP 1.2 format)
filename.GIF (Graphics Interchange Format)
filename.JP2 (JPEG 2000 format)
filename.JPG (JPEG format)
filename.NTF (NITF format)
filename.PCX (ZSoft Paintbrush)
filename.PNG (Portable Network Graphics format)
filename.PSD (Photoshop 3.0)
filename.SID (MrSID format)
filename.TIF (Tagged Image File Format)
filename.TXT (Text)
filename.TGA (Targa)
filename.WMF (Windows Metafile format)
For a complete list, see the Raster image file formats MapInfo Professional supports at File Format
Types Supported on page 90.
MapInfo Professional also supports:
•
•
Map Tile Server raster images. For more information, see Enhancing Map Data using a
Mapping Tile Server on page 414.
AirPhotoUSA raster images taken at different elevations for particular areas in the United States.
The AirPhotoUSA map handler allows MapInfo Professional users to open and display the
imagery contained in AirPhotoUSA Map files as a layer. MapInfo Professional treats these
images like any other raster file. The MAPINFOW.PRJ file has been updated to accommodate
the AirPhotoUSA changes.
L
The maximum supported raster image varies by raster handler.
MapInfo Professional 10.5
327
User Guide
Chapter 12: Registering Raster Images
Opening a Raster Image
ARC Grid Format Support
MapInfo Professional uses the Arc Grid Handler to use and display of ESRI grid files. You will see
the file extension options in the Open Table dialog box when you choose the Files of Type option
Grid Image. This allows you to open both ASCII and Binary Continuous and Classified grid formats
but you can only hillshade the Continuous grid files. These types of data files are available from the
USGS Seamless Data Distribution System.
L
•
The Arc Grid Handler does not support the Arc Grid Export format (*.e00 extension) in
MapInfo Professional.
For more information, see Color Options for Raster Images in the Help System.
Opening a Raster Image
When you open a raster file you need to register it to identify coordinate point references for the
image. Using a vector map as a reference, you identify the coordinates of the vector map and match
them with equivalent points on the raster image. This coordinate information allows MapInfo
Professional to determine the position, scale and rotation of the image so that you can overlay
vector data on top of the image. The coordinate information is stored in a TAB file created during the
registration process. The TAB file enables you to re-open the raster file in MapInfo Professional
format.
You usually register the image the first time you open it. However, you do not need to register the
image if you do not plan to use vector data with it, or if it already contains georegistration
information.
Raster images usually fall into one of three categories:
•
•
•
A fully registered image, containing control points and a projection (for example, GeoTIFF file).
A partially registered image containing control points, but missing a projection (for example, an
image with an associated World file).
An unregistered image missing control points and a projection.
Once the image is registered, opening it again requires a slightly different procedure. Opening both
unregistered and registered images is explained in the next section.
For more information, see these related topics in the Help System.
•
•
•
Opening a Registered Raster Image
Opening an Unregistered Raster Image
Opening a Georeferenced Raster Image
Registering the Coordinates of a Raster Image
Before you can overlay vector data on top of a raster image, you must first register the raster image
so that MapInfo Professional can position it properly in a Map window. In the Image Registration
dialog box, you can identify control point coordinates and specify the appropriate projection for the
raster image.
MapInfo Professional 10.5
328
User Guide
Chapter 12: Registering Raster Images
Opening a Raster Image
Control points are the coordinates you identify on the raster image that MapInfo Professional can
use later to match up to other layers. It is very important to provide accurate control point information
when registering a raster image, so MapInfo Professional can display raster images without
distorting or rotating them. Later, when you overlay vector data, MapInfo Professional distorts and
rotates the vector data so both layers can line up properly. Identifying significant control points
makes this match up process easier. We suggest you use highway/street intersections and
prominent landmarks as control points, as they rarely move.
Specifying the correct projection of the raster image is also important for accurate display. Images
that do not have known projections, such as unrectified aerial photographs, are less suitable for use
with vector data.
There are two ways to register a raster image in MapInfo Professional. Each involves specifying the
map coordinates of control points on a reference map and matching them with equivalent points on
the raster image. To determine map coordinates, you can:
•
•
Identify a point’s coordinates from the paper map.
Determine a raster images control point coordinates on screen and automatically transfer the
information to the Image Registration dialog box.
L
•
If you scanned in the image from a paper map, the map most likely contains a graticule
(latitude and longitude grid). You can choose those coordinates for prominent features and
enter them in the Image Registration dialog box.
For specific instructions, see Registering the Coordinates of a Raster Image and Choosing
Control Points from an Existing Map in the Help System.
Reprojecting a Raster Map
From time to time, you will need to use a raster map registered in one projection in another map in
different projection. You can reproject the raster image, that is, change the coordinate system and
the way the raster image displays to accommodate the new vector map. Typically, the open map
dictates the projection of the successively displayed images. You can also reproject the raster using
the projection of a vector table.
Reprojecting a Raster based on a Vector Map
If you are working with registered raster data such as satellite and aerial photo images, scanned
maps, grids, seamless tables and WMS data, you might want to reproject that raster data to
accommodate a vector map.
MapInfo Professional performs the raster reprojection when you open a registered raster image
inside of an existing Map window with a different projection or when you change the projection of a
Map window. During the raster reprojection process, MapInfo Professional recalculates the pixel
values of the source image to make them display correctly in the destination image. In this
resampling process, MapInfo Professional tries to restore every pixel value of the image based on
the pixels around it. In MapInfo Professional there are two methods for calculating the pixel values of
the destination image: Cubic Convolution and Nearest Neighbor. These are industry-standard terms
used by GIS professionals all over the world. These methods are described later in this section.
MapInfo Professional 10.5
329
User Guide
Chapter 12: Registering Raster Images
Opening a Raster Image
Due to this feature, these are the precedence rules for Map window projection.
Both vector and raster layers have “equal rights”, that is, every new layer (without regard for type) is
reprojected into the current Map window’s projection. That is, which ever map is opened first takes
precedence for projection.
L
You can change the projection of a Map window containing a mix of raster and vector layers
by setting the image processing reprojection preference to Always or Optimized.
MapInfo Professional does not let you change the projection or image processing/reprojection of a
map that displays raster images from a tile server, because this would create inaccuracies in your
map. The projection system of the data may vary between tile servers. For this reason, we do not
recommend displaying tiles from different tile servers in the same map unless the tile servers use
the same projection system.
When you are working with palette raster images (like a scanned map), an image might contain all
256 colors. If you display this image in the Adjust Image Styles dialog box and clear the Transparent
check box, the color “white” becomes transparent. If you do not want this display behavior, select the
Transparent check box and choose another transparent color (using Select Color).
Transferring Vector Map Coordinates Directly to a Raster Map
To transfer the coordinates automatically from a vector map to a raster image, you need a vector
map of the same image. Then, you display the vector map side by side with the Image Registration
dialog box, which shows a preview of the raster image. Click a prominent feature in the vector map
to determine its coordinates and transfer this control point to the Image Registration dialog box.
To transfer a vector map’s coordinates to a raster image:
1. On the File menu, click Open and Raster Image file format.
2. Choose the raster image file and click Open. The Display/Register dialog box displays.
3. Click Register. The Image Registration dialog box displays. A preview of the raster image
appears in the lower half of the dialog box.
4. Choose the Projection button to specify the image’s projection. If you do not set the projection,
MapInfo Professional defaults to Longitude/Latitude or to the default table projection set in the
Map Window Preferences.
5. To add control points, click the Add button to add a control point entry to the Control Points list.
6. Click the Pick from Map button and select a location in the Map window that matches a location
in your raster image. MapInfo Professional updates the Map X and Map Y fields in the Edit
Control Point dialog box with the new coordinates. Click OK to save this entry and close the
dialog box.
L
When the Pick from Map button is disabled, you can select locations directly from the
open map. If a map is not open, you can select another tool (like the Select tool) and use
that tool instead of the Pick from Map functionality.
MapInfo Professional 10.5
330
User Guide
Chapter 12: Registering Raster Images
Opening a Raster Image
7. Highlight the entry in the Control Points list and click the matching control point location in the
image pane. The Edit Control Point dialog box displays showing the control point’s location in
pixels in the Image X and Image Y fields. Click OK to save these entries.
L
Remember to type a meaningful description of this location in the Label field.
8. Repeat this process until you have identified three or four non-linear points in the preview pane
of the Image Registration dialog box.
9. After you have defined all of the control points, click OK in the Image Registration dialog box.
The raster image displays in the Map window under the vector layer.
Use the Layer Control feature to position the raster map appropriately with your vector layers.
•
For details on converting degree/minutes/seconds coordinates to decimal degrees, see the Help
System.
Modifying Control Points for Raster Images
If you must adjust the coordinates of a control point because the error is unacceptable, highlight the
point in the Image Registration dialog box and choose another location for it in the Map window. To
delete control points, click the point and choose the Delete button.
Raster Image Display Options
You can display more than one raster image in a window at a time. This is limited only by your
computer’s memory. However, if you want to digitize from the raster image, it is best to use only one
image in a Map window. This is because two raster images will probably have slightly different
rotations.
When using two raster images with different projections, keep in mind that MapInfo Professional will
use the projection of the image that is opened first. This means that the second image is only
positioned approximately.
Color (Raster Image)
Once you have displayed a raster image file in a Map window, you can make adjustments to the
colors in the image. From the Table menu, select to Raster and click Adjust Image Styles to
change the settings for that .tab file. From the Map menu, select Layer Control. Double-click the
layer to display the Layer Properties dialog box. On the Layer Display tab, check the Style Override
check box and click the Style button to adjust the raster style only in this Map window.
The Adjust Image Styles dialog box lets you set the contrast and brightness of the image, set
translucency, display color raster images in shades of gray, and make one color in the image
transparent.
MapInfo Professional 10.5
331
User Guide
Chapter 12: Registering Raster Images
Opening a Raster Image
Using the Adjust Image Styles dialog box does not modify the raster image file; instead, it changes
the way MapInfo Professional displays the raster image file. If you change an image’s display style,
MapInfo Professional records the new display style in the table file (for example PARCELS.TAB) or
in the workspace for per layer styles, but MapInfo Professional does not alter the contents of the
raster image file (PARCELS.GIF) in any way.
If you change an image’s display style and choose OK, the new display style is applied immediately.
It will also affect all Map windows in which the image is displayed if you select the Table menu, and
point to Raster and click Adjust Image Styles. You do not need to choose Save to save the
changes.
Style Override for Raster Images
MapInfo Professional provides the ability to change the display style for raster and grid images on a
per-layer basis through the Layer Control window. The Style Override option for raster images
works the same way as it does for other map layers. Just choose the Map menu, and click Layer
Control, and select a raster layer in the Layer list. Click the Layer Properties
button. The Layer
Properties dialog box displays. On the Layer Display tab, select the Style Override check box and
click the Style button. The Adjust Image Styles dialog box displays. You can change any of the
raster image style settings.
Zoom Layering for Raster Images
Zoom layering for raster images controlled from preferences (in the Options menu, point to
Preferences and click Map Windows and select Automatic Raster Zoom Layering). To change
the zoom layering setting for a raster layer that you are currently working with, go to the Layer
Properties dialog box (from the Map menu, select Layer Control, select the layer and click the
Layer Properties
on by default.
MapInfo Professional 10.5
button) and to either activate or turn off zoom layering. The setting is turned
332
User Guide
Chapter 12: Registering Raster Images
Printing/Exporting Translucent Raster Images
Limitations in Using Raster Images
Many of MapInfo Professional’s features cannot be applied to raster image tables. As a general rule,
you cannot use MapInfo Professional to modify a raster image file. Specific limitations of raster
tables include:
•
•
No Data Saved with Raster Images A raster table does not have columns, therefore, you cannot
attach text or numeric data directly to a raster table, and you cannot perform queries, such as
Find, on a raster table. You can, however, overlay a conventional (vector-based) MapInfo
Professional table on top of the raster image, and attach data to the conventional table.
Map Projections and Reprojections with Raster Images: When a raster image file displays in a
Map window, the file that is opened first determines the projection of the map. If two raster
images in a Map window use different map projections, MapInfo Professional will use the
projection of the map that is opened first. The Map window will redraw slowly when you overlay
other map layers on top of a raster image. The map redraws slowly because MapInfo
Professional is re-calculating map coordinates so that the vector map objects conform to the
projection of the raster image.
Adjusting the Contrast or Brightness of a Raster Image
The Adjust Image Styles dialog box lets you control how a raster image appears but does not modify
the raster image file; instead, it changes the way MapInfo Professional displays the raster image file.
Every raster image table consists of two files: a raster image file (for example, PHOTO.GIF), and a
table file (for example, PHOTO.TAB). When you change the image display styles, MapInfo
Professional stores the new style settings by modifying the table file. MapInfo Professional does not
modify the raster image file in any way.
If you change the display options and choose OK, MapInfo Professional stores the new display
styles immediately; you do not need to choose File > Save.
•
For instructions, see Adjusting the Contrast or Brightness of a Raster Image in the Help System.
Adjusting the Translucency of a Raster Image
You can adjust the percentage that layers show through raster images. A translucent image allows
you to partially see through the image. Translucent images can be layered on top of other layers so
that the lower layers are partially visible through the image.
•
For specific instructions, see Adjusting the Translucency of a Raster Image in the Help System.
Printing/Exporting Translucent Raster Images
When printing or exporting a translucent raster image, take advantage of Advanced options.
To print a translucent raster image:
1. Do one of the following:
•
•
On the File menu, click Print
On the File menu, click Save Window As
MapInfo Professional 10.5
333
User Guide
Chapter 12: Registering Raster Images
Printing/Exporting Translucent Raster Images
2. Click Advanced and choose from the following settings according to your printing and exporting
requirements.
•
•
•
•
Print/Export Border — Select to include the black rectangle border when exporting.
Internal Handling for Transparent Vector Fills and Symbols — Select to allow MapInfo
Professional to perform special handling when exporting transparent fill patterns or
transparent bitmap symbols. If unchecked, the process is handled by Windows.
Use ROP Method to Display Transparent Raster — Use this option to print the raster
image as a metafile (EMF or WMF). Using the ROP method allows any underlying data to be
rendered in the original form. Select this check box to allow the internal ROP (Raster Overlay
by Pixel) to manage the transparent pixels for the raster.
Since the ROP Method is largely a display method, not all printers and plotters can use it. We
recommend that you experiment with this setting until you get the results you want when
printing raster images. This check box is cleared by default.
Print/Export Raster in True Color When Possible — Select this check box to print your 24bit raster images in true color. Make sure your printer settings are greater than 256 colors.
This check box is selected by default.
3. When you have completed these selections and returned to the Print dialog box, click OK to
begin printing.
MapInfo Professional 10.5
334
User Guide
Putting Your Data on the
Map
As we saw in Data – Where MapInfo Professional Begins, you can convert
your existing data to a format that MapInfo Professional can use to display it on
a map. Now you’re getting somewhere! But how does MapInfo Professional
know where to put the information on a map? That is the subject of this section
of the User Guide.
Topics in this Section:
How Do I Get My Data on the Map? . . . . . . . . . . . . . . . . . . . . . . .336
Displaying your Data on a Map . . . . . . . . . . . . . . . . . . . . . . . . . . .336
Geocoding – Assigning Coordinates to Records . . . . . . . . . . . .353
Putting Latitude/Longitude Coordinates on a Map . . . . . . . . . . .365
Displaying Your Data on the Map . . . . . . . . . . . . . . . . . . . . . . . . .367
Printing Your Results . . . . . . . . . . . . . . . . . . . . . . . . . . . . . . . . . . .368
13
Chapter 13: Putting Your Data on the Map
How Do I Get My Data on the Map?
How Do I Get My Data on the Map?
There are three steps to putting your organization’s data on a map:
•
•
•
Creating a MapInfo .tab file of your data
Geocoding or creating points for the data
Displaying your points on a map
When Do I Geocode vs. Create Points?
There are two processes that MapInfo Professional uses to identify and plot your data on a map.
During Geocoding, MapInfo Professional reads data such as street data, postal code data, and other
non-coordinate information from your database and matches it against street or postal code
information on a MapInfo data table.
During the Create Points process, MapInfo Professional reads X and Y coordinate data (such as
longitude and latitude data from a Global Positioning System) and plots data using those
coordinates. Use the appropriate process to the type of data you have collected.
•
•
L
•
For more about the geocoding process, see Geocoding – Assigning Coordinates to
Records on page 353
For more about the create points process, see Putting Latitude/Longitude Coordinates on
a Map on page 365.
If your data is in non-MapInfo format before you geocode or create points, you must convert
it before using either of these processes.
For more specific instructions on creating points, see Putting Longitude/Latitude Coordinates on
a Map in the Help System.
Displaying your Data on a Map
The first step in using your data in MapInfo Professional is to create that .tab file from your data. This
process takes the data you have created (either a spreadsheet or database) and extracts the
information into a .tab file that MapInfo Professional can use. Your data remains in tact as we go
through this process. The process that MapInfo Professional uses depends upon the type of format
your data is in. You can create a MapInfo table of the following data file format types:
•
•
•
•
•
•
•
Microsoft Excel (.XLS or .XLSX)
Microsoft Access (.MDB or .ACCDB)
d-Base (.DBF)
Lotus 123 (.WKS, WK1)
ASCII (.TXT)
Comma Delimited files (.CSV)
RDBMS (Oracle, SQL Server, PostgreSQL with PostGIS)
MapInfo Professional 10.5
336
User Guide
Chapter 13: Putting Your Data on the Map
Displaying your Data on a Map
•
XML (Web Map Service)
L
The process for creating a .tab file from ASCII data is called “registering” instead of creating
because we are actually making a series of pointers to the ASCII data. The process is
different but your resulting files behave the same way.
The Help System contains these related topics:
•
•
•
•
•
•
•
•
•
•
Displaying your Excel (.XLS or .XLSX) Data
Displaying your Access (.MDB or .ACCDB) Data
Displaying your Comma Delimited Data
Displaying your dBase Data
Displaying your Lotus 1-2-3 Data
Displaying your ESRI Shapefile Data
Displaying and Registering Your ASCII Data
Importing and Displaying GML File Data
Displaying Your Remote DBMS Data
Displaying and Importing Data from a Web Map Service
Displaying your Excel (.XLS or .XLSX) Data
You can create a .tab file from an Excel file that is up to 64K in size.
To create a .tab file from your Excel (.XLS or .XLSX) data:
1. In MapInfo Professional on the File menu, click Open to display the Open dialog box.
2. In the Files of Type list select (.XLS or .XLSX), navigate to your data, and click Open.
3. Select the worksheet you want in your MapInfo data table. Make sure that this data includes
either postal codes or longitude/latitude coordinate values.
The default data range for an Excel file is the entire worksheet.
•
•
If you select the Use Row Above Selected Range for Column Titles check box, the default
data range begins at A2 (row 2).
If you clear the Use Row Above Selected Range for Column Titles check box, both the
Named Range and Current Value fields revert to their previous values on the Entire
Worksheet.
4. Click OK to display the Set Field Properties dialog box.
This dialog box allows you to reset the name, type and properties of any field (column) that you
import from the Excel table. The top of the Set Field Properties window shows the Fields (column
names) and Type (character, date, etc.) from the Excel spreadsheet. When you select one of
these fields, the Field Information box entries at the bottom allow you to specify the field name,
data type, number of characters (for character and decimal fields) or number of decimals (for
decimal fields only).
MapInfo Professional 10.5
337
User Guide
Chapter 13: Putting Your Data on the Map
Displaying your Data on a Map
L
If you click Cancel, MapInfo Professional cancels the import operation.
5. Click OK to convert the data to a MapInfo table (.tab) format. Now that you have converted your
data, you can plot your data; see the next section to continue.
The Help System contains these related topics:
•
•
•
•
•
Default Range Options When Importing MS Excel Files and Controlling Treatment of Imported
Excel Tables in the Help System.
Controlling Treatment of Imported Excel Tables
Ensuring that Dates Display Correctly for Excel for Macintosh Tables
Controlling how MapInfo Professional Handles Mixed Data Type Columns
Putting Longitude/Latitude Coordinates on a Map
Displaying your Access (.MDB or .ACCDB) Data
To convert your Microsoft Access (.MDB or .ACCDB) data into a MapInfo Professional table:
1. Choose File > Open. The Open dialog box displays.
2. Choose Microsoft Access Database from the Files of type menu. The Access databases
(.MDB or .ACCDB) for the specified location display.
3. Choose an Access database to open. If security is turned on, you will be prompted to give user
and password information to open the database.
4. The Open Access Table dialog box displays the tables for the opened database.
5. Choose an Access table or tables to open. The table or tables are opened in MapInfo
Professional. (Please note that for a table name with a space such as Order Details can be
saved in MapInfo Professional but subsequently will not be visible to MapInfo Professional.)
MapInfo Professional 10.5
338
User Guide
Chapter 13: Putting Your Data on the Map
Displaying your Data on a Map
After you open an Access table in MapInfo Professional for the first time, MapInfo Professional
creates a definition for the table and gives it a .TAB extension. This enables you to it treat it like any
other MapInfo Professional table. For example, to open this file you would now open it like any other
MapInfo Professional table.
L
Even though the table has the .TAB extension in MapInfo Professional, your data is still in
your original Access database table and is not a duplicate.
The Help System contains these related topics:
•
•
•
•
•
Microsoft Access Table Specifications
Creating an Access Table in MapInfo Professional
Saving a MapInfo Professional Table as an Access Table
Saving an Access Table as Another Access Table
Limitations of Working Directly with Access Tables
•
IFor more specific instructions on creating points, see Putting Longitude/Latitude Coordinates on
a Map in the Help System.
Displaying your Comma Delimited Data
You can create native .tab files for comma delimited data in MapInfo Professional.
Opening Comma Delimited Files in MapInfo Professional
You can export tables to comma delimited .csv text files. You can open .csv files from our File >
Open dialog box as well.
To open a comma delimited file:
1. From the File menu, click Open to display the Open dialog box.
2. From the Files of type box, select Comma delimited CSV (.csv).
3. Navigate to the folder that contains the file you want to open and click it to select it.
4. Click Open to display the Comma Delimited CSV Information dialog box.
The Delimiter option buttons in this dialog box are disabled intentionally because commas are
the only expected delimiters in this file format.
5. Select the File Character Set for this file from the drop-down list and select the Use First Line
for Column Titles check box if applicable.
6. Click OK to open the file.
Exporting to a Comma Delimited CSV Format
When you export a file to a comma delimited (CSV) format, a Comma Delimited CSV Information
dialog box displays. In this dialog box, you can select a new delimiter, choose the file character set,
and choose to use the first column in the file for column headings. When you have made your
selections, click OK.
MapInfo Professional 10.5
339
User Guide
Chapter 13: Putting Your Data on the Map
Displaying your Data on a Map
•
For more specific instructions on creating points, see Putting Longitude/Latitude Coordinates on
a Map in the Help System.
Displaying your dBase Data
When you convert your data to a MapInfo Professional table, you do not in any way change the
original data. MapInfo Professional simply creates a conversion table (.tab) of your data.
To open your dBase (.DBF) data into a MapInfo Professional table:
1. On the File menu, click Open to display the Open dialog box.
2. In the Files of Type list, select the format (.DBF), navigate to your data, and click Open.
3. Select the appropriate character set for your MapInfo data table. Windows U.S. and Western
Europe (“ANSI”) is the default option.
4. Click OK to convert your selected data to a MapInfo table (.tab) format.
5. On the File menu, click Save Copy As to make an editable copy of your table. Then, on the File
menu, click Close Table and close the original table. Finally open the editable copy.
•
For more information, see Saving Data in DBF File Format in the Help System.
Displaying your Lotus 1-2-3 Data
To open your Lotus (.WKS, WK1) data into a MapInfo Professional:
1. On the File menu, click Open to display the Open dialog box.
2. In the Files of Type list, select the format (.WK1,.WKS), navigate to your data, and click Open.
3. Choose the worksheet you want to convert to a MapInfo data table.
L
If there are column headings above each column in this worksheet, select the Use Row
Above Selected Range for Column Titles check box. Then, select Other from the dropdown box and specify the cell range of the data you want to include in the MapInfo
Professional table.
4. Click OK to convert your data to MapInfo Professional table format.
Displaying your ESRI Shapefile Data
One of the prominent graphical formats in our industry is the ESRI shapefile.
To open a shapefile in MapInfo Professional:
1. On the File menu, click Open to display the Open dialog box.
2. Select ESRI shapefile in the Files of type drop-down list.
3. Navigate to the file’s directory and click it to open it.
MapInfo Professional 10.5
340
User Guide
Chapter 13: Putting Your Data on the Map
Displaying your Data on a Map
4. Click Open to display the Please specify a TAB filename file. This dialog box saves the
shapefile into a format that MapInfo Professional can read. The file has the same name as the
file you selected but has a .tab extension.
5. Click Save to display the Shapefile Information dialog box.
6. Select the character set appropriate for this file from the File Character Set drop-down list.The
default option is Windows U.S. & Western Europe (ANSI), but make your selection based on
your local settings.
7. Select the appropriate projection for this file. The Projection field shows the following:
•
If the Shapefile’s native projection is found and it matches an entry in the MAPINFOW.PRJ
file, the projection’s name displays in the Projection field.
• If a native projection is found but it is not in the MAPINFOW.PRJ file, a message displays in
this field: Not found in projection file and the name of the native projection displays.
• If a native projection is not found, the name of the currently selected table projection
preference displays in this field.
Continue with one of the following actions:
•
•
If the application does not detect the Shapefile’s native projection, or there is no matching
supported projection in the MAPINFOW.PRJ file, click Projection to select one and click OK.
If the application detects a supported projection, MapInfo Professional selects the Use
Projection in Source File radio button and the Projection button is disabled. Do one of the
following:
- To use the detected projection, leave Use Projection in Source file selected and continue
to the next step.
- To choose a new projection, click Choose Projection and click the Projection button to
select a supported projection. In the Choose Projection dialog box, the source projection is
highlighted. Select the projection you want and click OK.
L
If you substitute the Shapefile’s native projection with a new one, the application does
not reproject the Shapefile’s objects and data using the new projection. Substituting
the Shapefile’s projection in this way may produce unexpected results.
MapInfo Professional 10.5
341
User Guide
Chapter 13: Putting Your Data on the Map
Displaying your Data on a Map
8. Select the style and cache options for this file.
•
•
Style – Select any line or region style overrides that are necessary for this image by clicking
the Style button. When you select this option, the appropriate style options dialog box
displays.
Save Object Cache – Select this check box to save the *.MAP file to hard drive. If you
choose not to save the object cache, you will have to recreate the *.MAP file the next time
you open the shapefile file. However, if you are going to save the shapefile as a *.tab file, you
do not have to select the check box.
9. Click OK to create the .tab file and display the Shapefile.
L
If after you open the shapefile in MapInfo Professional, you edit the file in ESRI ArcView and
save the file, the contents of the *.MAP and *.DAT files are recreated to retain these edits
even if you selected Save Object Cache before.
For more information, see Working with Shapefiles Containing M and Z Values in the Help System.
Registering and Displaying your ASCII Data
When you are working with ASCII data in MapInfo Professional, you don’t actually create the table
as you would in the other file formats we have discussed. MapInfo Professional registers your ASCII
table by creating a MapInfo (.tab) file that points to the fields in the original file.
L
Registering your data using MapInfo does not change the original data in any way.
If your delimited ASCII file has an extension other than .TXT (such as .ASC, .CSV, or .DAT, etc.),
rename a copy of the file to <FILENAME>.TXT before you begin.
To register your ASCII (.TXT) data:
1. Open the data file using Wordpad/Notepad (on the Start menu, point to Programs and click
Accessories) or another text editor. See whether you have column headings and what delimiter
(character that separates each piece of data from the next) is used in the data file.
2. In MapInfo Professional, open File menu and click Open to display the Open dialog box.
MapInfo Professional 10.5
342
User Guide
Chapter 13: Putting Your Data on the Map
Displaying your Data on a Map
3. In the Files of Type list, select the format (.TXT), navigate to your data, and click Open.
4. Specify a tab delimiter or type the other delimiter in the field provided.
5. Choose the character set your file is using from the File Character Set drop-down list.
Select the Use First Line for Column Titles check box if you have column headings.
6. Click OK to register your data in MapInfo Professional.
7. On the File menu, click Save Copy As to make an editable copy of your table. Then, on the File
menu, click Close Table and close the original table. Finally open the editable copy. You can
only read information from these files.
•
For more information, see Working With Spreadsheets and Editing Excel and Lotus
Spreadsheets in the Help System.
Opening MapInfo Professional Grid Files
To open MapInfo Professional Grid Files:
1. Choose File > Open to display the Open Table dialog box.
2. Choose Grid Image (*.grd, *.mig), from the Files of Type list box.
3. Click the file you want to open and click the Open button.
L
There are grid files in the introductory data provided on the MapInfo Professional data
DVD.
Importing Graphic Files
To import a graphic file:
1. Choose Table > Import to display the Import File dialog box. Specify the location, name, and
format of the file you want to import.
2. Click Import to display the Import into Table dialog box.
3. Specify the name and new table format for the table you are creating.
4. Click Save. The file is imported into the file you named with the specified format.
MapInfo Professional 10.5
343
User Guide
Chapter 13: Putting Your Data on the Map
Displaying your Data on a Map
Importing and Displaying GML File Data
You can import OSGB MasterMap GML Files into MapInfo Professional. Each layer in the GML file
is imported into a separate .TAB file. We provide support for some of the Topography features
(OSGB version 2.0), Topographic Area, Lines and Points, Cartographic Symbols and Boundary
Lines. Currently, we maintain support for these features and add support for Cartographic Text and
Departed Features.
Currently, we support the OSGB recommended styles by mapping the style definitions to existing
MapInfo Professional styles. Where it is not possible to render complicated fill patterns, we use the
simple dot screen that the OSGB recommended to us. You cannot change the OSGB style mapping
to MapInfo styles.
•
For more information, see Importing and Displaying GML File Data in the Help System.
Importing and Displaying GML 2.1 Files
You can import GML 2.1 files into MapInfo Professional directly. To import successfully, the XML
must contain a reference to a valid schema that MapInfo Professional can read. For example, the
schema location could be a path relative to the XML file:
xsi:schemaLocation="http://www.mapinfo.com/wfs_XX .\mi_usa.xsd"
Or, it could be a URI:
xsi:schemaLocation="http://www.lm.se/xml/namespace/abc
http://www2.xxx.se/xml/scheman/abc.xsd"
• For more specific instructions, see Importing and Displaying GML 2.1 Files in the Help System.
Using Universal Data Directly
You can open AutoCAD®, Microstation Design®, ESRI ArcSDE®, Personal Geodatabase® and
Google Earth KML® data directly to avoid having to translate it separately and work with copies of
the data in .tab format. This functionality ensures that you will have more flexibility when working
with your data.
Pitney Bowes Software Inc. and Safe Software’s, a third-party partner, have worked together to
provide this direct way to open and display universal data directly in MapInfo Professional. This
Feature Manipulation Engine (FME) opens a variety of Universal Data formats including:
•
•
•
•
•
•
•
•
ESRI ArcSDE
ESRI Personal Geodatabase (*.MDB)
AutoCAD DWG/DXF
Microstation Design (*.DGN)
ESRI ArcInfo Export (*.E00)
USGS Spatial Data Transfer Standard (*.CATD.DDF)
VPF NIMA/NGA (*.FT)
Google Earth KML
MapInfo Professional 10.5
344
User Guide
Chapter 13: Putting Your Data on the Map
Displaying your Data on a Map
Using the Open Universal Data feature of MapInfo Professional, you can open different types of data
stored in a variety of locations and:
•
•
•
•
Combine data from multiple sources into a single run and join data from incompatible
systems
Extend the use of legacy systems
Exchange data between CAD-based systems and GIS systems
Perform quality assurance tests on spatial data
Additionally, if you have the FME Suite, which is available from Safe Software, you can use this
feature to open almost 150 formats within MapInfo Professional. For more information about
extending MapInfo Professional in this way, see Extending MapInfo Professional with FME Suite in
the Help System. This feature is based on the latest FME release.
Opening Universal Data Directly
The process for opening this data is the same regardless of the format.
To open the universal data directly:
1. Choose File > Open Universal Data to display the Specify Input Data Source dialog box.
Use this dialog box to select the data you want to open and specify the name of the
dataset you want to display.
Some formats are file-based and for others you need to specify a data source. Here, a dataset is
defined as a set of data in the same format. Some data contains the coordinate system
information in it and others do not. You may need to specify the coordinate system projection for
the data you are attempting to open.
2. Beside the Format drop-down list, click the
want to open. The Formats Gallery displays.
MapInfo Professional 10.5
345
Ellipsis button to specify the data format you
User Guide
Chapter 13: Putting Your Data on the Map
Displaying your Data on a Map
From this dialog box you can select a format and import frequently used formats.
L
Personal Geodatabase and ArcSDE always display in the Formats Gallery but they may
be grayed out if you do not have the appropriate client DLL or applications installed. See
Setting the ArcSDE Data Options and Setting the ESRI Personal Geodatabase Data
Options in the Help System for these details.
To obtain a free trial of the FME Suite and add more formats to this list, click More Formats.
Highlight a format in this list and click OK to return to the Specify Input Data Source dialog box.
3. Click the Ellipsis button beside the Dataset field to select the data you want to open.
To open a folder of data, click the + button beside the Ellipsis button. The Select Source Files
dialog box displays.
MapInfo Professional 10.5
346
User Guide
Chapter 13: Putting Your Data on the Map
Displaying your Data on a Map
If you select a folder in this dialog box, MapInfo Professional opens all of the data of the specified
format it finds in this folder. If you select the Subfolders check box, MapInfo Professional also
opens all of the data with the specified format in the subfolders as well. This data is merged
together when you open it. To add:
Directory-Based Formats: Click Add Folder to browse for a specific directory name. Check the
Subfolders box to include all subfolders below that directory. Click OK. The new data appends
to the original data.
File-Based Formats: You can type directly in the Folder field, and use wildcards to include all
files of a specific format.
For example:
*.dgn
merges all the .dgn files on your C drive. Check Identical Schemas if the files have the same
schema.
• Click Add Files to select individual files
• Ctrl+Left-click to select multiple files
• Click Remove to delete single or multiple files based on your selection
Click OK. The new data appends to the original data. The Specify Data Input Source dialog box
redisplays.
SQL Server Support in 10.5
The default support for SQL server has been removed and in its place support for the KML file has
been added. If you do not have the full version of FME and you open any table created using the
SQL Server, you will get an error message in MapInfo Professional 10.5.
If you have full version of FME installed then tables using the SQL server will open without any
issue.
•
For more information, see Working with the FME Suite in the Help System.
1. If the coordinate system for the data you selected is unknown, you need to specify it in the
Coordinate System field. Click the Ellipsis button beside the field to select the appropriate
MapInfo Professional 10.5
347
User Guide
Chapter 13: Putting Your Data on the Map
Displaying your Data on a Map
projection and click OK. If you do not specify the coordinate system here, you will be prompted
later.
For more information, see Coordinate System Behavior and Universal Data in the Help System.
2. Click Settings to display the settings options for this file type. The options in these dialog boxes
depend on the format you selected. To learn more about these settings, see the these topics in
the Help System:
• Setting the AutoCAD Options
• Setting the ArcInfo Export File Options
• Setting the ArcSDE Data Options
• Setting the ESRI Personal Geodatabase Data Options
• Setting the Microstation Design File Options
• Setting the Vector Product Format Coverage Settings
• Setting the Google Earth KML Settings
It is possible that a style option will not show. If it's the case it means that the layer(s) in question
does (do) not have any geometry objects (only attributes).
3. When you have completed your settings, click OK to open the data you selected.
If you did not specify the coordinate system in step 1 and the coordinate system is unknown, the
Choose Projection dialog box displays, allowing you to select the projection for the data you are
opening. Select the appropriate projection for the data and click OK. The system defaults to your
Table Projection setting in the Map Window Preference if you do not select a projection here.
The Select Layers dialog box displays.
MapInfo Professional opens all layers with the Open check box selected. Use this box
to specify the layers to open and then specify the layer display options.
To change the name of the layer, click it, type a new name in the File Name field and click
Apply. Use the Check All and Uncheck All buttons to select or deselect the Open check box
for all of the layers. Click the Back button to return to the Specify Input Data Source dialog box.
MapInfo Professional 10.5
348
User Guide
Chapter 13: Putting Your Data on the Map
Displaying your Data on a Map
4. Now you are ready to select the layers to which you will apply the new display options. All layers
you select together will share the same display characteristics.
•
•
•
To change the display options of all layers, click the layer name of the first layer, press the
Shift key, and click the layer name of the last layer
To change the display options of some layers, click the layer name of the first layer, press the
Ctrl key, and click the other layers that require the same change
To change the display options of one layer, click the layer name of the layer
5. Once you have selected the layer(s), use the display buttons to make the changes you require. If
the layer(s) you are changing contain:
•
•
•
•
Point data, click the Symbol Style button to change the symbol options
Line data, click the Line Style button to change the line options
Region data, click the Region Style button to change the background options
Text data, click the Text Style button to change the text options
L
If you want to open maps based on data that is thematically related, assign the same
styles to the layers that contain that information.
6. Once you have completed your layer display options, consider the options that affect the whole
data source. You can select from these options:
•
•
Use color information from data
Do not open empty layers
7. Use the Directory field to specify the path to which you want to save the resulting data. Click the
Ellipsis button beside the field to navigate to the appropriate directory.
8. Select the viewing options from the Preferred View drop-down box, as you would when opening
any other data.
9. When you have completed your selections, click OK to open the data according to the settings
you have specified. A status bar displays to indicate the progress and the data displays.
L
For any terminology that might not be familiar to you, review the FME Suite Help System.
Working with the FME Suite
If you install the FME Suite from Safe Software, you can open even more formats from within
MapInfo Professional. To extend MapInfo Professional to use these additional formats, use the FME
Administrator tool that ships with the FME Suite. There are a couple of caveats to keep in mind:
•
Make sure that the version of the FME Suite that you are using is the same version or later than
that which has been integrated with MapInfo Professional. This means you must have FME Suite
2008 or later. This works on a build number basis, so even a minor update to MapInfo
Professional or FME Suite could result in discrepancies between the products and could prevent
you from opening particular formats.
MapInfo Professional 10.5
349
User Guide
Chapter 13: Putting Your Data on the Map
Displaying your Data on a Map
•
Pitney Bowes Software Inc. localizes the dialog boxes of the FME product that we use in
MapInfo Professional. However, when you extend MapInfo Professional with the FME Suite, this
functionality is effectively run from the FME Suite, using the FME Suite dialog boxes.
For example, if you are running the Japanese version of MapInfo Professional and you install the
English version of the FME Suite, the dialog boxes that display for this feature will be in English.
If you revert to the MapInfo Professional implementation of this feature, the translated dialog
boxes will display in Japanese.
L
•
Raster/grid formats and MapInfo TAB/MIF formats are not available when you extend
MapInfo Professional with the FME Suite.
For more information see Extending MapInfo Professional with FME Suite in the Help System.
Understanding MapInfo Professional’s Use of the Topography Layer
OSGB MasterMap’s Topographic Layer contains nine themes including roads, tracks and paths,
buildings, landforms, water, height, heritage, structures, and administrative boundaries. You can
import these themes as TopographicArea, LandformArea, TopographicLine, TopograpicPoint,
CartographicText, CartographicSymbols, BoundaryLines, and DepartedFeatures. The
TopographicArea feature type contains two 'complexes', Topography and Landform, which contain
different polygons of information. The Landform polygons overlap the Topography polygons (which
represent land features like slopes and cliffs).
We split the TopographicArea feature type output into two layers so it is possible to save them in
different tables. The TopographicArea table contains only output whose areas defined in the OSGB
user guide as being part of the Topography complex or Structuring Layer. There is a feature type in
the GML Import dialog box called LandformArea, which allows the creation of the LandformArea
table. See Importing and Displaying GML File Data on page 344 for a clearer picture of this
process in action.
Viewing a List of Open Tables
You can view a list of open tables and can perform operations on the open tables in the Table List
window.
To access the Table List, do one of the following:
•
•
Click the Table List tool in the Main toolbar.
On the Table menu, click Table List.
The Table List window displays. Use the Table List to manage open tables and their attributes.
MapInfo Professional 10.5
350
User Guide
Chapter 13: Putting Your Data on the Map
Displaying your Data on a Map
The Table List has the following features:
•
•
•
•
•
•
•
Modeless, so that you can open it and leave it open for the duration of your session. (Modeless
windows do not have OK or Cancel buttons.)
Dockable to any of the four sides of the MapInfo Professional window: top, left, bottom, and
right. The Layer Control window and Table List Window can also share the same space.
Drag and drop enabled, so that you can select tables and drag and drop them to a blank area to
open them in a new Mapper window. When dropping tables on to an existing Mapper window,
MapInfo Professional adds them to the Mapper window as new layers.
Sorting enabled, to sort tables based on ascending order of table alias (name), descending
order of table alias, and recently opened. Sorting criteria persist across different MapInfo
Professional sessions.
Multi-Selection enabled, to select multiple tables using the Ctrl or Shift keys.
Context Menu enabled, so that when you right-click on table aliases (names) a pop-up menu
displays and you can perform the desired operations.
Searching enabled, you can search for a table name in the Table List Window by typing
characters in a Search text box. The Table List Window list refreshes itself to show only those
tables that contain the search characters.
For information about how to work with the Table List, see Working with Tables in the Table List
on page 45.
Displaying Data Details using the Statistics Window
The Statistics window displays the details of a selected data record. This information must exist in
the .TAB file’s metadata to display in the Statistics window. As the selection changes, the data is retallied, and the statistics window is updated automatically.
MapInfo Professional 10.5
351
User Guide
Chapter 13: Putting Your Data on the Map
Displaying your Data on a Map
To see the details of a data record:
1. Open a .TAB file with statistical data in it.
2. Select a geographical object in the Map window.
3. Do one of the following:
•
Select Options > Show Statistics Window
•
Click the Statistics tool
.
To copy the contents of the Statistics window to the clipboard, press and hold the Ctrl key and press
C. Go to the application you want to paste the Statistics data to and do one of the following:
•
•
Right-click to display the shortcut men, click Paste.
Hold down the Ctrl key and press Insert.
You cannot select particular contents of the Statistics window.
When you want statistics for an entire table, use Query > Select All to select all records in a table.
Figure: Statistics Window
Displaying Your Remote DBMS Data
The process for displaying spatialized data from Oracle, SQL Server, or PostGIS is different from the
tables we have discussed so far. For more information about accessing remote data, see
Understanding Remote Tables and Databases on page 129.
MapInfo Professional 10.5
352
User Guide
Chapter 13: Putting Your Data on the Map
Geocoding – Assigning Coordinates to Records
Displaying and Importing Data from a Web Map Service
A Web Map Service (WMS) is a technology that gives you a source for data over your Intranet or
over the Internet. This innovation is based on a specification from the Open GIS Consortium (OGC)
and allows you to use raster map images from servers that also comply with the specification. You
must specify the coordinate system within your data request to ensure that the images you retrieve
“sync up” or register with your other map data.
This specification supports transparent pixel definition for image formats as well. This allows you to
use the images you retrieve as overlays and not solely as the bottom layer of your map.
WMS data may not exist for the geography you are looking for. Further, the data that is provided is
determined by the WMS server.
L
•
You must have a working Internet connection to retrieve or use WMS data.
For instructions on retrieving and displaying data from a Web Map Service, see Retrieving Map
Data from Web Map Services in the Help System.
Geocoding – Assigning Coordinates to Records
To display your data on a map, you must first assign X and Y coordinates to each record. One way
that MapInfo Professional assigns these coordinates is by matching geographic information in your
database table to geographic information in another table (referred to as a search table) that already
has X and Y coordinates associated with it.
For example, you want to assign X and Y coordinates to a customer record whose address is 127
Winston Ave. MapInfo Professional reads that address and looks for a matching address in the
search table, such as a StreetPro table. (This search table already has X and Y coordinates
associated with its records.)
When MapInfo Professional matches 127 Winston Ave in your table to 127 Winston Ave in the
search table, it assigns the corresponding X and Y coordinates to your record. The geocoded point
becomes part of your database. You can then view these points by displaying your table in a Map
window.
MapInfo Professional 10.5
353
User Guide
Chapter 13: Putting Your Data on the Map
Geocoding – Assigning Coordinates to Records
What Do I Need to Know Before Geocoding?
It is important to know your data and what you want to use it for before you select a method of
geocoding. Ask yourself these questions:
What kind of geographic information do I have in my database?
Do you have street addresses, towns, cities, postal codes, states, countries? Do you have
potentially ambiguous information? For example, if you have a database of customer street
addresses, will you have 125 Main Street in Smithtown and a 125 Main Street in Nassau? If so, you
may have to refine your search using town boundaries or postal codes.
What kind of maps do I have to work with?
You will need computerized maps that are at the level of detail that match your data. For example, if
you want to geocode a database of customers in specific counties by street address, you will need
maps of the desired counties that go to street level. A map of the United States that only goes to a
county level would not work for you. You can purchase the appropriate maps for your geocoding
application from MapInfo Professional or your reseller.
How geographically accurate does the placement of my data have to be?
Taking into account the first two questions, you must decide how accurate the geocoding must be. If
you are trying to pinpoint the locations of cable wires, crime scenes, or fire hydrants, a high degree
of accuracy is needed. In this case, you should geocode your data to street level.
If, however, you are going to use your data to thematically shade postal code boundaries, town
boundaries, county boundaries, state boundaries, or country boundaries, you may not need a high
degree of accuracy.
MapInfo Professional 10.5
354
User Guide
Chapter 13: Putting Your Data on the Map
Geocoding – Assigning Coordinates to Records
In this case, geocoding against boundary files such as USZIPBDY.TAB, which we provide, would be
sufficient for your needs. Since this file does not include point postal codes (postal codes assigned
to a single building or company), the hit rate may not be as good as when you geocode by street.
Understanding the Geocoding Process
To assign X and Y coordinates to the records in your table, choose Geocode from the Table menu.
MapInfo Professional displays the Geocode dialog box, where you enter the following information:
•
•
•
•
The name of your table for which you want to assign X and Y coordinates.
The column in your table that contains the geographic information that will be used for matching.
The name of the search table containing the geographic information that will be used for
matching.
The search table column containing the geographic information for matching:
The dialog box also offers you the option of geocoding your data in two modes: automatically or
interactively. When you geocode a table automatically, MapInfo Professional geocodes exact
matches only and ignores all other records. It is the faster method, since MapInfo Professional
requires no user interaction once the geocoding process begins. When you geocode a table
interactively, MapInfo Professional pauses when it fails to match a record and lets you select from a
list of close matches.
L
We recommend that you geocode your table automatically first and then go back and
geocode interactively to match the remaining records.
Not Getting Geocoding? Try this Example...
The objective of geocoding is to place data from your database accurately on a map. Let us call your
data the source table. You can think of the geographical coordinates on a map as a target table.
To geocode a record:
•
MapInfo has to match an address in the source table with a location on the target table
Most of the problems in geocoding occur in trying to take the address data in the source file and
match it to addresses in the target tables.
MapInfo Professional 10.5
355
User Guide
Chapter 13: Putting Your Data on the Map
Geocoding – Assigning Coordinates to Records
For more about the automatic and interactive geocoding modes, see Modes of Geocoding on
page 356.
Modes of Geocoding
MapInfo Professional has two geocoding modes: automatic and interactive. The process of
matching target addresses with source addresses is the same in both modes.
Automatic mode matches addresses based on the choices in the Geocode dialog box.
When Geocoding is in automatic mode, only exact matches are geocoded. When some of your data
fails to match exactly (due, perhaps, to typographical errors), you need to geocode in Interactive
mode to match the near misses by hand. It is generally best to do two passes through your table,
with the first pass set on Automatic and the second pass set on Interactive. This approach takes less
processing time.
•
For instructions on geocoding in automatic mode, see Geocoding Automatically in the Help
System.
Interactive mode stops at each address that does not meet the geocode parameters and permits
you to assist in the matching process. When you geocode interactively, you are not changing the
data. You are merely redirecting MapInfo Professional to look for different information.
•
For more information, see Geocoding Interactively in the Help System.
In most cases, the best geocoding strategy is to geocode in automatic mode and then geocode in
interactive mode to deal with the records MapInfo Professional was unable to handle automatically.
Manual mode. Automatic and interactive geocoding work well for databases with “clean” data.
Sometimes, however, you know where a point should be on the map, but the location data does not
allow for a match. Manual geocoding is the process of placing your data records on the map by
clicking its location on the map. This method works best when you have a small table which contains
data that you are very familiar with.
•
For more information, see Geocoding Manually in the Help System.
Methods of Geocoding
In addition to geocoding automatically and manually, you have choices in how precise you want the
geocoded record to be. Let’s look at the variety of ways you can geocode your table.
Geocoding by Address
Street addresses typically consist of two or three components:
•
•
•
Street number
Street name
Apartment, Suite, Floor, Room number or some other piece of information. Many addresses do
not have this component
MapInfo Professional has one procedure for dealing with the street number and another procedure
for dealing with the street name. MapInfo Professional deals with the third component, if present, as
though it were a part of the street name.
MapInfo Professional 10.5
356
User Guide
Chapter 13: Putting Your Data on the Map
Geocoding – Assigning Coordinates to Records
When you geocode your table with street addresses, MapInfo Professional matches the addresses
in your table to the street names and address ranges in a street table, such as StreetPro (Pitney
Bowes Software Inc.’s premier streets data product) and assigns X and Y coordinates to your
records. When you display your records, MapInfo Professional will spot the record at the location of
the record’s address. MapInfo Professional places the record on the proper side of the street, offsets
it from the side of the street to the specified distance, and insets it from the end of the street the
specified percentage of the line. The Options dialog box controls these parameters. For more about
setting the street offset in the Options dialog box, see Street Offset in the Help System.
Geocoding by Boundary
In computer mapping, the term boundary is used to designate enclosed regions or areas such as
countries, cities, and postal codes. When you geocode your table with boundaries, MapInfo
Professional matches the boundary name in your table with the boundary name in the search table.
MapInfo Professional assigns the boundary centroid X and Y coordinates to your data records. The
centroid of a boundary is its approximate center point.
For example, you have a table of wholesale outlet stores. You want to assign X and Y coordinates to
each record according to county. MapInfo Professional reads the county name from your table,
matches it with the county name in the search table, and assigns the county centroid coordinates to
each of your records. The outlet locations will display at the county centroid in a Map window.
Geocoding by US_ZIPS.tab (Postal Code Centroid File)
US_ZIPS.tab is a point file that is included with the base MapInfo Professional package. The file
consists of postal code centroid points for every postal code in the United States. This file can be
used to geocode any database that includes postal code information. This file includes postal codes
that are assigned to individual buildings or companies.
You can use any of the above methods to geocode your records, or you can use a combination of
address and boundary geocoding to increase the potential for a successful match.
Geocoding by Server
If you have access to a geocoding server such as MapMarker or Envinsa Server, you can geocode
using a more extensive data set.
Refining Your Geocoding Search
When geocoding, you might refer to objects whose names are used for other objects that do not
interest you (for example, a city name that is common to two or more states). To eliminate this
problem, refine your search by selecting another column (from, typically, another table). To further
refine the search, specify the state for each city, rather than just the city name.
If your area of interest isn't unique enough for MapInfo Professional to automatically determine the
position or location, you will need to refine your geocode search by specifying a particular boundary
that contains your area of interest. This will provide MapInfo Professional with geographic locations
on where to position your points.
MapInfo Professional 10.5
357
User Guide
Chapter 13: Putting Your Data on the Map
Geocoding – Assigning Coordinates to Records
Finding an Exact Street Match
When MapInfo Professional geocodes, it attempts to find an exact match between source and target
street names. That means that the addresses must be the same, character for character. However,
matching is not case sensitive; upper and lower case letters are successfully matched with one
another. MapInfo Professional does not get an exact match in many cases and uses a file of
abbreviation equivalences to improve its “hit rate”. Once you understand the various ways in which a
match can fail, you are in a better position to understand what you can do to improve things.
The next table illustrates exact matching. The first column contains a street name from a target table
and the second column contains the corresponding street name from a source table. The third
column says why they do not match. The fourth column indicates whether the particular problem is
one which can be corrected through using the abbreviation file. This table assumes that the
addresses are the contents of a single column in a table. While the street number would often be in
the same column, we don’t indicate street numbers here because they are handled differently than
street names.
Target Address
Source
Address
Comment
Correctable
with
Abbreviation
File?
LaSal St
LaSalle St
“LaSal” is the wrong spelling.
No
La Salle St
LaSalle St
“La Salle” is the wrong spelling.
No
LaSalle Ave
LaSalle St
“Ave” does not match “St”.
No
LaSalle Street
LaSalle St
“Street” does not match “St”.
Yes
LaSalle Ave
LaSalle Av
“Ave” does not match “Av”.
Yes
LaSalle St.
LaSalle St
The target address has a period after
“St”. That period is not in the source
and causes the match to fail.
Yes
LaSalle
LaSalle St
“St” is missing from target.
No
LaSalle St
LaSalle
Target has “St” and source does not.
No
LaSalle St North
LaSalle St
Target has “North,” which is not in
source.
No
LaSalle St North
LaSalle St N
Target has “North” instead of “N”.
Yes
North LaSalle St
N LaSalle St
Target has “North” instead of “N”.
Yes
North LaSalle St
LaSalle St
Target has “North,” which is not in
source.
No
MapInfo Professional 10.5
358
User Guide
Chapter 13: Putting Your Data on the Map
Geocoding – Assigning Coordinates to Records
Target Address
Source
Address
Comment
Correctable
with
Abbreviation
File?
LaSalle St Apt 3
LaSalle St
Target has an apartment number which
does not match anything in the source.
Yes
Tenth St
10th St
“Tenth” and “10th” do not match.
Yes
10th Av
Tenth Av
“10th” and “Tenth” do not match.
Yes
Saint John’s Lane
St John’s Lane
“Saint” and “St” do not match.
Yes
MapInfo Professional’s matching process is not case-sensitive; it does not care whether a letter is
upper case or lower case. This means that MapInfo Professional treats the following as the same:
Main, MAIN, main, maIN.
MapInfo Professional has a file called the Abbreviations File (MAPINFOW.ABB), which you can use
to record acceptable alternate spellings for abbreviations. For example Av for Ave. or BL for Blvd.
etc. Using this file increases your hit rate because there are more acceptable spellings for the same
abbreviations.
•
For more information, see Solving Problems with Abbreviations and Substitutions in the Help
System.
Placing Geocoded Points
When you are geocoding to street level (by address), you can specify certain aspects of the resulting
points’ position in relationship to the street. You can specify the offset of the point from the side of
the street, and the inset of the point from the end of the street.
•
For more information, see Street Offset in the Help System.
Street Inset
The street inset is the distance a geocoded point is set from the end of the street. You can specify a
distance, or an inset can be a percentage of the length of the street. To avoid skewing the position of
inset points, MapInfo Professional performs a proportional calculation that insets the points located
at either end of the street the specified percentage or distance, but that decreases the inset as point
locations approach the center. Points located at the center of the street remain in their original
position.
•
For more information, see Street Inset and Controlling How Much to Inset and Offset a Point
when Geocoding in the Help System.
MapInfo Professional 10.5
359
User Guide
Chapter 13: Putting Your Data on the Map
Geocoding – Assigning Coordinates to Records
Matching Street Names
MapInfo Professional begins by comparing the street address in the target table with the street
addresses in the source table. When it finds an exact match, it may be finished or it may have to
deal with region information, such as town, county, or postal code area.
When MapInfo Professional cannot match the street name for a particular row, it applies the
abbreviation file to the target address. This file consists of pairs of items, such as “STREET ST” and
“AVE AV”. When MapInfo Professional finds “STREET” in a target address, it changes it into “ST”;
similarly it changes “AVE” to “AV”. MapInfo Professional doesn’t actually change your data in the
target table. It substitutes abbreviations only for the purpose of making matches. The substitution is
only effective during the matching process. The address in your table remains the same. It does not
write the correct address form back to your table.
Once MapInfo Professional has made an abbreviation substitution it attempts to match the resulting
street name against the street names in the source table. When it fails to find an exact match at this
point it:
•
•
In Automatic mode, it moves to the next row
In Interactive mode, it presents you with the closest matches and you pick the best match.
MapInfo Professional then moves on to the next row.
At this point MapInfo Professional will have done the best it can at identifying street names. The next
step is to deal with address numbers for those addresses where it has matched a name.
Matching Address Numbers
Given that MapInfo Professional has identified a street, it has to deal with street numbers. MapInfo
Professional stores address ranges with each street segment. MapInfo Professional takes the street
number from the target address and compares it to the ranges for each segment in the source table.
For example, assume that we are trying to match “343 LaSalle St”. MapInfo stores the beginning
and ending address for each segment, differentiating between left and right sides of the street, as
follows:
Name
FromLeft
ToLeft
FromRight
ToRight
LaSalle St
269
331
268
330
LaSalle St
333
375
332
374
LaSalle St
377
401
376
400
To match “343 LaSalle St” MapInfo Professional would scan the address ranges until it finds the one
where “343” goes. Since 343 is between 333 and 375, the applications locates this address on that
street segment (the middle one in the table). Once MapInfo Professional has matched an address
number to a street segment it moves to the next row. When it fails to match a target street number to
an address range on the appropriate street it:
•
In Automatic mode, it moves to the next row
MapInfo Professional 10.5
360
User Guide
Chapter 13: Putting Your Data on the Map
Geocoding – Assigning Coordinates to Records
•
In Interactive mode, it presents you with the closest matches and you pick the best match.
MapInfo Professional then moves on to the next row.
At this point MapInfo Professional has done the best it can at locating address numbers. Note that
one of the options (on the Geocode Options dialog box) is to automatically pick the closest address
range in cases where there is no exact match—Use The Closest Address Number. For example,
you might have “412” as an address number, but no range which includes that number. However,
there is a range which goes from 346 to 400. Since that is the range closest to 412, that is where
MapInfo Professional will geocode 412 if you have chosen this particular option. The next step is to
deal with addresses which have been located on more than one street.
Matching to Region
When MapInfo Professional is geocoding it checks to see how many occurrences of the target
address exist. If there is more than one, MapInfo Professional must decide which source address to
use. If the user’s target table has a column with region data, MapInfo Professional can refine
geocoding within a boundary.
For example, assume that you are geocoding a database of records in Cook county, Illinois. The
address in the database reads 200 Washington St. Within the county of Cook, there are eight towns.
Four of these towns have a Washington St. Three of the four have a 200 Washington St. MapInfo
Professional must now place the target address in the appropriate town. MapInfo Professional uses
region information to do this. MapInfo Professional now matches a region designation for the target
address against the region designator for the source addresses.
When you originally set up your geocoding operation, you had an opportunity to specify a region
(boundary) to use in refining your geocoding operation. This dialog box displays when you choose
Refine Search with Table and using Boundary Name Column.
If you specified a postal code table you enter the postal code and MapInfo Professional returns
possible matches.
MapInfo Professional 10.5
361
User Guide
Chapter 13: Putting Your Data on the Map
Geocoding – Assigning Coordinates to Records
You could use any one of several different region types, including county name, town name, and
postal code. Since almost all addresses contain postal codes, this is the most reliable way to refine
your search. When you set MapInfo Professional to use postal codes to refine its address matching,
MapInfo Professional will match the postal code of the target address against the postal code of the
various matching source addresses. When it finds the correct match, it is finished with the geocoding
process. MapInfo Professional can now get coordinate information from the source table and use it
to place a point object into the target table.
However, once MapInfo Professional has completed this process, many addresses may be
unmatched. You can match each one of them individually by geocoding in interactive mode.
However, if you are working with a large database, you want to do as little of this as possible. There
are other ways of improving MapInfo Professional’s geocoding performance.
In the Geocode Options dialog box, you can specify that MapInfo Professional automatically pick a
different boundary, providing there is only one, from the one you specify (Use A Match Found In A
Different Boundary). You might have had MapInfo Professional geocode addresses to Northtown.
One particular address, “223 Locust Ct.” is not in Northtown, but it is in Westville, and no place else.
In this case, MapInfo Professional would geocode “223 Locust Ct.” to Westville. However, if MapInfo
Professional had found a “223 Locust Ct.” in Westville and another one in Center Valley, it would not
geocode the address to either town. It would leave “223 Locust Ct.” ungeocoded.
For more information, see After Geocoding in the Help System. This section contains the following
topics:
•
•
•
•
•
Finding and Examining Ungeocoded Records
Extracting Longitude and Latitude from a Geocoded Table
Extracting Longitude and Latitude into a New Table
Extracting Longitude and Latitude into the Original Table
Extracting a Table in a Projection Other than Longitude/Latitude
Selecting Records Not Geocoded
Your geocoded table may have records that did not geocode, or you may have added new data to
your table that have yet to be geocoded. There is a simple selection that can be performed to get a
Browser list of the records not geocoded.
1. Open your table if it is not open already, and on the Query menu, click Select.
2. Fill in the Select dialog box. The expression used is “NOT OBJ.” This selects all of the records
that are not objects, for example, not geocoded. Click OK.
MapInfo Professional 10.5
362
User Guide
Chapter 13: Putting Your Data on the Map
Geocoding – Assigning Coordinates to Records
Locating Newly Geocoded Points
One of the most satisfying results of geocoding is seeing your points displayed correctly on the map.
Depending on the settings of your map, newly geocoded points may or may not be visible
immediately.
Follow these steps to attempt to locate newly geocoded points on the map.
1. Make sure that the Map window is active by clicking in its title bar.
2. Choose Map > Layer Control. The Layer Control window displays.
Make sure that the table you geocoded is listed in the Layer list. If it is not, then click the Add
Layers
button and add that layer.
3. In the Layer Control window move the geocoded table to the top, just below the Cosmetic layer,
to ensure that the points are not obscured by any other layer.
4. Make sure that the geocoded layer is set to visible. Check the Visible On/Off check box.
If your points are still not visible, proceed to step 6.
5. On the Map menu, click View Entire Layer. Select your table and click OK. This should put all of
the points from your table in view. You may see that your points are on the map, but are not in
the location you expected them to be. If they seem misplaced, see Ungeocoding Selected
Records on page 364.
6. If your points still do not display, on the Map menu, click Layer Control. Select the layer
containing your geocoded points, and click the Layer Properties
Properties dialog displays.
button. The Layer
7. On the Layer Display tab, select the Style Override check box and choose a symbol style that
will stand out on your map. Click OK and then exit Layer Control.
After following these steps, if you have not found the points that you geocoded, try to select all of the
ungeocoded records as described in the section Selecting Points Not Geocoded.
Result Codes
When you are using the result code option (in Geocode Options dialog box) MapInfo Professional
will generate a code for each record. These codes indicate the steps MapInfo Professional took to
geocode the record, whether or not the geocoding was successful, and whether or not the match
was exact. You can use return codes to diagnose MapInfo Professional’s geocoding performance. It
will help you spot “false positives” resulting from using various geocoding options and to analyze
why some records have not been geocoded.
Ungeocoding a Table
Ungeocoding is the process of removing objects that have been attached to data records. There are
times when it will be necessary to ungeocode an entire table or selected records in a table. For
example, you have geocoded a database of customers using US_ZIPS.tab. Later, you want to
geocode the database again, using street addresses instead of postal code centroids since the
MapInfo Professional 10.5
363
User Guide
Chapter 13: Putting Your Data on the Map
Geocoding – Assigning Coordinates to Records
geocoding will be more precise. MapInfo Professional allows you to delete all graphic objects
associated with this table. You can then geocode your database again, using more specific
coordinates. Ungeocoding only selected records from your table is useful when the location
information changes for a relatively small number of records, such as address changes in a
geocoded list of customers.
To ungeocode and remove one or more of the objects in a table:
1. Make the table you are working with the editable layer of the active Map window.
2. Select the object or objects.
3. Click the Map window to make it active.
4. Choose Edit > Clear Map Objects Only.
To ungeocode an entire table:
1. On the Table menu, point to Maintenance and click Table Structure. The Modify Table
Structure dialog box displays.
2. Clear the Table Is Mappable check box. Click OK.
CAUTION:
This action will remove all graphic objects from your table. This action cannot
be undone. If you are unsure of losing your points, save a copy of the table first.
3. A warning dialog box appears. If you are sure about removing all the objects, click OK.
All graphic objects have been removed from your table.
Make sure that you don’t ungeocode your source tables. Unless you have created a backup of that
table, you will no longer be able to display that table as a map or use it for geocoding.
Ungeocoding Selected Records
To ungeocode and remove one or more of the objects in a table:
1. Make the table you are working with the editable layer of the active Map window.
2. Select the object or objects.
3. Choose Edit > Clear Map Objects Only.
For more information about trouble shooting your geocoding issues, see Resolving Geocoding
Issues in the Help System. This section contains the following topics:
•
•
•
•
•
•
•
•
•
•
Resolving Spelling Errors in your Data Records
Resolving Incorrect Address Numbers in your Data Records
Working with the Abbreviations File
When an Input Address Finds More than One Location
Solving Problems of Space-Delimited Simple Substitution
Resolving Simple Truncation
Resolving Space-Delimited Truncation
Resolving Simple Substitution
Handling Legitimate Spaces
Handling Special Characters
MapInfo Professional 10.5
364
User Guide
Chapter 13: Putting Your Data on the Map
Putting Latitude/Longitude Coordinates on a Map
•
•
•
•
•
•
Resolving Alternate Street Names, Street Names have Changed
Resolving Incorrect Address Ranges
Geocoding Post Office Boxes
Correcting Inaccurate Town Names
Correcting Geocoding Errors using Result Codes
Examples of Geocoding Result Codes
Putting Latitude/Longitude Coordinates on a Map
You may have a file that already contains X and Y coordinates, but not the point objects themselves
that you want to display in MapInfo Professional. While the geographic information exists in the
table, MapInfo Professional needs to create points to represent these coordinates before displaying
them in a Map window. The Create Points command under the Table menu allows you to create
points for each record in your database that has X-Y coordinate information.
L
MapInfo Professional uses the coordinate fields in your table to create point objects. Records
that already have graphic objects associated with them will be skipped during the Create
Points operation.
For example, you have a table showing transmitter tower locations that was created by recording
coordinates using a global positioning system. You want to display the locations on a map in
MapInfo Professional. The table already has X and Y coordinate information but MapInfo
Professional cannot display this information until you create points for that coordinate data that
MapInfo Professional can read.
For more information, see the Putting Latitude/Longitude Coordinates on a Map in the Help System.
This section also contains these topics:
•
•
•
Creating Points from an Excel or Lotus Table
Creating Points from a Longitude/Latitude
Creating Points in a Projection
For more about the Degree Converter tool, see the Tools section of the Help System.
Dispersing Points Located in the Same Place
Depending on how you have geocoded your table, you may have several points that are placed at
the same location, making it difficult to tell if you are viewing one point or many. For example, if you
geocode a table of students by census tract, and view the results on your map, it appears that there
is one dot at the center of each tract when there actually may be several there. To see all of your
data, you may want to disperse the points over a small area. There are three methods for dispersing
points: the Disperse Points tool (a tool that comes with MapInfo Professional), equal dispersion, and
dispersion to the right.
•
For specific instructions, see the Dispersing Points Located in the Same Place in the Help
System.
MapInfo Professional 10.5
365
User Guide
Chapter 13: Putting Your Data on the Map
Putting Latitude/Longitude Coordinates on a Map
Creating Points for Intersections
Many people working with street files are often interested in information that is located at
intersections. For some, their only concern is the intersections. In MapInfo Professional you can
geocode to intersections in your street file with the Geocode command, but it would be easier to
work with a table that contained only intersections. For example, a municipality is interested in
tracking the types of traffic control devices at each street intersection. It would be beneficial for them
to make an entire layer that contains the intersection of every street.
•
For specific instructions, see Creating Points for Intersections in the Help System.
Geocoding Data using a Server
Using the MapMarker and Envinsa Web Services, you have more choices for geocoding. For
example, you can choose to geocode your records by street address or by postal code centroid, or
by geographic centroids. If you have geocoded some records and some did not geocode
successfully, you can set fallback conditions to locate those records. If you geocode and there are
no results, poor results, or multiple equal close results, the geocoding server can present you with
interactive options so you can select among possible matches or change your input. Further, these
web services allow you to set multiple matching conditions when more than one record matches the
records you are geocoding and set offsets for placing points right in the geocode properties.
For companies and organizations that use MapMarker and Envinsa servers as a geocoding engine,
you can now take advantage of the geocoding servers available to your whole enterprise. If your
organization makes this server available on your intranet or over the Internet, you can use our
geocoding web services from within MapInfo Professional to perform more sophisticated and
accurate data geocoding.
To use MapInfo Professional with a geocoding server, you need MapMarker Java Server 4.0 or later
or Envinsa 4.0 or later. MapInfo Professional supports any geography that is supported by Envinsa
currently. Envinsa supports MapMarker Java Server V2, V3, and V4. Keep in mind that any Envinsa
server only supports the data that is installed.
Before you can access a MapMarker or Envinsa geocoding service, you need to connect MapInfo
Professional to its server. This process gives MapInfo Professional all the information it needs to
access the geocoding service. You need to enter this information only once per service.
To set up a geocoding server and its preferences, see Setting up a Geocoding Server on
page 209 and Setting the Geocoding Server Preferences on page 203.
To geocode a single address using a geocoding service, see Geocoding a Single Address using
a Geocoding Service on page 408.
•
To geocode a table of addresses using a geocoding service, see Geocoding a Table using a
Geocoding Service in the Help System.
MapInfo Professional 10.5
366
User Guide
Chapter 13: Putting Your Data on the Map
Displaying Your Data on the Map
Displaying Your Data on the Map
Once you have converted your data and geocoded or created points for it, you are ready to display
the results.
To display your data in a new Map window:
1. On the Window menu, click New Map Window and select the tables you want in your map. The
order in which you select these tables determines the order they display.
2. Click OK to display your data on the map you selected.
3. To change the symbol used to display your data, choose Map > Layer Control. The Layer
Control window displays.
4. Click the Style Override swatch for the layer with your data in it and select new display options.
To display your data on an existing Map window:
1. Open the .tab files or .WOR files you want to plot your converted data onto.
2. Open the .tab files or .WOR files you just created and in the Preferred View drop-down box
select the Current Mapper option.
3. Click Open.
MapInfo Professional 10.5
367
User Guide
Chapter 13: Putting Your Data on the Map
Printing Your Results
After Displaying Your Data on the Map
Now that your data is there to see, make it say something to your audience. The whole world of
MapInfo Professional functionality is open to you. For details on analyzing your data, see Creating
Thematic Maps, Legends, and Other Maps on page 229 or see Drawing and Editing Objects
on page 157 for more about customizing your map.
Finding Data on your Map
The Find Selection in Current Map Window command allows you to search and display a
selection in the currently active Map window. You can not search for the selection in other types of
windows (Browser or Layout, for example) using this command. You can access this option by
pressing the <Ctrl G>.
The Find Selection in All Windows command allows you to locate the selection in all open
windows (including a Browser window) that are currently open.
To access Find Selection in Current Map Window:
1. Perform the Query > Find or Query > Find Selection.
2. Choose Query > Find Selection > In Current Map Window.
L
Choosing the In Current Map Window option shortens the search time.
To access Find Selection in All Windows:
1. Perform the Query > Find or Query > Find Selection.
2. Choose Query > Find Selection > In All Windows.
•
For more information, see Saving and Closing Query Tables in the Help System.
Printing Your Results
Once you have created the perfect map or graph, you can easily print the individual windows. For
presentation, use the Layout menu to bring together all views of your mapping session. Here, you
can combine different types of windows to create an attractive and more informative presentation.
On the Window menu, click New Layout Window to display a Layout window that you can use to
arrange your maps, browse tables, graphs, legends, titles, logos, etc. See Working with Layouts
on page 306, for tips and techniques about working in the Layout window.
Setting up the Page
Before you print your map or layout, you will need to set up your page. In the Page Setup dialog box
(on the File menu, click Page Setup), specify the paper size, orientation, and margins.
MapInfo Professional 10.5
368
User Guide
Chapter 13: Putting Your Data on the Map
Printing Your Results
For detailed printing instructions, see Printing your Map in the Help System. These topics are also in
this section:
•
•
•
•
•
Saving or Restoring Printer Information in Workspaces
Advanced Printing Options
Graph/Browser/3DMap Printing Options
Overriding the Default Printer
Printing Maps to PDF Files
Printing Your Map
When you have your page set up the way you want, you are ready to print.
To print your map:
1. On the File menu, click Print to display the Print dialog box. This dialog box allows you to specify
printer properties, a page range for printing, and the number of copies to print.
MapInfo Professional 10.5
369
User Guide
Chapter 13: Putting Your Data on the Map
Printing Your Results
You can override the default printer setting by selecting another print from the Name drop-down
list.
L
The PDF button is available on the Print dialog box only when the Printer name is
MapInfo PDF Printer Version 10.5.
2. If you need to change the size of the map, the orientation of your map or want to specify the
scale or a custom width or height, click the Options button. If you are printing a map, the Map
Print Options dialog box displays.
L
If you are printing a graph or a browser or a 3DMap, your options will be different.
The Map Window Preference setting Use Cartographic Scale affects the entries in this
dialog box.
MapInfo Professional 10.5
370
User Guide
Chapter 13: Putting Your Data on the Map
Printing Your Results
3. Here you can specify the size of the map, how its contents will display, the scale, and its width
and height. For details on the other print options, see Graph/Browser/3DMap Printing Options in
the Help System. When you have completed your selections, click OK to continue.
•
•
•
•
•
•
•
Map Size — Select the size of the map you are producing in this group; the options are
Window Size, Fit to Page, and Custom. As you make selections, the Custom Scale, Custom
Width and Custom Height entries change.
Window Size — Click this button to print the map as it displays on your computer screen.
Fit to Page — Click this button to fit the current map to the page size you have selected in
your preferences.
Custom — Click this button to enter your own custom scale, width, and height entries in the
fields provided. Then, type the appropriate entries in the Custom Scale, Custom Width and
Height fields.
Map Contents — Select an option in this group to determine the map contents you want to
print; the options are Same as Window and Centered on Window.
Same as Window — Click this button to print the map contents as it appears in the Map
window, with the same proportions and content as you see.
Centered on Window — Click this button to center as much of the current map that fits on
the page. When you select this option, the image may print on more than one page
depending upon fit. In general when you select this option, MapInfo Professional assumes
you want to select the Fit to Page radio button and selects this for you.
4. If your map is particularly complex (a large map, 3D, or one with 10 or more colors) there are
more options available using the Advanced button. The Advanced Printing Options dialog box
displays. (See Advanced Printing Options in the Help System). When you have completed your
selections, click OK to continue.
5. After you complete your selections, click OK on the Print dialog box to print your results.
Viewing and Printing Text
Text size is handled differently in maps and layouts. You should keep these differences in mind
when printing maps and layouts containing text objects and when fine tuning text.
Text Size in Layouts
In the Layout, the point size of the text is specified relative to the actual size of the page (that is, the
size in which it will print), just as it is in word processing and desktop publishing programs. When
you zoom in and out on a Layout, the text will be larger or smaller on the screen, but its specified
point size (as indicated in its attributes box) remains the same.
The font and size of text objects in the Layout Window may not appear as they do on the printed
page. There are several possible reasons for this: fonts available for screen display are not available
for your printer, screen character width is different than printer character width, and screen
resolution is different than printer resolution.
To find out the true size of a text object in the Layout Window, use the Select tool and click on the
object. The edit handles indicate the object's true size.
MapInfo Professional 10.5
371
User Guide
Chapter 13: Putting Your Data on the Map
Printing Your Results
Text Size in Maps
In maps, text size is specified relative to the screen. When you zoom in and out on a map, the size of
the text on the screen and the specified point size of the text will change. If you zoom in, text will
appear larger, as will all visible elements of the map. The point size of the text (as indicated in its
attributes box) will be appropriate to the text being displayed on screen.
Troubleshooting Print Problems
Good first steps in troubleshooting a printing problem are to make sure you have downloaded and
installed the latest patch for MapInfo Professional and are using the latest printer driver for your
printer/operating system. You can get additional printer advice in the MapInfo Professional Printing
Guide, which is located in the Documentation subfolder of your installation directory.
When we discuss printer issues, we make the following assumptions about your print environment:
•
•
•
•
The printer/plotter has been installed properly
The printer/plotter drivers have been installed correctly
The printer/plotter is connected to the computer or to the network properly
There is sufficient memory (on the print device and on the computer) to print your files
Any of these issues can affect your ability to print/plot your MapInfo Professional output. Our
Technical Support professionals may be able to identify these difficulties, but they are not within their
control.
L
Whenever we use the terms print or printer we also mean plotter.
When Printing a MapInfo Professional Object From Another Application
When you embed a MapInfo map or graph in another application (such as Word or PowerPoint),
click outside the map/graph before you use the Print or Print Preview commands. This allows the
container application to take over previewing or printing properly. This is particularly true if you have
just made changes to the map or graph you are printing.
Working with Fill Patterns
Note that fill patterns on the first row of the Region Style dialog box are Windows standard and tend
to print faster. The other patterns are bitmaps Pitney Bowes Software Inc. has created for your use.
You might want to consider this when you are selecting fill patterns. See also Recommendations for
Effective Pattern Scaling in the MapInfo Professional Help System for more information regarding
scaling and printing fill patterns.
Translucent Raster Maps/Grids and Windows 9X Don’t Mix
You cannot print a translucent raster map or grid on Windows 9X platforms or export them to EMF or
WMF file formats. You need to use a non-metafile (for example, .BMP or .GIF) format to export
raster images on Windows 9X.
Customers printing large images (such as destination page size D, E, or A0) no longer have the
28,000 pixel limitation. If you experienced printer difficulties in the past due to this limitation, you
should notice a significant improvement in your printed images.
MapInfo Professional 10.5
372
User Guide
Chapter 13: Putting Your Data on the Map
Printing Your Results
Sometimes the Older Driver is Better
When in doubt, if an older driver worked and the new one does not, go back to the older driver.
Make Room for the Metafile
Make sure you have plenty of temporary disk space, particularly if you are using the Print using the
Enhanced Metafile option. The system is trying to create a layered bitmap locally on disk.
Spool Locally, Print Globally
Try spooling print jobs locally rather than at the plotter. This allows the computer to rasterize your
output rather than the printer, which can be more efficient.
•
For print spooling instructions, see Troubleshooting Printing Problems in the Help System.
MapInfo Professional 10.5
373
User Guide
Working with Coordinate
Systems and Projections
Maps at their base are a visual representation in two dimensions of a section of
the three-dimensional Earth. Being able to use maps in an electronic format in
many ways frees us from the constrictions of the two-dimensional map because
we can use mathematical formulas to compensate for the curvature of the
Earth. In this chapter, we cover the coordinate systems and projections that are
standard in MapInfo Professional and provide the tools with which you can
create a custom projections to meet your organization’s needs. Whether you
are a local government trying to establish new tax rolls or a large company
trying to define your sales territory more precisely, creating a custom projection
may be a solution you want to explore.
Topics in this Section:
•
Working with Coordinate Systems . . . . . . . . . . . . . . . . . . . . . . . .375
Building Blocks of a Coordinate System . . . . . . . . . . . . . . . . . . .381
Adding Projections to the MAPINFOW.PRJ File . . . . . . . . . . . . .389
Understanding Precision in MapInfo Professional . . . . . . . . . . .392
Understanding Affine Transformations . . . . . . . . . . . . . . . . . . . .392
Using Earth and Non-Earth Maps . . . . . . . . . . . . . . . . . . . . . . . . .395
For more information, see Using Ocean and Grid Tables and
Frequently Asked Projection File Questions in the Help System.
14
Chapter 14: Working with Coordinate Systems and Projections
Working with Coordinate Systems
Working with Coordinate Systems
The terms “projection” and “coordinate system” are often used interchangeably, however they do not
mean the same thing.
Projection - An equation or set of equations that contain mathematical parameters for a map. The
exact number and nature of the parameters depends upon the type of projection. You can think of a
projection as a method of reducing a map’s distortion caused by the curvature of the Earth, or more
precisely, a projection compensates for the shortcomings of depicting maps in two dimensions when
the coordinates exist in three dimensions.
Coordinate System - When parameters of a projection are assigned specific values, they become a
coordinate system. A coordinate system is a collection of parameters that describe coordinates, one
of which is a projection.
Displaying Coordinates
There are two places where coordinates display:
•
•
In the Status Bar by cursor location (set in the Map Options dialog box or by clicking on the
Status Bar).
In dialog boxes that display area measurements, such as a Point Object, Region Object etc.
L
Coordinates can only be entered in the Object Info dialog boxes when a layer is editable.
You can display coordinates in one of the following formats:
•
•
•
•
•
Decimal degrees (for example -97.90052°, 42.85732°)
Degrees, minutes, seconds (for example -97° 54’ 1.908", 42° 51’ 26.28")
Military Grid Reference (WGS 1984 datum) (for example 14TNN8982545555)
US National Grid Reference (NAD 83/WGS 84) (for example 14TNN8982545555)
US National Grid Reference (NAD 27) (for example 14TNN8985745342 (NAD 27))
The default is Decimal degrees.
Elements of a Coordinate System
A coordinate system in MapInfo Professional is made up of many elements which need to be
specified in advance. Once these elements are in place, you can be sure that your maps are as
accurate as possible. These are the projection elements you need to set in the MAPINFOW.PRJ file:
•
•
•
•
•
•
•
Projection Types
Datums
Units
Coordinate System Origin
Standard Parallels (Conic Projections)
Oblique Azimuth (Hotine Oblique Mercator)
Scale Factor (Transverse Mercator)
MapInfo Professional 10.5
375
User Guide
Chapter 14: Working with Coordinate Systems and Projections
Working with Coordinate Systems
•
•
False Easting and False Northing
Range (Azimuthal Projections)
L
For datum and unit tables, see Projection Datums on page 456 and Units on page 464.
Understanding Coordinate Systems
You can make a map out of any globe without distorting the points on the surface by placing the
globe into an imaginary cylinder.
Figure: Globe with Longitude/Latitude Projection
If you transfer the touch points from the globe surface onto the cylinder and roll out the cylinder onto
graph paper, the result is a map as in the figure below. In the map that would be created from this
cylinder, the Equator is 0 degrees all the way around the globe and the points on that line are
completely accurate.
MapInfo Professional 10.5
376
User Guide
Chapter 14: Working with Coordinate Systems and Projections
Working with Coordinate Systems
Figure: Longitude/Latitude Projection Map
When you add longitude and latitude lines at 15 degree increments to each side of the Equator and
the Prime Meridian you create a reference grid. The lines furthest from the Prime Meridian are +180
degrees toward the right and -180 degrees to the left. This map projection is commonly called the
Longitude/Latitude projection.
This is often considered the default projection. It is the most effective map for areas nearest the
Equator but measurements further away tend to increase in distortion.
Because many people do not live near the Equator, other projections came into use to create more
accurate local maps. Accuracy depends upon how you project the globe onto the cylinder. If you turn
the cylinder so that it touches the Prime Meridian instead (or any line of longitude, 90 degrees away
from the Equator) you have a Transverse Projection. The closer you are to the place the cylinder
touches the globe, the more accurate the measurements are.
Figure: Globe Demonstrating the Transverse Projection
Transverse projections allow us to make maps that are more North-South line accurate, as long as
you compensate for the distance from the new “Equator” which in this case is the Prime Meridian.
MapInfo Professional 10.5
377
User Guide
Chapter 14: Working with Coordinate Systems and Projections
Working with Coordinate Systems
Figure: Transverse Mercator Projection Map
A third type of projection attempts to resolve the distortion problem in another way. Conic projections
use a cone shape instead of a cylinder to create the “touch points” .
Figure: Globe with Conic Projection
This type of projection is much more accurate for large regions or countries that are wider in the
East-West direction than in the North-South direction. There is much less distortion regionally
because the touch points of a cone are closer to the map surface than those of a cylinder.
MapInfo Professional 10.5
378
User Guide
Chapter 14: Working with Coordinate Systems and Projections
Working with Coordinate Systems
Figure: Brazilian Polyconic Projection Map
As you can see from the previous figure, the conic maps are best for small regional areas. The
larger-scale map has too much distortion to be useful.
A fourth type of projection, the Azimuthal projection, does not use cones or cylinders but a simple
circle that goes all the way around the globe over a particular point. This projection provides a “view
from space” over a particular point.
Figure: Globe with Azimuthal Projection
This type of projection is most useful when you need to work with a particular hemisphere. A
hemisphere need not be North-South or East-West based. The next figure uses the North Pole as
the center point for the Azimuthal Projection.
MapInfo Professional 10.5
379
User Guide
Chapter 14: Working with Coordinate Systems and Projections
Working with Coordinate Systems
Figure: Lambert Azimuthal Projection Map
You can use more than one projection that rotates a cylinder slightly along the Equator. This style is
used in the Universal Transverse Mercator (UTM) projection. UTM maps the Earth with a transverse
cylinder projection to create standard "UTM Zones". By rotating the cylinder around the globe in six
degree increments, the UTM assures that all spots on the Earth are within 3 degrees of the center
line. (The Gauss-Kruger system is a European system akin to UTM that also uses a transverse
cylinder rotated in six degree steps).
Figure: Universal Transverse Mercator Projection Map (UTM Zone 29)
Almost all projections you will use are one of these types. They are either cylindrical (regular or
transverse), conic, or azimuthal projections and are customized by slightly different projection
parameters. Projection parameters are options that describe how the projection is arranged.
You can further customize projections by specifying different parameters for the projection you want
to use. For example, you can specify the longitude and latitude of any point on the Earth to create
your own Azimuthal projection of that point. You can customize conic projections by specifying the
parallel of latitude at which the cone should be tangent.
MapInfo Professional 10.5
380
User Guide
Chapter 14: Working with Coordinate Systems and Projections
Building Blocks of a Coordinate System
Building Blocks of a Coordinate System
In this section, we provide the tables required to create your own coordinate systems using map
projections, datums, units, Origins, Standard Parallels, Azimuths, Scale Factors, False Eastings,
False Northings, and Ranges. You might want to create your own coordinate system if accuracy is
crucial to understanding your data or if your data is specified in relation to a non-standard point, and
you would prefer to keep your data in that custom coordinate system.
Coordinate Systems, Projections, and their Parameters
By specifying a projection type and various required parameters, you create a mathematical
algorithm for producing equivalent coordinates in degrees for the projected coordinate system. Each
projection has specific parameters you can customize to make your maps more geographically
accurate. The following table details each major coordinate system type and the parameters you can
use to customize that system. The parameters are listed in the order they appear in the relevant
projection entries in the MAPINFOW.PRJ file. To create your own coordinate system using a
particular projection, you must add an entry into the MAPINFOW.PRJ file.
The parameters of a coordinate system are (in this order):
•
•
•
•
•
•
•
•
•
•
•
•
•
Coordinate System Name
Projection Type
Datum
Units
Original Longitude
Original Latitude
Standard Parallel 1
Standard Parallel 2
Azimuth
Scale Factor
False Easting
False Northing
Range
L
Each of these headings is described in detail in the next few pages.
For a complete list of common coordinate systems and their necessary parameters, see
Projections and Their Parameters on page 452
MapInfo Professional 10.5
381
User Guide
Chapter 14: Working with Coordinate Systems and Projections
Building Blocks of a Coordinate System
Projection Types
The following list names the projection types used in the MAPINFOW.PRJ file. These projection
types indicate the type of map you are using as the basis for your projection.
Number
Projection
9
Albers Equal-Area Conic
28
Azimuthal Equidistant (all origin latitudes)
5
Azimuthal Equidistant (polar aspect only)
30
Cassini-Soldner
2
Cylindrical Equal-Area
14
Eckert IV
15
Eckert VI
6
Equidistant Conic, also known as Simple Conic
33
Equidistant Cylindrical
17
Gall
7
Hotine Oblique Mercator
4
Lambert Azimuthal Equal-Area (polar aspect only)
29
Lambert Azimuthal Equal-Area
3
Lambert Conformal Conic
19
Lambert Conformal Conic (modified for Belgium 1972)
1
Longitude/Latitude
10
Mercator
11
Miller Cylindrical
13
Mollweide
18
New Zealand Map Grid
31
Prince Edward Island Double Stereographic
27
Polyconic
26
Regional Mercator
MapInfo Professional 10.5
382
User Guide
Chapter 14: Working with Coordinate Systems and Projections
Building Blocks of a Coordinate System
Number
Projection
12
Robinson
16
Sinusoidal
20
Stereographic
25
Swiss Oblique Mercator
8
Transverse Mercator (also known as Gauss-Kruger)
21
Transverse Mercator (modified for Danish System 34 Jylland-Fyn)
22
Transverse Mercator (modified for Danish System 34 Sjaelland)
23
Transverse Mercator (modified for Danish System 34/45 Bornholm)
24
Transverse Mercator (modified for Finnish KKJ)
Specifying the Bounds for Coordinate Systems
You can specify the bounds for coordinate systems in the Mapinfo Professional .PRJ file. To do so,
add 2000 to the projection number and list the bounds after the projection parameters. The general
form is:
name, projectionnum + 2000, projection parameters, x1, y1, x2, y2
For example, to define a UTM Zone 10 coordinate system with bounds of (100000, 400000) to
(200000, 450000), use this line:
“UTM Zone 10”, 2008, 74, 7, -123, 0, 0.9996, 500000, 0, 100000, 400000,
200000, 450000
To define a Longitude / Latitude coordinate system with bounds of (-50, 30) to (-48, 35), use this line:
“Longitude / Latitude”, 2000, 0, -50, 30, -48, 35
You can also define a coordinate system with bounds and an affine transformation. In that case, add
3000 to the projection number, and list the bounds after the affine transformation constants. The
general form is:
name, projectionnum + 3000, projection parameters, unitnum, A, B, C, D,
E, F, x1, y1, x2, y2
Accounting for Affine Transformations and Explicit Bounds in Projection Types
You can modify projection type entries in the MAPINFOW.PRJ to add a constant value to account
for affine transformations and explicit bounds. Valid constant values are listed in the next table:
MapInfo Professional 10.5
383
User Guide
Chapter 14: Working with Coordinate Systems and Projections
Building Blocks of a Coordinate System
Constant
Coordinate System has:
Parameters
1000
Affine transformations
Affine units specifier and coefficients appear after the
regular parameters for the system.
2000
Explicit bounds
Bounds appear after the regular parameters for the
system.
3000
Both affine transformations
and bounds
Affine parameters follow system’s parameters;
bounds follow affine parameters.
Example:
In this example we use the Transverse Mercator coordinate system with the NAD 1983 datum. You
might have this line in your MAPINFOW.PRJ file:
"UTM Zone 1 (NAD 83)", 8, 74, 7, -177, 0, 0.9996, 500000, 0
If you want to account for an affine transformation for this system, you would add the constant to the
projection type and append the parameters of the affine transformation as listed below:
Units=meters; A=0.5; B=-0.866; C=0; D=0.866; E=0.5; and F=0
Therefore, the new entry to append the parameters of the affine transformation would be:
"UTM Zone 1 (NAD 83) - rotated 60 degrees", 1008, 74, 7, -177, 0,
0.9996, 500000, 0, 7, 0.5, -0.866, 0, 0.866, 0.5, 0
where:
Entry
Description
1008
Achieved by adding the constant (1000) to the projection type (8)
7
Units for the affine transformation (7 = meters)
0.5, -0.866, 0, 0.866, 0.5, 0
Affine parameters. )
To supply explicit bounds to the coordinate system (x1, y1, x2, y2)=(-500000, 0, 500000, 1000000),
the required line entries would be:
"UTM Zone 1 (NAD 83) - bounded", 2008, 74, 7, -177, 0, 0.9996, 500000,
0, -500000, 0, 500000, 1000000
where:
Entry
Description
2008
Produced by adding the constant (2000) to the projection type (8)
-500000, 0, 500000, 1000000
Explicit bounds parameters
MapInfo Professional 10.5
384
User Guide
Chapter 14: Working with Coordinate Systems and Projections
Building Blocks of a Coordinate System
To customize the coordinate system using both the affine transformation and explicit bounds, the
entry in the MAPINFOW.PRJ would be:
"UTM Zone 1 (NAD 83) - rotated and bounded", 3008, 74, 7, -177, 0,
0.9996, 500000, 0, 7, 0.5, -0.866, 0, 0.866, 0.5, 0, -500000, 0,
500000, 1000000
where:
Entry
Description
3008
Produced by adding the constant (3000) to the projection type (8)
7
Units for the affine transformation (7 = meters)
0.5, -0.866, 0, 0.866, 0.5, 0
Affine parameters
-500000, 0, 500000, 1000000
Explicit bounds parameters (See Accounting for Affine
Transformations and Explicit Bounds in Projection Types on
page 383.)
Datums
A datum is established by tying a reference ellipsoid to a particular point on the earth. The following
Datums table lists the details for each datum:
•
•
•
•
The number used to identify the datum in the MAPINFOW.PRJ file.
The datum’s name
The maps for which the datum is typically used
The datum’s reference ellipsoid
For a comprehensive list of supported projection datums, see Projection Datums on page 456. For
a list of datum changes by version, see Coordinate System Enhancements by Version on
page 467.
L
To create a custom datum, see Defining Custom Datums in the Help System.
Converting Coordinates from One Datum to Another
When converting coordinates from one datum to another, MapInfo Professional has used the
Molodensky (3-parameter) and Bursa-Wolfe (7-parameter) methods. These are general-purpose
methods that can convert coordinates from any datum to any other datum.
After the NAD 83 datum was introduced, NOAA developed a program called NADCON, which
stands for North American Datum CONversion. This is a very specialized program that converts
coordinates only from NAD 27 to NAD 83 and vice versa. For this specialized task, it's much more
accurate than the Molodensky general-purpose method; NADCON is accurate to about 0.1 meter,
and Molodensky is accurate to only 10-30 meters. Most U.S. government agencies, including the
Census Bureau, have standardized on NADCON for converting between NAD 27 and NAD 83.
MapInfo Professional 10.5
385
User Guide
Chapter 14: Working with Coordinate Systems and Projections
Building Blocks of a Coordinate System
The NADCON algorithm is used to convert coordinates between NAD 27 and NAD 83 if those
coordinates lie within the areas covered by NADCON (United States, Puerto Rico, and the Virgin
Islands). If the coordinates lie outside those areas, or if they use datums other than NAD 27 or NAD
83, MapInfo Professional uses the Molodensky or Bursa-Wolfe conversion methods.
Due to the file access required, the NADCON conversion method can be slightly slower than the
Molodensky method. If you want to turn off the NADCON conversion, add a “NADCON” entry to the
registry. The registry entry should have this path:
HKEY_LOCAL_MACHINE\Software\MapInfo\MapInfo\Common\NADCON
If this entry is set to zero, then the Molodensky conversion method will be used instead of NADCON.
NADCON=0
Units
The units indicate the measurement that the projection uses to keep track of space. To find a
complete list of units and their corresponding projection entries, see Units on page 464.
Coordinate System Origin
The coordinate system origin is the point on the Earth (specified as longitude and latitude degrees)
from which all coordinate distances are to be measured. X = 0 and Y = 0 at the origin point, unless a
false easting and/or false northing is used (see below). It is chosen to optimize the accuracy of a
particular coordinate system. As we move north from the origin, Y increases; X increases as we
move east. These coordinate values are generally called northings and eastings.
For the Transverse Mercator projection, the origin’s longitude defines the central meridian. In
constructing the Transverse Mercator projection a cylinder is positioned tangent to the earth. The
central meridian is the line of tangency. The scale of the projected map is true along the central
meridian.
In creating a Hotine Oblique Mercator projection it is necessary to specify a great circle that is not
the equator nor a meridian. MapInfo Professional does this by specifying one point on the ellipsoid
and an azimuth from that point. That point is the origin of the coordinate system.
Standard Parallels (Conic Projections)
In conic projections a cone is passed through the earth intersecting it along two parallels of latitude.
These are the standard parallels. One is to the north and one is to the south of the projection zone.
To use a single standard parallel specify that latitude twice. Both are expressed in degrees of
latitude.
Oblique Azimuth (Hotine Oblique Mercator)
When specifying a great circle (such as the Hotine Oblique Mercator) using a point and an azimuth
(arc), the azimuth is called the Oblique Azimuth and is expressed in degrees.
MapInfo Professional 10.5
386
User Guide
Chapter 14: Working with Coordinate Systems and Projections
Building Blocks of a Coordinate System
Scale Factor (Transverse Mercator)
A scale factor is applied to cylindrical coordinates to average scale error over the central area of the
map while reducing the error along the east and west boundaries. The scale factor has the effect of
recessing the cylinder into the earth so that it has two lines of intersection. Scale is true along these
lines of intersection.
You may see the scale factor expressed as a ratio, such as 1:25000. In this case it is generally
called the scale reduction. The relationship between scale factor and scale reduction is:
scale factor = 1-scale reduction
In this case the scale factor would be 1-(1/25000) or 0.99996.
False Easting and False Northing
As you can see in the Longitude/Latitude Projection Map on page 377, X and Y coordinate
parameters are commonly designated in relationship to a single point. Points to the left of that center
point are negative and points to the right are positive. Points above that center point are positive and
points below that point are negative.
In the days of the tall ships, these calculations and computations were done by hand. Using positive
and negative signs made these calculations more complicated. The terms “false easting” and “false
northing” were used to remove these signs and refer to the absolute value of the X and Y
coordinates. MapInfo Professional handles these computations, but these parameters still have to
be accounted for in the projections that use them.
Range (Azimuthal Projections)
The range specifies, in degrees, how much of the Earth is visible. The range can be between 1 and
180. When you specify 90, you see a hemisphere. When you specify 180 you see the whole earth,
though much of it is very distorted.
MapInfo Professional 10.5
387
User Guide
Chapter 14: Working with Coordinate Systems and Projections
Building Blocks of a Coordinate System
About Polyconic Coordinate Systems
The following description has been copied from “Map Projections – A Working Manual”, USGS
Professional Paper 1395, by John P. Snyder.
The Polyconic projection, usually called the American Polyconic in Europe, achieved its name
because the curvature of the circular arc for each parallel on the map is the same as it would be
following the unrolling of a cone which had been wrapped around the globe tangent to the
particular parallel of latitude, with the parallel traced onto the cone. Thus, there are many (”poly”) cones involved, rather than the single cone of each regular conic projection.
The Polyconic projection is neither equal-area nor conformal. Along the central meridian,
however, it is both distortion free and true to scale. Each parallel is true to scale, but the
meridians are lengthened by various amounts to cross each parallel at the correct position along
the parallel, so that no parallel is standard in the sense of having conformality (or correct angles),
except at the central meridian. Near the central meridian, distortion is extremely small.
This projection is not intended for mapping large areas. The conversion algorithms used break
down when mapping wide longitude ranges. For example, WORLD.TAB, from the sample data
shipped with MapInfo Professional, may exhibit anomalies if reprojected using Polyconic.
Examples of Projection Entries in the MAPINFOW.PRJ File
The MAPINFOW.PRJ file lists the parameters for each coordinate system on a separate line, as in
the following examples:
“Mollweide (Equal Area)”, 13, 62, 7, 0
“Albers Equal–Area Conic (Alaska)”, 9, 63, 7, –154, 50, 55, 65, 0, 0
“UTM Zone 9 (NAD 27 for Canada)”, 8, 66, 7, –129, 0, 0.9996, 500000, 0
This is a basic list of the elements of a coordinate system, for review. There are some projections
that do not require all of the elements in the list. Following this list, you can see some entries from
the .PRJ file.
1. The first element in each list is the name of the projection in quotes.
2. The second element in each list is the number that identifies the projection number as indicated
in Projection Types on page 382.
3. The third element in each list is the datum ID that identifies the appropriate datum for the
projection. See Datums on page 385 for a complete list of supported datums.
4. The fourth element in each list is the units, which indicate the units of the projection. See Units
on page 464 for a current list of the supported units.
5. The next element in some lists is the coordinate system origin. See Coordinate System Origin
on page 386 for a complete description of this entry.
6. The remaining elements are specific to particular types of projections. You can see their
descriptions in Standard Parallels (Conic Projections) on page 386, Oblique Azimuth
(Hotine Oblique Mercator) on page 386, Scale Factor (Transverse Mercator) on page 387,
MapInfo Professional 10.5
388
User Guide
Chapter 14: Working with Coordinate Systems and Projections
Adding Projections to the MAPINFOW.PRJ File
False Easting and False Northing on page 387 and Range (Azimuthal Projections) on
page 387.
L
Each element in a projection entry is separated by a comma.
Let’s look at some specific coordinate systems to prepare you to create your own projection. It is
important to remember that the elements of a projection are different for each projection. Here are
some examples we have already seen:
L
There are additional examples in the Help System.
Adding Projections to the MAPINFOW.PRJ File
Once you understand the structure of the entries in the MAPINFOW.PRJ file, you are ready to
create a new projection entry for your coordinate system. You may want to make a copy of the
MAPINFOW.PRJ file in case you want to revert back to it later.
To create a new projection entry for the coordinate system in the MAPINFOW.PRJ file:
1. Open MAPINFOW.PRJ in a text editor or word processor. In this file, you are going to add the
new projection entries.
Figure: MAPINFOW.PRJ in Notepad
2. Scroll down in this list to find the type of projection you want to base your map on. See
Understanding Coordinate Systems on page 376 for descriptions of the different projection
types.
3. Add a new line at the end of the projection list you are modifying.
For example, to add a new Universal Transverse Mercator projection (Australian Map Grid using
AGD66 datum), scroll down to that entry and type the new projection at the end of the list.
MapInfo Professional 10.5
389
User Guide
Chapter 14: Working with Coordinate Systems and Projections
Adding Projections to the MAPINFOW.PRJ File
Figure: Adding a Line in the MAPINFOW.PRJ File
4. On a new line, type the new parameter entries based on the required parameters described for
that projection type in the table Projections and Their Parameters on page 452.
•
•
If the name of your projection does not appear in the Common Map Projections list, consider
the kind of projection you are creating (Latitude/Longitude, Conic, Transverse, etc.) and
follow the table entries for the type of projection you want.
Remember to include constant values (Accounting for Affine Transformations and
Explicit Bounds in Projection Types on page 383) to indicate an affine transformation,
specific bounds, or both if appropriate or necessary.
L
The order of parameters is vitally important. Remember to separate each parameter with
a comma.
5. Save your edited MAPINFOW.PRJ file in the directory in your user directory.
L
In the past the MAPINFOW.PRJ file was saved in your installation directory but this did not
allow different users to have different PRJ files. This new file placement permits this.
Things to keep in mind when editing the MAPINFOW.PRJ file:
•
•
•
•
•
•
You must record the X and Y coordinates of the origin point in decimal degrees.
Remember to include a negative sign for west longitudes and south latitudes.
You must list the origin longitude first in the MAPINFOW.PRJ file entry.
Carry out decimals to at least five (5) places for greater accuracy.
Do not use commas to represent thousands or millions in large numbers. Only use commas
to separate parameters from one another.
When specifying projection, datum and units, use the number that represents the parameter.
These numbers are listed in the table for each parameter earlier in this section. In our
example, 6 represents Equidistant Conic projection; 74 represents NAD 83 datum, and 7
represents meters.
MapInfo Professional 10.5
390
User Guide
Chapter 14: Working with Coordinate Systems and Projections
Adding Projections to the MAPINFOW.PRJ File
Using the New Projection in a Coordinate System
Once you have created this new projection, you can use it in a Map window to replace the
coordinate system you are using.
1. Open the map for which you want to change projections.
2. From the Map menu, select Options to display the Map Options dialog box.
3. Click the Projections button to display the Choose Projection dialog box.
L
To change the projection of a tab file and all of the map objects in it, use the File > Save
Copy As command and select the new projection.
4. Select the new projection from the list and click OK to confirm. The Map Options dialog
redisplays.
5. Click OK to implement the new projection in the Map window.
Entering a New Coordinate System (Example)
To illustrate this process in another way, create the following coordinate system using these
parameters by adding a new entry to the MAPINFOW.PRJ file:
Parameter Type
Entry
Description
Name
“Equidistant Conic Plus”
Name of the new coordinate system
Projection Type
6,
Equidistant Conic
Datum
74,
(NAD 83)
Units
7,
meters
Origin Longitude
-90.5,
90°30′W
Origin Latitude
30,
30°N,
Standard Parallel 1
10.33333,
10°20′N
Standard Parallel 2
50,
50°N
False Easting
10000000,
10,000,000 m
False Northing
500000
500,000 m
1. Open MAPINFOW.PRJ in a text editor or word processor.
2. Go to the Equidistant Conic section and add a new line.
3. Type the name of your new coordinate system in quotes, followed by a comma.
MapInfo Professional 10.5
391
User Guide
Chapter 14: Working with Coordinate Systems and Projections
Understanding Precision in MapInfo Professional
4. Enter the following information to represent your coordinate system:
6, 74, 7, -90.5, 30, 10.33333, 50, 10000000, 500000
5. Save your edited MAPINFOW.PRJ file.
You can use your custom coordinate system just as you would use any of the coordinate systems
that come with MapInfo Professional.
There are other ways you can edit this file. To shorten the list, remove coordinate systems from the
file. You can also change the names, change group headings and reorder the file to suit your needs.
L
Group headings are distinguished by the hyphen at the beginning of the name. Names of
coordinate systems cannot begin with a hyphen or a space.
Understanding Precision in MapInfo Professional
MapInfo Professional is a very good tool for working at a high precision level. But the onus is on the
user to discover the practical limits of the program in various circumstances and how to set the work
environment in order to obtain the desired precision level. Millimeter level precision can be easily
attained and maintained with projected maps in the metric system.
What is Precision?
The most basic component of any GIS is the spatial data that defines the map features. This spatial
data could not exist without the coordinate systems that are used to specify the location information.
Coordinate precision is a measure of storing spatial data as accurately as possible. Of course, this
can be no more precise than the original data provided. Precision is a measurement of how
accurately you can store and retrieve the spatial data and has nothing to do with the quality of the
data. The number of reliable digits in your coordinate is termed significant digits. Precision is
measured in terms of these significant digits.
•
For topics related to precision and map bounds, see Understanding Precision in MapInfo
Professional in the Help System.
Understanding Affine Transformations
An affine transformation allows you to match the points on two vector maps that use different
coordinate systems so they can be used together. The base map stays the same while the derived
map is transformed mathematically to match up coordinates to the base map.
MapInfo Professional provides the definitions for scale, translation, rotation, reflection, and shearing
necessary to support an optional affine transformation for any coordinate system definition. You can
also define a coordinate system with bounds and/or with an affine transformation. This is described
in detail in Accounting for Affine Transformations and Explicit Bounds in Projection Types on
page 383.
MapInfo Professional 10.5
392
User Guide
Chapter 14: Working with Coordinate Systems and Projections
Understanding Affine Transformations
Description of an Affine Transformation
There are several basic types of transformation that can be applied to the base map using an affine
transformation. These include scaling, translation, rotation, shearing, and reflection.
•
For more information, see Understanding Affine Transformations in the Help System.
The scale factor of a transformation indicates the distance between the fixed points of one map
versus the fixed points of the second map. If the only difference between two maps is the scale, the
affine transformation of the derived map is only the same map zoomed in or out around a fixed point.
The orientations of the lines connecting the points, and the angles between these lines, remain the
same. The scaling in the case of the figure below is around the 0,0 point.
A
B
0,0
0,0
The difference between these images is the scale. To create an affine transformation
that maps the base image (A) to the derived image (B), change only the scale.
The translation factor of a transformation is when every point on an image follows a parallel path and
no rotation takes place.
A
0,0
0,0
B
The difference between these two images is the translation.
The rotation factor of a transformation indicates that the image turns on a particular point. The next
figure shows a 25-degree rotation of the map around the 0,0 point.
MapInfo Professional 10.5
393
User Guide
Chapter 14: Working with Coordinate Systems and Projections
Understanding Affine Transformations
A
0,0
B
0,0
The difference between these two images is not the scale, because the size of each
image is the same. The difference is the rotation of the derived image (B).
The shearing factor of a transformation indicates that one of the coordinates of one image should
change proportionally to the other. You can apply a shear transformation either on the x-axis as
shown in the next figure or on the y-axis. As you can see the vertical scale of the image has not
changed, and the corner of the figure at 0,0 has not moved—but points higher up on the figure are
shifted progressively further to the right.
A
0,0
B
0,0
The difference is the shearing of the derived image (B).
The reflection factor of a transformation indicates that the derived image is the mirror image of the
base image, that is, all the points in the base image should be reflected across some straight line,
such as the x-axis or y-axis. In the figure below, the derived image (B) is the reflection of the base
image (A).
MapInfo Professional 10.5
394
User Guide
Chapter 14: Working with Coordinate Systems and Projections
Using Earth and Non-Earth Maps
A
0,0
B
The difference between these two images is that the derived image (B) is a reflection
of the base image (A) along the x-axis.
Using Earth and Non-Earth Maps
Earth maps and non-earth maps generally require different treatment. The following section on
projections apply only to earth maps. An earth map contains objects that have a particular location
on the earth’s surface. All maps that MapInfo Professional sells are earth maps. Coordinates
typically represent an object’s location in longitude and latitude, although other coordinate systems
(using various projections) may be used instead.
Sinusoidal (Equal-Area)
Use earth maps to:
•
•
•
Overlay your map onto any maps that MapInfo Professional supplies.
Use or change projections.
Specify objects on the map in terms of longitude and latitude.
MapInfo Professional 10.5
395
User Guide
Chapter 14: Working with Coordinate Systems and Projections
Using Earth and Non-Earth Maps
A non-earth map contains objects that have no specific location on the earth’s surface. Floor plans
are typical examples of non-earth maps. A non-earth map has a coordinate system, but since its
map points are not referenced to locations on earth, the coordinate system does not contain a
projection. Even though the floor plan describes a building that may be located somewhere on the
Earth, the coordinates of objects in the floor plan are generally not referenced to positions on the
Earth. Rather, the object’s coordinates are referenced to the floor plan itself, generally representing
distance from the lower left corner of the floor plan. The next figure depicts a floor plan and is an
example of a non-earth map.
Specifying Coordinates for a Non-Earth Map
Saving a Map to a Non-Earth Coordinate System
To save a table into a Non-Earth Coordinate system:
1. Ensure that your non-earth map is open and that it is the active window.
2. Choose File > Save Copy As.
3. In the Save Copy of Table As dialog box, click the Projection button.
4. In the Choose Projection dialog box, choose Non-Earth from the Category drop-down list.
5. Choose a unit from the Category Members drop-down list to specify the bounds and units for
your non-earth coordinate system.
6. Click OK. The Non-Earth Coordinate Bounds dialog box displays.
The Non-Earth Coordinate Bounds dialog box allows you to specify the bounds and units for your
non-earth coordinate system. You can use positive or negative numbers to specify the minimum and
maximum X and Y values.
Changing the Map’s Coordinate System to Non-Earth
To only change the Map’s Coordinate System:
1. Ensure that your map is open and that it is the active window.
2. From the Map menu, select Options.
3. In the Map Options dialog box, select the Projection button.
4. In the Choose Projection dialog box, choose Non-Earth from the Category drop-down list.
5. Choose a Non-Earth unit from the Category Members drop-down list.
6. Click OK.
MapInfo Professional 10.5
396
User Guide
Working with Web
Services
A web service is a software system that is accessible using an intranet or
Internet connection. MapInfo Professional supports the Web Map Service and
Web Feature Service, which allow you to retrieve data that others are sharing
internally or world-wide. The power of web services is that you can use them to
create more powerful maps or in the case of geocoding services get more
accurate and precise results using the same data.
Subsequently we added Geocoding and Driving Region web services. A
Geocoding web service allows you to geocode with greater accuracy because
the maps on a service are more precise. A Driving Region web service allows
you to create time- and distance-based buffers around a site for determining
proximity to a particular location. You might use this service to find the
customers closest to a store, or to determine which insured customers are
closest to a weather pattern.
A mapping tile server provide cartographic maps of geo-referenced data, in the
form of raster images (tiles). In MapInfo Professional, you can add map tiles as
a base layer to your map to provide a visual reference for your data. This gives
you a real-world reference for viewing your data, such as for viewing store
locations or maintenance routes.
Topics in this Section:
Introduction to Web Services . . . . . . . . . . . . . . . . . . . . . . . . . . . .398
Enhancing Map Data using a Web Map Service . . . . . . . . . . . . .399
Enhancing Map Data using a Web Feature Service . . . . . . . . . .403
Geocoding using a Geocoding Server . . . . . . . . . . . . . . . . . . . . .406
Creating Routing Distance and Time Buffers . . . . . . . . . . . . . . .410
Accessing Envinsa Online Services. . . . . . . . . . . . . . . . . . . . . . .413
Enhancing Map Data using a Mapping Tile Server . . . . . . . . . . .414
15
Chapter 15: Working with Web Services
Introduction to Web Services
Introduction to Web Services
MapInfo Professional web services can add detail and precision to the maps you are creating and
analyzing. Currently, you can use four web services from within MapInfo Professional:
•
•
•
•
•
Web Map Service
Web Feature Service
Geocoding Service
Routing or Driving Region Service
Mapping Tile Service
Accessing Web Services in MapInfo Professional
To make it easier to access web services, there is a Web Services toolbar. These toolbar buttons
display frequently used web services dialog boxes.
To display the toolbar:
1. From the Options menu, select Toolbars.
2. Check the Web Services check box and click Close.
Figure: Web Services Toolbar
1
2
3
4
5
6
7
8
1 Open WMS Table button 2 Open WFS Table button 3 Find Address button
4 Geocode Using Server button 5 Create Driving Regions button
6 Web Services Preferences button 7 Search CSW Catalogs button 8 Search PBBI
Data Catalog button
For more information about these buttons, see the Accessing Web Services in
MapInfo Professional topic in the Help System.
Web Service Authentication
A web service, such as a WFS, WMS, geocoding server, routing server, or tile server, may require
authentication in the form of a user name and password.
Server-Side Authentication
You can access WFS, WMS, and tile servers that require basic authentication using the built-in
standard mechanism for internet servers. To connect to a web service that requires authentication,
complete the Connect dialog box that displays.
Enter the appropriate user name and password and select the Remember my password check box
to have the site “remember” your password for you. Click OK to enter the site. If you do not have a
valid user name and password, you cannot connect to the site.
MapInfo Professional 10.5
398
User Guide
Chapter 15: Working with Web Services
Enhancing Map Data using a Web Map Service
Accessing Secure Web Sites
SSL is an international standard security protocol for exchanging sensitive information between a
web site and your computer. You know SSL-enabled sites by the https: address. When you connect
to an SSL-enabled server, your computer and the server exchange digital certificates, which
minimize the threat of theft of sensitive data. If you try to connect to a server and you have a valid
SSL certificate, you should be able to connect to the web site.
Proxy Server Authentication
Your local LAN may use a proxy server to connect to the internet. Web client applications such as
internet browsers provide a mechanism for specifying a proxy server, and MapInfo Professional
does as well. By default, MapInfo Professional uses your system settings—the same settings used
by Internet Explorer—for a proxy server. Those settings can be accessed via the Connections tab
under Internet Options in the control panel, or via the same dialog invoked in Internet Explorer via
the Tools > Internet Options menu option. Ask you system administrator for the correct settings.
You can override these settings in MapInfo Professional via their Web Services preferences. Select
Options > Preferences to display the Preferences dialog box and then click Web Services. The
first tab in the Web Services Preferences dialog box displays Proxy Server settings.
There are several options for a proxy server.
•
•
•
Use System Settings is the default option which uses the system settings for a proxy server,
i.e., the same settings as Internet Explorer.
Use Direct Connection bypasses any system proxy server settings and connects directly to the
Internet. This option will only work if your LAN allows direct connections.
Use Proxy Server also bypasses the system settings and allows you to specify a proxy server to
use for MapInfo Professional. Ask your system administrator for the settings to use.
If you do use a proxy server to connect to the Internet, the proxy server may also require
authentication in the form of a user name and password. Your system administrator should tell you
what these are. If a user name and password are required, you will be prompted for them via a
dialog when MapInfo Professional attempts to connect to the Internet, such as when drawing a tile
server layer.
Enter the appropriate user name and password. You may also choose the Remember my
password check box so the system will remember these values between sessions of MapInfo
Professional. Within a session you should only need to specify the username and password once.
See also:
Setting the Web Services Preferences
Enhancing Map Data using a Web Map Service
Web Services can provide more data for you to work with in MapInfo Professional. A Web Map
Service (WMS) allows you to access maps and data through your local intranet or the Internet. This
innovation is based on a specification from the Open GIS Consortium (OGC) that allows you to use
MapInfo Professional 10.5
399
User Guide
Chapter 15: Working with Web Services
Enhancing Map Data using a Web Map Service
raster map images from servers that also comply with the specification. You must specify the
coordinate system within your data request to ensure that the images you retrieve “sync up” or
register with your other map data.
How Does MapInfo Professional Use WMS Servers?
When you create a .tab file from WMS layer(s), you are actually creating a pointer to an XML file that
keeps track of the data you selected, (the server address, the selected layer(s), the styles, the
format, and the projection settings). You never actually retrieve the data and save it on your
computer. Every time you add a WMS table as a layer to your map or you change the view of the
map, the system generates a map request and retrieves the layer information. To do this, the .tab file
points to an XML file which retrieves the information from the WMS Server and displays it on your
computer. If you are not connected to the Internet, the server is unavailable, or the WMS layer(s)
you are retrieving are not available, you cannot use the WMS .tab file.
L
The WMS sites that we include in this documentation or in the standard installation of
MapInfo Professional have been verified as part of the testing process. We cannot guarantee
that these sites will remain active, only that they were active as of this writing.
WMS Maps Display in Current Map Window’s Coordinate System by Default
Many times, when you are retrieving a WMS map, you are adding it to enhance the detail of a Map
window that you are already working on. We have changed the default behavior of the Projection
drop-down box. Now, this list defaults to the projection that matches the front-most map window, if
that projection is available in the list.
But What if a WMS Definition Already Exists or I am not Working in a Map Window?
•
•
•
•
If you are retrieving a WMS map and there was a previous WMS definition (or you are
modifying a WMS map), MapInfo Professional uses the coordinate system that matches the
current projection (not necessarily the Map window’s coordinate system).
If there was no previous WMS definition, the current Map window’s coordinate system is
selected if it can be found in the Projection list.
If the Map window’s coordinate system is not in the Projection list or you are retrieving a
WMS map when you are not working in a Map window, MapInfo Professional tries to default
to EPSG:4326.
Finally, if none of these projections are found, the first item in the Projection list is selected.
MapInfo Professional 10.5
400
User Guide
Chapter 15: Working with Web Services
Enhancing Map Data using a Web Map Service
Supported Image Formats for WMS
MapInfo Professional supports the following image formats for WMS:
•
•
•
•
L
PNG
JPEG (JPG)
TIFF (GeoTIFF AND TIFF)
GIF.
Not every format will be available from every Web Map Service.
The OGC WMS specification supports transparent pixel definition for image formats. This allows you
to use the images you retrieve as overlays and not solely as the bottom layer of your map.
To set the background to transparent, click the Transparent check box in the Open WMS Table or
the WMS Table Properties dialog boxes. You can also control the transparency and translucency of
the image via Layer Control (by double-clicking the layer and checking the Style Override check
box on the Layer Display tab in the Layer Properties dialog box).
The Help System contains these related topics:
•
•
•
•
•
•
•
•
•
Adding a WMS Server
Editing the WMS Servers List
Retrieving Map Data from Web Map Services
Setting the Projection for WMS Layers
Projection Issues with WMS Map Data
Editing WMS Layer Settings
Opening WMS .TAB Files
Info Tool SUpport for WMS Layers
Controlling WMS Image Quality When Printing
Understanding WMS Error Messages
Data returned to the WMS client depends on the availability and status of the WMS server and on
the characteristics and status of the maps on the WFS server. These conditions are beyond the
control of Pitney Bowes Software Inc..
The following table lists and explains WMS-related error messages. Some messages consist of two
parts, separated by a colon. The information up to the colon is generated by the MapInfo WMS
client. The raw data following the colon comes directly from the WMS server. For clarification on
those messages, please contact the service provider of the WFS server.
MapInfo Professional 10.5
401
User Guide
Chapter 15: Working with Web Services
Enhancing Map Data using a Web Map Service
WMS-Related Error Messages
Error Message
Description and Explanation of Message
XML Parsing Error: <message from XML
parser>
The most likely cause is badly formed XML from the server.
The raw data following the colon is transmitted by the
MSXML 4.0 parser.
The WMS Server issued the following
exception: <message from server>
The raw data following the colon is transmitted by the WMS
server. This may help you analyze the problem.
The WMS server generated an error. For clarification, contact
the service provider of the WFS server.
The following error was issued while
attempting to access the WMS server:
<message from server>
There could be a problem with the URL, the server may not
be available, or it may have timed out.
The WMS Server returned no data in
response to the request.
MapInfo Professional issued a service request, but nothing
was received from the server.
Unable to retrieve capabilities from the
WMS Server.
The GetCapabilities request from the server failed. This
message usually appears paired with another message in the
same message window.
The WMS Server returned HTML data
rather than the requested format. The
specified address may not be a WMS
Server or the server could not process the
request: <message from server>
The raw data following the colon is transmitted by the WMS
server. This may help you analyze the problem.
The server you are accessing may not be a WMS server. You
may see this message after accessing a WFS server and
seeing a list of WFS layers. This can occur because the
Capabilities document provided by the server may contain
additional URLs that redirect you to another server (not the
one you explicitly selected). That “redirected” server may be
down or have another problem.
The WMS Server returned data which was
neither in the requested format nor a
recognized WMS service exception:
<message from server>
The raw data following the colon is transmitted by the WMS
server. This may help you analyze the problem.
Error accessing temporary file.
It is possible that your disk is full or you might have deleted
the temp file while Mapinfo Pro was running.
The WMS Server does not return
GetFeatureInfo data in a format supported
by MapInfo Professional.
The server may not support GetFeatureInfo.
MapInfo Professional 10.5
The exception message from the server could not be
understood. For example, the exception message may not
have been in XML format.
402
User Guide
Chapter 15: Working with Web Services
Enhancing Map Data using a Web Feature Service
WMS-Related Error Messages(continued)
Error Message
Description and Explanation of Message
The WMS Server does not support
GetFeatureInfo requests.
The server may not provide GetFeatureInfo in a format
understood by MapInfo Professional.
There are no queryable layers in the WMS
table for GetFeatureInfo request.
The server may not have a queryable layer. It is possible that
a queryable layer changed between the time that you first
created the WMS table and subsequently reopened the table.
The WMS Server returned data in
<formatA> rather than the requested format
of <formatB>.
MapInfo Professional requested data in the format that the
server claims it supports, however the server is returning a
different format. For clarification, contact the service provider
of the WMS server.
Unable to retrieve feature information from
the WMS server.
The GetFeatureInfo request from the server failed. This
message usually appears paired with another message in the
same message window.
Enhancing Map Data using a Web Feature Service
MapInfo Professional provides a Web Feature Service (WFS) client to retrieve geospatial GML
(Geography Markup Language)2 data using HTTP GET and HTTP POST requests over the Internet
or through a private intranet. The WFS client was developed in accordance with the 1.0.0 OpenGIS®
Web Feature Service Implementation Specification, which is available online:
http://www.opengis.org/docs/02-058.pdf
WFS is similar to WMS (Web Map Service), in that both can provide geographic data via the
Internet. But while a WMS server provides raster maps, a WFS server provides raw coordinate data
that the client uses to produce a map.
L
The MapInfo WFS client has been developed in accordance with OGC WFS Specification
1.0.0. Using this client you cannot retrieve data from sites that are compliant with earlier or
later versions of the OGC specification.
The WFS client supports GML2 (OGC GML V2.1.1). The OGS WFS Specification states that all
servers should support GML2, but may also support other formats. The server provides information
on the formats available, and the client makes the request for the data in the format it can use. If the
server does not support GML2, it will not be supported by the MapInfo WFS client.
GML2 does not contain any style information. You can provide style information to associate with a
particular WFS table.
A WFS request contains a description of query operations that can be applied to one or more
features. The client generates the request and posts it to a WFS using HTTP. The web feature
server then reads and executes the request.
MapInfo Professional 10.5
403
User Guide
Chapter 15: Working with Web Services
Enhancing Map Data using a Web Feature Service
The GetCapabilities operation queries the WFS server for capabilities. Then the MapInfo
Professional WFS client can generate a query appropriate for the WFS server and table.
Each table in the WFS server can result in a single MapInfo table. The mapping is always 1-to-1
(unlike WMS, which is many-to-1).
The TAB file retrieved from a WFS server resembles a read-only DBMS linked table. It contains a
MAP file and a DAT file, and acts like a read-only native table. Information is stored so that the table
can be refreshed from the WFS server.
The sequence of actions can be summarized as follows:
1. After sending a GetCapabilities request to a WFS server, the server returns a list of WFS layers
(FeatureTypes) that it can provide.
2. The user picks a WFS layer to fetch from the server, MapInfo Professional then sends a
DescribeFeatureType request to the server. This response is an XML schema that describes
the feature.
3. The user can then select which columns and/or rows to fetch.
4. MapInfo Professional sends a GetFeature request to the WFS. If the user did not select a subset
of columns, all columns will be requested by default.
5. The response is a GML document containing the feature collection. Each feature represents one
“record” in the MapInfo table.
There is a list of WFS servers in the client to help you get started in using this functionality.
L
Since the data you retrieve using the WFS is remote, it may change from time to time. You
can refetch your WFS data manually using the refresh process. See Refreshing your WFS
Data in the Help System for more information.
WFS Server Requirements
You must have a working Internet connection whenever you retrieve WFS data. To display GML2
data correctly in the MapInfo Professional Web Feature Service, the server you are requesting
information from must:
•
•
•
•
Support V1.0.0 of WFS. The MapInfo Professional WFS client sends the initial GetCapabilities
and specifies version 1.0.0. If the server you are requesting information from does not support
the 1.0.0 version, MapInfo Professional cannot use that server and no further operations will be
allowed.
Respond to GetCapabilities request using Http GET in XML.
Respond to the GetFeature request by returning GML2 (OGC GML V2.1.1). The server’s
GetCapabilities response should include this information. If the server does not claim to use
GML2 as the Result Format for GetFeature, then MapInfo Professional cannot use the server
and no further operations will be allowed.
Conform to the OGC GetCapabilities schema. If the server GetCapabilities response does not
conform to the schema, MapInfo Professional may not be able to read portions of it. This may
mean that MapInfo Professional misses items that the server is trying to communicate, such as
MapInfo Professional 10.5
404
User Guide
Chapter 15: Working with Web Services
Enhancing Map Data using a Web Feature Service
•
•
feature types (tables), or filters. In some cases, MapInfo Professional won't be able to deal with
the server, since necessary information cannot be found. In other cases, MapInfo Professional
may miss functionality that the server is trying to provide, such as filters.
Support HTTP GET and/or HTTP Post for the DescribeFeatureType and GetFeature
requests. The MapInfo Professional client supports both HTTP GET and HTTP POST. The
server should advertise what it accepts for each request in its GetCapabilities response. MapInfo
Professional prefers HTTP POST for both operations, so if the server advertises that it supports
both HTTP POST and HTTP GET methods for these operations, MapInfo Professional uses
HTTP POST.
Supply the URL for both the DescribeFeatureType and GetFeature in their GetCapabilities
response. The URL provided must be valid for that request. If the server provides an invalid
URL, MapInfo Professional’s WFS client cannot work and displays a suitable error message.
The DescribeFeatureType response should be:
•
•
An XML Schema that contains the information for the table specified only. If the server
returns a schema that contains descriptions for multiple tables, MapInfo Professional cannot
parse it correctly, and the operation will fail.
A Valid XML Schema. If not, no further operations can be allowed for that feature type. Without
a valid schema, MapInfo Professional cannot create or populate the table. In this case you can
either select another table, select another server, or cancel the WFS dialog box.
L
MapInfo Professional may not handle schemas that are “well formed” but contain
invalid XML.
MapInfo Professional checks that the schema returned for DescribeFeatureType is well formed
XML, but does not validate the XML. Our WFS client works correctly with many servers that return
schema's which contain invalid items, and our developers thought that eliminating these servers
because they didn't contain 100% valid XML was too limiting.
L
MapInfo Professional cannot successfully handle schemas that contain invalid items, such as
an invalid character in an element name - for example, "City Type" where the space in the
element name isn't valid XML.
While MapInfo Professional may be able to process a schema that contains well-formed but invalid
XML, this may cause problems elsewhere, such as during the GetFeature processing. This may
cause some confusion. If the XML returned during GetFeature doesn't match the schema, MapInfo
Professional may create an empty table without displaying an error.
MapInfo Professional:
•
•
Doesn't process xsd:include. All element types must be defined in the schema returned from
the DescribeFeatureType request or derived from GML base types.
Supports all row filters that the server advertises in the GetCapabilities response with the
following constraints:
• The filters are OGC-defined filters as specified in the OGC WFS Specification or the OGC
Filter Encoding Implementation specification.
• The filter takes 0 or 1 arguments beyond the column name. This is a user interface
constraint. MapInfo Professional’s interface is currently not set up to address such filters.
This includes the A Between filter, which requires 2 values.
MapInfo Professional 10.5
405
User Guide
Chapter 15: Working with Web Services
Geocoding using a Geocoding Server
•
•
Supports MaxFeatures, but not all WFS servers seem to support this option. While the
OGC WFS Specification states that the server should implement this option, our experience has
been that some servers ignore MaxFeatures.
Treats the Geometry column as mandatory. While you can filter specific columns, MapInfo
Professional always requests the Geometry column from the server. Many servers seem to treat
the Geometry column as mandatory and return this column whether it is requested or not.
L
The GML returned during the GetFeature request should validate against the schema
returned during the DescribeFeatureType request. If this is not the case, then MapInfo
Professional may not be able to create a table.
If a MapInfo WFS table is open, the user interface automatically enables the refresh process. During
the refresh process, users can not change the query that is sent to the WFS server. The data will be
refetched from the server using the original query. This refreshed information can then be saved to
the table.
The Help System contains these related topics:
•
•
•
•
•
•
•
•
•
•
•
•
Adding a WFS Server
Adding WFS Client Support
Opening a Web Feature Service Layer
Selecting and Filtering a WFS Layer
Controlling WFS Maximum Features
Changing a WFS Coordinate System
Changing WFS Layer Styles
Handling Retrieved WFS Data
Refreshing your WFS Data
Adding Column Indices to WFS Tables
Overriding WFS Default Timeout Values Locally
Saving WFS Data Changes to the Server
Geocoding using a Geocoding Server
Not everyone in a flood zone loses their homes in a disaster. Accuracy in address matching
(geocoding) can mean the difference between an insured being in a flood plain or on dry land.
Knowing that information quickly and precisely can mean the difference in thousands of dollars of
risk or no risk at all.
For retail customers, an advanced geocoder could be the difference between finding your product in
a local store or wasting a trip.
For financial services customers, it could mean locating your best customers quickly when you have
an opportunity to share with them.
You can use MapInfo Professional to connect to MapMarker and Envinsa servers to handle
advanced geocoding functions.
MapInfo Professional 10.5
406
User Guide
Chapter 15: Working with Web Services
Geocoding using a Geocoding Server
Geocoding is the process of assigning geographic coordinates to your data, which can be street
addresses. Point values assigned to each address turn each record into a geographic object that
MapInfo Professional can display on a map. Visualizing your records on a map can make the
relationships among your data clearer. You can display your geocoded records against a street
map, a postal code centroid map, a county map, or whatever is most appropriate to your needs. You
can then use the wide variety of functions available in MapInfo Professional mapping software to
perform querying, create thematic maps, create territories, and perform many other types of
geographic analysis.
Using the MapMarker and Envinsa Web Services, you have more choices for geocoding. For
example, you can choose to geocode your records by street address or by postal code centroid, or
by geographic centroids. If you have geocoded some records and some did not geocode
successfully, you can set fallback conditions to locate those records. If you geocode and there are
no results, poor results, or multiple equal close results, the geocoding server can present you with
interactive options so you can select among possible matches or change your input. Further, these
web services allow you to set multiple matching conditions when more than one record matches the
records you are geocoding and set offsets for placing points right in the geocode properties.
For companies and organizations that use MapMarker and Envinsa servers as a geocoding engine,
you can take advantage of the geocoding servers available to your whole enterprise. If your
organization makes this server available on your intranet or over the Internet, you can use our
geocoding web services from within MapInfo Professional to perform more sophisticated and
accurate data geocoding.
L
IMPORTANT: Pitney Bowes Software Inc. may not have a Geocoding Server with data that
includes the geography you are interested in. Please check with your local Pitney Bowes
Software Inc. sales personnel to ensure that web services exist for your geography.
What Are MapMarker and Envinsa Geocoding Services?
MapMarker is a powerful geocoding product that assigns coordinates to an address based on how
well it matches entries in an Address Dictionary. The precision of the match can vary. For each
address you geocode, you may get back a single perfect, street-level match, a list of street-level
match candidates from which you choose the best match, or a less precise postal code centroid
match, where the point would be located near the center of the postal code area. In the case of a ZIP
+ 4 centroid match, the location of the point corresponds to the address which is closest to the midaddress of the ZIP + 4 address range. You must have MapMarker 4.0 core to use this web service.
Envinsa provides a wider range of web services than MapMarker and can even provide access to
earlier versions of MapMarker. Envinsa can determine these values from a street address or postal
code. Envinsa servers require more security than MapMarker, so you will need a user name and
password to access them. Keep in mind that the services that are available on an Envinsa server
depends on what was installed.
There are many reasons why using a geocoding service with MapInfo Professional is a good
business solution.
MapInfo Professional 10.5
407
User Guide
Chapter 15: Working with Web Services
Geocoding using a Geocoding Server
•
•
•
•
•
Multiple Data Formats OK! Since MapInfo Professional can import or open data in many different
formats, you can geocode almost any kind of geographically enabled file. You can take
advantage of MapMarker or Envinsa’s advanced geocoding options using Shapefiles, Excel
files, ASCII, Access tables, Oracle and SQL Server tables.
Data filtering. You can use the selection and subselection capabilities of MapInfo Professional to
create input for the service using any MapInfo Professional "table," including queries created
using SQL Select or tools. For example, if you want to geocode your data based on more than
one column, you can specify an input address based on a MapBasic expression that could skip
irrelevant characters.
Geocode a Little or a Lot. You can geocode individual records or in batch mode.
Choose your own Symbols. You have the full range of MapInfo Professional symbols to choose
from when plotting your points, or you can create your own custom symbols for the points you
are geocoding.
Undo works! Because all of the geocoded results are transacted, you can use MapInfo
Professional’s revert capabilities to undo the transactions. You can save the geocoded results in
the source table or into a completely new table.
L
IMPORTANT: Pitney Bowes Software Inc. may not have online services with data that
includes the geography you are interested in. Please check with your local Pitney Bowes
Software Inc. sales personnel to ensure that web services exist for your geography.
Geocoding a Single Address using a Geocoding Service
The process for geocoding a single address for an Envinsa or MapMarker service. Keep in mind that
you must set up a geocoding service before you can use this type of geocoding. See Setting up a
Geocoding Server on page 209 and Setting the Geocoding Server Preferences on page 203
for these instructions.
•
For specific instructions, see Geocoding a Single Address using a Geocoding Service in the
Help System.
Understanding the Geocoding Result Codes
The geocoding service returns a result code for each address it attempts to match. The code
indicates whether a match was made, the type of match it was, and conveys information about the
quality of the match. The result code is an alphanumeric code of 1-10 characters. There are four
categories:
•
•
•
•
Single close match to street level (S category)
Postal Code centroid match (Z category)
Multiple matches during automatic geocoding (M category)
Non-matches (N category)
Matches in the M category indicate that there is more than one match candidate for the record and
the geocoding service has chosen the best one of those candidates. This category displays when
you select the automatic option and the geocoding service finds more than one strong match
candidate.
MapInfo Professional 10.5
408
User Guide
Chapter 15: Working with Web Services
Geocoding using a Geocoding Server
For S and Z categories, the first two characters represent the positional accuracy of the match, that
is, where the point for the record would spot on a street map. For the S category matches there are
eight additional characters that indicate the individual components in the input address that
matched. If the geocoding service did not match on a particular address component, the code would
contain a dash for that element. For example, a single close match to a street address that matched
to all address components except house number would look like: S5-PNTSCZA.
S Category: Single Close Match to Street Level
S6
matched to a point located at a Postal Code centroid
S5
matched to a street address
S4
matched to an interpolated point on the street segment
S3
matched to a Secondary Postal Code centroid (centerpoint of the Secondary Postal
Code boundary)
S2
matched to a Primary Postal Code centroid (centerpoint of the Primary Postal Code
boundary)
S1
matched to a Postal Code centroid (centerpoint of the Postal Code boundary)
SX
matched to a street intersection
S0
single close match, no coordinates available
H
matched to house number
P
matched to street prefix
N
matched to street name
T
matched to street type
S
matched to street suffix
C
matched to city name
Z
matched to ZIP Code
A or U
match came from MapMarker Address Dictionary (A) or customized user
dictionary (U)
Z Category: Postal Code Match
Z6
Postal Code centroid match
Z3
Secondary Postal Code centroid match
Z2
Primary Postal Code centroid match
MapInfo Professional 10.5
409
User Guide
Chapter 15: Working with Web Services
Creating Routing Distance and Time Buffers
Z1
Postal Code centroid match
Z0
Postal Code match, no coordinates available
M Category: Multiple Automatic Matches
M1
multiple matches, point located at Postal Code centroid
M2
multiple matches, point located at Primary Postal Code centroid
M3
multiple matches, point located at Secondary Postal Code centroid
M4
multiple matches, point located at the center of a shape point path (shape points define
the shape of the street polyline)
M5
multiple matches, point located at a street address position (highest accuracy available)
M6
multiple matches, point located at point Postal Code location
MX
multiple matches, point located at street intersection
M0
multiple matches, no coordinates available
N Category: Non-matches
N
•
No close match
For specific instructions and related topics, see Geocoding a Table using a Geocoding Service in
the Help System.
Creating Routing Distance and Time Buffers
To find out how many customers are within ten minutes drive of your stores to find all of the suppliers
within 15 to 30 miles of your warehouse location, use a Driving Regions web service.
The Drivetime web service uses the latest road networks and fast search algorithms to show the
buffer boundaries in time (isochrone) or distance (isodistance) from a specified location. These
buffers are different from other MapInfo Professional object or table buffers because they are based
on road networks and not straight line distances. Driving region time and distance buffers are
calculated based on the speed limits of the individual roads and highways in the road network and
the distance or time values you request. Isochrones and isodistances are collectively called
isograms.
You can only access this Drivetime data and calculation functionality on an Envinsa 4.0 routing
server. The Driving Regions web service helps you create isochrone and isodistance buffers using
points in your own data.
An isochrone or a time buffer is a region that shows the area that a driver can reach from a starting
point in a specific amount of time based on the speeds specified in the routing network. For
example, if you wanted to put together an event and invite the customers who live within an hour’s
MapInfo Professional 10.5
410
User Guide
Chapter 15: Working with Web Services
Creating Routing Distance and Time Buffers
drive of the event site, you could create a time buffer for known customers within an hour’s drive.
The service would then use the average driving speeds defined in the road network to calculate the
time buffer from your event. You can then display your data within those buffer regions using a
Select or SQL Select statement.
An isodistance or a distance buffer is a region that shows the area that a driver can reach from the
starting point in the same distance. For example, if you want to contact all of the customers who live
within 50 miles of the event instead of one hour, you could calculate the distance using the Drivetime
web service, using similar logic.
Effectively, you are creating buffers from a point or table of points based on the server’s road
network for specified times or distances. Using the Driving Region service options, you can control
the way this information displays and the number of time and distance buffers you create at a time.
•
For more information, see Creating Time or Distance Buffers for a Table and Rules when Adding
a Driving Value in the Help System.
How are Time and Distance Buffers Calculated?
This is a raster map of a portion of a major city, but it could just as easily be your community.
You can travel further on a limited access highway than a local road in the same
amount of time due to the difference in speed limits.
In it, you can see limited access highways, major roads with buildings on them, and local streets with
homes. The speed limits on these streets vary depending upon their size and use. The routing
server manages the speeds for each road type and uses those speeds to calculate the distance a
driver could travel in a specific amount of time. For example a driver could get further in an hour on a
highway, than on a local road, due to the average speed limits on those roads.
MapInfo Professional 10.5
411
User Guide
Chapter 15: Working with Web Services
Creating Routing Distance and Time Buffers
If you think of these speed limits and distances in spatial terms, starting from a particular point, the
region the web service could create along a highway would be longer and narrower than the region
you would create using a more local road based on the same amount of time or distance request.
That is the concept behind the Driving Region functionality.
Using Driving Region Buffers to Display Data
You can create a driving region buffer (time or distance) to find out how far away your customers are
from a particular event or location. We recommend that you add a server as described in the Setting
the Routing Server Preferences instructions before attempting to create time or distance buffers.
Here are some definitions that may be useful for you as you use this feature.
Holes
Areas within the larger boundary that cannot be reached within the specified time or
distance, based on the road network.
Island
Small areas outside the main boundary that can be reached within the specified time or
distance.
Offroad Travel
Offroad travel refers to streets that are not part of the server’s road network, such as
driveways, private roads, or access roads.
Creating Time or Distance Buffers for Objects
You can use a routing server’s driving regions network to create time or distance buffers around
map objects to see your data in a new way. Keep in mind that these buffers are not like standard
straight line circle buffers, but are rather based on the speed that a driver can travel on a particular
road network. If you want to create time and distance buffers for an entire table of objects, see
Creating Time or Distance Buffers in the Help System.
Before you begin this process, we recommend that you set up your own default routing server using
the instructions in Setting the Routing Server Preferences on page 205. If you do not have
access to your own routing server, you can access and subscribe to Envinsa Online Services from
Pitney Bowes Software Inc. to take advantage of this functionality. To activate your free Envinsa
Online Services trial account, see Accessing Envinsa Online Services on page 413.
L
•
IMPORTANT: Pitney Bowes Software Inc. may not have online services with data that
includes the geography you are interested in. Please check with your local Pitney Bowes
Software Inc. sales personnel to ensure that web services exist for your geography.
For specific instructions and related topics, see creating Time or Distance Buffers for Objects in
the Help System.
MapInfo Professional 10.5
412
User Guide
Chapter 15: Working with Web Services
Accessing Envinsa Online Services
Accessing Envinsa Online Services
If you want to try out these Geocoding or Driving Region features, but don’t have access to a
MapMarker or an Envinsa server, Pitney Bowes Software Inc. is providing both trial and subscription
access to our public Envinsa server, called Envinsa Online Services or EOLS.
There are two ways to access these web services from within MapInfo Professional. First, when you
enter the geocoding or driving regions dialog boxes for the first time, the Configure Service dialog
box displays.
To sign up for this service click Activate and follow the instructions to receive a user ID and
password, which you can enter into this dialog box. Decide whether you want the system to
remember your password1 and whether you want to use a secure server2. Then click Add Account
to begin using the EOLS server.
You can also access the EOLS through the Help menu. Select Help > Connect to Envinsa Online
Services to get started. A landing page will provide you with further instructions, including user
name and password information. When you complete your trial period, the Envinsa Online Services
will stop accessing the server and you will have the option of subscribing for further use of this
service.
L
IMPORTANT: Pitney Bowes Software Inc. may not have online services with data that
includes the geography you are interested in. Please check with your local Pitney Bowes
Software Inc. sales personnel to ensure that web services exist for your geography.
1.
The password will be saved in the MapInfo services configuration file (MIROUTINGSERVERS.XML). These
passwords are encrypted.
2.
When you choose the secure connection option, you add the step of encrypting all of the communication to
and from the server. Consider whether you prefer this option to the standard HTTP connection.
MapInfo Professional 10.5
413
User Guide
Chapter 15: Working with Web Services
Enhancing Map Data using a Mapping Tile Server
Enhancing Map Data using a Mapping Tile Server
A tile server is a server that contains a collection of raster tile images. The tiles cover a given place
on the earth. Tiles are organized in a row/column grid fashion. There are also multiple levels of tiles.
Each level represents a different resolution of data, covering the same place on the earth. The level
determines the number of tiles (number of rows and columns). As you zoom in or out, the level of
data may change. As you pan around, the specific tiles that are needed may change.
MapInfo Professional lets you use tile server data within the product. If you add a tile server layer to
a MapInfo Professional map, then the application takes care of fetching the appropriate tiles from the
server and displaying them. You only need to add the tile server layer and then pan/zoom.
For more about using raster images as a backdrop for maps, see Using Raster Images as a
Backdrop for MapInfo Professional Maps on page 326.
About Tile Server Tables and Map Layers
MapInfo Professional has a table for tile servers that consists of a TAB file and XML file. These files
contain the information necessary to communicate with a tile server and retrieve tiles correctly. This
information includes server URL, coordinate system and bounds, and other parameters for retrieving
the proper tiles.
After opening a tile server table in MapInfo Professional, you can add it as a layer to a map. Tile
server layers act as an underlying base map, so they are added to the bottom of the layer list by
default. Tile server layers do not have attribute data, so they cannot be edited and labeled. They are
meant to be used as backdrop images.
Tile Server Display Properties
Display properties can alter the appearance of the tiles returned from a tile server. Tile server
images are rendered using the same display attributes as raster images. This includes:
•
•
•
•
•
Translucency
Transparency – on/off and transparent color
Brightness
Contrast
Grayscale versus color
Tile Server Coordinate System and Reprojection
Tile server layers do not support raster image reprojection. This means that a map's coordinate
system will be set to use the tile server coordinate system if a tile server layer is visible in a map. If
the map displays tiles from two different tile servers in different projection systems, then MapInfo
Professional uses the projection system of the tile that is most visible on the map.
You cannot change the map coordinate system when a map has an active tile server layer.
MapInfo Professional 10.5
414
User Guide
Chapter 15: Working with Web Services
Enhancing Map Data using a Mapping Tile Server
Tile Server Authentication
Since the tile server functionality uses internet connectivity to obtain the images to draw, it is
possible that the connection may require layers of authentication. If authentication is required,
MapInfo Professional prompts you when the tile server table is opened. If the authentication fails, the
table does not open.
Setting up a Mapping Tile Server Table
MapInfo Professional provides access to the Microsoft Bing tile server, so there is no setup required
to access it (see Adding a Microsoft Bing Layer to a Map on page 417). For all other tile servers,
you must specify the exact information to use through a MapBasic command called Create Table.
To setup a tile server table:
1. Choose Options > Show MapBasic Window. The MapBasic window displays.
2. Use one of the following examples as a template to create a tile server table. Copy and paste the
command in to the MapBasic window and then update the command with your information
(change the text in bold in these examples). Run the command by pressing the Enter key.
MapInfo Developer tile server
Create Table MIDev_TileServer
File "MIDev_TileServer"
Type TILESERVER
TileType "LevelRowColumn"
URL
"http://INSERT_SERVER_NAME_HERE/MapTilingService/MapName/{LEVEL}/{ROW}
:{COL}/tile.gif"
AttributionText "required attribution text"
Font("Verdena",255,16,0,255)
StartTileNum 1
MaxLevel 20
Height 256
CoordSys Earth Projection 10, 157, 7, 0 Bounds(-20037508.34,20037508.34) (20037508.34,20037508.34)
MapXtreme.NET tile server:
Create Table MXT_TileServer
File "MXT_TileServer"
Type TILESERVER
TileType "LevelRowColumn"
URL
"http://INSERT_SERVER_NAME_HERE/TileServer/MapName/{LEVEL}/{ROW};{COL}
/tile.png"
AttributionText "required attribution text"Font("Calibri",255,16,0,255)
MaxLevel 20
Height 256
RequestTimeout 90
ReadTimeout 60
CoordSys Earth Projection 10, 157, 7, 0 Bounds(-20037508.34,20037508.34) (20037508.34,20037508.34)
MapInfo Professional 10.5
415
User Guide
Chapter 15: Working with Web Services
Enhancing Map Data using a Mapping Tile Server
Items in bold in these examples are necessary information that you supply for accessing a specific
tile server:
•
•
•
•
Table is the name of the table as you want it to appear in MapInfo Professional.
Type is the name of the tile server this table will use (currently supports "LevelRowColumn").
This value represents the way the Tile Server retrieves the tiles.
URL is the fully qualified URL to request a tile from a tile server. The URL will contain tags that
are special strings that will be used to retrieve particular tiles. The placement depends on server
URL syntax requirements.
• {LEVEL} will be used internally to specify the level number (Z-value)
• {ROW} will be internally to specify the tile row number (Y-value)
• {COL} will be internally to specify the tile column number (X-value)
AttributionText is the attribution text that will be displayed on the map window. A font_clause
can be used to set the font style when the attribution text will be displayed. The attribution text
should be the attribution legally required by the provider of the server.
Syntax details for the Create Table command are provided in the MapBasic Reference and in the
MapInfo Professional Help System.
MapInfo Professional cannot reproject a tile server, so it will reproject the map to match the
coordinate system of the tile server data. You are unable to change the coordinate system for the
map when it includes a tile server layer.
Adding a Tile Server Layer to your Map
To add a tile server layer to your map (using the same way you add any other TAB file as a layer in
a map):
1. Open the tile server table by selecting File > Open. The Open dialog box displays.
2. From the Files of type drop-down list, choose MapInfo (*.tab).
3. From the Look in list, navigate to where the tile server file is, select it from the list, and then click
Open. The tile server displays as the bottom-most layer on the map.
If the tile server table is open, and you want to add it to one of several maps that you currently have
open, then:
1. Open the Layer Control by selecting Map > Layer Control.
2. In the Layer Control list, select the map name to add the tile server layer to and click the Add
Layers
button.
3. In the Add Layer dialog box, select the tile server table and click OK.
The tile server displays as the bottom-most layer on the map and as a tile server layer in the Layer
Control list.
MapInfo Professional 10.5
416
User Guide
Chapter 15: Working with Web Services
Enhancing Map Data using a Mapping Tile Server
Adding a Microsoft Bing Layer to a Map
With a single click, you can easily add either a Microsoft Bing Aerial or Microsoft Bing Hybrid layer to
a map. You do not need to open the Bing table prior to adding it to the map. If the current window is
a map, MapInfo Professional adds the Bing layer to it. If the current window is not a map or there are
no windows open, then MapInfo Professional creates a new map with the Bing layer.
The Bing tile server may require that you have a valid license to access it. If you see a message that
your Microsoft Bing service has expired, then contact your Pitney Bowes Business Insight
representative to learn about renewal options.
To open and add Bing Aerial or Bing Hybrid (not roads) to a map:
•
From the File menu, click Add Bing Aerial to Map or click Add Bing Hybrid to Map. Or select
the Bing Arial
tool or Bing Hybrid
tool on the Standard toolbar.
The menu and toolbar items are always enabled except when the TAB file is missing, then the
menu and toolbar item is disabled. MapInfo Professional checks for the presence of the TAB
file(s) only once, during program startup.
The map refreshes and displays the tile server layer as a base image (the bottom layer of the map).
L
MapInfo Professional opens a Bing Roads table as a Bing Hybrid table. You may create a
Bing Roads tables using either the MapBasic Create Table command or by another means,
MapInfo Professional converts it to Hybrid to display it on a map.
Table Names and Location
There are two tables for Bing Aerial and Bing Hybrid installed in to a subdirectory called TileServer
where MapInfo Professional is located. The files are:
•
•
•
•
BingAerial.tab
BingAerial.xml
BingHybrid.tab
BingHybrid.xml
Setting Tile Server Layer Properties
Tile server layers offer the ability to alter display attributes of the image tiles. These are the same
properties that are supported for raster layers and include: translucency, transparency, brightness,
contrast and grayscale.
To access layer properties for a tile server layer:
1. Open the Layer Control window by selecting Map > Layer Control.
2. Select a tile server layer in the Layer Control list.
3. Click the Layer Properties button.
4. Check the Style Override check box.
MapInfo Professional 10.5
417
User Guide
Chapter 15: Working with Web Services
Enhancing Map Data using a Mapping Tile Server
5. Click the style button (below the Style Override check box). The Adjust Image Styles dialog box
displays.
6. Change the image properties to suit your needs.
Tile server layers may be set as translucent.
L
The sample image shown in this dialog is based on the current view in the map. If you wish to
see a different sample image in this dialog, you will need to change the map view prior to
bringing up this dialog. You may wish to change the view/image if selecting a transparent
color because the transparent color picker selects a color from the sample image.
MapInfo Professional 10.5
418
User Guide
Specialized Topics in
MapInfo Professional
The topics in this chapter cover the advanced use of MapInfo Professional.
There are more advanced topics pertaining to embedding maps in other
applications, Internet connectivity, working with the MapBasic window,
redistricting, and digitizing maps in the MapInfo Professional Help System.
Topics in this Section:
Embedding MapInfo Professional Maps . . . . . . . . . . . . . . . . . . .420
Internet Connectivity and MapInfo Professional. . . . . . . . . . . . .423
Redistricting — Grouping Map Objects into Districts . . . . . . . .425
Creating Expressions . . . . . . . . . . . . . . . . . . . . . . . . . . . . . . . . . .428
Working with the MapBasic Window . . . . . . . . . . . . . . . . . . . . . .440
16
Chapter 16: Specialized Topics in MapInfo Professional
Embedding MapInfo Professional Maps
Embedding MapInfo Professional Maps
MapInfo Professional brings its power of map display, creation and editing right into your favorite
application so that you may build a map where you need it. This chapter covers the basics of OLE
and the MapInfo Professional features that you may use in other applications to create dynamic
maps.
MapInfo Professional’s OLE embedding capability turns your applications such as word processors
and spreadsheets into “mini-MapInfo” programs where you can create, display and edit a map for
presentation, reporting or publishing. OLE is a process known as Object Linking and Embedding
whereby a server application (such as MapInfo Professional) provides information that is stored in a
client application that can accept OLE information (such as a word processor). MapInfo
Professional’s OLE embedding functionality allows you to embed a Map window in any application
that accepts OLE objects and use some of MapInfo Professional’s features to create, display and
edit the map directly in that application.
With MapInfo Professional OLE Embedding you can build the map directly in your OLE container
application, or you can create it in MapInfo Professional and drag the Map window into your
application for additional editing or output. Because the MapInfo Map Object is a live OLE object,
you are in fact running MapInfo Professional in the background. When the Map window is active in
the container, the menu and toolbar of your application change to reflect the MapInfo Professional
features that become available. This subset of features is called MapInfo Map. (Some OLE
containers will create a separate window for the object.) With the click of a button or by choosing a
menu command, you have MapInfo Professional functionality in your application where you need it.
•
For more information about OLE features and requirement in MapInfo Professional, see the
MapInfo Professional Help System.
What You Should Know First
Before you get started, it is good to review the system requirements and the registration statement
to ensure that you understand where to look for your MapInfo Map Objects.
System Requirements
MapInfo Map is an OLE server application that runs under 32-bit MapInfo Professional. You must
install MapInfo Professional 32-bit to engage MapInfo Map. On the client side, only container
applications that support OLE embedded objects can run MapInfo Map.
Registering OLE Objects with Containers
Once MapInfo Professional has been installed on your system, the MapInfo Map Object will be
registered automatically and listed as a choice in the Object dialog box of any container application
that accepts OLE objects.
MapInfo Professional 11.0
420
User Guide
Chapter 16: Specialized Topics in MapInfo Professional
Embedding MapInfo Professional Maps
Menus and Commands Available While Using the MapInfo Map
MapInfo Map replaces all container menus except File and Window with five MapInfo Professional
menus: Edit, View, Table, Map and Help. Under each menu, selected MapInfo Professional
features have been included, as outlined in this section. This section contains summaries of MapInfo
Map’s menu commands and tools. Be sure to refer to other chapters in this Guide and the rest of the
MapInfo Professional documentation set for more complete discussions.
•
For more about the specific commands available when working with Map windows, see the Help
System.
Limitations of OLE
Although MapInfo Map enables you to build a map very easily in your container application, not all of
MapInfo Professional’s features are available in the context of map embedding. Among them are
editing map objects such as regions or polylines, querying a table for further analysis, geocoding to
a table in the Map window, or displaying tables in other types of windows (Browser, Graph or Layout
windows).
However, with MapInfo Professional’s drag and drop capabilities you can still perform these
functions in MapInfo Professional and bring over the Map window to your OLE container application
for final viewing, formatting and editing enhancements.
Working with Embedded Maps
Now that you have had an introduction to MapInfo Map Object and what it can do for you as you
work in another application, let’s get down to the specifics of embedding an OLE object.
L
You need to specify what gets copied to the clipboard. See Setting Your Copy to Clipboard
Preferences on page 169. By default, you cannot copy a map until you set this preference.
Although containers vary in their handling of OLE objects, there are some behaviors that are
common to all. There are three ways that containers accept embedded OLE objects such as a Map
window:
•
•
•
On the Insert menu, click Object to choose the object to embed from a list.
On the Edit menu, click Paste (or Paste Special) to embed an object that was previously copied
to the Clipboard.
Drag and drop from the application to the container using the Drag Map Window tool.
The method you choose depends on which application you are in at the moment (server or client)
and how much you want to do to create the final map.
•
For more information and related topics, see Creating a New Map Window in your Container and
Bringing a Map Window into your Application in the Help System.
MapInfo Professional 11.0
421
User Guide
Chapter 16: Specialized Topics in MapInfo Professional
Embedding MapInfo Professional Maps
Sharing Documents with Embedded Maps
Once you have created a map in your document, you may want to share it with a colleague. Or you
might want to use it on another system. When the document is opened on another system, the
MapInfo Map Object displays as a metafile, or picture of the map, in the inactive state. The map is
like any other graphic image at this point. If no map editing is necessary, the document can be
printed, reformatted, reorganized, and saved with no special handling required for the map. The map
itself can even be resized or repositioned. You cannot, however, change the content of the map
since it is not an active OLE object.
To activate the map for editing on another system, your colleague must have access to 32-bit
MapInfo Professional and the data used to create the map. Double-click the map to activate the OLE
object. MapInfo Professional will prompt for the location of the data files if it cannot find the original
location. If the data is not available, cancel out of the Locate Data dialog box. The metafile image is
replaced with the MapInfo Professional world map in the active state. To retrieve the original metafile
image, close the document without saving and reopening it.
L
•
Sharing MapInfo Professional and map data on other systems is limited to the extent of your
license agreement(s).
For more information, see MapInfo Map Objects vs. Data Map Objects in the Help System.
Using MapInfo Tables with Data Map
Data Map uses MapInfo Professional tables. All of the sample maps provided with Data Map are
actually MapInfo Professional tables.
If you have created your own MapInfo Professional tables, you can use your tables in Data Map.
However, before you can display your table in Data Map, you must set up your table using the Data
Map Data Installer. To launch the Data Installer, double-click the file DATAINST.EXE. (To locate this
file, click the Windows Start button, and then click Find.) Once you have launched the Data
Installer, complete the dialog boxes that appear on the screen.
Note that some MapInfo Professional tables cannot be used with Data Map. Specifically:
•
•
•
Data Map cannot display raster image underlay tables.
Data Map cannot display a table that is actually defined as a relational join of other tables (such
as a Pitney Bowes Software Inc. StreetPro table). To use a street table with Data Map, use
MapInfo Professional’s Save Copy As command, which saves a street table in a “flat” form that
Data Map can use.
Data Map cannot display point objects that use MapInfo Professional “Custom” symbol styles.
(Custom symbols are selected by displaying MapInfo Professional’s Symbol Style dialog box,
and then selecting “Custom Symbols” from the Font drop-down list.) If your MapInfo Professional
table contains points with custom symbol styles, those points will be invisible in Data Map.
For more information about Data Map, see the Data Map online Help. For more information about
the Data Installer, see the Data Installer online Help.
MapInfo Professional 11.0
422
User Guide
Chapter 16: Specialized Topics in MapInfo Professional
Internet Connectivity and MapInfo Professional
Internet Connectivity and MapInfo Professional
MapInfo Professional contains options that allow you to bring the Internet into your mapping
sessions, and to bring your maps to the Internet.
Using active objects and the HotLink tool, you can launch files and Internet URLs directly from
objects or labels on your map. Active objects provide you with a powerful display tool that allows you
to bring information from the Web and other applications together in your map.
These additional sources of information can give your analysis or presentation greater impact. For
example, you can link a location on your map to a Web site that gives more information about the
location or to an image file that shows certain aspects of the location in more detail.
In addition, you can use the maps you create in MapInfo Professional in your Web pages. The HTML
Image Map tool converts a MapInfo Professional map into an HTML image map. Visitors to your
Web page will be able to click any region to link to other HTML pages specific to that region.
What Are Active Objects?
Active objects are map objects that are associated with files or URLs. The file can be a bitmap, a
MapInfo Professional workspace or table, a MapBasic program, or any type of executable file whose
extension is associated with an application installed on your system.
MapInfo Professional 11.0
423
User Guide
Chapter 16: Specialized Topics in MapInfo Professional
Internet Connectivity and MapInfo Professional
The active object in this map (red triangle) is linked to a webcam web site that displays
an erupting volcano.
The Help System contains these and other related topics:
•
•
•
•
•
•
Adding URL Information to your Table
Combining a District’s Objects
Creating Active Objects
Creating Multiple HotLinks in a Map
Using the HotLink Tool in a Map Window
Saving a New District and Exiting the Redistricter
HTML Landing Pages
The Landing Pages option allows you to click any region in the HTML image map and link to an
HTML landing page specific to that region. You can put whatever content you want into the landing
pages, including column information from your table. The user interface enables you to select the
columns you want to use and customize the text.
•
For more about selecting columns for landing pages and Tooltips, see the Help System.
MapInfo Professional 11.0
424
User Guide
Chapter 16: Specialized Topics in MapInfo Professional
Redistricting — Grouping Map Objects into Districts
Redistricting — Grouping Map Objects into Districts
One popular use of MapInfo Professional is to group map objects with a common field into districts
or territories. MapInfo Professional’s Redistricting feature allows you to create new districts, realign
existing districts, all the while doing calculations of the attached data on the fly for instant analysis
and decision-making.
What is Redistricting and How Can I Use It?
Redistricting is the process of assigning map objects to groups. As you assign map objects to
groups, MapInfo Professional automatically calculates totals for each group of objects, and displays
the totals in a special Browser window called the Districts Browser. This process is sometimes
known as load-balancing.
When you perform redistricting, you create a number of districts. The exact number of districts
needed depends on the nature of your work. You can assign a unique name to each district; thus, if
you want to work with four districts, you might call the districts Northeast, Southeast, Northwest, and
Southwest. Each district appears as one row in the Districts Browser.
The Districts Browser is different from other Browser windows in several respects:
•
•
•
You only can select one row at a time from the Districts Browser. You cannot shift-click to
select multiple rows.
The Districts Browser always has one row selected; you cannot cancel the selection of this
row by choosing Unselect All.
When you select a row from the Districts Browser, that row becomes the target district. The
target district is the district that will be affected by subsequent redistricting operations.
Once you have selected a target district, you assign map objects to that district by selecting the map
objects. You can select objects by pointing and clicking, or by performing queries such as SQL
Select.
When you select map objects, MapInfo Professional tentatively assigns the selected objects to the
target district. MapInfo Professional then recalculates the totals for each district, and displays the
new totals in the Districts Browser. You can then examine the contents of the Districts Browser to
decide whether you want to make the district assignments permanent.
To cancel the tentative district assignment, cancel the selection of the map objects.
To make the tentative district assignment permanent, choose Redistrict > Assign Selected
Objects. When you choose Assign Selected Objects, MapInfo Professional stores the target
district's name in the rows of the selected objects. Thus, if you assign map objects to a district called
Northwest, MapInfo Professional stores Northwest in each object's row.
Each district has its own set of fill, line, and symbol styles. When you assign a map object to a
district, the object subsequently appears in the style of the district. Thus, if you choose a solid blue
fill for the Northeast district, objects that you assign to Northeast appear in solid blue.
MapInfo Professional 11.0
425
User Guide
Chapter 16: Specialized Topics in MapInfo Professional
Redistricting — Grouping Map Objects into Districts
For example, if you have a layer of states, you might want to combine the state boundaries to create
sales territories. Each state record includes a field, TOT_SALES, which contains the total sales for
the previous year. You would ultimately like to sum up the TOT_SALES field for each state in a
given sales territory. Redistricting is gives you the tools for creating the sales territory and combining
those TOT_SALES fields from each state’s data into one table.
L
The STATES table used in this example is from the MapInfo Professional Tutorial data,
which is available from the Pitney Bowes Software Inc. web site,
http://go.pbinsight.com/webtutorials.
But that is only one part of the redistricting process. The real power lies in the Districts Browser
where you can see on-the-fly updates of district record counts and data totals when you click a map
object and assign it to another district. This allows you to perform visual “what if” analysis to achieve
district realignments, a process sometimes referred to as load balancing.
When you are satisfied with the distribution, you can make the district assignments permanent.
Later, as the need arises, you can change the assignments and try out new distributions.
Redistricting does not create new map objects or permanently change the style of the map objects.
Redistricting is simply a dynamic grouping tool that displays map objects that share the same district
information as a group. While the map objects are not permanently affected, you can make the
district assignments permanent by saving the table.
You can redistrict any mappable table containing region, line, or point objects. The redistrict map will
reflect the appropriate fill, line, or symbol style for the objects. The Redistricter limits the number of
districts in a table to 594.
You can use redistricting in a wide variety of applications such as creating and managing sales
territories, school or voter districts, emergency service coverage areas, delivery routes, natural
resource management areas, etc. Use it wherever there is a high degree of fluctuating data and the
need to try out different realignment scenarios.
You can use redistricting whether you need to create districts from scratch or realign existing
districts.
MapInfo Professional 11.0
426
User Guide
Chapter 16: Specialized Topics in MapInfo Professional
Redistricting — Grouping Map Objects into Districts
Before we get into the process, however, there are two key concepts to introduce: the Districts
Browser and Target District.
Using the Districts Browser
The Districts Browser is the key to the process of creating and changing districts. While looking like
other Browsers in MapInfo Professional, the Districts Browser is actually a dynamic window that
allows you to make changes to the groups and recalculates total values on the fly. You can
immediately see the results of your changes. You then have the option to make the changes
permanent or continue to try out new district realignments.
The Browser window lists the districts as specified in your table, the record count for each district,
and aggregate expression columns that contain the net total values of your data. You specify these
columns in the New Redistrict window dialog box when you begin the redistricting session.
•
For more instructions about creating and adding redistricting features and other related topics,
see the Help System.
For additional topics in Redistricting, see Setting up the Target District in the Help System.
Using Redistricting
When you calculate the percentage of partial columns (such as population columns that cite income,
gender, age, ethnic background, or religious affiliation) you have two calculation methods available.
One method calculates the percentage by column so that the sum of all of the entries in every
column would be 100%. Another method calculates the percentage by row based on your selected
row entry (or sum of entries) so that each percentage entry in the row is calculated based on that
row (or sum of entries). For example, in the following table:
A
B
C
1
1
1
2
2
2
The Column method determines the percentages of entries in Column A:
Percentage (A1)=A1/(A1 + A2) x 100%; Percentage (A2)=A2/(A1 + A2) x 100%
The Row method determines the percentage for entries A1 and B1 based on C1 as a total column:
MapInfo Professional 11.0
427
User Guide
Chapter 16: Specialized Topics in MapInfo Professional
Creating Expressions
Percentage (A1) = A1/C1 x 100%; Percentage (B1) = B1/C1 x 100%
L
•
Selecting a valid base entry (or the sum of the entries) is crucial to returning meaningful
results. For example, if you choose a value in a population column and a base value from an
income column, your results will not be meaningful.
For more information, see Creating New Districts and Redistricting using the Row Method in the
Help System.
Options in Redistricting
To control the order of districts in the Districts Browser, on the Redistrict menu, click Options. The
Redistricter Options dialog box displays. Choose your preferred sort order from among: most
recently used, alphabetical, or unordered. You can also choose to show the Browser grid lines and
save the options as your default.
As mentioned earlier, the Most Recently Used option can greatly aid you if you have more districts
than the Districts Browser can display in a window. Whenever you select a map object that belongs
to a district that is not currently visible in the Browser, MapInfo Professional will move that record
near the top of the Browser window. You can then more easily set the new target district or view the
changes in the data fields as you carry out your load-balancing scenario.
Changing the display of your districts is simple. Click the fill pattern, line style, or symbol in the
Districts Browser that represents the district. The Region Style, Line Style, or Symbol Style dialog
box displays, where you can change the tools used to display the district.
To save the style changes, you must save the redistricting session as a workspace. Save Table will
only save the district assignment changes. The styles belong to a thematic layer, not to the table
itself. The district changes are applied to the table and, thus, can be saved to the table.
Records with No Graphic Objects
Redistricting involves grouping map objects into districts. If you are redistricting a table that contains
records that do not have graphic objects associated with them, keep in mind that MapInfo
Professional includes them as well in the Districts Browser. You cannot assign these records to new
districts. They will affect your data calculations when you move objects into new districts.
If you have numerous records without graphic objects in your table, it may be best to create and
save a subset of the table and run the Redistricter on the new table.
Creating Expressions
Formulating expressions is something like writing sentences. There is a vocabulary of words from
which you can draw, and these words have to be combined according to syntactic rules. The syntax
of expressions is much simpler than the syntax of English, and the vocabulary is vastly smaller.
However, most of us have been using English for years and so it seems easy and natural whereas
formulating expressions is, at first, sometimes a bit difficult.
MapInfo Professional 11.0
428
User Guide
Chapter 16: Specialized Topics in MapInfo Professional
Creating Expressions
However, just as English has simple sentences and complex sentences, so there are simple
expressions and complex ones. Even if you don’t get the hang of formulating complex expressions,
you can still use all the MapInfo Professional commands that use expressions. That is because
formulating simple expressions is very easy and, at the same time, allows you to work with your data
in powerful ways.
•
Most of the procedural information for Creating Expressions is available in the Help System.
Where Expressions Can Be Used
Use the Expression dialog box to formulate mathematical and alphanumeric expressions in several
MapInfo Professional dialog boxes. See the Help topic, Specifying an expression.
Expressions are used in the following commands: Select, Update Column, Thematic Mapping, and
Layer Control (double-click the layer and select from the Label with list on the Label Display tab).
The expression serves a different purpose in different commands.
For example:
In the Select command the expression states a condition that a record in a table must meet in order
to be included in a query table.
•
•
•
In Update Column the expression calculates a value that is then entered into a table.
In Thematic Mapping the expression calculates a value that is then displayed on a map.
In Label Options, you use expressions containing string functions to fine tune your labels.
The expressions fall into two broad categories:
•
•
Expressions that must evaluate to true or false.
Expressions that simply calculate some value.
Expressions that must evaluate to true or false always have a comparison operator and may have
multiple clauses connected by logical operators. Use these expressions for selecting objects.
Expressions that simply calculate some value never have a comparison operator and generally do
not have multiple clauses. Use these expressions to calculate values for Thematic Mapping, Update
Column, and Label With Column in Layer Settings.
Constructing Simple Expressions
You formulate expressions using column (field) names and constants (for example, specific data
values), on the one hand, and functions and operators, on the other. Think of the column names and
constants as nouns, and functions and operators as verbs, prepositions and conjunctions. You
always need at least one column name or a constant in an expression. How many operators and
functions you need depends on what you want to do with your expression.
The simplest possible expression consists of a column name, for example:
1. POP_1990
2. STATE
MapInfo Professional 11.0
429
User Guide
Chapter 16: Specialized Topics in MapInfo Professional
Creating Expressions
You could use such an expression in Thematic Mapping to indicate what data is to be represented
on the map. In Update Column such an expression would tell MapInfo Professional what data to use
in updating a column in the target table.
Here are some slightly more complex expressions:
1. POP_1990 > 17893
2. POP_1990 <= POP_1980
3. COUNTY <> ”Orange”
4. POP_1980 * 1.2
5. POP_1990 / TOTAL_AREA
6. round(POP_1990/TOTAL_AREA,.1)
The first three examples use comparison operators. The first tests to see whether the 1990
population is greater than (>) some constant (17893). The second tests to see whether the value of
one column, POP_1990, is less than or equal to (<=) the value of another column, POP_1980. The
third tests to see whether or not the county is Orange. When the county does not equal (<>)
“Orange” the record is selected. You could use any of these expressions in Select or in the Where
Condition clause of SQL Select. These commands allow you to select a subset of the records in a
table. The expression defines the characteristics of the subset.
Examples 6 and 7 use arithmetic operators. Example 6 multiplies (*) the value of POP_1980 by a
constant (1.2) while example 7 divides one column, POP_1990, by the value of another column,
AREA.
Example 8 uses the round function to round the value of the expression “POP_1990/TOTAL_AREA”
to the nearest tenth (.1).
Expressions 6, 7 and 8 don’t have comparison operators and therefore they would not be suitable
for use in Select or in the Where Condition clause of SQL Select. However, you could use them
alone in Thematic Mapping, Update Column, or Select columns in SQL Select.
Setting Filter Criteria for Expressions
A filter criterion is a logical expression that usually compares a column value against some other
value. For example, the following filter criterion uses the greater-than operator (>) to test whether the
Order_Amount column has a value greater than one hundred:
Where Condition: Order_Amount > 100
If a query includes the preceding Where Condition clause, MapInfo Professional selects only the
rows that have an Order_Amount value greater than one hundred.
The Where Condition field can contain two or more logical expressions if the expressions are
separated by the word And or by the word Or. If the expressions are joined by the word And,
MapInfo Professional only selects the rows that satisfy both criteria. If the expressions are joined by
the word Or, MapInfo Professional selects any row that satisfies either criterion.
Filter criteria can use any column in your base table(s), regardless of whether you included the
column in the Select Columns field.
MapInfo Professional 11.0
430
User Guide
Chapter 16: Specialized Topics in MapInfo Professional
Creating Expressions
Columns can be referred to by name or by number, where the number designates the order the
column has in Select Columns. Thus, "col1" and "col6" refer to the first and sixth columns,
respectively. The number must be preceded by the letters "col".
•
For more instructions and related topics, see the Using Expressions to Create a New Column
topic in the Help System.
Constructing Complex Expressions
Now consider examples 9 and 10, that are a bit more complex than 1 through 8:
1. POP_1990 > POP_1980*1.2
2. round((POP_1980*1.2)/TOTAL_AREA,.1)
We created expression 9 by taking expression 3 and replacing the constant “17893” with the whole
of expression 6. Similarly, we created expression 10 by taking expression 8 and replacing
“POP_1990” with expression 6.
In general, you create complex expressions by combining simple expressions. Perhaps the best way
to learn how to do this is look at some of the examples we have provided (above and following) and
create your own expressions based on those examples. However, there are two very general
techniques for creating complex expressions.
•
•
Replace a column name or a specific value with a simple expression.
Combine expressions using logical operators (and, not, or).
Example six illustrates the first technique. There are many examples of the second technique
throughout this entry. See particularly the discussion following Using Logical Operators in
Expressions.
Entering Specific Values (Constants) into Expressions
Use the Expression dialog box to formulate mathematical and alphanumeric expressions in several
MapInfo Professional dialog boxes.
When entering specific character strings, numbers, and dates into expressions, you need to observe
the following conventions.
Character Strings in Expressions
When typing a particular string into an expression you must enclose it in double quotes. MapInfo
Professional then treats it as a string rather than as a column name. For example, strings 1 and 2
shown below are valid string constants, while 3 and 4 are not.
1. "Orange"
2. "New York"
3. Orange
4. New York
MapInfo Professional 11.0
431
User Guide
Chapter 16: Specialized Topics in MapInfo Professional
Creating Expressions
Numbers in Expressions
When entering specific numerical values, do not use commas, dollar signs, or any characters other
than numerals, decimal points, and the minus sign for negative numbers. You can use E to denote
numbers in exponentiation.
Date Values in Expressions
Dates consist of a month, a day, and an optional year. The year is specified by two or four digits and
enclosed in double quotes. The components of a date are separated by hyphens or slashes. If the
year is not specified, it defaults to the year set on your computer's clock. The following are valid data
constants:
System
Order
What MapInfo Professional Expects
M/d/yy
02/28/2005
M/d/yyyy
02/28/2005
MM/dd/yy
02/28/2005
MM/dd/yyyy
02/28/2005
yy/MM/dd
2005/02/28
dd-MMM-yy
02-28-2005
Using Mathematical Operators in Expressions
Use the Expression dialog box to formulate mathematical and alphanumeric expressions in several
MapInfo Professional dialog boxes. Mathematical operators are often used in creating expressions.
The following chart shows the operator's symbol, name, example, and how the operators handle
different data types.
Symbol
Description
Example
Detailed Example
+
plus
A+B
Date + Number: Date
04/01/2007 + 4: 04/05/2007
FloatNumber + Date: Date
4 + 232: 236
-
minus
A - B (subtraction)
-A (negative)
Date - Number: Date
Number - Date: Date
236 - 4: 232
some number - some number: Float
*
times
A*B
some integer * some integer: Integer
some number * some number: Float
MapInfo Professional 11.0
432
User Guide
Chapter 16: Specialized Topics in MapInfo Professional
Creating Expressions
/
divided by
A/B
some number / some number: Float
^
exponentiation
A^B
some number ^ some number: Float
The following calculations are possible:
•
•
•
Adding numbers to dates to yield another date.
Subtracting a number from a date to yield another date.
Subtracting a date from a date to yield a number.
When you add numbers to dates or subtract numbers from dates, MapInfo Professional treats the
numbers as specifying a number of days. When you add or subtract a week, you use the number 7.
When you add or subtract a month, you use 30 or 31. When MapInfo Professional subtracts a date
from a date, the result indicates a number of days.
Using String Operators in Expressions
+
“concatenation” — connects strings and string expressions.
&
(can be used if preceded by a space)
Strings must be enclosed in double quotes. Consider the following example:
”Ms.” + Last_Name
When MapInfo Professional evaluates this as part of an expression it places “Ms. “in front of each
last name. Note that the string constant (“Ms. “) is in quotes. Similarly,
”Hello,” + ”world”
gives you “Hello, world.” And
”4”+”5”
gives you “45.”
Using Comparison Operators in Expressions
Use the Expression dialog box to formulate mathematical and alphanumeric expressions in several
MapInfo Professional dialog boxes. Comparison operators are often used in creating expressions.
The following chart shows the comparison operator symbols and a description.
Operators
Description
=
“equals”
<>
“not equals”
>
“greater than”
MapInfo Professional 11.0
433
User Guide
Chapter 16: Specialized Topics in MapInfo Professional
Creating Expressions
Operators
Description
<
“less than”
>=
“greater than or equal to”
<=
“less than or equal to”
The Help System contains these related topics:
•
•
•
•
Numerical Comparison
String Comparison
Date Comparison
Logical Comparison
Numerical Comparison
Numerical comparisons are based on the numerical values of the expressions and numerical
constants.
English: All rows where the household income is above $65,000.
1. HH_INC>65000
Comment: Don’t add the dollar sign or comma. MapInfo Professional doesn’t know what to do with it
and gives you an error message.
English: All rows where the median age is 42.
1. MED_AGE=42
Comment: This expression selects only those records where the median age is exactly 42. When
your median age data contains a decimal portion (which is the case for MapInfo Professionalsupplied demographic data) then it is unlikely that there are many regions with a median age of
exactly 42.
The following expression gives you better results:
1. Round(MED_AGE, 1)=42
Comment: The function “round(somenumber, somenumber)” rounds the first number in the way
specified by the second. In this example, the first number is the median age (MED_AGE) and the
second is 1, indicating that median age is to be rounded to the nearest whole number.
English: All rows where the amount does not equal $23,000.
1. AMOUNT<>23000
Comment: You might want to use the Round function, as in 10, if you are not concerned that the
value be exactly 23000.
MapInfo Professional 11.0
434
User Guide
Chapter 16: Specialized Topics in MapInfo Professional
Creating Expressions
String Comparison
String comparisons are based on the exact character content of the string. In this case “>” means
“alphabetically greater than” (for example, comes after in the alphabet) and “<” means
“alphabetically less than.”
When typing a string into an expression, you should enclose it in quotes so that MapInfo
Professional knows to treat it as a string, rather than treating it as a column name.
English: All rows where the vendor is Acme.
1. VENDOR=”Acme”
Comment: Note that Acme is in quotes so that MapInfo Professional knows to treat it literally (as a
character string) rather than to search for a column named Acme.
English: All rows where the vendor is not Acme.
1. VENDOR<>”Acme”
Date Comparison
English: All entries received on October 9, 1991.
1. RECEIVED=”10–9–91”
L
•
•
•
•
Consider these conventions:
The date is enclosed in quotes
It is in the form: Month, Day, Year
The numbers in the data are separated by a hyphen or a slash (/)
Two characters were used for the year. You can also use four characters (1991)
English: All received after October 9, 1991.
1. RECEIVED>”10–9–91”
Comment: This expression does not select those received on October 9, 1991. When you want them
as well:
1. RECEIVED>=”10–9–91”
English: Records for all received before August.
1. Month(RECEIVED)<8
Comment: This expression uses the Month function to extract the month in the date. It doesn’t
specify any particular year. When your database has records for several years, this expression does
not pay attention to the particular year.
Logical Comparison
English: All that have shipped.
1. Shipped
MapInfo Professional 11.0
435
User Guide
Chapter 16: Specialized Topics in MapInfo Professional
Creating Expressions
Comment: The column “Shipped” is a logical column. It contains “T” for true, or yes, and “F” for false,
or no. When an order is shipped, it is marked “T”. Otherwise, it is not shipped. For orders that are
shipped, expression 28 evaluates to true. For orders not shipped it evaluates to false.
English: All that have not shipped.
1. Str$(Shipped)=”F”
2. Not Shipped
Using Geographic Operators in Expressions
MapInfo Professional has several geographic operators. Use them to select objects on the basis of
their spatial relationship to some other object. MapInfo Professional has a special keyword you use
with geographical operators: “obj” or “object”. This keyword tells MapInfo Professional that it has to
get values based on the graphical objects in the table rather than the tabular data.
The geographic operators go between the objects being specified. Select the geographic operators
from the Operators menu. Here are the geographic operators:
Contains
Object A Contains object B if B’s centroid is anywhere within A’s boundary.
Contains Entire
Object A Contains Entire object B if B’s boundary is entirely within A’s boundary.
Contains Part
Object A Contains Part object B if B’s boundary is partly within A’s boundary.
Within
Object A is Within object B if its centroid is inside B’s boundary.
Entirely Within
Object A is Entirely Within object B if A’s boundary is entirely within B’s
boundary.
Partly Within
Object A is Partly Within object B if A’s boundary is partly within B’s boundary.
Intersects
Object A Intersects object B if they have at least one point in common.
“Contains Part” and “Partly Within” are exactly equivalent to “Intersects”—these are all treated the
same way by MapInfo Professional, so the standard syntax “Intersects” is almost universally used.
“Contains” and “Within” are concerned only with objects' centroids.
“Contains Entire” and “Entirely Within” are concerned with the area covered by a region object; the
location of the centroid doesn't matter. See examples in Using Geographic Operators in Expressions
in the Help System.
MapInfo Professional 11.0
436
User Guide
Chapter 16: Specialized Topics in MapInfo Professional
Creating Expressions
Using Logical Operators in Expressions
“And”, “or”, and “not” are logical operators. You use them to combine expressions in Select and the
Where Condition clause of SQL Select. MapInfo Professional treats each such an expression as a
test, which it applies to each record in the table. For each test it gets a yes/no (true/false) answer.
MapInfo Professional uses the logical operators to tell it how to combine the individual yes/no
answers into an overall yes/no answer: Does the current record meet the selection condition?
Operator
Description
and
is “true” if (and only if) both of its arguments (the expressions it joins together) are
true. A record must satisfy both of these conditions if it is to be selected.
or
is “true” if either one, or both, of its arguments (the expressions it joins together)
are true. A record need satisfy only one of these conditions if it is to be selected. It
is also selected if both of its conditions are satisfied.
not
is “true” if its argument (the expression it applies to) is false. A record is selected if
it does not meet the stated condition.
Suppose you want to select all properties that are worth $250,000 or more and are in Columbia
county. Each record has to meet two criteria, each of which can be formulated as a simple
expression:
1. VALUE >= 250000
2. COUNTY = “Columbia”
You could perform one selection for all properties worth $250,000 or more. Then you could perform
another selection on that result, looking for all properties in Columbia county. However, it is easier to
combine the two operations into one using the logical operator “and”.
1. COUNTY = “Columbia” and VALUE >= 250000
When MapInfo Professional examines a record to see whether or not it meets the condition set by
this expression, it makes the two tests: Does COUNTY equal Columbia? Is the VALUE equal to or
greater than 250000? When the answer to both of these questions is true (or yes), then the record is
accepted into the current selection. When the answer to one or both of the questions is no (or false),
then the record is not accepted into the current selection.
MapInfo Professional 11.0
437
User Guide
Chapter 16: Specialized Topics in MapInfo Professional
Creating Expressions
Now, what if you want all properties worth $250,000 or more and not in Columbia county? You can
use “not” to negate the first clause of expression 33, yielding expression 34:
1. not (COUNTY=”Columbia”) and VALUE>=250000
Only records where the county is not Columbia satisfy the first clause of expression 34. Now
consider expression 35:
1. not (COUNTY=”Columbia” and VALUE>=250000)
Expression 35 is simply the negation of expression 33. Any record that would satisfy 33 does not
satisfy 35. Any record that does not satisfy 33 satisfies 35.
You can use “or” when you want to specify alternative conditions, such as:
1. COUNTY=”Columbia” or COUNTY=”Greene”
Any record evaluated against this condition is accepted if its county is any one of the two specified
counties. One could, of course, use numerical tests as well. For example:
1. TOTAL_AREA>40 or VALUE>250000
This tests to see whether the area is greater than 40 or the value is greater than 250000. When
either one is true of a record, then that record is accepted into the selection.
In formulating expressions using logical operators you have to be careful how you use them. The
following expression, while it seems OK, does not work:
1. COUNTY=“Columbia” or “Greene”
Judging from its English translation—COUNTY equals Columbia or Greene—this expression should
operate just like expression 36 and give us any record containing Columbia County or Greene
County. But the rules of computational logic and the rules of English are a bit different.
When MapInfo Professional reads expressions it reads them from left to right. One of the things it
has to do is to determine how the items in the expression are grouped. Think of this operation as
inserting parentheses into the expression. MapInfo Professional reads expression 35 as though it
were grouped like expression 39, which is what we intend.
It reads expression 38 as though it were grouped like 40, which is not at all what we want.
1. (COUNTY=”Columbia”) or (COUNTY=”Greene”)
2. (COUNTY=”Columbia”) or (”Greene”)
Both 39 and 40 have the same first clause. But their second clauses (after the “or”) are quite
different. The second clause of 40 is simply a literal string, “Greene.” By convention, MapInfo
Professional evaluates a record against a literal string as being true if that record is not blank. When
MapInfo Professional evaluates records against expression 40, all non-blank records are evaluated
as true and be accepted into the selection. It does not make any difference how a record evaluates
on the first clause. Any non-blank record evaluates as true on the second clause, and one “true” is
all it takes to evaluate the entire expression as true.
Let us consider one final example, which is the negation of expression 36:
1. not (COUNTY=”Greene” or COUNTY=”Columbia”)
MapInfo Professional 11.0
438
User Guide
Chapter 16: Specialized Topics in MapInfo Professional
Creating Expressions
Expression 39 is satisfied if the county is Greene or if it is Columbia, but not if it is Montgomery or
Warren. Expression 41 is satisfied by any county other than Greene or Columbia, including
Montgomery and Warren.
The Help System contains these related topics:
•
•
•
•
Numeric Clauses
String Clauses
Date Clauses
Keyword Clauses
Understanding Operator Precedence
When MapInfo Professional evaluates expressions it needs to know which components of an
expression to evaluate first. This is called precedence. By convention, certain operators are
assigned different levels of precedence. Those with the highest level are evaluated first. The
following table lists MapInfo Professional’s operators in the order in which they are evaluated.
Exponentiation evaluates from the right. This affects expressions with multiple exponents: 2 ^ -3 ^ -4
= 2 ^ ( - (3 ^ (-4)))
Operators at the same level of precedence are evaluated from left to right.
Highest Priority:
Parenthesis
Exponentiation
Negation
Multiplication, Division
Addition, Subtraction
Geographic operators, Comparison operators
Not
And
Lowest Priority:
Or
For example, the expression 3+4*2 produces a result of 11. That is because multiplication has a
higher precedence than addition and is performed first, in effect:
3+4*2=
3+8=
11
We can add parenthesis to force MapInfo Professional to do the addition first:
(3+4)*2=
7*2=
14
MapInfo Professional 11.0
439
User Guide
Chapter 16: Specialized Topics in MapInfo Professional
Working with the MapBasic Window
Now consider expression 60, which is intended to select all records July or September of 1989.
1. year(RECEIVED)=89 and month(RECEIVED)=7 or month(RECEIVED)=9
Because “and” has higher precedence than “or”, MapInfo Professional treats this expression as
though “year(RECEIVED)=89 and month(RECEIVED)=7” was enclosed in parentheses.
1. (year(RECEIVED)=89 and month(RECEIVED)=7) or month(RECEIVED)=9
In this case, any record for July of 89 or for September of any year would be selected. That’s
probably not what you want. However, by adding parentheses to the second expression, you can get
this:
1. year(RECEIVED)=89 and (month(RECEIVED)=7 or month(RECEIVED)=9)
In this expression, the parentheses tell MapInfo Professional that “month(RECEIVED)=7” and
“month(RECEIVED)=9” are alternatives in the second clause of the expression. MapInfo
Professional treats this the same as it treats number 53 above.
L
When you are not sure how MapInfo Professional evaluates an expression with several
operators, you should use parentheses to group elements as you want them.
Using Functions in Expressions
Functions take data values and perform some operation on them to produce a new value. Functions
have the following form:
SomeFunction(parameters)
Most of MapInfo Professional’s functions take one or two parameters. A parameter can be a column
or another expression. MapInfo Professional uses the keyword “obj” or “object” with the geographic
functions: Area, CentroidX, CentroidY, ObjectLen, and Perimeter. This keyword tells MapInfo
Professional that it has to get values based on graphical objects in the table rather than tabular data.
•
For more information about specific functions, see the Help System.
Working with the MapBasic Window
This section allows advanced MapInfo Professional users to go behind the scenes and take
advantage of functions that enhance the use of MapInfo Professional through the MapBasic window.
MapBasic is MapInfo Professional’s programming language that allows you to customize and
automate MapInfo Professional functionality. When MapBasic was created, the MapBasic Window
feature was added to MapInfo Professional as a means of testing and debugging code for an
application. It became apparent that the MapBasic window is also a useful tool to MapInfo
Professional users for doing certain tasks such as complex selections and queries based on object
information.
MapInfo Professional 11.0
440
User Guide
Chapter 16: Specialized Topics in MapInfo Professional
Working with the MapBasic Window
The MapBasic window is limited to selected commands from the MapBasic programming language.
The MapBasic window can take commands line by line. It does not include the capability for looping,
interapplication communication, and other more complex commands. If you find yourself using the
MapBasic window often, you may want to consider transferring your code to a MapBasic application
that will automate the process.
L
There is a comprehensive list of MapBasic functions and statements you can use from the
MapBasic window in the Help System.
Accessing the MapBasic Window
To access the MapBasic window, on the Options menu, click Show MapBasic Window. The
MapBasic window displays on your screen. As with any other window, you may resize it or move it to
a new location. The window allows you to enter MapBasic code or to view MapBasic code as it is
generated by MapInfo Professional.
To see how MapInfo Professional carries out a select statement:
1. Open the MapBasic window and then open the WORLD table.
2. On the Query menu, click Select.
3. Type in the expression Pop_1994 > 1000000. Make sure that the Browse Results box is
checked.
4. Click OK. The syntax for these commands appears in the MapBasic window as follows:
Open Table ”C:\MAPINFO\DATA\WORLD\WORLD.tab” Interactive
Map From World
select * from World where Pop_1994 > 1000000 into Selection
browse * from Selection
The first line is a result of opening the WORLD table. The second line of code is written
automatically because the WORLD table displays in a Map window by default. The third line is the
syntax for the select statement. The fourth line is the result of checking the Browse results box.
You can also enter MapBasic commands into the MapBasic window. Position your cursor under the
browse from Selection line. Type the following:
Map from Selection
Press Enter after the line, and the command executes. You should see your selection displayed in a
Map window.
As stated before, the MapBasic window was primarily designed to assist MapBasic programmers.
You can statements and functions in the MapBasic window such as Buffer( ) function or Insert
statement.
MapInfo Professional 11.0
441
User Guide
Chapter 16: Specialized Topics in MapInfo Professional
Working with the MapBasic Window
Refer to the MapBasic Reference, which is located in the Documentation subfolder of your
installation directory to find the appropriate usage and syntax for these statements and functions. It
provides a comprehensive guide to MapBasic programming statements and functions along with
examples.
L
There is a comprehensive list of MapBasic functions and statements you can use from the
MapBasic window in the Help System.
Running a MapBasic Program
Use Run in the Tools menu to run a MapBasic program. MapBasic is a programming language that
you can use to customize or automate Maplnfo Professional. To create MapBasic applications, you
need the MapBasic compiler, which is a separate product. However, you do not need the MapBasic
compiler to run a completed MapBasic application.
MapInfo Professional comes with an assortment of completed MapBasic applications. Some
examples include:
•
•
•
•
Symbol application (SYMBOL.MBX). Creates custom symbol shapes.
Scale Bar application (SCALEBAR.MBX). Annotates a map with a distance scale.
Named Views application (NVIEWS.MBX). Assigns a name to the current map view and use
that name to return to that view later.
Overview application (OVERVIEW.MBX). Opens a second Map window that displays an
overview of the current map (also referred to as an area detail map).
To run a MapBasic application:
1. Choose Tools > Run MapBasic Program. The Run MapBasic Program dialog box displays.
2. Choose a directory.
3. Choose an application from the list (MapBasic applications have an .mbx extension).
4. Click OK.
MapInfo Professional then runs the MapBasic application.
Running a MapBasic Program Using a Startup Workspace
You can use a startup workspace to run a MapBasic application. However, you cannot create this
kind of workspace using Save Workspace As. When you want to run a MapBasic application in your
startup workspace, you need to create the workspace with a text editor.
1. Place the following into an ASCII file:
!workspace
!version 700
run application "someprog.mbx"
2. Replace “Someprog.app” with the name of the MapBasic application you want to launch from the
startup workspace.
3. Name this file STARTUP.WOR.
MapInfo Professional 11.0
442
User Guide
Chapter 16: Specialized Topics in MapInfo Professional
Working with the MapBasic Window
4. Place this file in your MapInfo Professional program directory or in your home directory.
The Help System contains these and other related topics:
•
•
•
•
Copying the Contents of the MapBasic Message Window
Issuing Commands through the MapBasic Window
Examples of MapBasic Programs
Creating Circles around Points using the MapBasic Window
L
There is a comprehensive list of MapBasic functions and statements you can use from the
MapBasic window in the Help System.
MapInfo Professional 11.0
443
User Guide
Directory of MapInfo
Professional Shortcuts
This section contains a comprehensive list of the shortcuts available in the
MapInfo Professional application. You can create custom shortcuts by editing
the MAPINFOW.MNU file using a text editor.
CAUTION:
Making changes to the MAPINFOW.MNU file may cause
the default shortcuts you change to stop working. Make
these changes carefully and record your changes so you
can change them back, if necessary.
Topics in this Section:
Shortcuts for File Menu Items . . . . . . . . . . . . . . . . . . . . . . . . . . . .445
Shortcuts for Edit Menu Items . . . . . . . . . . . . . . . . . . . . . . . . . . .445
Shortcut to Tools Menu Items . . . . . . . . . . . . . . . . . . . . . . . . . . . .445
Shortcuts to Objects Menu Items . . . . . . . . . . . . . . . . . . . . . . . . .446
Shortcuts for Query Menu Items. . . . . . . . . . . . . . . . . . . . . . . . . .446
Shortcuts for Options Menu Items . . . . . . . . . . . . . . . . . . . . . . . .446
Shortcuts for Map Menu Items . . . . . . . . . . . . . . . . . . . . . . . . . . .446
Shortcuts for Window Menu Items . . . . . . . . . . . . . . . . . . . . . . . .447
Shortcuts by Keystroke . . . . . . . . . . . . . . . . . . . . . . . . . . . . . . . . .447
Shortcuts for the Map or Layout Window . . . . . . . . . . . . . . . . . .449
A
Chapter A: Directory of MapInfo Professional Shortcuts
Shortcuts for File Menu Items
Shortcuts for File Menu Items
Menu Item
Keystrokes
File > New Table
Ctrl+N
File > Open
Ctrl+O
File > Save Table
Ctrl+S
File > Save Workspace
Ctrl+K
File > Print
Ctrl+P
File > Exit
Alt+F4
Shortcuts for Edit Menu Items
Menu Item
Keystrokes
Edit > Undo
Ctrl+Z
Edit > Cut
Ctrl+X
Edit > Copy
Ctrl+C
Edit > Paste
Ctrl+V
Edit > Clear
Del
Edit > Reshape
Ctrl+R
Edit > New Row
Ctrl+E
Edit > Get Info
F7
Shortcut to Tools Menu Items
Menu Item
Tools > Run MapBasic Prog
MapInfo Professional 10.5
Keystrokes
Ctrl+U
445
User Guide
Chapter A: Directory of MapInfo Professional Shortcuts
Shortcuts to Objects Menu Items
Shortcuts to Objects Menu Items
Menu Item
Keystrokes
Objects > Set Target
Ctrl+T
Objects > Clear Target
Ctrl+Delete
Shortcuts for Query Menu Items
Menu Item
Keystrokes
Query > Unselect All
Ctrl+W
Query > Find
Ctrl+F
Query > Find Selection > In Current Map Window
Ctrl+G
Query > Find Selection > In All Windows
Ctrl+A
Shortcuts for Options Menu Items
Menu Item
Keystrokes
Options > Line Style
Shift+F8
Options > Region Style
Ctrl+F8
Options > Symbol Style
Alt+F8
Options > Text Style
F8
Shortcuts for Map Menu Items
Menu Item
Keystrokes
Map > Layer Control
Ctrl+L
Map > Create 3D Map
F11
MapInfo Professional 10.5
446
User Guide
Chapter A: Directory of MapInfo Professional Shortcuts
Shortcuts for Window Menu Items
Menu Item
Keystrokes
Map > Create Prism Map
F10
Map > Create Thematic Map
F9
Map > Modify Thematic Map
Alt+F9
Map > Previous View
Alt+Left Arrow
Shortcuts for Window Menu Items
Menu Item
Keystrokes
Window > New Browser
F2
Window > New Mapper
F3
Window > New Grapher
F4
Window > New Layout
F5
Window > Redraw Window
Ctrl+D
Window > Tile Windows
Shift+F4
Window > Cascade Windows
Shift+F5
Shortcuts by Keystroke
Menu Items
Keystrokes
Map > Previous View and
Layout > Previous View
Alt+Left Arrow
File > Copy
Ctrl+C
Window > Redraw Window
Ctrl+D
File > New Row
Ctrl+E
Query > Find
Ctrl+F
Query > Find Selection
Ctrl+G
MapInfo Professional 10.5
447
User Guide
Chapter A: Directory of MapInfo Professional Shortcuts
Shortcuts by Keystroke
Menu Items
Keystrokes
File > Save Workspace
Ctrl+K
Map > Layer Control
Ctrl+L
File > New Table
Ctrl+N
File > Open
Ctrl+O
File > Print
Ctrl+P
File > Reshape
Ctrl+R
File > Save Table
Ctrl+S
Objects > Set Target
Ctrl+T
Tools > Run MapBasic Program
Ctrl+U
File > Paste
Ctrl+V
Query > Unselect All
Ctrl+W
File > Cut
Ctrl+X
File > Undo
Ctrl+Z
Objects > Clear Target
Ctrl+Delete
Window > New Browser
F2
Window > New Mapper
F3
Window > New Grapher
F4
Window > New Layout
F5
File > Get Info
F7
Options > Text Style
F8
Map > Create Thematic Map
F9
Map > Create Prism Map
F10
Map > Create 3D Map
F11
File > Exit
Alt+F4
Options > Symbol Style
Alt+F8
Map > Modify Thematic Map
Alt+F9
MapInfo Professional 10.5
448
User Guide
Chapter A: Directory of MapInfo Professional Shortcuts
Shortcuts for the Map or Layout Window
Menu Items
Keystrokes
Options > Region Style
Ctrl+F8
Window > Tile Windows
Shift+F4
Window > Cascade Windows
Shift+F5
Options > Line Style
Shift+F8
Edit > Delete
Del
Shortcuts for the Map or Layout Window
When the Map or Layout is Active
Action
Keystroke
Activate/Deactivate Snap
s
Activate/Reactive Auto Trace
t
Activate/Reactive Large Cursor
c
Pan Down
down arrow
Pan Left
left arrow
Pan Right
right arrow
Pan Up
up arrow
Switch Between Open Windows
Ctrl + TAB
Zoom In
+
Zoom Out
–
MapInfo Professional 10.5
449
User Guide
Chapter A: Directory of MapInfo Professional Shortcuts
Shortcuts for the Map or Layout Window
While Drawing a Polyline or Polygon
Action
Keystroke
Delete previous node
Backspace
When Selecting One or More Objects from the Editable Layer or Layout
Action
Keystrokes
Move object to the down, one screen pixel at a time
Ctrl+Down arrow
Move object to the down, ten screen pixel at a time
Ctrl+Shift+Down arrow
Move object to the left, one screen pixel at a time
Ctrl+Left arrow
Move object to the left, ten screen pixel at a time
Ctrl+Shift+Left arrow
Move object to the right, one screen pixel at a time
Ctrl+Right arrow
Move object to the right, ten screen pixel at a time
Ctrl+Shift+Right arrow
Move object to the up, one screen pixel at a time
Ctrl+Up arrow
Move object to the up, ten screen pixel at a time
Ctrl+Shift+Up arrow
MapInfo Professional 10.5
450
User Guide
Elements of a Coordinate
System
Topics in this Section:
Projections and Their Parameters . . . . . . . . . . . . . . . . . . . . . . . .452
Projection Datums . . . . . . . . . . . . . . . . . . . . . . . . . . . . . . . . . . . . .456
For More Information on Projections . . . . . . . . . . . . . . . . . . . . . .472
B
Chapter B: Elements of a Coordinate System
Projections and Their Parameters
Projections and Their Parameters
X
Azimuthal Equidistant 28
X
X
X
X*
X
Azimuthal Equidistant 5
(polar aspect only)
X
X
X
X
X
X
X
X
X
Cylindrical Equal Area 2
X
X
X
Double Stereographic 31
X
X
X
Eckert IV 14
X
X
X
Eckert VI 15
X
X
X
X
X
X
Equidistant Cylindrical 33
X
X
X
Gall 17
X
X
X
Hotine Oblique Mercator 7
X
X
X
X
Krovak Oblique Conformal 32
Conic (JTSKc)
X
X
X
X
Lambert Azimuthal Equal-Area 29
X
X
X
X†
X
Lambert Azimuthal Equal-Area 4
(polar aspect only)
X
X
X
X†
X
Lambert Conformal Conic 3
X
X
X
X
Cassini-Soldner 30
Equidistant Conic 6
MapInfo Professional 10.5
452
X
X
X
X
X
X
X
X
X
X
X
X
X
X
Range
Standard Parallel 2
X
False Northing
Standard Parallel 1
X
False Easting
Origin, Latitude
X
Scale Factor
Origin, Longitude
X
Albers Equal-Area Conic 9
Azimuth
Units
X
Projection Name
Projection Type
Datum
The next table indicates the parameters applicable to each projection, which are listed in the order
they appear in the relevant coordinate system lines in the MAPINFOW.PRJ file. The projection type
is the equation or equations used by a coordinate system. The following list names the projections
MapInfo uses and gives the number used to identify the projection in the MAPINFOW.PRJ file:
X
X
X
X
X
X
X
X
X
X
X
X
X
X
X
User Guide
Longitude-Latitude 1
X
X
X
X
X
Mercator 10
X
X
X
Miller 11
X
X
X
Mollweide 13
X
X
X
New Zealand Map Grid 18
X
X
X
X
X
X
Polyconic 27
X
X
X
X
X
X
Regional Mercator 26
X
X
X
Robinson 12
X
X
X
Sinusoidal 16
X
X
X
Stereographic 20
X
X
X
X
X
X
Swiss Oblique Mercator 25
X
X
X
X
X
X
X
X
X
X
X
X
X
Tranverse Mercator, (Modified 21
for Danish System 34
Jylland-Fyn)
X
X
X
X
X
X
X
Tranverse Mercator, (Modified 22
for Danish System 34 Sjaelland)
X
X
X
X
X
X
X
Tranverse Mercator, (Modified 23
for Danish System 34 /45
Bornholm)
X
X
X
X
X
X
X
Tranverse Mercator, 24
(Modified for Finnish KKJ)
X
X
X
X
X
X
X
Transverse Mercator 8
MapInfo Professional 10.5
Range
Standard Parallel 2
X
False Northing
Standard Parallel 1
X
False Easting
Origin, Latitude
X
Scale Factor
Origin, Longitude
X
Azimuth
Units
Lambert Conformal Conic 19
(Modified for Belgium 1972)
Datum
Projection Name
Projection Type
Chapter B: Elements of a Coordinate System
Projections and Their Parameters
453
X
X
User Guide
Chapter B: Elements of a Coordinate System
Projections and Their Parameters
The Origin Latitude for the Azimuthal Equidistant projections must be either 90 or -90. An Oblique
Azimuthal Equidistant projection supports all Origin Latitudes, including the poles. A Lambert
Azimuthal Equal-Area projection has been added that also supports all Origin Latitudes, including
the poles.
Projection Types
The projection type is the equation or equations used by a coordinate system. The following list
names the projections MapInfo uses and gives the number used to identify the projection in the
MAPINFOW.PRJ file:
Number
Projection Type
9
Albers Equal-Area Conic
28
Azimuthal Equidistant (all origin latitudes)
5
Azimuthal Equidistant (polar aspect only)
30
Cassini-Soldner
2
Cylindrical Equal-Area
31
Double Stereographic
14
Eckert IV
15
Eckert VI
6
Equidistant Conic, also known as Simple Conic
33
Equidistant Cylindrical
17
Gall
7
Hotine Oblique Mercator
32
Krovak Oblique Conformal Conic (JTSKc)
4
Lambert Azimuthal Equal-Area (polar aspect only)
29
Lambert Azimuthal Equal-Area
3
Lambert Conformal Conic
19
Lambert Conformal Conic (modified for Belgium 1972)
1
Longitude/Latitude
10
Mercator
MapInfo Professional 10.5
454
User Guide
Chapter B: Elements of a Coordinate System
Projections and Their Parameters
Number
Projection Type
11
Miller Cylindrical
13
Mollweide
18
New Zealand Map Grid
27
Polyconic
26
Regional Mercator
12
Robinson
16
Sinusoidal
20
Stereographic
25
Swiss Oblique Mercator
8
Transverse Mercator, (also known as Gauss-Kruger)
21
Transverse Mercator, (modified for Danish System 34 Jylland-Fyn)
22
Transverse Mercator, (modified for Danish System 34 Sjaelland)
23
Transverse Mercator, (modified for Danish System 34/45 Bornholm)
24
Transverse Mercator, (modified for Finnish KKJ)
Projection numbers in the MAPINFOW.PRJ may be modified by the addition of a constant value to
the base number listed in the Projection table, above. Valid values and their meanings are in the
next table:
Constant
Meaning
Parameters
1000
System has affine transformations
Affine units specifier and coefficients appear
after the regular parameters for the system.
2000
System has explicit bounds
Bounds appear after the regular parameters
for the system.
3000
System with both affine and bounds
Affine parameters follow system’s
parameters; bounds follow affine parameters.
Example:
MapInfo Professional 10.5
455
User Guide
Chapter B: Elements of a Coordinate System
Projections and Their Parameters
Assume you want to work with a simple system based on the Transverse Mercator projection and
using the NAD 1983 datum. You might have a line such as the following in your MAPINFOW.PRJ
file:
"UTM Zone 1 (NAD 83)", 8, 74, 7, -177, 0, 0.9996, 500000, 0
Now let’s say that you want a system based on this, but with an affine transformation specified by
the following parameters (see Affine Transformations in the Help System: Units=meters; A=0.5; B=0.866; C=0; D=0.866; E=0.5; and F=0. The required line in the MAPINFOW.PRJ file is:
"UTM Zone 1 (NAD 83) - rotated 60 degrees", 1008, 74, 7, -177, 0, 0.9996, 500000, 0, 7, 0.5, 0.866, 0, 0.866, 0.5, 0
Alternatively, if you want to bound the system to (x1, y1, x2, y2)=(-500000, 0, 500000, 1000000), the
required line is:
"UTM Zone 1 (NAD 83) - bounded", 2008, 74, 7, -177, 0, 0.9996, 500000, 0, -500000, 0, 500000,
1000000
To customize the system using both of these modifications, the line is:
"UTM Zone 1 (NAD 83) - rotated and bounded", 3008, 74, 7, -177, 0, 0.9996, 500000, 0, 7, 0.5, 0.866, 0, 0.866, 0.5, 0, -500000, 0, 500000, 1000000
Projection Datums
The datum is established by tying a reference ellipsoid to a particular point on the earth. The
following table lists these details for each datum. More specific datum information is available in
Basic and Custom Datums in the Help System.
•
•
•
•
The number used to identify the datum in the MAPINFOW.PRJ file.
The datum’s name
The maps for which the datum is typically used
The datum’s reference ellipsoid
Number
Datum Name
Area of Coverage
Ellipsoid
1
Adindan
Ethiopia, Mali, Senegal, Sudan
Clarke 1880
2
Afgooye
Somalia
Krassovsky
1007
AGD 66, 7 parameter
Australia, A.C.T.
Australian National
1008
AGD 66, 7 parameter
Australia, Tasmania
Australian National
1009
AGD 66, 7 parameter
Australia, Victoria/NSW
Australian National
1006
AGD 84, 7 parameter
Australia
Australian National
3
Ain el Abd 1970
Bahrain Island
International
118
American Samoa
American Samoa Islands
Clarke 1866
MapInfo Professional 10.5
456
User Guide
Chapter B: Elements of a Coordinate System
Projections and Their Parameters
Number
Datum Name
Area of Coverage
Ellipsoid
4
Anna 1 Astro 1965
Cocos Islands
Australian National
119
Antigua Island Astro 1943
Antigua, Leeward Islands
Clarke 1880
5
Arc 1950
Botswana, Lesotho, Malawi,
Clarke 1880
Swaziland, Zaire, Zambia, Zimbabwe
6
Arc 1960
Kenya, Tanzania
Clarke 1880
7
Ascension Island 1958
Ascension Island
International
9
Astro B4 Sorol Atoll
Tern Island
International
8
Astro Beacon “E”
Iwo Jima Island
International
10
Astro DOS 71/4
St. Helena Island
International
11
Astronomic Station 1952
Marcus Island
International
12
Australian Geodetic 1966 (AGD
66)
Australia and Tasmania Island
Australian National
13
Australian Geodetic 1984 (AGD
84)
Australia and Tasmania Island
Australian National
120
Ayabelle Lighthouse
Djibouti
Clarke 1880
154
Beijing 1954
China
Krassovsky (#3)
1019
Belgian 1972 (7 parameters)
Belgium
International 1924
110
Belgium
Belgium
International
14
Bellevue (IGN)
Efate and Erromango Islands
International
15
Bermuda 1957
Bermuda Islands
Clarke 1866
16
Bogota Observatory
Colombia
International
121
Bukit Rimpah
Bangka and Belitung Islands
(Indonesia)
Bessel 1841
17
Campo Inchauspe
Argentina
International
18
Canton Astro 1966
Phoenix Islands
International
19
Cape
South Africa
Clarke 1880
20
Cape Canaveral
Florida and Bahama Islands
Clarke 1866
1005
Cape, 7 parameter
South Africa
WGS 84
MapInfo Professional 10.5
457
User Guide
Chapter B: Elements of a Coordinate System
Projections and Their Parameters
Number
Datum Name
Area of Coverage
Ellipsoid
21
Carthage
Tunisia
Clarke 1880
22
Chatham 1971
Chatham Island (New Zealand)
International
23
Chua Astro
Paraguay
International
122
Coordinate System 1937 of
Estonia
Estonia
Bessel 1841
24
Corrego Alegre
Brazil
International
123
Dabola
Guinea
Clarke 1880
156
Dealul Piscului 1970
Romania
Krassovsky
124
Deception Island
Deception Island, Antarctica
Clarke 1880
1000
Deutsches Hauptdreicksnetz
(DHDN) Potsdam/Rauenberg
Germany
Bessel
25
Djakarta (Batavia)
Sumatra Island (Indonesia)
Bessel 1841
26
DOS 1968
Gizo Island (New Georgia Islands)
International
27
Easter Island 1967
Easter Island
International
115
EUREF 89
Europe
GRS 80
28
European 1950 (ED 50)
Austria, Belgium, Denmark, Finland,
France, Germany, Gibraltar, Greece,
Italy, Luxembourg, Netherlands,
Norway, Portugal, Spain, Sweden,
Switzerland
International
29
European 1979 (ED 79)
Austria, Finland, Netherlands,
Norway, Spain, Sweden, Switzerland
International
108
European 1987 (ED 87)
Europe
International
125
Fort Thomas 1955
Nevis, St. Kitts, Leeward Islands
Clarke 1880
30
Gandajika Base
Republic of Maldives
International
116
GDA 94
Australia
GRS 80
32
Geodetic Reference System
1967 (GRS 67)
Worldwide
GRS 67
33
Geodetic Reference System
1980 (GRS 80)
Worldwide
GRS 80
MapInfo Professional 10.5
458
User Guide
Chapter B: Elements of a Coordinate System
Projections and Their Parameters
Number
Datum Name
Area of Coverage
Ellipsoid
126
Graciosa Base SW 1948
Faial, Graciosa, Pico, Sao Jorge, and
Terceira Islands (Azores)
International 1924
34
Guam 1963
Guam Island
Clarke 1866
35
GUX 1 Astro
Guadalcanal Island
International
150
Hartbeesthoek 94
South Africa
WGS 84
127
Herat North
Afghanistan
International 1924
128
Hermannskogel
Yugoslavia (Prior to 1990), Slovenia,
Croatia, Bosnia and Herzegovina,
Serbia
Bessel 1841
153
HGRS87
36
Hito XVIII 1963
South Chile (near 53°S)
International
37
Hjorsey 1955
Iceland
International
38
Hong Kong 1963
Hong Kong
International
1004
Hungarian Datum of 1972 (HD
72)
Hungary
GRS 80
39
Hu-Tzu-Shan
Taiwan
International
40
Indian
Thailand and Vietnam
Everest (India 1830)
41
Indian
Bangladesh, India, Nepal
Everest (India 1830)
129
Indian
Pakistan
Everest (Pakistan)
130
Indian 1954
Thailand
Everest (India 1830)
131
Indian 1960
Vietnam
Everest (India 1830)
132
Indian 1975
Thailand
Everest (India 1830)
133
Indonesian 1974
Indonesia
Indonesian 1974
42
Ireland 1965
Ireland
Modified Airy
134
ISTS 061 Astro 1968
South Georgia Island
International 1924
43
ISTS 073 Astro 1969
Diego Garcia
International
152
JGD2000
Japan
Bessel 1841
44
Johnston Island 1961
Johnston Island
International
MapInfo Professional 10.5
GRS80 (#0)
459
User Guide
Chapter B: Elements of a Coordinate System
Projections and Their Parameters
Number
Datum Name
Area of Coverage
Ellipsoid
45
Kandawala
Sri Lanka
Everest (India 1830)
46
Kerguelen Island
Kerguelen Island
International
47
Kertau 1948
West Malaysia and Singapore
Everest (W.
Malaysia and
Singapore 1948)
1016
KKJ
Finland
International
135
Kusaie Astro 1951
Caroline Islands, Federated States of
Micronesia
International 1924
48
L.C. 5 Astro
Cayman Brac Island
Clarke 1866
136
Leigon
Ghana
Clarke 1880
49
Liberia 1964
Liberia
Clarke 1880
155
Libya (LGD 2006)
Libya
International
113
Lisboa (DLx)
Portugal
International
1018
Lithuanian Pulkovo 1942
Latvia, Lithuania
Krassovsky (#3)
50
Luzon
Philippines (excluding Mindanao
Island)
Clarke 1866
51
Luzon
Mindanao Island
Clarke 1866
138
M’Poraloko
Gabon
Clarke 1880
52
Mahe 1971
Mahe Island
Clarke 1880
53
Marco Astro
Salvage Islands
International
54
Massawa
Eritrea (Ethiopia)
Bessel 1841
114
Melrica 1973 (D73)
Portugal
International
55
Merchich
Morocco
Clarke 1880
56
Midway Astro 1961
Midway Island
International
57
Minna
Nigeria
Clarke 1880
137
Montserrat Island Astro 1958
Montserrat, Leeward Islands
Clarke 1880
58
Nahrwan
Masirah Island (Oman)
Clarke 1880
59
Nahrwan
United Arab Emirates
Clarke 1880
MapInfo Professional 10.5
460
User Guide
Chapter B: Elements of a Coordinate System
Projections and Their Parameters
Number
Datum Name
Area of Coverage
Ellipsoid
60
Nahrwan
Saudi Arabia
Clarke 1880
61
Naparima, BWI
Trinidad and Tobago
International
109
Netherlands
Netherlands
Bessel
1010
New Zealand Geodetic Datum
194, 7 parameter
New Zealand
International
31
New Zealand Geodetic Datum
1949 (NZGD 49)
New Zealand
International
62
North American 1927 (NAD 27)
Continental U.S.
Clarke 1866
63
North American 1927 (NAD 27)
Alaska
Clarke 1866
64
North American 1927 (NAD 27)
Bahamas (excluding San Salvador
Island)
Clarke 1866
65
North American 1927 (NAD 27)
San Salvador Island
Clarke 1866
66
North American 1927 (NAD 27)
Canada (including Newfoundland
Island)
Clarke 1866
67
North American 1927 (NAD 27)
Canal Zone
Clarke 1866
68
North American 1927 (NAD 27)
Caribbean (Turks and Caicos
Islands)
Clarke 1866
69
North American 1927 (NAD 27)
Central America (Belize, Costa Rica,
El Salvador, Guatemala, Honduras,
Nicaragua)
Clarke 1866
70
North American 1927 (NAD 27)
Cuba
Clarke 1866
71
North American 1927 (NAD 27)
Greenland (Hayes Peninsula)
Clarke 1866
72
North American 1927 (NAD 27)
Mexico
Clarke 1866
73
North American 1927 (NAD 27)
Michigan (used only for State Plane
Coordinate System 1927)
Modified Clarke
1866
74
North American 1983 (NAD 83)
Alaska, Canada, Central America,
Continental U.S., Mexico
GRS 80
139
North Sahara 1959
Algeria
Clarke 1880
107
Nouvelle Triangulation Francaise France
(NTF) Greenwich Prime Meridian
MapInfo Professional 10.5
461
Modified Clarke
1880
User Guide
Chapter B: Elements of a Coordinate System
Projections and Their Parameters
Number
Datum Name
Area of Coverage
Ellipsoid
1002
Nouvelle Triangulation Francaise
(NTF) Paris Prime Meridian
France
Modified Clarke
1880
111
NWGL 10
Worldwide
WGS 72
117
NZGD 2000
New Zealand
GRS 80
140
Observatorio Meteorologico
1939
Corvo and Flores Islands (Azores)
International 1924
75
Observatorio 1966
Corvo and Flores Islands (Azores)
International
76
Old Egyptian
Egypt
Helmert 1906
77
Old Hawaiian
Hawaii
Clarke 1866
78
Oman
Oman
Clarke 1880
79
Ordnance Survey of Great
Britain 1936
England, Isle of Man, Scotland,
Shetland Islands, Wales
Airy
80
Pico de las Nieves
Canary Islands
International
81
Pitcairn Astro 1967
Pitcairn Island
International
141
Point 58
Burkina Faso and Niger
Clarke 1880
142
Pointe Noire 1948
Congo
Clarke 1880
157
Popular Visualization CRS /
Mercator
Worldwide
WGS 84 Sphere
143
Porto Santo 1936
Porto Santo and Madeiras Islands
International 1924
1000
Potsdam
Germany
Bessel
82
Provisional South American
1956
Bolivia, Chile, Colombia, Ecuador,
Guyana, Peru, Venezuela
International
Provisional South Chilean 1963
South Chile (near 53°S)
International
83
Puerto Rico
Puerto Rico and Virgin Islands
Clarke 1866
1001
Pulkovo 1942
Germany
Krassovsky
84
Qatar National
Qatar
International
85
Qornoq
South Greenland
International
1000
Rauenberg
Germany
Bessel
MapInfo Professional 10.5
462
User Guide
Chapter B: Elements of a Coordinate System
Projections and Their Parameters
Number
Datum Name
Area of Coverage
Ellipsoid
86
Reunion
Mascarene Island
International
112
Rikets Triangulering 1990 (RT
90)
Sweden
Bessel
1011
Rikets Triangulering 1990 (RT
90), 7 parameter
Sweden
Bessel
87
Rome 1940
Sardinia Island
International
1012
Russia PZ90
Russia
PZ90
1012
Russia PZ90
Russia
PZ90
1013
Russia SK42
Russia
SK95
1014
Russia SK95
Russia
PZ90
88
Santo (DOS)
Espirito Santo Island
International
89
São Braz
São Miguel, Santa Maria Islands
(Azores)
International
90
Sapper Hill 1943
East Falkland Island
International
91
Schwarzeck
Namibia
Modified Bessel
1841
144
Selvagem Grande 1938
Salvage Islands
International 1924
145
Sierra Leone 1960
Sierra Leone
Clarke 1880
146
S-JTSK
Czech Republic
Bessel 1841
1020
S-JTSK (Ferro prime meridian)
Czech Republic
Bessel #11
92
South American 1969
Argentina, Bolivia, Brazil, Chile,
Colombia, Ecuador, Guyana,
Paraguay, Peru, Venezuela, Trinidad
and Tobago
South American
1969
93
South Asia
Singapore
Modified Fischer
1960
94
Southeast Base
Porto Santo and Madeira Islands
International
95
Southwest Base
Faial, Graciosa, Pico, Sao Jorge,
Terceira Islands (Azores)
International
1003
Switzerland (CH 1903)
Switzerland
Bessel
MapInfo Professional 10.5
463
User Guide
Chapter B: Elements of a Coordinate System
Projections and Their Parameters
Number
Datum Name
Area of Coverage
Ellipsoid
147
Tananarive Observatory 1925
Madagascar
International 1924
96
Timbalai 1948
Brunei and East Malaysia (Sarawak
and Sabah)
Everest (India 1830)
97
Tokyo
Japan, Korea, Okinawa
Bessel 1841
1015
Tokyo97
Japan
Bessel 1841
98
Tristan Astro 1968
Tristan da Cunha
International
99
Viti Levu 1916
Viti Levu Island (Fiji Islands)
Clarke 1880
148
Voirol 1874
Tunisia/Algeria
Clarke 1880
149
Voirol 1960
Algeria
Clarke 1880
100
Wake-Eniwetok 1960
Marshall Islands
Hough
101
World Geodetic System 1960
(WGS 60)
Worldwide
WGS 60
102
World Geodetic System 1966
(WGS 66)
Worldwide
WGS 66
103
World Geodetic System 1972
(WGS 72)
Worldwide
WGS 72
104
World Geodetic System 1984
(WGS 84)
Worldwide
WGS 84
1017
Xian
China
1980
105
Yacare
Uruguay
International
106
Zanderij
Surinam
International
Units
The following table lists the available coordinate units and the number used to identify the unit in the
MAPINFOW.PRJ file:
Number
Units
6
Centimeters
31
Chains
MapInfo Professional 10.5
464
User Guide
Chapter B: Elements of a Coordinate System
Projections and Their Parameters
Number
Units
3
Feet (also called International Feet)*
2
Inches
1
Kilometers
30
Links
7
Meters
0
Miles
5
Millimeters
9
Nautical Miles†
32
Rods
8
US Survey Feet (used for 1927 State Plane)‡
4
Yards
*
One International Foot equals exactly 30.48 cm.
†
One Nautical Mile equals exactly 1852 meters.
‡
One US Survey Foot equals exactly 12/39.37 meters, or approximately
30.48006 cm.
Coordinate System Origin
The origin is the point specified in longitude and latitude from which all coordinates are referenced. It
is chosen to optimize the accuracy of a particular coordinate system. As we move north from the
origin, Y increases. X increases as we move east. These coordinate values are generally called
northings and eastings.
For the Transverse Mercator projection the origin’s longitude defines the central meridian. In
constructing the Transverse Mercator projection a cylinder is positioned tangent to the earth. The
central meridian is the line of tangency. The scale of the projected map is true along the central
meridian.
In creating a Hotine Oblique Mercator projection it is necessary to specify a great circle that is not
the equator nor a meridian. MapInfo Professional does this by specifying one point on the ellipsoid
and an azimuth from that point. That point is the origin of the coordinate system.
MapInfo Professional 10.5
465
User Guide
Chapter B: Elements of a Coordinate System
Projections and Their Parameters
Standard Parallels (Conic Projections)
In conic projections a cone is passed through the earth intersecting it along two parallels of latitude.
These are the standard parallels. One is to the north and one is to the south of the projection zone.
To use a single standard parallel specify that latitude twice. Both are expressed in degrees of
latitude.
Oblique Azimuth (Hotine Oblique Mercator)
When specifying a great circle (Hotine Oblique Mercator) using a point and an azimuth (arc), the
azimuth is called the Oblique Azimuth and is expressed in degrees.
Scale Factor (Transverse Mercator)
A scale factor is applied to cylindrical coordinates to average scale error over the central area of the
map while reducing the error along the east and west boundaries. The scale factor has the effect of
recessing the cylinder into the earth so that it has two lines of intersection. Scale is true along these
lines of intersection.
You may see the scale factor expressed as a ratio, such as 1:25000. In this case it is generally
called the scale reduction. The relationship between scale factor and scale reduction is:
scale factor = 1-scale reduction
In this case the scale factor would be 1-(1/25000) or 0.99996.
False Northings and False Eastings
Calculating coordinates is easier if negative numbers aren’t involved. To eliminate this problem in
calculating State Plane and Universal Transverse Mercator coordinates, it is common to add
measurement offsets to the northings and eastings. These offsets are called False Northings and
False Eastings. They are expressed in coordinate units, not degrees. (The coordinate units are
specified by the Units parameter.)
Range (Azimuthal Projections)
The range specifies, in degrees, how much of the earth you are seeing. The range can be between
1 and 180. When you specify 90, you see a hemisphere. When you specify 180 you see the whole
earth, though much of it is very distorted.
MapInfo Professional 10.5
466
User Guide
Chapter B: Elements of a Coordinate System
Coordinate System Enhancements by Version
Polyconic Projection
The following description is copied from “Map Projections – A Working Manual”, USGS Professional
Paper 1395, by John P. Snyder.
The Polyconic projection, usually called the American Polyconic in Europe, achieved its name
because the curvature of the circular arc for each parallel on the map is the same as it would be
following the unrolling of a cone which had been wrapped around the globe tangent to the particular
parallel of latitude, with the parallel traced onto the cone. Thus, there are many (”poly-”) cones
involved, rather than the single cone of each regular conic projection.
The Polyconic projection is neither equal-area nor conformal. Along the central meridian, however, it
is both distortion free and true to scale. Each parallel is true to scale, but the meridians are
lengthened by various amounts to cross each parallel at the correct position along the parallel, so
that no parallel is standard in the sense of having conformality (or correct angles), except at the
central meridian. Near the central meridian, distortion is extremely small.
This projection is not intended for mapping large areas. The conversion algorithms used break down
when mapping wide longitude ranges. For example, WORLD.TAB, from the sample data shipped
with MapInfo Professional, may exhibit anomalies if reprojected using Polyconic.
Equidistant Cylindrical Projection
The Equidistant Cylindrical projection (also called the Equirectangular projection, geographic
projection, Plate Carrée, or Carte Parallelogrammatique projection or CPP), is a very simple map
projection attributed to Marinus of Tyre, who Ptolemy claims invented the projection about 100 AD.
The projection maps meridians to equally spaced vertical straight lines, and circles of latitude to
evenly spread horizontal straight lines. The projection is neither equal area nor conformal. Because
of the distortions introduced by this projection, it has little use in navigation or cadastral mapping,
and finds its main use in thematic mapping. In particular, the Plate Carrée is used often in computer
applications that process global maps, because of the particularly simple relationship between the
position of an image pixel on the map and its corresponding geographic location on Earth. The Plate
Carrée (French, for "flat square"), is the special case where standard parallel is zero.
The following examples are of PRJ entries for Plate Carrée and Equidistant Cylindrical projection
centered at 46.5 degree Standard Parallel (used in France):
"Plate Carree WGS84", 33, 104, 7, 0, 0, 0, 0
"Equidistant Cylindrical 46.5 Degree WGS84", 33, 104, 7, 0, 46.5, 0, 0
Coordinate System Enhancements by Version
This section describes the coordinate system enhancements by product version. The
MAPINFOW.PRJ file has been updated to support these changes. The datum details of these
systems have been added to the Basic Datums in the Help System.
MapInfo Professional 10.5
467
User Guide
Chapter B: Elements of a Coordinate System
Coordinate System Enhancements by Version
Coordinate System and Datum Additions for MapInfo Professional 10.5
Australian Coordinate Systems
We have added new Australian coordinate systems:
•
•
"Longitude / Latitude (Victoria GDA94)", 2001, 116, 132, -26.8, 154, -43.8
"SA - Lambert Conformal Conic (GDA94)", 3, 116, 7, 135, -32, -28, -36, 1000000, 2000000
Danish Coordinate Systems
We have updated and added Danish coordinate systems:
•
•
•
•
•
•
•
•
•
•
•
•
•
•
"UTM Zone 32 Euref89\p25832", 8, 115, 7, 9.0, 0, 0.9996, 500000, 0
"UTM Zone 33 Euref89\p25833", 8, 115, 7, 15.0, 0, 0.9996, 500000, 0
"DKTM1 - Western Jylland\p4093", 8, 115, 7, 9, 0, 0.99998, 200000, 5000000
"DKTM2 - Eastern Jylland and Fyn\p4094", 8, 115, 7, 10, 0, 0.99998, 400000, 5000000
"DKTM3 - Sjaelland\p4095", 8, 115, 7, 11.75, 0, 0.99998, 600000, 5000000
"DKTM4 - Bornholm\p4096", 8, 115, 7, 15, 0, 1.00000, 800000, 5000000
"KP2000 Jylland-Fyn\p18401", 8, 115, 7, 9.5, 0, 0.99995, 200000, 0
"KP2000 Sjaelland\p18402", 8, 115, 7, 12.0, 0, 0.99995, 500000, 0
"KP2000 Bornholm\p18403", 8, 115, 7, 15.0, 0, 1.00000, 900000, 0
"UTM Zone 32 (ED 50)\p23032", 8, 28, 7, 9, 0, 0.9996, 500000, 0
"UTM Zone 33 (ED 50)\p23033", 8, 28, 7, 15, 0, 0.9996, 500000, 0
"System 34 Jylland-Fyn\p34003", 21, 28, 7, 9, 0, 0.9996, 500000, 0
"System 34 Sjaelland\p34005", 22, 28, 7, 9, 0, 0.9996, 500000, 0
"System 45 Bornholm\p45001", 23, 28, 7, 15, 0, 0.9996, 500000, 0
Danish Bounded Coordinate Systems
• "Bounded UTM Zone 32 ETRS89\p25832", 2008, 115, 7, 9.0, 0, 0.9996, 500000, 0, 50000.0,
5750000.0, 1050000.0, 6750000.0
• "Bounded UTM Zone 33 ETRS89\p25833", 2008, 115, 7, 15.0, 0, 0.9996, 500000, 0, -200000.0,
5750000.0, 800000.0, 6750000.0
• "Bounded DKTM1 - Western Jylland\p4093", 2008, 115, 7, 9, 0, 0.99998, 200000, 5000000, 0,
750000, 1000000, 1750000
• "Bounded DKTM2 - Eastern Jylland and Fyn\p4094", 2008, 115, 7, 10, 0, 0.99998, 400000,
5000000, 0, 750000, 1000000, 1750000
• "Bounded DKTM3 - Sjaelland\p4095", 2008, 115, 7, 11.75, 0, 0.99998, 600000, 5000000, 0,
750000, 1000000, 1750000
• "Bounded DKTM4 - Bornholm\p4096", 2008, 115, 7, 15, 0, 1.00000, 800000, 5000000, 0,
750000, 1000000, 1750000
• "Bounded KP2000 Jylland-Fyn\p18401", 2008, 115, 7, 9.5, 0, 0.99995, 200000, 0, -200000.0,
5750000.0, 800000.0, 6750000.0
• "Bounded KP2000 Sjaelland\p18402", 2008, 115, 7, 12.0, 0, 0.99995, 500000, 0, -200000.0,
5750000.0, 800000.0, 6750000.0
• "Bounded KP2000 Bornholm\p18403", 2008, 115, 7, 15.0, 0, 1.00000, 900000, 0, -200000.0,
5750000.0, 800000.0, 6750000.0
MapInfo Professional 10.5
468
User Guide
Chapter B: Elements of a Coordinate System
Coordinate System Enhancements by Version
•
•
•
•
•
"Bounded UTM Zone 32 (ED 50)\p23032", 2008, 28, 7, 9, 0, 0.9996, 500000, 0, 50000.0,
5750000.0, 1050000.0, 6750000.0,
"Bounded UTM Zone 33 (ED 50)\p23033", 2008, 28, 7, 15, 0, 0.9996, 500000, 0, -200000.0,
5750000.0, 800000.0, 6750000.0
"Bounded System 34 Jylland-Fyn\p34003", 2021, 28, 7, 9, 0, 0.9996, 500000, 0, -700000.0, 300000, 300000, 700000
"Bounded System 34 Sjaelland\p34005", 2022, 28, 7, 9, 0, 0.9996, 500000, 0, -700000.0, 300000, 300000, 700000
"Bounded System 45 Bornholm\p45001", 2023, 28, 7, 15, 0, 0.9996, 500000, 0, -700000.0, 300000, 300000, 700000
European Projection
We have added a new European projection system:
•
"Longitude / Latitude (EUREF89)\p4258",1, 115
French Coordinate System
We have added a new French coordinate system:
•
"Longitude / Latitude (RGF93)\p4171", 1, 33
Finnish Coordinate Systems
We have added new Finnish coordinate systems:
•
•
"Finnish KKJ Zone 0\p3386", 2024, 1016, 7, 18, 0, 1, 500000, 0, 0, 6000000, 1500000, 8000000
"Finnish KKJ Zone 5\p3387", 2024, 1016, 7, 33, 0, 1, 5500000, 0, 4000000, 6000000, 6000000,
8000000
ETRS-GK(ETRS89)
• "ETRS-GK19FIN (ETRS89)\p3126", 2008, 115, 7, 19, 0, 1, 19500000, 0, 19200000, 6500000,
19800000, 8000000
• "ETRS-GK20FIN (ETRS89)\p3127", 2008, 115, 7, 20, 0, 1, 20500000, 0, 20200000, 6500000,
20800000, 8000000
• "ETRS-GK21FIN (ETRS89)\p3128", 2008, 115, 7, 21, 0, 1, 21500000, 0, 21200000, 6500000,
21800000, 8000000
• "ETRS-GK22FIN (ETRS89)\p3129", 2008, 115, 7, 22, 0, 1, 22500000, 0, 22200000, 6500000,
22800000, 8000000
• "ETRS-GK23FIN (ETRS89)\p3130", 2008, 115, 7, 23, 0, 1, 23500000, 0, 23200000, 6500000,
23800000, 8000000
• "ETRS-GK24FIN (ETRS89)\p3131", 2008, 115, 7, 24, 0, 1, 24500000, 0, 24200000, 6500000,
24800000, 8000000
• "ETRS-GK25FIN (ETRS89)\p3132", 2008, 115, 7, 25, 0, 1, 25500000, 0, 25200000, 6500000,
25800000, 8000000
• "ETRS-GK26FIN (ETRS89)\p3133", 2008, 115, 7, 26, 0, 1, 26500000, 0, 26200000, 6500000,
26800000, 8000000
• "ETRS-GK27FIN (ETRS89)\p3134", 2008, 115, 7, 27, 0, 1, 27500000, 0, 27200000, 6500000,
27800000, 8000000
MapInfo Professional 10.5
469
User Guide
Chapter B: Elements of a Coordinate System
Coordinate System Enhancements by Version
•
•
•
•
"ETRS-GK28FIN (ETRS89)\p3135", 2008, 115, 7, 28, 0, 1, 28500000, 0, 28200000, 6500000,
28800000, 8000000
"ETRS-GK29FIN (ETRS89)\p3136", 2008, 115, 7, 29, 0, 1, 29500000, 0, 29200000, 6500000,
29800000, 8000000
"ETRS-GK30FIN (ETRS89)\p3137", 2008, 115, 7, 30, 0, 1, 30500000, 0, 30200000, 6500000,
30800000, 8000000
"ETRS-GK31FIN (ETRS89)\p3138", 2008, 115, 7, 31, 0, 1, 31500000, 0, 31200000, 6500000,
31800000, 8000000
Gauss-Kruger
• "ETRS-GK19FIN", 2024, 115, 7, 19, 0, 1.0, 19500000, 0, 19000000, 6000000, 19999999,
8000000
• "ETRS-GK20FIN", 2024, 115, 7, 20, 0, 1.0, 20500000, 0, 20000000, 6000000, 20999999,
8000000
• "ETRS-GK21FIN", 2024, 115, 7, 21, 0, 1.0, 21500000, 0, 21000000, 6000000, 21999999,
8000000
• "ETRS-GK22FIN", 2024, 115, 7, 22, 0, 1.0, 22500000, 0, 22000000, 6000000, 22999999,
8000000
• "ETRS-GK23FIN", 2024, 115, 7, 23, 0, 1.0, 23500000, 0, 23000000, 6000000, 23999999,
8000000
• "ETRS-GK24FIN", 2024, 115, 7, 24, 0, 1.0, 24500000, 0, 24000000, 6000000, 24999999,
8000000
• "ETRS-GK25FIN", 2024, 115, 7, 25, 0, 1.0, 25500000, 0, 25000000, 6000000, 25999999,
8000000
• "ETRS-GK26FIN", 2024, 115, 7, 26, 0, 1.0, 26500000, 0, 26000000, 6000000, 26999999,
8000000
• "ETRS-GK27FIN", 2024, 115, 7, 27, 0, 1.0, 27500000, 0, 27000000, 6000000, 27999999,
8000000
• "ETRS-GK28FIN", 2024, 115, 7, 28, 0, 1.0, 28500000, 0, 28000000, 6000000, 28999999,
8000000
• "ETRS-GK29FIN", 2024, 115, 7, 29, 0, 1.0, 29500000, 0, 29000000, 6000000, 29999999,
8000000
• "ETRS-GK30FIN", 2024, 115, 7, 30, 0, 1.0, 30500000, 0, 30000000, 6000000, 30999999,
8000000
• "ETRS-GK31FIN", 2024, 115, 7, 31, 0, 1.0, 31500000, 0, 31000000, 6000000, 31999999,
8000000
UTM
• "ETRS-TM34", 2024, 115, 7, 21, 0, 0.9996, 500000, 0, 0, 0, 1500000, 8000000
• "ETRS-TM35", 2024, 115, 7, 27, 0, 0.9996, 500000, 0, 0, 0, 1500000, 8000000
• "ETRS-TM36", 2024, 115, 7, 33, 0, 0.9996, 500000, 0, 0, 0, 1500000, 8000000
• "ETRS-TM35FIN", 8, 115, 7, 27, 0, 0.9996, 500000, 0
• "ETRS-TM35FIN (central meridian 8500 km)", 8, 115, 7, 27, 0, 0.9996, 8500000, 0
• "ETRS-TM35FIN\p3067", 2008, 115, 7, 27, 0, 0.9996, 500000, 0 , -100000, 6000000, 1000000,
8000000
MapInfo Professional 10.5
470
User Guide
Chapter B: Elements of a Coordinate System
Coordinate System Enhancements by Version
Morocco Coordinate Systems
New coordinate systems for Morocco:
Lambert Maroc (Merchich)
• "Zone I (Nord Maroc)\p26191", 3, 55, 7, -5.4, 33.3, 31.72786641202, 34.8717272112, 500000,
300000
• "Zone II (Agadir)\p26192", 3, 55, 7, -5.4, 29.7, 28.1063294800, 31.2932791054, 500000,
300000
• "Zone III (La'youn)\p26194", 3, 55, 7, -5.4, 26.1, 24.5075340813, 27.6921073632, 1200000,
400000
• "Zone IV (Ad-Dakhla)\p26195", 3, 55, 7, -5.4, 22.5, 20.9075742561, 24.0921050540, 1500000,
400000
Slovenian Projections
We have added new Slovenian projections:
•
•
"Slovenia (D-48 Slovenia) 3-parameters", 8, 999, 10, 668, -205, 472, 7, 15, 0, 0.9999, 500000, 5000000
"Slovenia (D-48 Slovenia) 7-parameters", 8, 9999, 10, 438.7669, 126.6093, 457.938, -4.323931,
-4.1076, 12.245081, -16.5199, 0, 7, 15, 0, 0.9999, 500000, -5000000
Swiss Coordinate Systems
We have updated coordinate systems:
•
•
•
•
•
"Liechtenstein National System", 25, 1003, 7, 7.4395833333, 46.9524055555, 0, 0
"Swiss National System", 25, 1003, 7, 7.4395833333, 46.9524055555, 600000, 200000
"CH1903.LV03\p21781", 25, 999, 10, 674.374, 15.156, 405.346, 7, 7.43958333333333,
46.9524055555556, 600000, 200000
"CH1903.LV03C\p21782", 25, 999, 10, 674.374, 15.156, 405.346, 7, 7.43958333333333,
46.9524055555556, 0, 0
"CH1903plus.LV95\p2056", 25, 999, 10, 674.374, 15.156, 405.346, 7, 7.43958333333333,
46.9524055555556, 2600000, 1200000
United States of America (USA) Coordinate Systems
We have added new USA coordinate systems:
•
•
"California Teale Albers NAD27", 9, 62, 7, -120, 0, 34, 40.5, 0, -4000000
"California Teale Albers NAD83", 9, 74, 7, -120, 0, 34, 40.5, 0, -4000000
Zambia Projections
We have added new Zambian projections:
Gauss-Kruger Arc1950
•
"Gauss-Kruger LO 24 Arc1950", 8, 5, 7, 24, 0, 1, 0, 0
•
"Gauss-Kruger LO 25 Arc1950", 8, 5, 7, 25, 0, 1, 0, 0
•
"Gauss-Kruger LO 26 Arc1950", 8, 5, 7, 26, 0, 1, 0, 0
MapInfo Professional 10.5
471
User Guide
Chapter B: Elements of a Coordinate System
For More Information on Projections
•
•
•
•
"Gauss-Kruger LO 27 Arc1950", 8, 5, 7, 27, 0, 1, 0, 0
"Gauss-Kruger LO 28 Arc1950", 8, 5, 7, 28, 0, 1, 0, 0
"Gauss-Kruger LO 29 Arc1950", 8, 5, 7, 29, 0, 1, 0, 0
"Gauss-Kruger LO 30 Arc1950", 8, 5, 7, 30, 0, 1, 0, 0
Gauss-Kruger Arc1950 (**Affine Transformation, False Coords)
•
"Gauss-Kruger LO 24 Arc1950", 8, 1005, 7, 24, 0.9996, 1, 500000, 10000000
•
"Gauss-Kruger LO 25 Arc1950", 8, 1005, 7, 25, 0.9996, 1, 500000, 10000000
•
"Gauss-Kruger LO 26 Arc1950", 8, 1005, 7, 26, 0.9996, 1, 500000, 10000000
•
"Gauss-Kruger LO 27 Arc1950", 8, 1005, 7, 27, 0.9996, 1, 500000, 10000000
•
"Gauss-Kruger LO 28 Arc1950", 8, 1005, 7, 28, 0.9996, 1, 500000, 10000000
•
"Gauss-Kruger LO 29 Arc1950", 8, 1005, 7, 29, 0.9996, 1, 500000, 10000000
•
"Gauss-Kruger LO 30 Arc1950", 8, 1005, 7, 30, 0.9996, 1, 500000, 10000000
Gauss-Kruger Arc1950 (No Affine Transformation, False Coords)
•
"Gauss-Kruger LO 24 Arc1950", 8, 5, 7, 24, 0, 0.9996, 500000, 10000000
•
"Gauss-Kruger LO 25 Arc1950", 8, 5, 7, 25, 0, 0.9996, 500000, 10000000
•
"Gauss-Kruger LO 26 Arc1950", 8, 5, 7, 26, 0, 0.9996, 500000, 10000000
•
"Gauss-Kruger LO 27 Arc1950", 8, 5, 7, 27, 0, 0.9996, 500000, 10000000
•
"Gauss-Kruger LO 28 Arc1950", 8, 5, 7, 28, 0, 0.9996, 500000, 10000000
•
"Gauss-Kruger LO 29 Arc1950", 8, 5, 7, 29, 0, 0.9996, 500000, 10000000
•
"Gauss-Kruger LO 30 Arc1950", 8, 5, 7, 30, 0, 0.9996, 500000, 10000000
For More Information on Projections
The first three publications listed are relatively short pamphlets. The last two are substantial books.
We’ve also given addresses and phone numbers for the American Congress of Surveying and
Mapping (the pamphlets) and the U.S. Geological Survey (the books).
American Cartographic Association. Choosing a World Map—Attributes, Distortions, Classes,
Aspects. Falls Church, VA: American Congress on Surveying and Mapping. Special Publication No.
2. 1988.
American Cartographic Association. Matching the Map Projection the Need. Falls Church, VA:
American Congress on Surveying and Mapping. Special Publication No. 3. 1991.
American Cartographic Association. Which Map is Best? Projections for World Maps. Falls Church,
VA: American Congress on Surveying and Mapping. Special Publication No. 1. 1986.
John P. Snyder. Map Projections—A Working Manual. Washington: U.S. Geological Survey
Professional Paper 1395. 1987
John P. Snyder and Philip M. Voxland. An Album of Map Projections. Washington: U.S. Geological
Survey Professional Paper 1453. 1989.
MapInfo Professional 10.5
472
User Guide
Chapter B: Elements of a Coordinate System
For More Information on Projections
Contact Information
The Department of Geography at the University of Colorado at Boulder has made available "The
Geographer's Craft" project, a website devoted to explanations of map projections, geodetic datums,
and coordinate systems. It is particularly valuable because many of the explanations were presented
using MapInfo Professional.
The materials may be used for study, research, and education. If you link to or cite the materials
below, please credit the author: Peter H. Dana, The Geographer's Craft Project, Department of
Geography, The University of Colorado at Boulder.
For geodetic datum information and explanations, go to:
http://www.colorado.edu/geography/gcraft/notes/datum/datum.html
For information on coordinate systems and associated topics, go to:
http://www.colorado.edu/geography/gcraft/notes/coordsys/coordsys.html
For information on map projections, go to:
http://www.colorado.edu/geography/gcraft/notes/mapproj/mapproj.html
MapInfo Professional 10.5
473
User Guide
Manually Creating a
MapInfo_MapCatalog
These instructions are for manually creating a MapInfo Map Catalog and
making a remote table mappable, two procedures that are necessary for
geocoding remote tables. This information is designed for users who do not
have access to MapInfo Professional.
MapInfo Professional users would create a MapInfo Map Catalog automatically.
•
•
Creating a MapInfo_MapCatalog Automatically
Making a Remote Table Mappable
You or your database administrator must create one MapInfo Map Catalog for
each database you wish to access in MapInfo Professional.
C
Chapter C: Manually Creating a MapInfo_MapCatalog
To create a MAPINFO_MAPCATALOG manually:
1. If the RDBMS requires owners and users, then create the user MAPINFO with the PASSWORD
MAPINFO in the specific database where the mappable tables are located.
2. Create the table MAPINFO_MAPCATALOG in the database.
The Create Table statement must be equivalent to the following SQL Create Table statement:
Create Table MAPINFO_MAPCATALOG(
SPATIALTYPE
TABLENAME
OWNERNAME
SPATIALCOLUMN
DB_X_LL
DB_Y_LL
DB_X_UR
DB_Y_UR
VIEW_X_LL
VIEW_Y_LL
VIEW_X_UR
VIEW_Y_UR
COORDINATESYSTEM
SYMBOL
XCOLUMNNAME
YCOLUMNNAME
RENDITIONTYPE
RENDITIONCOLUMN
RENDITIONTABLE
NUMBER_ROWS
Float,
Char(32),
Char(32),
Char(32),
Float,
Float,
Float,
Float,
Float,
Float,
Float,
Float,
Char(254),
Char(254),
Char(32),
Char(32),
Integer,
VarChar(32),
VarChar(32),
Integer
)
It is important that the structure of the table is exactly like this statement. The only substitution
that can be made is for databases that support varchar or text data types; these data types can
be substituted for the Char data type.
3. Create a unique index on the TABLENAME and the OWNERNAME, so only one table for each
owner can be made mappable.
4. Grant Select privileges to all users on the MAPINFO_MAPCATALOG. This allows users to make
tables mappable. The Update, Insert, and Delete privileges must be granted at the discretion of
the database administrator.
MapInfo Professional 10.5
475
User Guide
Chapter C: Manually Creating a MapInfo_MapCatalog
Spatial Index Types
This table lists the supported Spatial Index types.
Spatial Index Type
Type Number
MapInfo MICODE schema (any database)
1
XY schema (any database)
4
Oracle Spatial Geometry
13
SpatialWare for SQL Server
14
Oracle Spatial Annotation Text
16
SQL Server Spatial (for geometry)
17
SQL Server Spatial (for geography)
18
PostGIS for PostgreSQL
19
SQL Server Spatial with M and Z values (for geometry)
20
SQL Server Spatial with M and Z values (for geography)
21
Manually Making a Remote Table Mappable
For each spatial table in the remote database that you want to access in MapInfo Professional, you
must add a row to the MAPINFO_MAPCATALOG table. This is carried out in MapInfo Professional
when you select Table > Maintenance > Make ODBC Table Mappable.
If you do not use MapInfo Professional to manage the Map Catalog, you must manually add rows to
the MAPINFO_MAPCATALOG table for each spatial table in the database that you want to
geocode. Each entry must contain the following information about the table.
Column Name
SPATIALTYPE
Values to Assign
4.0 for X,Y spatial index tables
Example
4.0
(Support for additional spatial servers is under
development)
TABLENAME
Name of the table.
Drainage
OWNERNAME
Owner name.
Georgetown
SPATIALCOLUMN
Name of the column, if any containing spatial
features. The name is:
NO_COLUMN
•
MapInfo Professional 10.5
NO_COLUMN (for mappable tables
using X,Y)
476
User Guide
Chapter C: Manually Creating a MapInfo_MapCatalog
Column Name
Values to Assign
Example
DB_X_LL
X coordinate of the lower left corner of the
layer’s bounding rectangle, in units indicated
by the COORDINATESYSTEM as defined by
MapInfo Professional.
-360
DB_Y_LL
Lower left bounding Y value.
-90
DB_X_UR
Upper right bounding X value.
360
DB_Y_UR
Upper right bounding Y value.
90
VIEW_X_LL
X coordinate of the lower left corner of the
view’s bounding rectangle, in units indicated
by the COORDINATESYSTEM as defined by
MapInfo Professional.
-360
VIEW_Y_LL
Lower left bounding Y value.
-90
VIEW_X_UR
Upper right bounding X value.
360
VIEW_Y_UR
Upper right bounding Y value.
90
COORDINATESYSTEM
A string representing a MapInfo-supported
coordinate system that specifies a map
projection, coordinate units, etc. Values are
one of:
Earth
Projection 1,0
•
•
•
•
Earth Projection
NAD27)
Earth Projection
NAD27)
Earth Projection
or
Earth Projection
83)
1,0 (for
1,62 (for
1,33 (for NAD 83)
1,74 (for NAD
SYMBOL
A MapInfo Symbol clause (for a layer
containing points)
Symbol
(35,0,12)
XCOLUMNNAME
Specify the name of the column containing X
coordinates.
NO_COLUMN
YCOLUMNNAME
Specify the name of the column containing Y
coordinates.
NO_COLUMN
RENDITIONTYPE
Specify 1 if on, 0 if off.
1
RENDITIONCOLUMN
Specify the name of the rendition column.
MI_SYMBOLOGY
MapInfo Professional 10.5
477
User Guide
Chapter C: Manually Creating a MapInfo_MapCatalog
Column Name
RENDITIONTABLE
Values to Assign
Specify the name of the rendition table.
Example
left empty
This field is not used.
NUMBER_ROWS
MapInfo Professional 10.5
Specify the number of rows in the table.
478
11
User Guide
MapInfo Map Interchange
Format
To ensure file format backward compatibility we provide a file version
comparison in this Appendix.
Topics in this Section:
File Versions and TAB, MIF/MID, and WOR Support . . . . . . . . . .480
D
Chapter D: MapInfo Map Interchange Format
File Versions and TAB, MIF/MID, and WOR Support
File Versions and TAB, MIF/MID, and WOR Support
The following table lists changes (and their implications) to versions in .tab, workspace, and other
files used by MapInfo Professional.
•
•
•
•
•
TAB files are always saved as 300 unless noted in the table
WOR files are always saved as 400 unless noted in the table
Once a table is 'upgraded' to a later version, MapInfo Professional does not 'downgrade' it to an
earlier version if the feature which forced the 'upgrade' is removed.
Workspaces are written fresh each time, and so can be 'downgraded' if there are no features that
require the 'upgrade'
MIF/MID files created by exporting TAB files match the version of the TAB file
– Pen(0,0,0) and Brush(0,0,0) which were are no longer valid
– Line widths in points is encoded in the Pen clause by multiplying the line width value by 10
and adding 10 to the result (.2 -> 12, 1.0 -> 20, etc.). This forces a 450 in the MIF file header.
– Interleaved line styles are encoded in the Pen clause by increasing the line style value by
128. This does not force a 450 workspace, it is 4.x compatible, and is saved as 400.
File versions and TAB, MIF/MID, and WOR Support
Version
Number
400
TAB
MIF MID
WOR
X
X
Action
Table is a linked ODBC table.
X
X
Tab version stays at 300 with interleaved.
X
Saved queries (controlled by 'Save Queries in
Workspaces' check box in Options > Preferences >
Startup dialog) are implemented as straight Select
statements.
410
X
X
Table uses MS Access DB's.
450
X
X
Region and polyline objects, that have more than 32K
nodes (actually !edit_version 450 and !version 300).
X
X
Table uses point sized line widths.
X
X
Table is a query table.
452
X
Workspaces that specify dot density color (shade ...
density... color).
X
Workspaces that specify interleaved line style, width in
points (Pen (1,2,x)).
X
X
Table uses a Datum or ellipsoid released in a specific
version
X
X
Regional Mercator projection - number 26.
MapInfo Professional 10.5
480
User Guide
Chapter D: MapInfo Map Interchange Format
File Versions and TAB, MIF/MID, and WOR Support
File versions and TAB, MIF/MID, and WOR Support (continued)
Version
Number
500
550
TAB
X
MIF MID
WOR
X
Action
Table specifies a 'grid' file (*.MIG, raster style = 6 1)
X
Workspaces that contain surface thematic layers
(inflection).
X
Workspaces that contain cartographic legends (Create
Cartographic Legend).
X
X
Polyconic projection - number 27.
X
X
Irish (WOFO) ellipsoid - number 49.
X
X
Table is a linked\live Oracle 8i table.
X
X
Workspaces with Oracle 8i connection information.
X
Workspaces that include surface thematics with
Hillshading.
X
600
Table uses a Datum or ellipsoid released in a specific
version.
X
Save a workspace with a 3D Map.
X
X
Azimuthal Equidistant projection, Oblique aspect number 28.
X
X
Everest (Pakistan) ellipsoid - number 50.
X
X
ATS 77 ellipsoid - number 51.
MapInfo Professional 10.5
481
User Guide
Chapter D: MapInfo Map Interchange Format
File Versions and TAB, MIF/MID, and WOR Support
File versions and TAB, MIF/MID, and WOR Support (continued)
Version
Number
TAB
MIF MID
WOR
Action
New Datums introduced in Version 6.0. Their numbers
are in a range 115-150 (115 and 150 included) and
1004-1011 (1004 and 1011 included).
As of this release MapInfo Professional writes the
Datum number if all the parameters match to the
parameters of our internal Datum table. The application
writes the FIRST datum number with these
parameters, that are in our internal table. That means
that if a table was created using Datums EUREF89
(115), GDA94 (116)or NZGD2000 (117), the MIF file
will have Datum GRS 80 (33) written into it and MIF file
version would not be incremented.
Since MapInfo Professional does not write datum
number into TAB file, version will be incremented only if
ellipsoid is new.
L
650
As of version 8.0, MapInfo Professional now
writes a datum index number into MAP file, so
this is no longer always the case.
X
Workspace includes Advanced Printer settings.
X
Workspace includes a Hotlink.
X
Workspace includes a 3D Mapper window.
X
Workspaces that include new clip region settings.
X
X
Table uses a Datum or ellipsoid released in a specific
version.
X
X
New object types: Multipoint and Collection (actually
!edit_version 650 and !version 300).
X
X
Cassini-Soldner projection (number 30).
X
X
Lambert Azimuthal Equal-Area projection - Oblique
aspect (number 29).
MapInfo Professional 10.5
X
Cassini-Soldner projection for the map window.
X
Lambert Azimuthal Equal-Area projection (Oblique
aspect) for the map window.
482
User Guide
Chapter D: MapInfo Map Interchange Format
File Versions and TAB, MIF/MID, and WOR Support
File versions and TAB, MIF/MID, and WOR Support (continued)
Version
Number
700
TAB
MIF MID
WOR
X
New object types (Multipoint and Collection) created in
a cosmetic layer or in a layout.
X
Save a workspace with a Prism Map.
X
X
Action
TAB file linked to a shapefile.
X
X
#152 - JGD2000 datum used in Japan.
#1012 - PZ90 datum based on PZ90 ellipsoid. This
datum is used in Russia.
#1013 - SK42 datum based on PZ90 ellipsoid. This
datum is used in Russia.
#1014 - SK95 datum based on PZ90 ellipsoid. This
datum is used in Russia.
"Longitude / Latitude (Russia PZ90)", 1, 1012.
“Longitude / Latitude (Russia SK42)", 1, 1013.
“Longitude / Latitude (Russia SK95)", 1, 1014.
Double Stereographic projection.
ATS77 (which uses ATS77 ellipsoid).
Prince Edward Island and New Brunswick Projection.
X
750
780
X
X
MapInfo Professional 10.5
ROP Method selected for advanced options for Save
Window As or Printing
TAB files can include Web Map Service (WMS) data.
X
Workspaces can include Advanced Printer settings
(scale patterns).
X
Workspaces can include cartographic legends with
custom layouts.
X
TAB files can include Web Feature Service (WFS)
data.
X
Workspaces can include cartographic legends. The
workspace will always include a clause for swatch size
that cannot be parsed by earlier versions of MapInfo
Professional.
483
User Guide
Chapter D: MapInfo Map Interchange Format
File Versions and TAB, MIF/MID, and WOR Support
File versions and TAB, MIF/MID, and WOR Support (continued)
Version
Number
TAB
MIF MID
Workspaces can include mappers with dot-density
thematics. The workspace will always include a clause
for dot size that cannot be parsed by earlier versions of
MapInfo Professional.
X
Workspaces using custom ordered Individual Value
Legends.
X
Workspaces using Replace layer style.
X
Workspaces using different legend swatch styles.
X
Workspaces using thematic Legend alignment.
X
X
Ellipsoid#: 53 Name: Xian 1980 - used in China.
X
X
Datum#: 1017 Name: XIAN 1980 - based on Xian 1980
ellipsoid #53 for China.
X
X
Datum#: 154 Name: Beijing 1954 - used in China.
X
X
Datum#: 153 Name: HGRS87 - used in Greece.
X
X
Datum#: 1018 Name: Lithuanian Pulkovo 1942 - used
in Lithuania.
X
X
Datum#: 1019 Name: Belgian 1972 7 parameters used in Belgium.
X
800 Edit
Version
Objects with greater than 1M nodes, >32K
polygons\polylines.
X
Objects with greater than 1M nodes, >32K
polygons\polylines.
X
SHP\TAB files that contain Z\M values.
850
900
Action
X
800
X
WOR
X
Open Table as VMGrid or VMRaster.
X
Raster Image Reprojection, Image Resampling.
X
Export with Anti-Aliasing .
X
Redistricting with Percentages
X
X
X
DateTime type.
X
X
X
JTSK Projection #32.
MapInfo Professional 10.5
484
User Guide
Chapter D: MapInfo Map Interchange Format
File Versions and TAB, MIF/MID, and WOR Support
File versions and TAB, MIF/MID, and WOR Support (continued)
Version
Number
TAB
MIF MID
X
WOR
Action
X
Datum# 1020 Name: S-JTSK (Ferro Prime Meridian).
X
New to MapBasic:
•
•
X
X
RegionInfo - The GELink tool needs a way to
determine the orientation of points in polygons
SystemInfo - Extend SystemInfo to return the build
number
Curved Labels.
Open Universal Tables .
950
X
X
Enhanced Labels (Map > Options).
X
Enhanced Layouts (Smoothed Text, Smooth Lines and
Borders, Image smoothing)
X
Translucent Labels (Requires Enhanced Mappers)
X
Set Map Layer Label Percent Over token for curved
labels
X
Enhanced Browsers (smoothed text, antialias)
X
Enhanced Mappers (Smoothed Labels and Text,
Smooth Lines and Borders, Image smoothing)
X
Vector Translucency (Mapper Layers and Layout
Objects)
X
Datum#: 155 Name: LGD 2006) – Used in Libya
Datum#: 156 Name: Dealul Piscului 1970 – Used in
Romania
1000
X
Addition to Create Text statement for Pen clause for
callout lines
X
X
X
WFS-T
X
X
X
Popular Visualization Ellipsoid #54
X
X
X
Popular Visualization Datum #57
X
Oracle's Annotation Text type
X
Table from a PostGIS Database
MapInfo Professional 10.5
485
User Guide
Chapter D: MapInfo Map Interchange Format
File Versions and TAB, MIF/MID, and WOR Support
File versions and TAB, MIF/MID, and WOR Support (continued)
Version
Number
1050
TAB
MIF MID
WOR
Action
X
Table from a SQL 2008 Database
X
Table containing UTF-8 charset definition
X
Table that opens Excel 2007 *.xlsx file
X
Table that opens Access 2007 *.accdb file
X
Workspace with a Group Layer
X
Workspace with ScaleBar Adornment
X
Workspace that uses USNG Grid reference system
X
X
TileServer Table
X
X
Stacked Style
X
Style Override
X
Label Override
X
Multiple Style Override (Stacked Styles)
X
Equidistant Cylindrical Projection #33
CharSet
The CharSet clause specifies which character set was used to create text in the table. For example:
Specify “WindowsLatin1” to indicate that the file was created using the Windows US & Western
Europe character set; specify “MacRoman” to specify the Macintosh US & Western Europe
character set; or specify “Neutral” to avoid converting the text into another character set. If you are
not using one of these character sets, you can determine the correct syntax for your character set by
exporting a table and examining the .MIF file in a text editor.
Delimiter
Specify the delimiting character in quotation marks, for example:
DELIMITER ”;”
The default delimiter is Tab; if you are using the default, you do not need the DELIMITER line.
MapInfo Professional 10.5
486
User Guide
Chapter D: MapInfo Map Interchange Format
File Versions and TAB, MIF/MID, and WOR Support
Unique
Specify a number. This number refers to a database column; 3 is the third column, 7 is the seventh
column, and so forth. What happens to columns in the UNIQUE list is subtle. For example, imagine
that you have a database with highways in it. Each highway has only one name, but it might be
represented by several segments. You would put the NAME column in the UNIQUE list, while the
column containing data for the individual segments would not be in that list. This has the effect of
creating two related tables; one with names, and one with the other attributes of the objects. This is
how Pitney Bowes Software Inc.’s various street maps (StreetPro) are prepared.
Index
To indicate that columns in the table are indexed, include a number (or a comma-separated list of
numbers) in the Index clause. Each number refers to a database column; 3 is the third column, 7 is
the seventh column, and so forth. Columns in the INDEX list will have indexes prepared for them.
CoordSys Clause
Specify the COORDSYS clause to note that the data is not stored in longitude/latitude form. When
no COORDSYS clause is specified, data is assumed to be stored in longitude/latitude form.
All coordinates are stored with respect to the northeast quadrant. The coordinates for points in the
United States have a negative X while coordinates for points in Europe (east of Greenwich) have a
positive X. Coordinates for points in the Northern hemisphere have a positive Y while coordinates for
points in the Southern hemisphere have a negative Y.
Syntax1
CoordSys Earth
[ Projection type,
datum,
unitname
[ , origin_longitude ]
[ , origin_latitude ]
[ , standard_parallel_1 [ , standard_parallel_2 ] ]
[ , azimuth ]
[ , scale_factor ]
[ , false_easting ]
[ , false_northing ]
[ , range ] ]
[ Affine Units unitname, A, B, C, D, E, F ]
[ Bounds ( minx, miny) ( maxx, maxy ) ]
Syntax2
CoordSys Nonearth
[ Affine Units unitname, A, B, C, D, E, F ]
Units unitname
Bounds ( minx, miny ) ( maxx, maxy )
Syntax3
CoordSys Layout Units paperunitname
MapInfo Professional 10.5
487
User Guide
Chapter D: MapInfo Map Interchange Format
File Versions and TAB, MIF/MID, and WOR Support
Syntax4
CoordSys Table tablename
Syntax5
CoordSys Window window_id
type is a positive integer value representing which coordinate system to use
datum is a positive integer value identifying which datum to reference
unitname is a string representing a distance unit of measure (for example, -m" for meters); for a
list of unit names, see Set Distance Units
origin_longitude is a float longitude value, in degrees
origin_latitude is a float latitude value, in degrees
standard_parallel_1 and standard_parallel_2 are float latitude values, in degrees
azimuth is a float angle measurement, in degrees
scale_factor is a float scale factor
range is a float value from 1 to 180, dictating how much of the Earth will be seen
minx is a float specifying the minimum x value
miny is a float specifying the minimum y value
maxx is a float specifying the maximum x value
maxy is a float specifying the maximum y value
paperunitname is a string representing a paper unit of measure (for example, -in" for inches); for
a list of unit names, see Set Paper Units
tablename is the name of an open table
window_id is an Integer window identifier corresponding to a Map or Layout window
A performs scaling or stretching along the X axis.
B performs rotation or skewing along the X axis.
C performs shifting along the X axis.
D performs scaling or stretching along the Y axis.
E performs rotation or skewing along the Y axis.
F performs shifting along the Y axis.
Transform Clause
When you have MIF files with coordinates stored with respect to the northwest quadrant (quadrant
2), you can transform them to the northeast quadrant (quadrant 1) with a transform clause.
Quadrant 2: Northwest Quadrant
Quadrant 1: Northeast Quadrant
Quadrant 3: Southwest Quadrant
Quadrant 4: Southeast Quadrant
The transform clause has the following syntax:
TRANSFORM Xmultiplier, Ymultiplier, Xdisplacement, Ydisplacement
To transform quadrant 2 data into quadrant 1 data, use the following transform clause:
MapInfo Professional 10.5
488
User Guide
Chapter D: MapInfo Map Interchange Format
File Versions and TAB, MIF/MID, and WOR Support
TRANSFORM -1,0,0,0
The zeroes instruct MapInfo Professional to ignore that parameter.
When you have an application which creates MIF files in quadrant 2, you can:
•
•
•
Add the TRANSFORM clause to the MIF files
Change the application so that it creates coordinates in quadrant 1
Change the application so that it adds a TRANSFORM clause to the MIF files
Columns
Specify the number of columns. Then, for each column, create a row containing the column name,
the column type, and, for character and decimal columns, a number to indicate the width of the field.
L
Field names cannot have spaces.
Valid column types are:
•
•
•
•
•
•
•
char (width)
integer (which is 4 bytes)
smallint (which is 2 bytes, so it can only store numbers between -32767 and +32767)
decimal (width,decimals)
float
date
logical
This is an example of the columns section of the header:
COLUMNS 3
STATE char (15)
POPULATION integer
AREA decimal (8,4)
For the database specified in this header, the MID file has three columns:
•
•
•
a 15 character field that represents the STATE column,
an integer field that represents the POPULATION column,
an AREA column that consists of a decimal field with up to 8 total characters (digits, decimals
points, and optional sign) and 4 digits after the decimal.
MapInfo Professional 10.5
489
User Guide
Glossary of Terms
E
Chapter E: Glossary of Terms
Term
Definition
3DMap
A window that allows you to view your maps containing continuous grids from various
viewpoints in 3D Format.
Add Node
Button
Use the Add Node button to add a node to regions, polylines, and arcs. You can add
nodes when the Reshape tool is in effect. Adding nodes can give more precision to your
object.
Address
Dictionary
The search dictionary used for matching addresses during geocoding.
Adornment
A map decoration, such as a title, scale bar, or company logo, that provides contextual
information for the map view.
Alias
The name assigned to an expression or a column when you are working in the Select
Columns field in the SQL Select dialog box. This name appears as the column title for
that expression or column in a Browser.
Application
A computer program used for a particular kind of work, such as word processing.
Application is often interchangeable with the word program.
Arc Button
The Arc button allows you to access the Arc tool. Use the Arc tool to draw an arc the
size and shape of one quarter of an ellipse. Once you have created an arc, you can
reshape it to the desired size.
ASCII
The acronym for American Standard Code for Information Interchange. ASCII is a
standard code used in most microcomputers, computer terminals, and printers for
representing characters as numbers. It not only includes printable characters, but also
control codes to indicate carriage return, backspace, and so forth.
Assign
Selected
Objects Button
Use this button to permanently assign all selected map objects to the target district.
Attribution Text
Text added to a tile server table definition that automatically displays when a tile server
layer is in a map window. Some tile servers require attribution text, such as origin and
copyrights information (the tile server author or distributor provides attribution text
requirements).
Axis
Used in a graph, these are graduated lines bordering the plot area of a graph. Location
coordinates are measured relative to the axes. By convention the X-axis is horizontal,
the Y-axis is vertical.
Bar Chart
A type of thematic map that displays a bar chart of thematic variables for each record in
a table from which the map is based.
MapInfo Professional 10.5
491
User Guide
Chapter E: Glossary of Terms
Term
Definition
Base Map
Usually the dominant or underlying layer in a given map. (These are typically the data
layers that Pitney Bowes Software Inc. offers as ready products.) Users usually layer
their own data on top of these base maps or use these base maps to geocode or to
make new layers. Examples are joining industry data to postal code boundaries for
analysis and then combining arrangements of the postal codes into new territory layers.
Base Table
A permanent table, which is part of a map, as opposed to a query table, which is
temporary. You can edit the contents of base tables, and you can change their structure
(by editing, deleting, reordering columns and adding or deleting graphic objects).
Bitmap
A screen image displayed as an array of dots or bits. Software usually generates either
bit-mapped (raster) or object-oriented (vectored) files. MapInfo Professional can work
with both.
Boundary
Region
In GIS a boundary is a region on a map enclosed by a border. Cambria County,
Manitoba, and Argentina would all be represented as boundaries on a map. Note that a
single boundary could encompass several polygons. Thus, Indonesia is a single
boundary but consists of many polygons.
Boundary
Select Button
The Boundary Select button allows you to access the Boundary Select tool. Use the
Boundary Select Tool to search for and choose all the objects within a given region,
such as a state or county boundary, a police patrol district, a sales territory, and so forth.
Browser
A window for viewing a table (or database, spreadsheet or text file) in tabular form.
Buffer
A type of proximity analysis where areas or zones of a given distance are generated
around selected map objects. Buffers are user-defined or can be generated for a set of
objects based on those objects’ attribute values. The resulting buffer zones form region
objects representing the area that is within the specified buffer distance from the object.
Cadastral
A map set used to graphically define the cadastre or land ownership in a given area. A
tax map is an example of a cadastral map. The land registration, assessment roles, and
tax maps comprise the cadastre.
Cancel Button
A command button for closing a dialog box without making changes.
Cartesian
A coordinate system using an x,y scale not tied to any “real-world” system. Most CAD
drawing uses this method of registering objects (for example, a drawing of a ball-bearing
assembly, floor plans). If a drawing uses Cartesian coordinates, one corner of the
drawing probably has coordinates 0, 0.
Cartesian
Coordinates
The conventional representation of geometric objects by x and y values on a plane.
Cartographic
Legend
A MapInfo Professional legend window that enables you to display cartographic
information for any map layer in the Map window.
MapInfo Professional 10.5
492
User Guide
Chapter E: Glossary of Terms
Term
Definition
Cartographic
Scale
A map scale that does not include distance units, such as 1:63,360 or 1:1,000,000.
Cartography
The art and science of making maps. In GIS it is also the graphic presentation and visual
interpretation of data.
Centroid
Usually the center of a map object. For most map objects, the centroid is located at the
middle of the object (the location halfway between the northern and southern extents
and halfway between the eastern and western extents of the object). In some cases, the
centroid is not at the middle point because there is a restriction that the centroid must be
located on the object itself. Thus, in the case of a crescent-shaped region object, the
middle point of the object may actually lie outside the limits of the region; however, the
centroid is always within the limits of the region.
In MapInfo Professional, the centroid represents the location used for automatic
labeling, geocoding, and placement of thematic pie and bar charts. If you edit a map in
Reshape mode, you can reposition region centroids by dragging them.
Change View
Button
This button allows you to change the zoom, map scale, and window centering aspects of
the Map or Layout that currently displays.
Check Box
A small square box that appears in a dialog box. You can click in the check box or on the
text in order to select the option. Check boxes are generally present when multiple
options can be selected at one time.
Click
To press and release a mouse button quickly.
Column
A column in a Browser corresponds to a field in a table. A column contains a specific
type of information about an object, such as Name, Abbreviation, Land area, Price,
Population, and so forth. The information for each object is listed on a row in the
Browser.
Command
A word or phrase, usually found in a menu, that displays a dialog box and/or carries out
an action.
Conflict
Resolution
When conflicts exist between the data residing on a remote database and new data that
you want to upload to the remote database via a MapInfo Professional linked table. The
conflict resolution process is invoked whenever an attempt to save the linked table
detects a conflict in an update.
Control Menu
A menu activated through the Control Menu Box located in the upper left corner of all
windows. The control menu is used to resize, move, maximize, minimize, or close the
window.
Control Points
The points on a raster image whose coordinates serve as a reference for associating
earth coordinates with any location on the image. See Registration on page 503.
MapInfo Professional 10.5
493
User Guide
Chapter E: Glossary of Terms
Term
Definition
Coordinate
An x,y location in a Cartesian coordinate system, or a Latitude, Longitude location in an
earth coordinate system. Coordinates represent locations on a map relative to other
locations. Earth coordinate systems may use the equator and the Greenwich prime
meridian as fixed reference points. Plane coordinate systems describe a twodimensional x,y location in terms of distance from a fixed reference and are usually in
the first quadrant so that all coordinates are positive numbers.
Coordinate
System
A coordinate system is used to create a numerical representation of geometric objects.
Each point in a geometric object is represented by a pair of numbers. Those numbers
are the coordinates for that point. In cartography, coordinate systems are closely related
to projections. You create a coordinate system by supplying specific values for the
parameters of a projection. See Cartesian Coordinates on page 492, Projection on
page 502, and Spherical Coordinates on page 504.
Cosmetic Layer
The topmost layer of a Map window. Objects may be placed in this layer such as map
titles and graphic objects. It is always displayed, and all objects placed in the Cosmetic
Layer must be saved to a new or existing layer.
Data
Aggregation
A process that occurs when combining separate map objects into a single object.
MapInfo Professional calculates what the column values for the new object should be,
based on sums or averages of the values of the original objects.
Data
Disaggregation
A process that occurs when splitting a map object(s) into smaller parts where MapInfo
Professional splits the data associated with the map object(s) into smaller parts to match
the new map objects.
Data Sources
An ODBC data source is an SQL database and the information you need to access that
database. For example, an SQL Server data source is the SQL Server database, the
server on which it resides, and the network used to access that server.
Database
Any organized collection of data. The term is often used to refer to a single file or table of
information in MapInfo Professional.
Decimal Degree The decimal representation of fractions of degrees. Many paper maps express
coordinates in degrees, minutes, seconds (for example, 40_30i10I), where minutes and
seconds are fractions of degrees. 30 minutes equal half a degree, and 30 seconds equal
half a minute. MapInfo Professional, however, expresses coordinates in decimal
degrees (for example, 72.558 degrees), where fractions of degrees are expressed as
decimals. Thus, the longitude: 40 degrees, 30 minutes, would be expressed in MapInfo
Professional as 40.5 degrees.
Default
The value or option used in the absence of explicit specification. Often the original
setting or value for a variable.
MapInfo Professional 10.5
494
User Guide
Chapter E: Glossary of Terms
Term
Definition
Degrees
Longitude,
Degrees
Latitude,
Decimal
Degrees
Degrees (longitude and latitude) are coordinates used to represent locations on the
surface of the earth. Longitude, or X-coordinate, represents a location’s east-west
position, where any location west of the prime meridian has a negative X value. Latitude,
or Y-coordinate, represents a location’s north-south position, where any location south
of the equator has a negative Y value.
Derived
Column
In a table created through the SQL Select, a derived column is one created by using an
expression. The column is derived in the sense that it isn’t just a copy of the data in one
of the tables being accessed by the SQL Select command.
Derived Field
The same as a derived column.
Deselect
The process of undoing a selection. The object or area you deselect will not be affected
by subsequent commands. Performed by selecting another area, by clicking in a blank
area, or by executing the Unselect All command.
Digitizer,
Digitizing
Tablet
An electronic device that lets you trace a paper map into a GIS or CAD package. The
digitizer consists of a table (or tablet) onto which you attach a paper map. You then can
trace the map by moving a hand-held, mouse-like device known as a cursor, or puck,
across the surface. Digitizing a map produces vector data as the end result.
Districts
Browser
A special browser that displays when redistricting. It differs from other Browser windows
in the following respects: one row can only be selected at one time, one row is always
selected, and the selected row becomes the target district into which you can add other
objects.
Dot Density
Map
A type of thematic map that carries information by showing a large number of tiny dots,
wherein each dot represents some specific unit quantity. For example, for a population
dot density map each dot might represent 10,000 people.
Drawing
Toolbar
A MapInfo Professional window containing twelve buttons that access tools for drawing
and modifying objects on your map or layout.
Edit Handle
The small boxes that appear at the four corners of the minimum bounding rectangle of
an object in an editable layer of a Map window or in a Layout window.
Ellipse Button
The Ellipse button allows you to access the Ellipse tool. Use the Ellipse tool to create
elliptical and round objects.
Export
The process whereby a program saves information in a file to be used by another
program.
Expression
A statement containing two parts: 1) column names and constants (for example, specific
data values), and 2) functions (for example, area) and operators (for example, +, -, >), in
order to extract or derive information from a database. Expressions are used in Select,
SQL Select, Update Column, Create Thematic Map, and Label with Column.
MapInfo Professional 10.5
495
User Guide
Chapter E: Glossary of Terms
Term
Definition
Field
A field in a table corresponds to a column in a Browser. A field contains a specific type of
information about an object, such as, name, abbreviation, land area, price, population,
and so forth. The record for each object consists of that object’s values for each of the
fields in the database.
File
A collection of information that has been given a name and is stored on some electronic
medium such as a tape or disk. A file can be a document or an application.
Fill Pattern
The design and color used to fill a closed object.
FLEXNet
Operations
module (FNO)
The Pitney Bowes Business Insight database that maintains product entitlements and
information about their activation.
Font
A character set based on a particular style used for text characters.
Frame Button
The Frame button allows you to create frames in a layout. Each frame can display a
map, graph, Browser, map legend, graph legend, Info window, statistics window, and
message window or, it can be an empty frame.
Generalization
The process of simplifying a data set to a size that can be easily manipulated and
represented. For example, a river may have many twists and turns; however, if a map
covers a very large area, the river may be represented as a straight line. Similarly, in a
map of a very large area, a city might be represented as a point marker.
Geocode
The process of assigning X and Y coordinates to records in a table or database so that
the records can be displayed as objects on a map.
Geographic
Information
System (GIS)
An organized collection of computer hardware and software designed to efficiently
create, manipulate, analyze, and display all types of geographically or spatially
referenced data. A GIS allows complex spatial operations that are very difficult to do
otherwise.
Georegistered
PDF
A PDF file that has geospatial information (bounds and coordinate systems) of map or
layout window that it prints.
Grabber Button
The Grabber Button allows you to access the Grabber tool. Use the Grabber tool to
reposition a map or layout within its window.
Graduated
Symbols Map
A type of thematic map that shows symbols (point objects) in a variety of sizes to
indicate which objects have higher or lower numerical values.
Graph window
A window that displays numerical data in the form of a graph.
Graticule
A grid of horizontal (latitude) and vertical (longitude) lines displayed on an earth map,
spaced at a regular distance (for example, every five degrees, every fifteen degrees).
Used to establish a frame of reference.
MapInfo Professional 10.5
496
User Guide
Chapter E: Glossary of Terms
Term
Definition
Grid Surface
Map
A type of thematic map that displays data as continuous color gradations across the
map. This type of thematic map is produced by an interpolation of point data from the
source table. A grid file from the data interpolation is generated and is displays as a
raster image in a Map window.
Heads-Up
Digitizing
A method of digitizing where the user creates vector objects by tracing over a raster
image displayed on the screen. Thus, heads-up digitizing does not require a digitizing
tablet.
Help Button Bar A bar located at the top of the Help Window that contains buttons you use to move to
Help topics.
Horizontal
Scroll Bar
The Horizontal scroll bar appears at the bottom of the MapInfo Professional window.
Use the horizontal scroll bar to move left and right. The scroll box inside the scroll bar
indicates your horizontal location. You can use the mouse to scroll to other parts of the
window.
Hot Views
MapInfo Professional technology that automatically updates all the windows you have
open for a particular table when you make a change in any one of the windows. For
example, if an item is selected in a Map window, it will be selected in all other Map
windows and Browsers you have open for that table.
Import
The process whereby a program loads a file that is the output of another program.
Individual
Values Map
A type of thematic map that shades records according to individual values.
Inflection
The process of deviating the color in ranged thematic maps to emphasize some
numerical significance. In thematic mapping we insert a new color between the top and
bottom color for second interpolation of data.
For example, suppose we were showing population growth with blue representing an
increase in population growth and red representing a decrease in population growth.
We could have white as the inflection color for a range that has zero or almost zero
population growth, so that lighter shades of blue would represent a smaller population
growth and lighter shades of red would represent a smaller decline in population.
Info Button
The Info button allows you to access the Info tool. Use the Info tool to select a location
on your map, including multiple overlapping objects and display a list of all objects at
that location. You can then choose an object from the list and view the tabular data for
that object.
Islands
Small areas outside the main boundary that can be reached within the specified time or
distance.
IsoChrone
An IsoChrone is a polygon or set of points representing an area that can be traversed
from a starting point in a given amount of time along a given road network.
MapInfo Professional 10.5
497
User Guide
Chapter E: Glossary of Terms
Term
Definition
IsoDistance
An IsoDistance is a polygon or set of points representing an area that can be traversed
from a starting point travelling a given distance along a given road network.
Isogram
An Isogram is a map that displays a set of points that satisfy a distance or time
condition. Isograms are either IsoChrones or IsoDistances.
Join
The process of creating a relational link between two tables (databases).
Latitude
The horizontal lines on a map that increase from 0 degrees at the Equator to 90 degrees
at both the North (+90.0 degrees) and South (-90.0 degrees) poles. Used to describe the
North-South position of a point as measured usually in degrees or decimal degrees
above or below the equator.
Layer
A layer is a basic building block of MapInfo Professional maps and consists of a table
with graphic and text settings like style override, labeling, and zoom layering. Maps are
made of one or more superimposed layers (for example, a layer of street data
superimposed over a layer of county or postal code boundaries) which you can design to
convey geographical or statistical information. Typically, each map layer corresponds to
one open table. Cosmetic Layers contain map objects that represent temporary map
annotations (for example, text objects). Cosmetic Layers contain map objects that
represent temporary map annotations (for example, labels). See Cosmetic Layer on
page 494 and Table on page 506.
Layer Control
Button
The Layer Control Button allows you to access the Layer Control window. This dialog
box allows you to specify how the various tables in a Map window are layered and
displayed. See Accessing Layer Control on page 53.
Layout Window
A window where you arrange and annotate the contents of one or several windows for
printing.
Legend
The part of a map, which explains the meaning of different colors, shapes, or fill patterns
used on the map. See also Cartographic Legend on page 492.
Legend Frames
Each legend window contains one or more legend frames each corresponding to a style
or theme layer in the Map window.
Legend
Window
A window containing legend frames. You can create more than one legend window for
each map. The legend window can contain more than one frame. For example, you can
have one legend window containing four legend frames, or you can have four legend
windows, each containing one legend frame.
Legend
Window Button
Use the Legend Window button to display the Legend window associated with maps or
graphs.
Line, Line
Object
A map object defined by a set of sequential coordinates that may represent the
generalized shape of a geographic feature (for example, street centerlines, railroads,
cables). A Pitney Bowes Software Inc. street map is a collection of thousands of line
objects.
MapInfo Professional 10.5
498
User Guide
Chapter E: Glossary of Terms
Term
Definition
Line Button
The Line button allows you to access the Line tool. Use the Line tool to draw straight
lines.
Line Style
Button
Use the Line Style button to access the Line Style dialog box. The Line Style dialog box
allows you to set the line type, thickness and color of line objects (lines, arcs and
polylines) and borders of closed objects. You can also change the type, thickness and
color of objects you are editing.
Linked Table
A linked table is a special kind of MapInfo table that is downloaded from a remote
database and retains connections to its remote database table. You can perform most
operations on a linked table that you do for a regular MapInfo table.
Longitude
The vertical lines on a map, running from the North to South poles, used to describe the
east-west position of a point. The position is reported as the number of degrees east (to
-180.0 degrees) or west (to +180.0 degrees) of the prime meridian (0 degrees). Lines of
longitude are farthest apart at the Equator and intersect at both poles, and therefore, are
not parallel.
Longitude/
Latitude
MapInfo Professional’s default coordinate system for representing geographic objects in
a map.
Main Toolbar
A window containing buttons for choosing tools, accessing dialog boxes, and showing or
hiding windows.
Map Catalog
The MapInfo map catalog stores information about the location of spatial columns on the
DBMS. There must be one catalog per database. The EasyLoader application can
create this catalog for each database: Oracle, SQL Server, PostGIS, and MS Access.
Additionally, you can create a map catalog manually with instructions in the MapInfo
Professional User Guide. This is a one-time only task per database and is required
before any tables on that database can be mapped in MapInfo Professional.
Map Scale
A statement of a measure of the map and the equivalent measure on the earth. Often
expressed as a representative ratio of distance, such as 1:10,000. This means that one
unit of distance on the map (for example, one inch) represents 10,000 of the same units
of distance on the earth.
The term scale must be used carefully. Technically, a map of a single city block is large–
scale (for example, 1:12,000), while a map of an entire country is small–scale (for
example, 1:1,000,000). A 1:1,000,000 map is considered small-scale because of the
small numeric value obtained when you divide 1 by 1,000,000.
Map Segment
In a street map, a segment is a single section of the street. In urban maps, segments are
generally one block long. Address ranges are stored at the segment level.
MapBasic
The programming language used to customize and/or automate MapInfo Professional.
To create MapBasic applications, you need the MapBasic compiler, which is a separate
product. However, you do not need the MapBasic compiler to run a compiled MapBasic
application.
MapInfo Professional 10.5
499
User Guide
Chapter E: Glossary of Terms
Term
Map Scale
Definition
A ratio or representative fraction (RF), expressed as 1 inch = 63,360 mile or 1:1,000,000
(1 cm to 10 km), that indicates the relationship between a distance on the map and the
distance on the ground.
See also Cartographic Scale.
Map window
A window that allows you to view a table as a map.
Meridian
A line or a portion of a line running from the North to the South pole. A longitudinal line.
Military Grid
Reference
System
The U.S. Military Grid Reference System (MGRS) is a grid reference system that
MapInfo Professional supports when displaying maps in a Map window. It is the military
version of the civilian-use Universal Transverse Mercator (UTM) grid system. Military
grid references are very simil