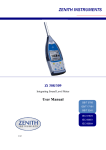
1
X-Analysis
Professional
Software version 11.1, 12082015
Publication Information
Publication Information
© 2015 Fresche Legacy Inc.
Published by:
Fresche Legacy Inc.
995 Wellington
Suite 200
Montreal, QC
Canada, H3C 1V3
Tel.:
(514) 747.7007
(toll-free in US and Canada): 1.800.361.6782
(toll-free in Belgium, France, Germany, UK): 00 800 361 67 82 0
(toll-free in Australia): 0011 800 361 6782 0
E-mail for inquiries: [email protected]
E-mail for support : [email protected]
Web: www.freschelegacy.com
Title: X-Analysis Professional, Software version 11.1
Publication Date: August 2015
Fresche Legacy documentation team
Kim Chan, Shilpi Khan Chaudhary, Vincent Gardner
Trademarks
<X-Analysis, X-Analysis Professional and X-2E Modernize> are trademarks or registered
trademarks of Fresche Legacy Inc. or its subsidiary, Databorough Ltd. <iSeries, Power
Systems, Power8> are registered trademarks of IBM Corporation. Microsoft and Microsoft
Windows are registered trademarks of Microsoft Corporation. All other brand and product
names are trademarks or registered trademarks of their respective companies.
No part of this document may be reproduced or transmitted in any form or by any means,
without prior permission in writing from Fresche Legacy.
The information in this manual is believed to be correct at the time of publication.
However, Fresche Legacy Inc. makes no warranty, express or implied, about the accuracy of
this information and reserves the right to revise this document or make changes to the
products described herein at any time without notice and without obligation. Fresche
Legacy Inc. is not liable for any loss of data, damage to databases or other software, or any
other losses arising from the use of this manual.
X-Analysis Professional 11.1
© 2015 Fresche Legacy Inc.
Page 2
Contents
Contents
Publication Information ...........................................................................................2
Contents ..................................................................................................................3
Preface.....................................................................................................................4
Overview .................................................................................................................5
Benefits of X-Analysis ................................................................................................... 5
Prerequisites ................................................................................................................ 5
Acronyms used in this document ................................................................................. 5
Impact Analysis & Graphical Documentation ............................................................6
Chronology of Features ................................................................................................ 6
Work with Objects........................................................................................................ 7
Object Where Used ...................................................................................................... 9
Export a List to PDF, MS Word or MS Excel ............................................................... 10
Data Flow Diagram / DFD ........................................................................................... 11
Variable Where Used ................................................................................................. 18
Structure Chart Diagram / SCD .................................................................................. 22
Detailed Structure Chart ............................................................................................ 26
Hierarchical Structure Chart....................................................................................... 27
Document Manager ................................................................................................... 32
Source Browser .......................................................................................................... 45
Source Browser toolbar ............................................................................................. 47
Other Options on the Source Browser ....................................................................... 54
Relational Data Model Extraction for IBM i ............................................................. 63
Generating Data Model Diagram ............................................................................... 64
LFs/Access Paths ........................................................................................................ 69
File Field Details/FFD .................................................................................................. 70
Access Path Diagram/APD .......................................................................................... 71
View Data ................................................................................................................... 73
Data Model Diagram – Application Area Specific ...................................................... 75
What’s Next ........................................................................................................... 78
Appendix – Enabling the SEU Interface ................................................................... 79
Create User Profile – XAN4SEU .................................................................................. 79
Press F10 and Page Down .......................................................................................... 80
Creating macro of XAN4SEU ...................................................................................... 80
Index...................................................................................................................... 83
X-Analysis Professional 11.1
© 2015 Fresche Legacy Inc.
Page 3
Preface
Preface
ABOUT THIS GUIDE
The X-Analysis Professional guide is a handy, step-by-step, illustrative document that has
been specially designed to highlight the practical features of X-Analysis. In particular it
discusses the following topics:
Impact Analysis
Graphical Documentation
Data Model Extraction
Version
This guide describes version 11.1 of X-Analysis.
How to use this guide
Each chapter in this guide focuses on the advanced analytical aspects of X-Analysis. The
guide begins with a few words on the overall benefits of X-Analysis and mentions certain
software pre-requisites to be met. Thereafter, the guide discusses the main topics
comprising Impact Analysis, Graphical Documentation and Data Model Extraction for IBM
i.
The X-Analysis suite of products contains a total of eight modules. This guide describes
only the module: X-Analysis Professional. For information about the other modules, please
contact your Fresche Legacy representative, or visit us at www.freschelegacy.com.
Important Note
X-Analysis client release 10.x onwards is digitally signed.
Since this product is under continuous improvement, you might notice some differences in
the screens.
Windows 8 users – In case any problems occur in running X-Analysis:
-
Right-click on the ‘Clean start Eclipse’ or the ‘X-Analysis for Eclipse’ shortcuts.
-
Then, select ‘Run as administrator’.
X-Analysis Professional 11.1
© 2015 Fresche Legacy Inc.
Page 4
Overview
Overview
X-Analysis is an advanced and easy-to-use analysis tool. The tool’s instant and automated
features like visual impact analysis, cross-referencing, and graphical documentation of
RPG and COBOL applications endow this software with a remarkable edge. This section
briefly explains the benefits of X-Analysis and the hardware prerequisites needed for
successful installation of the software.
BENEFITS OF X-ANALYSIS
The X-Analysis product suite is an essential tool for IBM i application documentation,
design recovery, and re-engineering. The X-Analysis software works as a plugin under
IBM's RDi / RDp / WDSC and Eclipse, enabling you to browse and visualize applications
from a high-level model down to individual lines of code. This globally renowned tool is
packed with features like RPG & COBOL as pseudo code, variable level impact analysis,
graphical flow/structure charts, graphical data flowcharts, PDF/MS Word and MS Visio
documentation wizards. X-Analysis allows technical analysts to navigate graphically
through an IBM i application from a Windows PC. Working in a true client-server mode, XAnalysis automatically cross-references databases and ensures that the display is always
up-to-date and a true representation of the application on the IBM i.
PREREQUISITES
Before starting this tutorial, the following are required:
The X-Analysis server and the Client components should be installed to an IBM i server
and a Windows PC, respectively.
The demo library – XAN4CDEM, and its cross-reference library – XAN4CDXA, should
be successfully restored on the IBM i.
ACRONYMS USED IN THIS DOCUMENT
Feature
Full Name
APD
Access Path Diagram
DFD
Data Flow Diagram
DMD
Data Model Diagram
FFD
File Field Details
SCD
Structure Chart Diagram
HSC
Hierarchical Structure Chart
PSC
Program Structure Chart
X-Analysis Professional 11.1
© 2015 Fresche Legacy Inc.
Page 5
Impact Analysis & Graphical Documentation
Impact Analysis & Graphical Documentation
Continual technical enhancements, syntax, variations in programming styles, financial and
time constraints, absence of original application designers, and/or monolithic application
codes are some reasons that necessitate changes in the existent application designs.
System analysts or software professionals must be equipped with the technological
knowhow for redesigning business applications.
The X-Analysis toolset meets the requirements mentioned above. It is patterned to
convert all IBM i applications into the latest format. This software suite has precise tools
for conducting advanced application and documentation tasks.
This chapter covers Impact Analysis and Graphical Documentation. The features and
options discussed here provide prompt and automated documenting and computing
solutions.
CHRONOLOGY OF FEATURES
The Analysis & Documentation solution set is a sophisticated tool for instant and
automated cross-referencing, impact analysis and graphical documentation of Synon/2E,
RPG, and COBOL applications. All the functionality above (and more) is contained in the
following separate features, explained in this chapter:
Feature
Brief Description
Work with Objects
A list of all the objects in a chosen application or application area.
Object Where Used
A list of all usage references for an object.
Export List to PDF/MS Word or
MS Excel
The option to export data to MS Excel or a PDF/MS Word.
Data Flow Diagram
An interactive, colour-coded bus routing block diagram for displaying an object
relationship within an application.
Variable Where Used
A list of all instances of the specified variable in the application.
Structure Chart Diagram
A graphical display that shows program-to-program relationships.
Detailed Structure Chart
Diagram
A graphic display that shows program-to-program relationships with files used
by each program. It also explains each program’s generated program text.
Hierarchical Structure Chart
Diagram
Colour-coded bus routing block diagram, which enhances the visual of programto-program interrelationships. Through this, you get an exact idea of the
hierarchical set-up of the programs.
Document Manager
A utility that automatically generates structured system document in PDF / MS
Word format.
Source Browser
The interface used for system analysis, reviewing, re-factoring, maintaining, and
redeveloping in source code.
Source Browser Toolbar
The toolbar that contains a list of different options for viewing code within the
Source Browser, such as Pseudo Code and Source View Level options etc.
X-Analysis Professional 11.1
© 2015 Fresche Legacy Inc.
Page 6
Impact Analysis & Graphical Documentation
WORK WITH OBJECTS
Work with Objects displays a list of all the objects for a chosen application or application
area.
To generate the Object List for all files, double-click on the Files node available under the
application library.
X-Analysis displaying the Files node
The double-click action invokes the Work with Objects dialog with ‘Type’ set as *FILE and
‘Attribute’ as PF. The dialog is displayed on the following page:
X-Analysis Professional 11.1
© 2015 Fresche Legacy Inc.
Page 7
Impact Analysis & Graphical Documentation
Work with Objects dialog – Files
Click OK to invoke the Object List window showing all the files.
Object List window displaying all Files (PF)
The Object List window displays multiple columns. In this window, you can sort a column’s
data by clicking a column heading.
X-Analysis Professional 11.1
© 2015 Fresche Legacy Inc.
Page 8
Impact Analysis & Graphical Documentation
OBJECT WHERE USED
The Object Where Used feature generates a list of all usage references for an object.
To make an Object Where Used list for the object, locate and select the CUSF object from
the Object List. Right-click on CUSF, and select the Usage References option from the
Object Where Used submenu.
This brings up the Object Where Used list for the Usage References of CUSF.
Object Where Used window – CUSF
The Object Where Used window displays multiple columns. The Usage column displays
uses of CUSF in a particular object. The Object Where Used window also allows you to
drill down to a specific line of code and find out where an object is used.
Scroll down to the object CUSTMNT1 in the Object Where Used window displayed below:
Object Where Used with CUSTMNT1 selected
X-Analysis Professional 11.1
© 2015 Fresche Legacy Inc.
Page 9
Impact Analysis & Graphical Documentation
Double-click on the row displaying CUSTMNT1. This retrieves the source member for the
CUSTMNT1 object with the highlighted line referring to CUSF.
Drill down to an individual line for the Object Where Used Reference
EXPORT A LIST TO PDF, MS WORD OR MS EXCEL
X-Analysis provides a facility to export data from any displayed window. The window
toolbar on the Object Where Used view has an Export Options drop-down button, with
Export to PDF and Export to MS Excel as options.
Select your desired option to export the list into PDF/MS Word or Excel.
Note: You can set the export option as Export to MS Word using the X-Analysis
Preferences. For the settings to take effect, you must select/unselect the X-Ref.
If you have activated the Google Drive Export feature from X-Analysis Preferences, then
you can export the data to DOCX or XLSX format. For more details, refer to the X-Analysis
User Manual 11.1.
Export Options icon on Object Where Used
X-Analysis Professional 11.1
© 2015 Fresche Legacy Inc.
Page 10
Impact Analysis & Graphical Documentation
DATA FLOW DIAGRAM / DFD
A Data Flow Diagram or DFD is the diagrammatic representation of the data flow. A DFD
depicts all the possible interrelationships among the files and programs contained within a
particular application. A color-coded DFD simultaneously plays the dual role of showing
the data flow at high object level, besides providing contextual details regarding specific
variables and parameters passed between objects.
The DFD uses bus-routing layout, thus, allowing two benefits. One, it gives a precise idea
of where and how the entered data affects the output desired; two, it helps you visualize
how an object within an application correlates with the other objects. The diagrams
showing the data flow in neat blocks help even a non-technical user get a clear idea of the
object(s) interrelationships.
To generate the DFD, return to the Object List using the navigation arrows available on the
Eclipse toolbar. Select the object, CUSF and then choose the Data Flow Diagram option
from the context menu as shown below:
Data Flow Diagram option
This brings up the DFD for CUSF, as shown below:
X-Analysis Professional 11.1
© 2015 Fresche Legacy Inc.
Page 11
Impact Analysis & Graphical Documentation
Data Flow Diagram for CUSF
The DFD is also a graphic equivalent of the Object Where Used data. Besides the Logical
Views/Access Paths for CUSF, you can see how CUSF fits into the application (i.e. the
programs that update CUSF, programs that use CUSF as an input file and so on).
The dynamic and interactive DFD makes it easier to access other features contained within
an object. There are varied and flexible features and options like Hide/Show Objects,
Expand/Collapse Referenced Objects, View Annotation, Attributes – all of these and
more are explained in the sections ahead.
Hide/Show Objects
For a better grasp of object interrelationships, you can hide/show all objects concerning
programs. A single-click action on the icon alongside the objects enables you to hide/show
objects. In the following screenshot, the icon against Access Paths is clicked to hide
objects.
X-Analysis Professional 11.1
© 2015 Fresche Legacy Inc.
Page 12
Impact Analysis & Graphical Documentation
Hide Objects icon
Clicking the icon again displays all the objects within.
Show Objects icon
Expand/Collapse Referenced Objects
In a DFD, referenced object(s) can be expanded by selecting a particular category from the
main object box. The following screenshot displays the action to be performed:
X-Analysis Professional 11.1
© 2015 Fresche Legacy Inc.
Page 13
Impact Analysis & Graphical Documentation
Expand Referenced Objects
Clicking the arrow icon adjacent to Update Programs reveals all objects updating CUSF.
The following screenshot displays the expanded view of the referenced objects’ list:
Expanded View of Update Programs
X-Analysis Professional 11.1
© 2015 Fresche Legacy Inc.
Page 14
Impact Analysis & Graphical Documentation
View Annotation
The View Annotation option displays annotations for a specific object. A red icon
denoting annotated text is present on the right side of the Object (see the following
screenshot).
View Annotation option
Double-clicking on the View Annotation icon invokes the Annotation dialog box,
displaying the notes that were written earlier.
You can add/modify notes in the Annotation dialog box and click Save. These notes can
be viewed later using the same option.
Annotation dialog
X-Analysis Professional 11.1
© 2015 Fresche Legacy Inc.
Page 15
Impact Analysis & Graphical Documentation
Attributes
The Attributes feature comprises impacted fields of a particular object. The main object is
referenced through these fields.
Attributes icon
The different objects corresponding to the main object have fields within them. The fields
are known as ‘Attributes,’ and these are easily accessible by clicking on the Attributes
icon. The term ‘Attributes’ changes to related attribute like Input, Update, Output etc. on
expanding the Attributes button, as shown below:
Attributes Expanded
X-Analysis Professional 11.1
© 2015 Fresche Legacy Inc.
Page 16
Impact Analysis & Graphical Documentation
Detail DFD icon
Select the Detail DFD icon from the toolbar for viewing field usage of all the objects.
Detail DFD icon
When the Detail DFD icon is clicked, the ‘Attributes’ section of all the objects gets
expanded displaying the referred fields from all objects. The following screenshot displays
the detailed DFD screen:
Detailed DFD view
Legend icon
The Legend icon on the Eclipse toolbar displays the details of the color scheme used by a
DFD. Click the Legend icon shown below:
Legend icon
X-Analysis Professional 11.1
© 2015 Fresche Legacy Inc.
Page 17
Impact Analysis & Graphical Documentation
The color scheme clarifies the reference and association of specific objects with one
another.
Legend expanded
VARIABLE WHERE USED
This option is specifically useful for conducting impact analysis. It returns all source lines,
where field/variable of a file or program is used and/or referenced, in any of the source
members. The source members searched also include device files and copybooks.
From the DFD for CUSF, search and select the OE002 object. We can clearly see that the
fields used by CUSF are CUSNO and PRPCDE. Select CUSNO and opt for Variable Where
Used from the context menu, as shown below:
Variable Where Used option for CUSNO
Select All References to invoke the Variable Where Used window for the CUSNO field.
X-Analysis Professional 11.1
© 2015 Fresche Legacy Inc.
Page 18
Impact Analysis & Graphical Documentation
Variable Where Used window for CUSNO
The window displayed above lists all references of CUSNO field from the entire
application.
The Default View Level icon is located on the X-Analysis toolbar, and the menu allows
access to six levels of Variable Where Used information.
Default View Level icon
The following image shows the expanded View Level menu in the Variable Where Used
window:
Expanded View Level Menu
X-Analysis Professional 11.1
© 2015 Fresche Legacy Inc.
Page 19
Impact Analysis & Graphical Documentation
The Default View Level for the Variable Where Used option can be set in the
X-Analysis Preferences (General Preferences) window.
As an example, let us test the View Levels for the CUSNO field.
Level 1: Level 1 lists all direct references to the CUSNO field.
Variable Where Used – View Level 1
Level 2: Level 2 adds extra indirect references, “one reference removed,” to the Level 1
list. For example, CUSTOMER is set equal to CUSNO (a direct reference), and then
CUSTOMER is a variable in the statement “IF CUSTOMER = ZEROES” (a one reference
removed indirect reference).
X-Analysis Professional 11.1
© 2015 Fresche Legacy Inc.
Page 20
Impact Analysis & Graphical Documentation
Variable Where Used – View Level 2
Level 3: Level 3 builds on the Level 2 references, adding indirect references that are “one
further reference removed.”
X-Analysis Professional 11.1
© 2015 Fresche Legacy Inc.
Page 21
Impact Analysis & Graphical Documentation
Level 4/Parameters: Level 4 further includes fields used as parameters. For example, in
the statement “CALL LETN (&CUSNO &PREFIX &LETSQ)”, CUSNO is a parameter to call
LETN.
Variable Where Used – View Level 4
Level 5/Cascading Parameters: Extending the information in Level 4, Level 5 includes
references where CUSNO fields are parameters in a function, called by another function.
Maximum Tracking: Tracks the usage of a variable or a field to its maximum level of
indirection.
This is the highest view level, also referred to as ‘Maximum Tracking’. It displays Variable
Where Used information for all the levels mentioned above, as well as any other possible
references of the CUSNO field.
The Variable Where Used option can be opted over a large variety of items including:
Files, Array Definitions, Data Structures, Sub-Fields of a Data Structure, Indicators, Key
Lists, Data Fields, File Formats, Subroutines, Program Variable, Array Elements, Parameter
Lists, Parameters, Key Fields, Message Ids, EXCPT Names, etc.
STRUCTURE CHART DIAGRAM / SCD
In order to interpret the application design it is important to have an idea of how the
control transfers from one program to the next. The Structure Chart Diagram or SCD
addresses this need by presenting a graphical diagram. It contains relevant information as
per control flow and call structure. In addition, the data input objects and the summarized
description of each object can be viewed. Important functional aspects like updates,
prints, and displays are color coded to help you quickly focus on these commonlypreferred details.
To create an SCD, select the OE002 object from the DFD for CUSF.
X-Analysis Professional 11.1
© 2015 Fresche Legacy Inc.
Page 22
Impact Analysis & Graphical Documentation
Double-click on an object to bring up its DFD
The DFD for OE002 will be displayed as shown below:
Data Flow Diagram for OE002
Select OEMENU and opt for Structure Chart Diagram from the context menu.
Context menu on DFD object
X-Analysis Professional 11.1
© 2015 Fresche Legacy Inc.
Page 23
Impact Analysis & Graphical Documentation
The SCD is a nested tree diagram that displays the complete call hierarchy of the
‘programs called.’
SCD for OEMENU
The normal view of an SCD is shown above. The Legend button available on the toolbar
helps to interpret the different colors used in the SCD.
X-Analysis also allows annotation on the Structure Chart.
SCD Legend
Select an object displayed in the SCD and opt for the Annotate
option from the context menu.
X-Analysis Professional 11.1
© 2015 Fresche Legacy Inc.
Page 24
Impact Analysis & Graphical Documentation
Annotate option
This brings up the Annotation dialog. Write your note and click Save. The annotation is
stored in a file available in the cross-reference library.
Annotation dialog for OEMENU
Regenerate the SCD to check for any object annotations.
Annotation icon for OEMENU in a re-generated SCD
(Double-click on the Annotation icon to bring up the Annotation dialog).
X-Analysis Professional 11.1
© 2015 Fresche Legacy Inc.
Page 25
Impact Analysis & Graphical Documentation
DETAILED STRUCTURE CHART
The SCD in detailed format displays the files used by each program, together with each
program’s generated program text. (X-Analysis automatically recovers the generated
program text which describes the purpose of the listed programs.)
To generate the Detailed SCD, click the Show Narratives icon.
Show Narratives icon on toolbar
After clicking the icon, the following window will open, displaying the details.
Detailed SCD
The Show Narratives icon has toggle behavior. Click it again (Normal SCD icon) to return
to the normal view of the Structure Chart.
Note: The Structure Chart Diagram can be limited by level as well as volume. This is
applicable to the interactive mode of SCDs. You need to set the ‘Preferred Volume Limit’
through the X-Analysis General Preferences dialog.
X-Analysis Professional 11.1
© 2015 Fresche Legacy Inc.
Page 26
Impact Analysis & Graphical Documentation
HIERARCHICAL STRUCTURE CHART
The Hierarchical Structure Chart offers a different layout for viewing the SCD. The HSC
layout is a precise view of all the programs representing their control flow and call
structure through neatly color-coded bus routing block diagrams. Select the Hierarchical
Structure Chart option from the context menu over OEMENU from the SCD.
Hierarchical Structure Chart option
The following image shows the delineation of the main object – OEMENU into several
blocks of related objects in the order of calling. The color codes indicate whether an
object is command-based or input-based, or print-based and so on.
X-Analysis Professional 11.1
© 2015 Fresche Legacy Inc.
Page 27
Impact Analysis & Graphical Documentation
Hierarchical Structure Chart – OEMENU
X-Analysis Professional 11.1
© 2015 Fresche Legacy Inc.
Page 28
Impact Analysis & Graphical Documentation
Narration
You can access additional details of a specific object through the Narratives icon shown
below.
Narratives icon
After clicking the icon, a window will appear, providing the auto-generated narration for
the program.
Narration – Pop-up window
Referred Files
The HSC has a feature to display referred files inline. An expandable icon called Referred
Files is available in each box as shown in the image below.
X-Analysis Professional 11.1
© 2015 Fresche Legacy Inc.
Page 29
Impact Analysis & Graphical Documentation
Referred Files icon
Clicking on this icon displays the Referred Files of OE001. The color-coded geometric
shape before the file name indicates the file type.
Referred Files – Expanded
X-Analysis Professional 11.1
© 2015 Fresche Legacy Inc.
Page 30
Impact Analysis & Graphical Documentation
Show Root Node
When the Show Root Node icon is clicked, the root node gets displayed:
Show Root Node icon
Legend
The Legend icon on the toolbar shows the color scheme used by the HSC. This color
scheme helps to understand the reference and association of specific objects.
Legend icon
Click the icon to expand the Legend.
Legend Expanded
X-Analysis Professional 11.1
© 2015 Fresche Legacy Inc.
Page 31
Impact Analysis & Graphical Documentation
DOCUMENT MANAGER
One of the most powerful functionalities of X-Analysis is its ability to automatically
generate structured documentation. The built-in Document Manager facilitates the
generation of PDF/MS Word documents containing the system design information of
selected objects.
First, mark the objects for documentation using the Mark for Documenter option from
the context menu over OEMENU.
Mark for Documenter option
The Mark all for Documenter option is also available under the X-Analysis menu. Using
this option will flag all objects displayed in the diagram.
X-Analysis Menu
X-Analysis Professional 11.1
© 2015 Fresche Legacy Inc.
Page 32
Impact Analysis & Graphical Documentation
The ‘Mark all for Documenter’ option is available for all diagrams and lists.
Next, navigate back to the Object List window using the back arrow on the Eclipse toolbar
and select CUSF.
Then, select the Mark for Documenter option from the context menu on CUSF.
Mark for Documenter option on CUSF
Click the Documenter icon on the toolbar to begin the documentation process.
Documenter icon
This invokes the Document Manager dialog.
X-Analysis Professional 11.1
© 2015 Fresche Legacy Inc.
Page 33
Impact Analysis & Graphical Documentation
X-Analysis – Document Manager dialog
The Document Manager dialog lists all the marked objects for documentation. Use the
Move Up / Move Down / Delete / Delete All buttons to organize Objects/Members on the
documenter list.
The Invert Selection button on the Document Manager dialog unselects the selected
objects and selects all the un-selected objects.
After organizing the listed objects, click Generate Document. This invokes the
Documenter Wizard as shown on the following page.
X-Analysis Professional 11.1
© 2015 Fresche Legacy Inc.
Page 34
Impact Analysis & Graphical Documentation
System Documentation Wizard – Type and Location
The Type and Location dialog consists of two sections:
System Documentation type
Document Details
The System Documentation type section provides options to generate the following types
of documents:
Generate Single System Document: Generates a single PDF/MS Word document.
Generate Individual System Documents: Generates a PDF/MS Word document for
each object.
X-Analysis Professional 11.1
© 2015 Fresche Legacy Inc.
Page 35
Impact Analysis & Graphical Documentation
Generate System Documents using previous values: Generates system
documentation using the options selected in previous instance of system
documentation. (This option is only available for generated system documents.)
Select the Generate Single System Document option.
The Document Details section specifies the Document Title, generated system document
Name and its location. You can choose a different file name for the generated PDF/MS
Word document and a different location to save the generated document.
Click Next.
System Documentation Wizard – Specify Contents
X-Analysis Professional 11.1
© 2015 Fresche Legacy Inc.
Page 36
Impact Analysis & Graphical Documentation
Choose the features or attributes to be included in the System Document as shown in the
above screenshot.
Click Next.
System Documentation Wizard – Specify Sequence
Confirm the sequence of the selected features and click Next.
X-Analysis Professional 11.1
© 2015 Fresche Legacy Inc.
Page 37
Impact Analysis & Graphical Documentation
System Documentation Wizard – Finish
Choose the appropriate paper size and contention resolution options. Click Finish. This will
end the configuration process and start the generation of the document.
After the document generation is complete, the following dialog appears:
X-Analysis Professional 11.1
© 2015 Fresche Legacy Inc.
Page 38
Impact Analysis & Graphical Documentation
System Documentation Completion dialog
Click Yes to open the generated document.
To view a previously generated document, select the Open Application Folder option
from the X-Analysis menu.
Open Application Folder option
This will open the Application Folder containing the previously generated documents.
Double-click on a generated document to open it.
X-Analysis also creates a log file in the Application Folder which logs what the ‘Document
Generator’ does in the process of documenting the selected objects.
X-Analysis Professional 11.1
© 2015 Fresche Legacy Inc.
Page 39
Impact Analysis & Graphical Documentation
Application Folder containing the generated documents
System document – TOC
X-Analysis Professional 11.1
© 2015 Fresche Legacy Inc.
Page 40
Impact Analysis & Graphical Documentation
System Document – Legends
X-Analysis Professional 11.1
© 2015 Fresche Legacy Inc.
Page 41
Impact Analysis & Graphical Documentation
System Document – Selected Options
System Document – Object List
X-Analysis Professional 11.1
© 2015 Fresche Legacy Inc.
Page 42
Impact Analysis & Graphical Documentation
System Document – Access Paths
System Documentation – DFD Annotation
X-Analysis Professional 11.1
© 2015 Fresche Legacy Inc.
Page 43
Impact Analysis & Graphical Documentation
System Document – DFD
X-Analysis Professional 11.1
© 2015 Fresche Legacy Inc.
Page 44
Impact Analysis & Graphical Documentation
System Document – Index
SOURCE BROWSER
The Source Code of the application is the key to the process of analyzing, reviewing, refactoring, maintaining, or re-developing a system. X-Analysis supports some very
advanced features in its Source Browser.
Double-click on the Programs node to get the Object List for all programs available in the
application library.
Programs node
The Work with Objects dialog for *PGM object type will be invoked.
X-Analysis Professional 11.1
© 2015 Fresche Legacy Inc.
Page 45
Impact Analysis & Graphical Documentation
Work with Objects dialog – Programs
Click OK to generate the list of program objects.
Object List – Programs
Double-click the CB906R program. This will call its Source Browser view.
X-Analysis Professional 11.1
© 2015 Fresche Legacy Inc.
Page 46
Impact Analysis & Graphical Documentation
Source Browser view displaying the CB906R source
SOURCE BROWSER TOOLBAR
The Source Browser toolbar is displayed below:
Source Browser toolbar
The toolbar consists of the following options:
Source Options
Screen Components
Source Outline
Screen/Report Design
Show Split Panel
Zoom in Lpex (available on
WDSc/RDi only)/SEU option
(Set XA Preferences to select
the appropriate option)
Pseudo Code
Source Level
More Info
Diagram Options
Export Options
Generate UML
Print
Flowchart
View Code
X-Analysis Professional 11.1
© 2015 Fresche Legacy Inc.
Page 47
Impact Analysis & Graphical Documentation
Source Options
Use the Source Options menu to view various source modes. The Normal Source Code is
the default source view.
Source Options
Note: Source Options related to Business Rules will be only available to customers who
have purchased the X-Rules module.
Indented Source Code view
Select the Indented Source Code option from the Source Options menu. This displays the
Indented Source Code view.
Indented Source Code
Select the Normal Source Code option to return to the normal source code view.
X-Analysis Professional 11.1
© 2015 Fresche Legacy Inc.
Page 48
Impact Analysis & Graphical Documentation
Source Outline
The Source Outline option displays an outline of the source member. This view lists all the
subroutines available in the code.
Source Outline option
Double-click on any of the listed subroutines. This positions the cursor on the subroutine
inside the source browser.
Source Outline view of CB906R
Pseudo Code
The Pseudo Code (or the structured English view) is meant to help a non-technical user
understand the code in a better manner. Click the Pseudo Code option on the toolbar.
Pseudo Code option
This invokes the Pseudo Code view.
X-Analysis Professional 11.1
© 2015 Fresche Legacy Inc.
Page 49
Impact Analysis & Graphical Documentation
Pseudo Code window
The Pseudo Code icon has a behavior toggle. Click it again to return to the Normal Source
Code.
Source Level
The Source Level icon is to access different view levels to view specific type of source
lines. It enhances the understanding of the code. The default source level is ‘5’.
Source Levels
For instance, if you switch the source level to View Level 1, it restricts the Source List from
displaying comments and only allows for call operations.
X-Analysis Professional 11.1
© 2015 Fresche Legacy Inc.
Page 50
Impact Analysis & Graphical Documentation
Source List at View Level 1
View Level 2 includes File Operations.
View Level 3 includes Program Structure Operations.
View Level 4 includes Field Operation.
View Level 5 includes the Commented Out & Excluded codes.
Flowchart
One way to view a program source code is to check the execution model of that program
through the Data Flowchart. Select the Flowchart option from the source browser.
Flowchart option
This generates the program flowchart in MS Visio, as shown in the following page.
X-Analysis Professional 11.1
© 2015 Fresche Legacy Inc.
Page 51
Impact Analysis & Graphical Documentation
Flowchart in MS Visio
Note that the Flowchart option creates an individual flowchart for each subroutine. The
first page of the flowchart displays the processing for the Main Procedure. From the Main
Procedure, you can jump to any of the subroutines available in the program.
X-Analysis Professional 11.1
© 2015 Fresche Legacy Inc.
Page 52
Impact Analysis & Graphical Documentation
Jump option on the Flowchart
As shown above, click the Jump to subroutine $PV001 option to switch to the flowchart
for the subroutine $PV001.
The related screenshot is shown on the following page.
X-Analysis Professional 11.1
© 2015 Fresche Legacy Inc.
Page 53
Impact Analysis & Graphical Documentation
Subroutine Flowchart
OTHER OPTIONS ON THE SOURCE BROWSER
There are several other options available on the source browser toolbar. To understand
these, open the source browser for the program, OE008.
Locate and select OE008 from the Object List. Bring up its context menu by right-clicking,
and then choose the Zoom Source option from it.
Context menu on OE008 – Zoom Source option
This brings up the Source Browser.
X-Analysis Professional 11.1
© 2015 Fresche Legacy Inc.
Page 54
Impact Analysis & Graphical Documentation
Source Browser for OE008
Other important options available on the source browser are:
Member X-Reference
On the source browser for OE008, select the line number 0022.00 with indicator *IN03.
Right-click for the context menu on *IN03, and select the Member X-Ref option.
Member X-Ref option
This displays the Member X-Ref view for the selected variable, *IN03. The Member X-Ref
view lists all source lines where the selected Field/Variable has been used/referenced.
Member X-Ref window
X-Analysis Professional 11.1
© 2015 Fresche Legacy Inc.
Page 55
Impact Analysis & Graphical Documentation
Jump to Subroutine
Through the source browser, you can jump to a subroutine. Double-click on one of the
subroutines in the source browser for OE008.
Select subroutine for Jump action
Double-click on $RVCUS to position the cursor at the beginning of the subroutine, $RVCUS.
Highlighted first line of the subroutine
Click the back navigation arrow to return to the line where the $RVCUS subroutine is
called.
Program Structure Chart
The Program Structure Chart option provides a different way of looking at the program
structure.
A PSC graphically displays the sequence of calls in the program. Click the option from the
Diagram Options dropdown menu on the Source Browser toolbar.
X-Analysis Professional 11.1
© 2015 Fresche Legacy Inc.
Page 56
Impact Analysis & Graphical Documentation
Program Structure Chart option
When this option is selected, a diagram appears displaying the PSC for that program.
Program Structure Chart for OE008
The PSC presents each subroutine as a small grey rectangle displaying the name of each
subroutine. The object type i.e. the Function Type determines the coloring of all other
shapes, Programs, Modules, and Service Programs.
(Boxes, other than the subroutines, are the same size of a program element as used in the
Structure Chart Diagram).
On the PSC, double-click on a subroutine. This initiates the Source Browser for the OE008
program with the particular subroutine selected.
X-Analysis Professional 11.1
© 2015 Fresche Legacy Inc.
Page 57
Impact Analysis & Graphical Documentation
PSC with the selected subroutine
The source browser for OE008 with the selected $RVCUS subroutine is shown below:
Source Browser for OE008 with the selected subroutine
Zoom Source to Files defined in File Specification
The selected program OE008 has files defined in the File Specification.
Files listed in OE008 source
X-Analysis Professional 11.1
© 2015 Fresche Legacy Inc.
Page 58
Impact Analysis & Graphical Documentation
Browse the source codes of the associated files by double-clicking on them. Alternatively,
select any file from the source browser and opt for the Zoom Source option from the
context menu. In this case CUSFL3 is selected.
Source Browser for CUSFL3
Further drill down to the source code of the associated PFILE (CUSF) of the LF, CUSFL3.
PFILE selected on the Source Browser for CUSFL3
Double-click on CUSF to invoke the Source Browser for it.
Source Browser for CUSF
X-Analysis Professional 11.1
© 2015 Fresche Legacy Inc.
Page 59
Impact Analysis & Graphical Documentation
The Source Browser display helps to navigate and drill down to various related features,
thus, facilitating the overall browsing and understanding of the application.
Bring up the OE008 source browser to become familiar with some more features.
Screen/Report Design
Most of the application programs interact either with the display files (DSPFs) or the
printer files (PRTFs). The Source Browser provides a feature to view layout of the
associated display/printer files.
This feature does not require the execution of an actual program.
Click the Screen/Report Design icon available on the Source Browser.
Screen/Report Design option on the Source Browser
This brings up the Screen/Report Design window for the OE008 program.
Screen/Report Design window for OE008
Navigate back to the Source Browser for OE008 using the back navigation arrow.
X-Analysis Professional 11.1
© 2015 Fresche Legacy Inc.
Page 60
Impact Analysis & Graphical Documentation
Zoom in SEU/Lpex Editor
Lpex Editor
Make changes to the source code using the Zoom in Lpex option. Click the Zoom in Lpex
icon available on the Source Browser toolbar.
Zoom in Lpex option on the Source Browser
This invokes the Lpex editor from within the X-Analysis Perspective.
SEU
Make changes to the source code using the SEU option. Click the SEU icon available on the
Source Browser toolbar.
SEU option on the Source Browser
‘Zoom in Lpex’ is a default option for all IBM Rational products having an RSE plugin. For
all other Eclipse products, SEU (5250 Emulator) is the default option. You can change the
default settings using the X-Analysis ‘General Preferences’ option. Creating an SEU (5250
Emulator) session requires the XAN4SEU IBM i user. Please refer to the Appendix for
creating the XAN4SEU user.
The X-Analysis Plugin comes with default preference settings. To change the preference
settings, start IBM's RDi / RDp / WDSC/ or Eclipse 3.4 (and above), then select Window >
Preferences to display the Preferences dialog.
X-Analysis Professional 11.1
© 2015 Fresche Legacy Inc.
Page 61
Impact Analysis & Graphical Documentation
Preferences option
To view / modify various X-Analysis Preferences, select the X-Analysis node.
General X-Analysis Preferences Settings
X-Analysis Professional 11.1
© 2015 Fresche Legacy Inc.
Page 62
Relational Data Model Extraction for IBM i
Relational Data Model Extraction for IBM i
Configuring the design of an application depends on an accurate data model.
X-Analysis features the advanced capability of automatically extracting data model from
an RPG/COBOL-based application. The data model derived through X-Analysis is viewable
as an interactive diagram. The software extends the benefit of perusing the file-centric or
application area specific filtering of the diagram.
This section highlights the importance of understanding an application design and
describes how the Data Modelling solution set helps in deciphering complicated codes of
databases, thereby, making data maintenance and development work a less cumbersome
process.
Feature
Brief Description
Data Model Diagram
Diagram which displays file relationships for an application or an application area.
LFs/Access Paths
Displays all access paths related to a specific file.
File Field Details
Displays the field details of a specific file.
Access Path Diagram
Diagram which displays all access paths belonging to a specific file.
View Data
Displays actual records held in the PFs.
X-Analysis Professional 11.1
© 2015 Fresche Legacy Inc.
Page 63
Relational Data Model Extraction for IBM i
The Data Modelling solution set is an add-on module dedicated to data model extraction.
Prior to analyzing a legacy system, it is important for you to understand the application
design. An analyst looks for the Data Model information of the legacy system, which forms
the foundation of the application design.
In the context of X-Analysis, the term Data Model refers not only to the physical model of
a database design but also to the foreign key or the relational model.
X-Analysis automatically derives an explicit physical and logical data model by analyzing
both the actual data and the programs that use that data, and thus verifies the existence
of any potential cross-file relationships. It performs an integrity check to ensure that all
data from dependent file validly refers to the data records from the owning file.
A complete data model that accurately describes all possible relationships among the files
is essential for productive maintenance and development work. Such a model also
provides a foundation to automate critical data administration tasks such as referential
integrity testing and test data extraction.
The graphical representation of automatically generated Data Model information in XAnalysis is a Data Model Diagram. The Data Model Diagram displays file relationships for
an application or an application area.
GENERATING DATA MODEL DIAGRAM
Double-click on the Data Model Diagram node under the cross-reference library,
XAN4CDXA.
Data Model Diagram option
This invokes the Data Model Diagram dialog as shown below:
X-Analysis Professional 11.1
© 2015 Fresche Legacy Inc.
Page 64
Relational Data Model Extraction for IBM i
Data Model Diagram dialog
It prompts you to input the following:
1. Application Area Name (leave it as *NONE)
2. Object Name (leave it as *ALL)
3. DMD Data Options to Display External Relationships (available only when the
DMD is opted on an Application Area) or Show unrelated files.
Click OK to generate the Data Model Diagram for the entire application.
X-Analysis Professional 11.1
© 2015 Fresche Legacy Inc.
Page 65
Relational Data Model Extraction for IBM i
Data Model Diagram for XAN4CDXA
The Data Model Diagram or DMD displayed above consists of two halves. The upper half is
the DMD and the lower half is the DMD Details view. The DMD is the graphical
representation of the derived data model information.
The DMD toolbar has a Legend icon. The different colors on the Legend drop-down
convey the type of association represented by the colored lines connecting various files.
DMD Legend
X-Analysis Professional 11.1
© 2015 Fresche Legacy Inc.
Page 66
Relational Data Model Extraction for IBM i
With the help of the DMD Legend, you can easily understand the relations displayed on
the DMD.
The DMD Details view displays the Files Connection Details. On the DMD Details view, the
Relation Type column states the relationship between the files in the Dependent File
column and the files in the ‘Parent File’ column. The ‘Dependent Fields’ and the ‘Parent
Fields’ columns list the fields which relate to the ‘Dependent File’ and the ‘Parent File‘,
respectively.
The DMD Details list displays actual names of the listed Files and Fields. The DMD details
list provides a toggle button, Show Description, to switch the DMD details list to display
the description of the listed Files and Fields.
DMD Details view with Show Description icon
Click the Show Description icon to see descriptive names for all the files and the fields.
DMD Details view with Description
Click the Hide Description icon to switch back the DMD Details list to the actual names
mode.
DMD Details view with Hide Description icon
X-Analysis Professional 11.1
© 2015 Fresche Legacy Inc.
Page 67
Relational Data Model Extraction for IBM i
Let us consider another aspect of the DMD. A single-click on an object displays the
references of that object with the other objects in the DMD. Click on CUSF to view its
references.
Data Model Diagram with the selected object, CUSF
The screen above displays relations for CUSF. This helps you understand all the
relationships for the selected object. Another way of understanding file relations for any
specific file is to have a file-specific Data Model Diagram. A file-specific DMD displays the
data model information for a given file only. Double-click on CUSF to get the file-specific
DMD.
X-Analysis Professional 11.1
© 2015 Fresche Legacy Inc.
Page 68
Relational Data Model Extraction for IBM i
File-specific DMD for CUSF
The DMD displayed above is the file-specific DMD for CUSF. It only contains objects
related to CUSF. Furthermore, the DMD Details list displays only those relationships
related to CUSF.
With the help of a file-specific DMD, you can view relationships between any available
files. These relationships can be understood better after reading View Data section.
LFS/ACCESS PATHS
Select the LFs/Access Paths option for a file from the DMD. The LFs/Access Paths option
shows all access paths associated with a selected file.
Select CUSF, and then choose the LFs/Access Paths option from the context menu.
X-Analysis Professional 11.1
© 2015 Fresche Legacy Inc.
Page 69
Relational Data Model Extraction for IBM i
LFs/Access Paths option on DMD
This brings up the Access Paths list.
LFs/Access Paths for CUSF
FILE FIELD DETAILS/FFD
You need more details of a particular file to gain wholesome understanding of the data
model of an existing application. A particular file may consist of several fields. The File
Field Details option helps you here. Select the option from the context menu to gain easy
access to particular field details of a selected file, CUSF.
X-Analysis Professional 11.1
© 2015 Fresche Legacy Inc.
Page 70
Relational Data Model Extraction for IBM i
File Field Details option
A new window appears displaying File Field Details information.
File Field Details for CUSF
ACCESS PATH DIAGRAM/APD
The Access Path Diagram is a graphical presentation of all the access paths related to a
specific file. Generate the diagram by selecting the Access Path Diagram option from the
context menu over a selected file, CUSF.
X-Analysis Professional 11.1
© 2015 Fresche Legacy Inc.
Page 71
Relational Data Model Extraction for IBM i
Access Path Diagram option on DMD
This brings up the APD for CUSF.
Access Path Diagram for CUSF
Go back to the DMD displaying the file-specific DMD for CUSF.
X-Analysis Professional 11.1
© 2015 Fresche Legacy Inc.
Page 72
Relational Data Model Extraction for IBM i
VIEW DATA
You can also view file records from the data model of an application. Select the View Data
option to view the actual records held in PFs. The option is available on all the objects
displayed in the DMD.
View Data option on the DMD object
Data View for CUSF
Record Display
The View Data window lists records for a selected file. Double-click on a record to display
the complete record.
In this example, if you double-click on Bertwhistle & Company Ltd., the record display
along with its dependent files data will appear.
X-Analysis Professional 11.1
© 2015 Fresche Legacy Inc.
Page 73
Relational Data Model Extraction for IBM i
Record Display with Dependents
The tab at the bottom displays dependent file data.
ACCESSES/OWNS/REFERS TO relationships for CUSF in the DMD.
These
are
any
On the record display, the Descriptors button displays the ACCESSED BY/REFERS TO
relationships. This is similar to a JOIN to a foreign file, to get the description for the code
used from the Master/Owning file.
Descriptors button on Record Display
Click on the Descriptors button to invoke the following window:
X-Analysis Professional 11.1
© 2015 Fresche Legacy Inc.
Page 74
Relational Data Model Extraction for IBM i
Window presenting Descriptors from Master/Owning file
DATA MODEL DIAGRAM – APPLICATION AREA SPECIFIC
The DMD for an application area represents relationships among the related objects that
belong to that application area only. Select the Data Model Diagram option for the
application area – MVCPROCESS.
Data Model Diagram option from the Application Area Diagram
This invokes the Data Model Diagram dialog for the application area – MVCPROCESS.
X-Analysis Professional 11.1
© 2015 Fresche Legacy Inc.
Page 75
Relational Data Model Extraction for IBM i
Data Model Diagram dialog for an application area
Click OK to generate the DMD for the selected application area.
Data Model Diagram for an application area (Restricted)
X-Analysis Professional 11.1
© 2015 Fresche Legacy Inc.
Page 76
Relational Data Model Extraction for IBM i
The DMD displayed above is a restricted Data Model and it only displays the objects which
belong to the application area – MVCPROCESS.
The toolbar on the DMD has an option to generate the unrestricted DMD. Click the
Unrestrict To Application Area icon.
Unrestrict To Application Area icon
The following window will be displayed.
Data Model Diagram for Application Area (Unrestricted)
Note: The objects displayed in blue are the ones which do not belong to the application
area, MVCPROCESS.
While using the ‘Restrict To Application Area’ feature, ensure that the originally-selected
application area remains the same.
X-Analysis Professional 11.1
© 2015 Fresche Legacy Inc.
Page 77
What’s Next
What’s Next
Over two decades of dedicated research and development has rewarded us with a
sophisticated software solution like X-Analysis. Built to meet the requirements of
advanced computing and analysis, X-Analysis and its varied features make it easy to
understand how a legacy application works. We also experienced how X-Analysis helps in
analyzing one big application as smaller logical business areas. Its enhanced Data
Modelling feature not only exposes the Business Rules implicit in the data and the process
models of an application, but also digs out the vast amount of business logic buried inside
the source code of the programs.
Today, we are at that exciting phase from where we can look forward to being more
progressive and introduce futuristic Re-engineering or Re-architecting tools and solutions.
The X-RPG/2E Modernize module is one such innovate.
As we already know, X-Analysis dissects legacy application programs to decouple screens
from embedded business logic. This componentization can be leveraged by the X-RPG/2E
Modernize module to generate JSFs, JavaBeans and ORM objects, thereby assisting in rearchitecting a legacy application in J2EE.
Having seen the X-Analysis solution set in action, you are now equipped to get on with the
application redevelopment.
X-Analysis Professional 11.1
© 2015 Fresche Legacy Inc.
Page 78
Appendix – Enabling the SEU Interface
Appendix – Enabling the SEU Interface
CREATE USER PROFILE – XAN4SEU
When browsing source code using the IBM i (AS400) SEU, it is necessary to be logged in as
XAN4SEU user. The following are instructions for creating the correct user profile.
Step 1
Login as QSECOFR.
Step 2
Create XAN4SEU user profile.
Use the CRTUSRPRF command to create the XAN4SEU user profile. Make sure that the
following parameters are set:
User Password
:
XAN4SEU
User Class
:
*PGMR
Initial Program
:
XSEUCLP
Library
:
XAOBJ
Create User Profile (CRTUSRPRF)
Type choices, press Enter.
User profile . . . . . .
User password . . . . .
Set password to expired
Status . . . . . . . . .
User class . . . . . . .
Assistance level . . . .
Current library . . . .
Initial program to call
Library . . . . . . .
Initial menu . . . . . .
Library . . . . . . .
Limit capabilities . . .
Text 'description' . . .
F3=Exit
F4=Prompt
F24=More keys
X-Analysis Professional 11.1
.
.
.
.
.
.
.
.
.
.
.
.
.
.
.
.
.
.
.
.
.
.
.
.
.
.
.
.
.
.
.
.
.
.
.
.
.
.
.
.
.
.
.
.
.
.
.
.
.
.
.
.
F5=Refresh
> XAN4SEU
Name
*USRPRF
Name, *USRPRF, *NONE
*NO
*NO, *YES
*ENABLED
*ENABLED, *DISABLED
> *PGMR
*USER, *SYSOPR, *PGMR...
*SYSVAL
*SYSVAL, *BASIC, *INTERMED...
*CRTDFT
Name, *CRTDFT
> XSEUCLP
Name, *NONE
>
XAOBJ
Name, *LIBL, *CURLIB
MAIN
Name, *SIGNOFF
*LIBL
Name, *LIBL, *CURLIB
*NO
*NO, *PARTIAL, *YES
> 'X-Analysis – SEU User'
F12=Cancel
More...
F13=How to use this display
© 2015 Fresche Legacy Inc.
Page 79
Appendix – Enabling the SEU Interface
PRESS F10 AND PAGE DOWN
Set Special Authorities:
*ALLOBJ
*JOBCTL
*SAVSYS
Change User Profile (CHGUSRPRF)
Type choices, press Enter.
Additional Parameters
Special authority
. . . . . . .
Special environment . . . .
Display sign-on information
Password expiration interval
Limit device sessions . . .
Keyboard buffering . . . . .
Maximum allowed storage . .
Highest schedule priority .
Job description . . . . . .
Library . . . . . . . . .
Group profile . . . . . . .
F3=Exit
F4=Prompt
F24=More keys
Step 3
.
.
.
.
.
.
.
.
.
.
.
.
.
.
.
.
.
.
.
.
F5=Refresh
*ALLOBJ
*JOBCTL
*SAVSYS
*SYSVAL
*SYSVAL
*SYSVAL
*SYSVAL
*SYSVAL
*NOMAX
3
QDFTJOBD
QGPL
*NONE
F12=Cancel
*SAME, *USRCLS, *NONE...
*SAME, *SYSVAL, *NONE, *S36
*SAME, *NO, *YES, *SYSVAL
1-366, *SAME, *SYSVAL, *NOMAX
*SAME, *NO, *YES, *SYSVAL
*SAME, *SYSVAL, *NO...
Kilobytes, *NOMAX
0-9
Name
Name, *LIBL, *CURLIB
Name, *NONE
More...
F13=How to use this display
Log off
CREATING MACRO OF XAN4SEU
Macros allow you to automatically sign on for XAN4SEU, and seamlessly work with the
SEU option. So, it is necessary to verify whether the XAN4SEU macro has been created. If
not, then record this macro using the following steps:
Step 1: Press the Start Recording button. The Record Macro/Script as dialog will be
displayed. Sign on with the XAN4SEU user profile.
X-Analysis Professional 11.1
© 2015 Fresche Legacy Inc.
Page 80
Appendix – Enabling the SEU Interface
Step 2: On the Sign On screen, enter the User Profile – XAN4SEU. Press Tab and enter the
Password also as XAN4SEU.
Press ENTER.
The IBM i Main Menu screen will be displayed:
X-Analysis Professional 11.1
© 2015 Fresche Legacy Inc.
Page 81
Appendix – Enabling the SEU Interface
Step 3: Stop the recording by selecting the Stop Recording Macro option from the Actions
submenu or clicking the related button directly from the toolbar.
X-Analysis Professional 11.1
© 2015 Fresche Legacy Inc.
Page 82
Index
Index
2E, 2, 6
Access Path Diagram, 5, 63, 71, 72
Access Paths, 11, 12, 42, 63, 69, 70
All References, 17
Annotation, 12, 14, 24, 42
Application area, 6, 7, 63, 64, 75, 76, 77
Application Folder, 38
Attributes, 12, 15, 16
Block diagrams, 26
Business Process Logic, 48, 49
Business Rules, 4, 78
COBOL, 5, 6, 63
Configuration, 37
Cross-reference library, 5, 24, 64
Data Flow Diagram, 5, 6, 10, 11, 22
Data Model Diagram, 5, 63, 64, 65, 66, 68, 75, 76, 77
Data Modelling, 63, 64, 78
Default View Level, 18, 19
Dependent Fields, 67
Dependent File, 67
Detail DFD, 16
Detailed SCD, 25
Diagram Options, 46, 56
DMD Details, 66, 67, 69
Document Manager, 6, 31, 32, 33
Documentation, 2, 5, 6, 31, 32, 33, 35
Eclipse, 5, 11, 16, 31, 61
Expand/Collapse Referenced Objects, 12
Export Options, 10, 46
Export to MS Excel, 10
Export to PDF, 10
File Field Details, 5, 63, 70, 71
Flowchart, 46, 51, 52, 53, 54
Function Type, 57
Generate UML, 46
Hide/Show Objects, 12
Hierarchical Structure Chart, 5, 6, 26, 27
IBM i, 4, 5, 6, 61, 80
Indented Source Code, 47
Invert Selection, 33
Jump to Subroutine, 56
Legacy application, 78
Legend, 16, 17, 23, 30, 66
Level 1, 19, 50, 51
X-Analysis Professional 11.1
© 2015 Fresche Legacy Inc.
Page 83
Index
Level 2, 19, 20, 51
Level 3, 20, 51
Level 4/Parameters, 21
Level 5/Cascading Parameters, 21
Lfs, 63, 69, 70
Lpex, 46, 61
Mark all for Documenter, 31
Mark for Documenter, 31, 32
Maximum Tracking, 21
Member X-Reference, 55
More Info, 46
Normal Source Code, 47, 48, 49, 50
Object List, 7, 8, 9, 11, 31, 41, 44, 45, 54
Object Where Used, 6, 9, 10, 11
Parameters, 10, 21, 79
Parent Fields, 67
Parent File, 67
Pfs, 63, 73
Plugin, 61
Preferences, 10, 19, 46, 61, 62
Print, 46
PSC, 5, 56, 57, 58
Pseudo Code, 6, 46, 49, 50
Referred Files, 28, 29
Relation Type, 67
RPG, 5, 6, 63
Screen Components, 46
Screen/Report Design, 46, 60
SEU, 46, 61, 79
Show Narratives, 25
Show Root Node, 30
Show Split Panel, 46
Source Browser, 6, 44, 45, 46, 54, 55, 56, 57, 58, 59, 60, 61
Source Level, 46, 50
Source List, 50, 51
Source Options, 46, 47
Source Outline, 46, 48
Structure Chart Diagram, 5, 6, 21, 22, 57
Subroutines, 48, 52, 56, 57
Synon, 6
System Document, 34, 35, 36, 40, 41, 42, 43, 44
Text, 79
Usage References, 9
Variable Where Used, 6, 17, 18, 19, 21
View Code, 46
View Data, 63, 69, 73
Views, 11
X-Analysis, 1, 2, 4, 5, 6, 7, 10, 18, 19, 23, 25, 31, 33, 38, 44, 48, 61, 62, 63, 64, 73, 78, 79
X-Analysis Professional 11.1
© 2015 Fresche Legacy Inc.
Page 84
Index
X-Redo, 78
Zoom Source, 54, 58, 59
X-Analysis Professional 11.1
© 2015 Fresche Legacy Inc.
Page 85