1
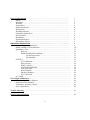
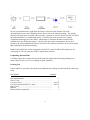
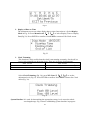
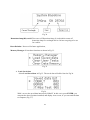
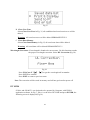
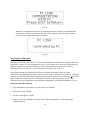
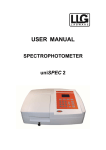
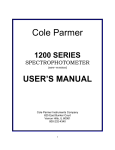
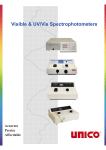
S1205 & S2100+ SERIES
SPECTROPHOTOMETER
USER’S MANUAL
V 1.0
United Products & Instruments, Inc.
182-E Ridge Road
Dayton, NJ 08810
732-274-1155 FAX 732-274-1151
TABLE OF CONTENTS
General information………………………………………………………………
Safety………………………….........................................................………
Electrical………………………………………………………………........
Warning……………………………………………………………………..
Performance…………………………………………………………………
Radio Interference…………………………………………………………..
Introduction…........................................................................………………
Working Principle.......................................................................……………
Unpacking Instructions.....................................................…………………..
Specifications…..............................................................................................
Installation.............................................................................……..................
Operational Panel....................................................................……................
Description of Keys....................................................................……............
Operation Instruction............................................................……………...................
Prepare the spectrophotometer.........................................................................
BASIC MODE-%T/Abs Measure...............................................…………….
Quantitative Test.......................................................................………………
Run test………………………………………………………………..
Define/Establish Test Method………………………………………..
By Known Factors…………………………………………….
By Standard…………………………………………………..
UTILITY………………………………………………………………………
WL Calibration………………………………………………………..
Dark Current…………………………………………………………..
EDIT CLOCK…………………………………………………………
SYSTEM BASELINE……………………………………..………….
Turn on/off D2…………………………………………………………
Reset Defaults………………………………………………………….
Memory Manager………………………………………………………
WL Correction…………………………………………………………
PC LINK……………………………………………………………………….
Wavelength Calibration…………….……………………………….………………..
Holmium Oxide Filter Method…………………………………………………
Didymium Filter Method………………………………………………………
Absorbance Accuracy Checks…………………………………………………
Stary Light Check………………………………………………………………
3
3
3
3
4
4
4
4
5
6
6
8
8
9
9
10
12
12
14
15
18
21
22
22
22
23
24
24
24
25
25
26
26
27
28
28
Trouble Shooting…………………………………………………………..................
29
Error Codes Definitions………………………………………………………………
30
2
General information
The apparatus described in this manual is designed to be used by properly trained personnel in a
suitable equipped laboratory. For the correct and safe use of this apparatus it is essential that
laboratory personnel follow generally accepted safe procedures in addition to the safety
precautions called for in this manual.
The covers on this instrument may be removed for servicing. However, the inside of the power
supply unit is a hazardous area and its cover should not be removed under any circumstances.
There are no serviceable components inside this power supply unit. For the 2100UV+, avoid
touching the high voltage power supply at all times.
Some of the chemicals used in spectrophotometry are corrosive and/or inflammable and samples
may be radioactive, toxic, or potentially infective. Care should be taken to follow the normal
laboratory procedures for handling chemicals and samples.
Safety
The safety statements in this manual comply with the requirements of the HEALTH AND
SAFETY AT WORK ACT, 1974.
Read the following before installing and using the instrument and its accessories. The S1205
and S2100+Series (S2100+ and S2100UV+included) should be operated by appropriate
laboratory technicians.
Electrical
Before switching on the apparatus, make sure it is set to the voltage of the local power supply.
The power cord shall be inserted in a socket provided with a protective earth contact. The
protective action must not be negated by the use of an extension cord without a protective
conductor.
Warning
Any interruption of the protective conductor inside or outside the apparatus or disconnection of
the protective earth terminal is likely to make the apparatus dangerous. Intentional interruption
is prohibited.
Whenever it is likely that the protection has been impaired, the apparatus shall be made
inoperative and be secured against any unintended operation. NEVER touch or handle the
power supply due to the high voltage.
The protection is likely to be impaired if, for example, the apparatus
• Shows visible damage
3
•
•
•
Fails to perform the intended measurements
Has been subjected to prolonged storage under unfavorable conditions.
Has been subjected to severe transport stresses
Performance
To ensure that the instrument is working within its specification, especially when making
measurements of an important nature, carry out performance checks with particular reference to
wavelength and absorbance accuracy. Performance checks are detailed in this manual.
Radio Interference
For compliance with the EMC standards referred to in the EC Declaration of Conformity, it is
necessary that only shielded cables are used when connecting the instrument to computers and
accessories.
Introduction
The UNICO S1205 and S2100+series are single beam, general purpose instruments designed to
meet the needs of the Conventional Laboratory, They are ideal for various applications, such as:
Clinical Chemistry, Biochemistry, Petrochemistry, Environmental Protection, Food and
Beverage Labs, Water and Waste Water Labs and other fields of quality control and research.
Both S1205 and S2100+ Series features a digital display of photometric result, easy operation
and wavelength range of 325nm to 1000nm for S1205 and model S2100+(200-1000nm for
S2100UV+), these instruments are ideal for measurements in the visible wavelength region of
the electromagnetic spectrum (ultraviolet and visible for the S2100UV+).
Working Principle
The spectrophotometer consists of five parts: 1) Halogen and deuterium (for S2100UV+ only)
lamp to supply the light; 2) A Monochromator to isolate the wavelength of interest and eliminate
the unwanted second order radiation; 3) A sample compartment to accommodate the sample
solution; 4) A detector to receive the transmitted light and convert it to an electrical signal; and
5) A digital display to indicate absorbance or transmittance. The block diagram below illustrates
the relationship between these parts.
Block diagram for the Spectrophotometer
4
In your spectrophotometer, light from the lamp is focused on the entrance slit of the
monochromator where the collimating mirror directs the beam onto the grating. The grating
disperses the light beam to produce the spectrum, a portion of which is focused on the exit slit of
the monochromator by a collimating mirror. From here the beam is passed to a sample
compartment through one of the filters, which helps to eliminate unwanted second order
radiation from the diffraction grating. Upon leaving the sample compartment, the beam is
passed to the silicon photodiode detector and causes the detector to produce an electrical signal
that is displayed on the digital display.
Both S1205 and S2100+ Series incorporate an RS-232C and/or USB bi-directional port for
connecting to a PC for using the UNICO Application Software.
Unpacking Instructions
Carefully unpack the contents and check the materials against the following packing list to
ensure that you have received everything in good condition:
Packing List
Unless otherwise specially ordered the spectrophotometer package should include the following
items.
Description:
Quantity
Spectrophotometer...........……................. …........................
1
Power Cord…………………………………......…………..
1
Cuvettes, Glass ..................................……............... …........ Set of 4
Cuvettes, Quartz(S2100UV+ only)………………………… Set of 2
Dust Cover...................................…….......…. ….................
1
Manual................................................……….......................
1
Built in Printer (Optional).............................…….................
1
5
Specifications for S1205
Model S1205
325-1000nm
5nm
+ 2 nm
Wavelength Range
Spectral Bandpass
Wavelength Accuracy
Wavelength Repeatability
+ 1nm
Stray Radiant Energy
Photometric Range
<0.3 @ 340 and 400nm
0 to 125%T
-0.3 to 2.5 Abs
-9999 to 9999
+ [email protected]
Photometric Accuracy
Data output
RS232 and Built in Printer(Optional)
Power Requirements
Dimensions
Light Source
Weight
Shipping Weight
Shipping dimension
80-240Vac, 50-60 Hz
420W x 340D x 180H (mm)
Tungsten Halogen
8.5kg
19 lbs
20 x 16 x 11 inches
Specifications for S2100+ Series
Wavelength Range
Spectral Bandpass
Wavelength Accuracy
Wavelength
Repeatability
Stray Radiant Energy
Photometric Range
Photometric Accuracy
Data output
Power Requirements
Dimensions
Light Source
Weight
Shipping Weight
Shipping dimension
Model S2100+
325-1000nm
4nm
+ 2 nm
Model S2100UV+
200-1000nm
4nm
+2 nm
+ 1nm
+1nm
<0.3 @ 340 and 400nm
0 to 125%T
-0.3 to 2.5 Abs
-9999 to 9999
+ [email protected]
<0.3 @ 220 and 340nm
0 to 125%T
0.3 to 2.5 Abs
-9999 to 9999
+ [email protected]
RS232 and Built in Printer(Optional)
RS232 and Built in Printer(Optional)
80-240Vac, 50-60 Hz
505W x 430D x 200H (mm)
Tungsten Halogen
12.5kg
36 lbs
26 x 21 x 15 inches
110V/60Hz or 220V/50Hz Switchable
505W x 430D x 200H (mm)
Tungsten Halogen/Deuterium
13.5kg
40 lbs
26 x 21 x 15 inches
Installation:
1. After carefully unpacking the contents, check the materials with the packing list to ensure that
you have received everything in good condition.
6
2. Place the instrument in a suitable location away from direct sunlight. In order to have the
best performance from your instrument, keep it as far as possible from any strong magnetic or
electrical fields or any electrical device that may generate high-frequency fields. Set the unit up
in an area that is free of dust, corrosive gases and strong vibrations.
3. Remove any obstructions or materials that could hinder the flow of air under and around the
instrument.
4. For S2100UV+ select either 220V or 110V on the voltage selector switch to match your local
mains voltage supply.
5. Turn on the instrument and allow it to warm up for 15 minutes before taking any readings.
7
Operational Panel
Fig 3 S2100+ Panel shown
Description of Key Functions
【CLEAR/LOAD】 Clear number or character when editing in Quantatitive Mode;
Load saved data or saved curve ;
【PRINT/SAVE】 Print data; Save data or curve;
【0Abs/100%T】
Set 0Abs and 100%T;
【EXIT】
Return to previous screen;
【ENTER】
Confirm the inputted data or selected item; Go to next setup or screen;
WL/Conc./F
【 】,【 】
Set Wavelength; Enter Standard solution value or Enter Known Factor
value;
Menu Scroll
【 】,【 】
Browse the items in the menu
8
Operation Instruction:
Prepare the spectrophotometer
Turn on the spectrophotometer by pressing the Power Switch (IO). The screen displays
sequentially as Fig 4 and 5. Press EXIT to skip 15 minutes warm up. After 15 minutes warm up
the main menu displays as Fig 7. (S2100UV+ locates lamp and set filter before the main menu
displays)
Fig 4
Fig 5
Note: Specific model number displays in Fig.4 and Fig. 5. (Model Vis 1205 shown in this
illustration)
Fig 6
Note: a.If the saved wavelength has been out of order,`WL calibrating`will be
implemented and then go into Main Menu.
b.It is strongly recommended that taking dark current following the steps below
after warmup:
1. Select UTILITY in Fig. 6 and then select Dark Current in Fig. 7
9
Fig. 7
2. Dark Current will be taken shown as Fig 8.1 and be saved shown as Fig 8.2
after pressing EXIT
Fig 8.1
Fig 8.2
Tech Notes: It is always a good practice to reset the dark current periodically.
It is especially important if the instrument is hanging on for a long time or the
environment is not stable.
BASIC MODE ━ %T/Abs Measure
1.
In Fig 6, scroll * to BASIC MODE and then press ENTER to Select basic T/Abs mode
as showed in Fig 9. If the readouts are not 100.0%T and 0.000A, you may press
0Abs/100%T to blank.
Fig 9 BASIC MODE
2.
Select the desired wavelength by pressing the appropriate key. At any time that the
wavelength is changed, blank will automatically be implemented as showed in Fig 10.1,
10
Fig 10.2 and 10.3
Fig 10.1 Select wavelength using【 】,【 】
Fig 10.2 Press Enter to set the new wavelength
Fig 10.3 Blank automatically
Note: Press WL/Conc./F 【∧ 】【∨ 】to change wavelength at 1nm and 5nm interval,
Press Menu Scroll 【∧ 】【∨ 】 to change wavelength at 50nm interval.
3.
Make a blank reference solution by filling a clean cuvette with distilled or de-ionized
water or other specified solvent. Wipe the cuvette with tissue to remove the fingerprints
and droplets of liquid.
4.
Fit the blank cuvette into the 4-cell holder and place the cuvette in the slot nearest you.
Push the rod so that the cuvette is in the light path. Close the lid.
5.
Set 0.000A or 100%T by pressing 0A/100%T button.
6.
Remove the blank cuvette if you are testing more than 3 samples. Set it aside in the case
that you may need to reset 0A/100%T later (i.e. change wavelength).
7.
Rinse a second cuvette (or more) with a small amount of sample solution to be tested.
11
Fill the cuvette and wipe it.
8.
Put the sample cuvette(s) in the sample compartment. Close the lid.
9.
Read the % Transmittance and Absorbance from the LCD readout window. If you are
reading more than one cuvette, be sure to carefully move the cuvette holder to the next
position by pulling on the sample holder rod until the holder “click” into place. Be sure
to make note of the readout (or print) for each sample. Remove the sample cuvette(s).
Operational Note:
1. If you are reading 3 or less samples, then place the reference cuvette in the position
nearest you, and the samples in the next available position. This will shorten the time to
read samples and minimize the sample handling (opening and closing the sample
compartment lid, etc.)
2. To save or print the readings please press PRINT/SAVE and follow the instruction on
line 4 of screen.
10.
If you are to test the same sample at other wavelengths, repeat steps 2 to 9 for each
wavelength.
11.
For each new sample you analyze, repeat steps 3 to 9.
Quantitative Test
Run Test using pre-defined Method
Test method (curve) must be defined and established before quantitative tests can be run.
This instrument has open platform for you to establish your own test methods (curves).
Such established method will be saved as defined test in “All Test List”. Refer to
“Define/Establish Test Method” section in this chapter.
Follow the procedures below to run quantitative test
1. At main menu (Fig. 6) scroll * to Quantitative and then press ENTER to Select
Quantitative test mode as showed in Fig 11.
Fig 11
2. Select Run Test. Place reference in the sample holder and make sure it is the optical path
(working position). Scroll * to the left of the desired test and then press ENTER to confirm.
12
Fig 12
The instruments will automatically set to the proper wavelength as defined and blank the
reference as displayed in Fig 12.1, Fig 12.2 and Fig 12.3. (Press 0Abs/100%T button to reblank).
Fig 12.1 goto preset wavelength
Fig 12.2 Blank automatically
Fig 12.3 After Blanking
3. Insert the sample cuvette into the lightpath (working position) and sample test result is
displayed.
Fig 13 Test result readings
4. Press PRINT/SAVE and follow the instruction to print or save the test results.
Note: Run Test folder shows the pre-loaded tests ready for immediate test run. If the desired
test is defined and saved in “All Test List” but not yet loaded in “Run Test”, you need
13
to load the test method to “Run Test” before you can run the quantitative tests using
such method.
Load Test (method) to Run Test
1.
2.
3.
4.
Select “All Test List at Quantitative menu.
Selects the test method in “All Test List” to be loaded to Run Test.
Press LOAD button to “copy and forward” the test method to Run Test.
Exit from All Test List and enter to Run Test to check and make sure the selected test
method is listed.
Remove Test (method) from Run Test
1. At “Run Test” screen scrolling * to the left of the test method you want to remove from the
Run Test folder.
2. Press CLEAR/LOAD to remove it.
(Note: The test method is still saved in All Test List and can be reloaded as needed).
Define/Establish Test Method
Test method (curve) must be defined and established before quantitative tests can be run.
This instrument has open platform for you to establish your own test methods (curves).
Such established method will be saved as defined test in “All Test List”.
This section describes how to define/establish a test method in All Test List
1. At Quantitative menu select All Test List as shown Fig 14.
Fig 14
Up to 200 defined tests can be saved in All Test List.
Note: You can’t run any test from All Test List. Only run test in Run Test menu.
Define/Establish Test (method)
The 200 un-defined tests are originally named “To be defined 001 to 200”. You can choose to
rename any of the un-defined locations and define your test in one of the following two ways:
Define Test by Known Factor
Define Test by know Standards
14
Define a test by Known Factors
If you know the Factor value you can select “By Known Factors” to define the test method:
1.
2.
At Quantitative menu scroll * to the left of desired location for saving the test method.
Press ENTER to confirm. (In this case we choose “To be defined 02” to be defined)
Fig 15
Select “ By Know Factors” by pressing ENTER button (Fig.15). Follow the screen step by
step to enter data (Fig. 16).
3.
Set wavelength by pressing WL/Conc./F 【 】,【 】. Press Enter to confirm
wavelength selection (581nm in this example case). The screen returns to previous menu
and the * move to “Conc. Unit” automatically.
4.
Select concentration unit by pressing Menu Scroll 【∧ 】,【∨ 】. Press Enter to
confirm Conc. Unit selection. The screen returns to previous menu and the * move to
“Fit Method” automatically.
Fig 16
5.
Select fitness method by pressing Menu Scroll 【∧ 】,【∨ 】. Two methods are
available:
1st order linear:
Concentration = Intercept+ Slope*Absorbance;
1st order linear through zero: Concentration = Slope*Absorbance;
15
Press Enter to confirm fitness method selection. The screen returns to previous menu and
the * move to “Input Factors” automatically.
6.
Press ENTER to enter the screen displayed as in Fig 17
Fig 17
Suppose 1st order linear fitness method is selected and intercept value is 1.058 and the
slope is 2.588.
7.
Enter Intercept and Slope value:
7.1 To select a numerical number move the flashing cursor to that number; The Menu Scroll
【∧ 】scroll cursor to left; The Menu Scroll【∨ 】scroll cursor to right;
7.2
Press WL/Conc./F 【∧ 】to confirm and enter the number to “intercept” line.
Fig 18
7.3
7.4
7.4
Use CLEAR/LOAD to delete/erase any incorrect entry.
Press WL/Conc./F 【∨ 】to alter the polarity of the number.
Check and make sure the intercept value is correct. Then press ENTER to confirm and
move to the next screen as displayed in Fig 19.
Fig 19
Enter the slope value in the same way as the intercept value is entered. The Slope value in
this example is 2.588. Press ENTER to confirm and the screen will return to previous menu
and the * move to “Name Curve” automatically (Fig. 20).
Note: If “1st order liner through 0” is selected, there is no need to enter intercept.
16
Fig 20
8. Name the Curve
The name character entry is the same way as the entry of intercept and slope.
8.1
To select a number or character move the flashing cursor to that number or character; The
Menu Scroll【∧ 】scroll cursor to left; The Menu Scroll【∨ 】scroll cursor to right;
8.2
Press WL/Conc./F 【∧ 】to confirm. The number or character will be displayed below
name curve.
Use CLEAR/LOAD to delete/erase any incorrect entry.
Check and make sure the name is correct. (“BROMINE LR” in this case is shown in Fig.
21).
8.3
8.3
8.4
9.
Fig 21
Then press ENTER to confirm the name (BROMINE LR in this case) and the display
will automatically return to previous menu with the * at “ Save Curve”.
Save the Curve defined: with the * at “Save Curve” press ENTER to save the define
curve. Then the * moves to “Dis & Print Curve” automatically.
10. Display and Print-out Defined Test (Curve parameter): with the * at “Dis & Print Curve”
Press ENTER to display and print (if printer is connected) the defined test parameter.
The data and parameters include (Shown as Fig 22):
Defined test sequence number in All Test List. (No.=002 in this example case);
The wavelength used for the defined test (581nm in this example case);
The defined test name (BROMINE LR in this example case);
Fitness method for the defined test ( “1” represents “1st order linear”, “0” represents “ 1st
order linear through zero”);
Intercept value (1.058 in thise case);
Slope number (2.588 in this case) and
Concentration unit (ppm in this case).
17
Fig 22
Note: N and M are not part of parameter and have no real meaning and effect to the test.
The establishment of the defined test is complete and saved in the instruments. Now you
may make final check on all the parameters. Press EXIT to return to All Test List menu.
The “To be defined 002” has been replaced with “BROMINRE LR” as shown in Fig 23.
Fig 23
Define a Test by Known Standards
If you have standards with known concentration values you can establish and define test curve
by following the instructions in this section.
1.
At Quantitative menu scroll * to the left of desired location for saving the test method.
Press ENTER to confirm.
2.
Select “By Standard” by pressing ENTER button. Follow the screen step by step to enter
data and parameters.
18
3.
4.
5.
5.1
Set wavelength by pressing WL/Conc./F 【 】,【 】. Press Enter to confirm
wavelength selection. The screen returns to previous menu and the * move to “Conc.
Unit” automatically.
Select concentration unit by pressing Menu Scroll 【∧ 】,【∨ 】. Press Enter to
confirm Conc. Unit selection. The screen returns to previous menu and the * move to
“No. of STDS” automatically.
Select number of standards which will be used for establishing the test curve. Up to 8
standards can be used.
To select a numerical number move the flashing cursor to that number; The Menu Scroll
【∧ 】scroll cursor to left; The Menu Scroll【∨ 】scroll cursor to right;
5.2
5.3
5.4
Press WL/Conc./F 【∧ 】to confirm and enter the number.
Use CLEAR/LOAD to delete/erase any incorrect entry.
Check and make sure the number is correct. Then press ENTER to confirm and the
*moves to the next screen “No. of Replics” automatically.
6.
If you have more than one solution of the save standard concentration value you can
measure all of them and use the averaged value for curve establishment. Enter the
number of replics in the same way as the number of standards is entered. If only one
standard solution for each concentration value is used just enter 1. Each standard solution
will be measured and the averaged value will be used for calculation. Press ENTER to
confirm and the *moves to the next screen “Fit Method” automatically.
7.
Select fitness method by pressing Menu Scroll 【∧ 】,【∨ 】. Two methods are
available:
1st order linear:
Concentration = Intercept+ Slope*Absorbance;
1st order linear through zero: Concentration = Slope*Absorbance;
19
Press Enter to confirm fitness method selection. The screen returns to previous menu and
the * move to “Measure Standard” automatically.
8.
Measure standard solutions:
8.1
Press ENTER at “Measure Standard” The following screen will pop up (Fig 25).
Fig 25
8.2
Place the cuvette with reference solution in the cuvette holder, press 【0Abs/100%T】to
blank. After blank is complete it is ready for standard solution measurement starting
from STD. No.1
Fig 26
8.3
8.4
Place standard No. 1 in the cuvette holder and make sure it is in the optical path
(working position). Enter the known concentration value. Refer to Intercept value
entry for data entry procedures. Check and make sure the value entered matches
the value of the standard No.1 (it is usually labeled on the standard).
Press ENTER to measure the standard No.1. The Absorbance of the standard
solution No.1 will be measured and displayed (Fig 27). Since this is the first
measurement the absorbance is marked “A1”
Fig 27
If the “No. of Replics” is “3”, then place the second solution of STD No.1 in the
cuvette holder. Pressing ENTER will measure the second solution of STD N0.1
20
and the second measurement value will be displayed at STD No.1= 0.18775A2.
Repeat the same procedures to measure the third solution of STD No.1 and screen
will display STD. No.1=0.1876A3. This finishes the measurement of the three
solutions of standard No. 1.
Press ENTER again to average the measured absorbance values and the screen
then displays its averaged value: 0.1876A (0.1877A1+0.1875A2+0.1876A3)/3.
This averaged absorbance value will be used for calculation.
8.5
Place standard solution No.2 into the cuvette holder in the optical path. Repeat step
8.3 to 8.4 to measure standard No.2. Repeat the same procedures for all the
standards in sequence.
8.6
After all the standards are measured press ENTER to create the curve (as shown in
Fig.28) and the screen return to the first with * at “Name Curve”.
Fig. 28
9.
10.
Name Curve and Save Curve: Refer to “Name Curve and Save Curve” in “By
Factor” chapter (page 17).
Display and Print Curve Parameters: Refer to “Dis & Print Curve” in By Known
Factors chapter (page 18 ).
UTILITY
In MAIN MENU(Fig. 6), move * down to the left of UTILITY and press ENTER to go into
UTILITY menu as shown in Fig. 29.
21
Fig 29
There are eight functions in UTILITY.
WLCalibration: the instrument will implement a self-check and calibration procedure. It
includes filter positioning, lamp positioning, and wavelength calibrating, dark
current resetting;
Dark Current: measure and refresh instrument dark current. It is designed for eliminating the
error from electronic drifting. It is recommended that you refresh and save the
Dark Current after the 15 minutes warm up and periodically.
Edit Clock:
There are three functions as shown in Fig. 30
Fig 30
1. Set Clock
Select Set Clock in Fig. 30. Press ENTER to cycle through W (Week), Y(Year),
M( Month), D(Day), H(Hour), M(Minute), S(Second). Press WL/Conc./F 【∧ 】
【∨ 】to change. Press ENTER to confirm. Press EXIT to return to Edit Clock screen
(Fig 30).
22
Fig 31
2. Display of Date or Time
The instrument screen can either display date or time (hour:min:sec). Select Display
Mode in Fig. 30. Press Menu Scroll 【∧ 】【∨ 】to select Display Time or Display
Date(Fig.32). Press ENTER to confirm. Press EXIT to return to Edit Clock screen.
Fig 32
3. Clock Trimming
This function is only useful when the clock is not running accurately. Set the off-set
level (clock trimming) to adjust the clock. There are 64 levels of adjustments:
Slow Levels
Fast Levels
Slowest
Fastest
32---------------------16-----------------------0
0-----------------------16---------------------32
Cable 1
Select Clock Trimming (Fig. 30), press WL/Conc./F 【∧ 】【∨ 】to set the
adjustment level (Fig.33). Press ENTER to confirm. Press EXIT return to Set Clock
menu (Fig. 30).
Fig 33
System Baseline: It is used for determining the appropriate energy level across the whole
wavelength range. Fig 34 shows establishing system baseline in progress.
23
Fig 34
Deuterium lamp(D2) on/off: Turn on or off Deuterium lamp. It is advisable to turn off
deuterium lamp if wavelength 200 to 340 are not going to be use
for a while..
Reset Defaults: Reserved for future application;
Memory Manager: It has three functions as shown in Fig 35.
Fig 35
A. Load Saved data
Select Load Saved data in Fig 35. The saved data will all be listed as Fig.36.
Fig 36
With * next to the saved data interested (COBALT in this case), press ENTER, you
can print the data (if printer installed) and display it on screen, or you can send the data
to computer (Fig. 37).
24
Fig 37
B. Clear User Tests
Select Clear User Tests in Fig. 35, all established and saved tests/curves will be
deleted.
Warning: All saved test curves will be deleted PERMANENTLY!!!
C. Clear Data Memory
Select Clear Data Memory in Fig 35; all saved tests data will be deleted.
Warning: All saved data will be deleted PERMANENTLY!!!
Wavelength Correction: If wavelength is found to be not accurate. Use this function to make
the proper wavelength correction. Select WL Correction (Fig 38).
Fig 38
Press WL/Conc./F 【∧ 】【∨ 】to get the wavelength off-set number.
Press ENTER to confirm.
Press EXIT to return to previous menu.
Note: The correction will be saved in memory and will not get lost after power off.
PC LINK
S2100+ and S2100UV+ are designed to be operated by Computer with UNICO
application software. In Fig. 7, move * to the left of PC LINK and press ENTER; the
following screen is displayed (Fig 39).
25
Fig 39
When the communication between the instrument and the computer is established the
computer is in control (as shown in Fig. 40). Please details of the PC software please
refer to UNICO application software manual.
Fig 40
Wavelength Calibration:
Normally the S2100+ and 2100UV+ Series spectrophotometer retains its wavelength calibration
indefinitely. However if the instrument receives a severe shock or is abused, use the following
methods to check wavelength calibration. Please note that this test requires the UNICO
Didymium filter, p/n 2100-116, or the Holmium Oxide filter, p/n 2100-115.
In the filter method, the didymium filter has two distinct absorbance peaks at 529nm
and 807nm. The Holmium filter has a distinct peak at 361nm. When the instrument is calibrated
properly you will find minimum Transmittance (maximum Absorbance) at the range +2nm from
these peaks. Note that the specific Transmittance values are not important as you are only
looking for the wavelength where the minimum transmittance (maximum Absorbance) occurs.
Holmium Oxide Filter Method:
1. Turn instrument on and allow it to warm up for 15 minutes.
2. Select the BASIC MODE.
1. Set the wavelength to 350nm.
2. Make sure the cuvette holder is empty in the sample compartment. Close the sample
compartment lid.
26
3. Set zero Absorbance by pressing the 0A/100%T.
not, press 0Abs/100%T again.
The reading should then be 0.000A. If
4. Remove the cuvette holder and insert the Holmium filter into it. Place it in the sample
compartment and close the lid.
5. Record the Absorbance reading on the LCD display.
6. Advance the wavelength setting by 1nm and repeat steps 2 to 5.
7. Repeat step 6 until the wavelength setting reaches 370nm.
8. Look for the maximum absorbance reading obtained, and this should be found between 359
and 363nm.
Didymium Filter Method:
1. Set the Wavelength to 800 nm.
2. Make sure the cuvette holder is empty in the sample compartment. Close the sample
compartment lid.
3. Set zero Abs by pressing the 0A/100%T. The reading should then be 0.000A. If not, press
0Abs/100%T again.
4. Remove the cuvette holder and insert the Didymium filter into it. Place it in the sample
compartment and close the lid.
5. Record the Absorbance reading on the LCD display.
6. Advance the wavelength setting by 1nm and repeat steps 2 to 5.
7. Repeat step 6 until the wavelength setting reaches 815nm.
8. Look for the maximum absorbance reading obtained, and this should be found between 805
and 809nm.
9. If a “middle” wavelength check is desired, set the wavelength to 522nm (optional)
10. Make sure the cuvette holder is empty in the sample compartment. Close the sample lid.
11. Set zero Abs by pressing the 0A/100%T key. The reading should then be 0.000A .If not,
press 0Abs/100%T again
12. Remove the cuvette holder and insert the Didymium filter into it. Place it in the sample
compartment and close the lid.
13. Record the absorbance reading on the LCD display.
27
14. Advance the wavelength setting by 1nm and repeat steps 10 to 13.
15. Repeat step 14 until the wavelength setting reaches 536nm. Again, look for the maximum
absorbance reading. It should be between 527 and 531nm.
Absorbance Accuracy Checks
Specification: +0.004A at 0.5A.
The absorbance accuracy should be checked against a set of neutral density filters accurately calibrated to
the NIST standards. Contact your UNICO representative for more information (800-588-9776).
An alternative method using potassium dichromate is described below. Due to the many factors that
might affect the results (i.e. temperature, bandpass, weighing and diluting errors), this method is less
accurate and should only be used as a guide.
Reference: Johnson E A
Potassium Dichromate as an absorbance standard
PSG Bulletin 1967, No. 17, page 505
1.
2.
3.
4.
5.
6.
7.
8.
Make up N/100 sulfuric acid as the solvent and use part of it to make a solution containing 120
+0.5mg/litre of potassium dichromate.
Wash out a square cuvette with solvent, and fill with solvent.
Put the cuvette into the sample compartment and close the lid.
Select BASIC MODE and Set the wavelength to 350nm.
Set the reading to 0.000A using the 0Abs/100%T key.
Empty the cell. Wash out with dichromate solution, and fill with dichromate solution.
Put the cuvette into the sample compartment and close the lid.
Read the absorbance of the standard from the LCD display. The value should be Calibrated
Value + 0.004A. Refer to the notes above when interpreting the result.
Note:It is recommended that you refresh the Dark Current (refer to Page21) before check.
Stray Light Check
Specification: Less than 0.3%T at 340nm by ASTM E 387
A good indication as to whether the stray light level is within specification may be obtained as follows:
1.
Set the wavelength to 340nm.
2.
Select BASIC MODE With the sample compartment empty, close the lid and press the 0A/100%T
key to set the LCD display to 100.0%.
3.
Prepare a solution containing 50gm/L of sodium nitrite (NaNO2) in distilled water and fill a square
cuvette with this solution.
4. Place the cuvette in the sample compartment. Close the lid. The display should read<0.3%T.
Note:It is recommended that you refresh the Dark Current (refer to Page21) before check.
Trouble Shooting:
28
PROBLEM
Possible
Solution
Instrument Inoperative
Power cord not connected to
outlet
Dead Power outlet
Internal fuse blown or defective
electronic component
Improper power setting
Light beam blocked
Plug instrument in.
Instrument cannot set
100%T (0.000A)
Lamp is misaligned.
Incorrect
Transmittance to
Absorbance correlation
LCD Digital Display
does not change
regardless of sample
concentration
Defective electronic component.
Bubbles or particles in solution.
Call an authorized service engineer.
Sample Solution too Dark , dilute it and
Restart measurement procedure.
Wrong wavelength setting.
Check sample procedure and wavelength
setting.
Fill cuvette with more sample.
Prepare the sample away from the
instrument. Use proper ventilation.
Check sample preparation and analytical
procedure.
Call an authorized service engineer.
Bubbles or particles in solution.
Incorrect readings
obtained
Set to the main power
Check sample holder. See if holder is
properly positioned and nothing is blocking
light path.
Check to see if light is positioned properly on
entrance slit to monochromator. Call
Technical Service for details (800-588-9776).
Call an authorized service engineer.
Check sample preparation and analytical
procedure.
Defective electronic component.
Concentration reading “frozen”.
Insufficient sample volume.
Stray sample preparation vapors.
Instrument drift and
noise
Change to a different outlet
Call an authorized service engineer.
Defective electronic component
or loose wiring.
Lamp not adjusted
properly.(misalignment)
Lamp old or defective.
Defective or dirty detector or
defective electronic component.
Insufficient sample volume
Wrong wavelength setting.
Stray sample preparation vapors.
Bubbles or particles in solution.
Instrument out of electronic
calibration.
Error Codes Definitions:
29
Check lamp has been properly installed or
has moved during transit.
Replace with a new lamp.
Call an authorized service engineer.
Fill cuvette with more sample.
Check analytical procedure and wavelength
setting. Check wavelength accuracy
according to procedure in this manual.
Prepare sample away from instrument. Use
proper ventilation.
Check sample preparation and analytical
procedure.
Call an authorized service engineer.
The Error Codes are the classification for errors detected automatically by the instrument. Each code
represents different errors that occur during the self-calibration or during operation. The Error Codes are
displayed on the wavelength display and are defined as follows:
Error Code
Error 1
Error 2
Error 3
Error 4
Error 5
Definition (function)
Causes/Solutions
Instrument unable to
• Check power supply to see if proper voltage is
initialize and/or locate the
selected.
lamp (S2100UV+only).
• Open cover of instrument and check the connector J3
between CPU board and Lamp-change-over motor .
• Lamp-change-over motor or lamp initialization
switch malfunctioning,Check the connector J8 on
CPU board.
• Call authorized service engineer
Instrument unable to
• Open cove rof instrument and check the connector J2
initialize and/or locate the
between CPU board and Filter-driven motor.
filter
• Filter-driven motor malfunctioning ,Check the
connector J4 on CPU board.
• Call authorized service engineer
Monochromator unable to
• Monochromator contact switch or grating-driven
locate starting position
motor (WL motor) is malfunctioning
• Open cover of instrument and check the connector
J11(S2100+Series) or J3(S1205) between CPU
board and grating-driven motor.
• Check the connector J5 on CPU board
• Call authorized service engineer.
Instrument unable to locate • Check sample holder. See if holder is properly
“0” order light
positioned and nothing is blocking light path.
• Check to see if light is positioned properly on
entrance slit to monochromator.
• Check tungsten-halogen lamp. Replace lamp if
necessary.
• Call authorized service engineer.
Instrument is unable to set
0A/100%T.“ Energy
Low!” display.
•
•
•
•
Check sample compartment and remove cuvette or
any object blocking light path.
Place the 4-cell sample holder in the proper position.
See the lamps is ON or OFF via the small hole in the
rear of the instrumen.if OFF,call authorized service
engineer.
Contact an authorized service engineer.
30