1
Ledgenester productivity and phenology
Wildlife Inventory Plan
Alaska Maritime National Wildlife Refuge
Protocol #4
Version 1.4
Parameter: Productivity and phenology
Species: Black-legged and red-legged kittiwakes, common and thick-billed murres
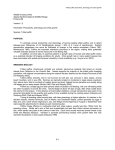
PURPOSE
To estimate annual productivity and phenology of ledge-nesting kittiwakes and murres and to
detect between-year differences of 0.25 fledglings/pair for kittiwakes, and 0.2 fledglings/pair for murres
(power = 90% at 0.1 level of significance). Seabird reproductive parameters can serve as indicators of
change in the marine ecosystem (Cairns 1987, Montevecchi 1993). Kittiwakes forage over long distances
and feed at or near the surface of the ocean, whereas murres dive for their prey but travel shorter
distances. Therefore, productivity and timing of breeding in kittiwakes and murres may provide important
information about different aspects of the marine environment.
BREEDING BIOLOGY
Kittiwakes (Rissa brevirostris and R. tridactyla) and murres (Uria aalge and U. lomvia) are longlived piscivorous seabirds that spend the majority of the year at sea but nest on cliffs in dense colonies
during the summer breeding season. During the breeding season, these species are central-place
foragers and highly visible on their cliff nest sites and thus easily monitored.
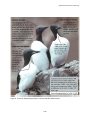
Kittiwakes build nest structures on cliff ledges with mud and vegetation. Red-legged kittiwakes
build a small vegetation-lined mud cup for their (usually) single egg, in contrast to the deeper and larger
grass nest that holds the (often) 2-egg clutch of black-legged kittiwakes (Byrd and Williams 1993, Hatch
et al. 2009). Where both species co-occur (the Pribilof Islands and Buldir), black-legged and red-legged
kittiwakes nest sympatrically on the cliffs; however, red-legged kittiwakes are often found in “clusters” with
other red-legged kittiwakes, often under overhangs or projecting rocks or on narrower ledges than those
used by black-legged kittiwakes (Kildaw 1999). Both parents share incubation and chick-rearing duties.
Adults incubate eggs for about 27 (black-legged kittiwakes) to 30 (red-legged kittiwakes) days, and chicks
fledge at about 40 to 50 days of age (Byrd and Williams 1993, Hatch et al. 2009). In Alaska, annual
productivity in kittiwake colonies ranges widely among years and sites: at AMNWR annual monitoring
sites, mean productivity for black-legged kittiwakes ranges from 0.14 (Buldir) to 0.68 (Cape Lisburne;
Dragoo et al. 2010).
Murres lay a single egg directly on the cliff ledges with no nest constructed. At sites with both
species, thick-billed murres usually nest on narrow ledges of sheer cliff, while common murres tend to
nest on wider platforms in clumps several to many birds deep. Murre eggs are quite large at one end and
pointed on the other, causing them to roll in small circles and making them less apt to fall from the ledge.
Eggs are incubated by both adults on a rotating basis for 30-35 days. Flightless downy chicks leave the
cliffs before fully independent after a short nestling period of about 20 days, after which chicks are
attended and fed at sea by males for several months (Gaston and Hipfner 2000, Ainley et al. 2002).
4-1
Ledgenester productivity and phenology
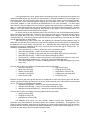
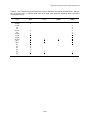
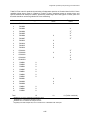
Table 1. Average incubation period lengths and minimum chick fledge age
conventions for kittiwakes and murres. Chick fledge age conventions are the ages at
which chicks are assumed fledged if they disappear at or after that date (chicks
disappearing before that date are considered failed). Some of these fledge age
conventions are currently under review by AMNWR biologists and may change in the
future.
Species
Black-legged kittiwake
Red-legged kittiwake
Common murre
Thick-billed murre
Incubation
Period
27 d
30 d
30-35 d
30-35 d
Chick fledge age
convention
36 d
32 d
15 d
15 d
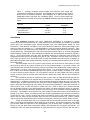
PROCEDURE
Data collection.—Kittiwake and murre reproductive performance is monitored by viewing
individually numbered nests and sites at 3-4 day intervals (inclement weather and variation in workloads
across sites may necessitate longer intervals between visits; see island-specific details for more
information). Each observer is assigned a set of plots and then monitors the same plots throughout the
season to avoid any confusion (i.e., a misinterpretation of nest site locations) between observers. Plots
are usually close to the observation point (within 50 m) and viewable from above so that nest contents
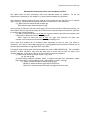
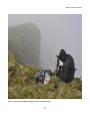
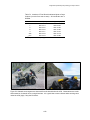
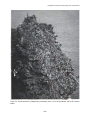
can be determined. Photographs are used to document plot locations (Figure 1); close-up photographs
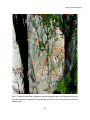
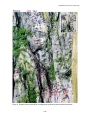
and/or drawings of plots help to track individually numbered nest sites throughout the season (Figures 2
and 3). Do not worry about using the same numbering sequence for nests each year because cliff
topography and nest site use can change from year to year. If possible, visit plots early in the season to
take current plot photos, then print photos back at camp and weather-proof them using a laminator or
plastic sheet protectors (with the top taped shut); this way your plot photos will be ready to go for your first
productivity check.
The ideal sample size is 10-15 plots of each species, with 25-30 birds of each species on each
plot (monitor a minimum of 10 plots, increase up to 15 if the workload allows). If you have a choice, add
more kittiwake plots because their breeding success is generally more variable (both within a season at
different parts of a colony, and among seasons) than murres. It is not worth the effort to monitor more
than 15 plots, as it does not substantially improve our power to detect change (Thompson et al. 2010).
For some species at some colonies, it is not possible to achieve an ideal sample size and we simply
monitor as many birds as possible (see island-specific details and consult with the Unit biologist for
guidance).
Plot boundaries can vary as needed from year to year in order to obtain 25-30 nest sites per plot.
Some nest sites may have to be dropped later in the season or in analysis because the fate cannot be
determined (i.e., neighbors irreversibly get in the way partway through the season and you never see nest
contents again, or grass grows up over your view), so it may be helpful to begin monitoring in extra 5-10
nests in each plot at the beginning of the season to account for this possibility. If there are more than 30
active nests in a plot, it is not necessary to monitor every one. Given a choice, try to choose nests that
you will probably be able to see well throughout the season (not birds blocked by others, for example).
For murres, side views provide better chances to see the egg or chick compared to looking straight at a
bird’s back. For kittiwakes, looking down onto nests usually provides better views of nest contents than
looking up at a nest. Ideally, your sample would also include representative nests from the full spectrum
of nest sites at a plot – those in clusters and those by themselves, those in the middle and those at the
edge of the plot, those up high and those down low; this is not always practical (e.g., nests in clusters
may be hard to see and thus bad nests to monitor) but keep this in mind as you choose nests to monitor.
Timing of individual birds vary, so it is possible that not all birds will have built nests or laid eggs
when you first begin monitoring plots at the beginning of the season. On the first productivity visit (ideally
you will have made an initial visit to take photographs), give all active nests a number (you can write
directly on the plot photo with a permanent marker) and determine the nest status (see below). On
subsequent visits, new nests built (kittiwakes) or eggs laid (murres) in the plot since the last visit can be
4-2
Ledgenester productivity and phenology
added to your sample until you reach the required sample size. To be considered an active nest included
in your sample:
• For kittiwakes a nest structure to which vegetation or material has been added in the current year
(no egg or bird necessary) must be present.
•
For murres, an egg must be present (no bird necessary) or assumed (presence of an incubating
bird on two consecutive visits).
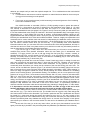
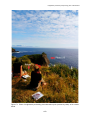
Use 10x40 binoculars or zoomable (15-45x or 15-60x) spotting scopes to assess the status of
each nest site [i.e., the presence of egg(s) or chick(s)] from the observation point (Figure 4). On each
visit, attempt to determine the status of all nest sites and record it in a field notebook using the
appropriate standardized code (see pages 8-10; Figures 5 and 6). Record only what you saw and be sure
to use the standardized codes exactly as instructed. Weird and unpredictable things can happen during
observations (e.g., a chick falling from one nest to another, a black-legged kittiwake usurping a redlegged kittiwake nest and brooding the “stolen” chick) and you may want to describe every detail and feel
limited by the standardized list of codes and modifiers available. However, lengthy text explanations and
comments tend to cause confusion later and cannot be interpreted by the database used to summarize
the data. Choose a code then and there and stick with it - as the field biologist, you are the only person
who can make a decision about what you saw that day. If you absolutely must record additional
information about a nest, you can enter text in the comments section of the data spreadsheet, but keep in
mind that this text is not used in any data summary so it should not contain any information pertinent to
how the reproductive success data should be interpreted.
If you see an egg or a chick, there are a few cases when you will need to record additional
modifiers that provide more detailed information about the nest status (list of standardized code
modifiers). For eggs, record if you see an old egg clearly from last year (Ely), a broken, crushed, or
otherwise dead egg (Ed), an egg ejected from the nest (Ej), or an egg pipping just before hatch (Ep).
Similarly, for chicks, record if you see a chick in the actual act of hatching (Co), a chick still wet from
having recently hatched (Cw), or dead chick (Cd).
Although you should aim to see and record a “known” status egg, chick, or nothing for each nest
each visit, in general do not spend more than 1.5 hours per plot each visit. Because you are limited to
indirect observation and because some birds remain motionless for long periods of time, you will
occasionally have sites where you cannot see the contents of the nest site during your entire visit. For
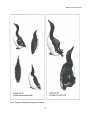
murres, we can use distinctive postures (Figure 7) to indicate if birds are incubating (wings held over the
back so that tips do not cross, tail down, back slightly humped) or brooding a chick ("wing mantling" in
which one wing is dropped to shelter the chick). On-site training will resolve definitions of "incubating
posture" and "brooding posture" (see attached drawing). For kittiwakes, we do not use postures to imply
presence of an egg or chick; if nest contents remain unknown after 1.5 hours, record an unknown status
(BU or U), move to the next plot, and make a concerted effort to confirm the status of that nest on the
next visit. If you have to record an unknown status but you see freshly-hatched eggshells or hear a chick
calling, record these as supplementary evidence (see list of standardized code modifiers); these do not
provide enough evidence of a chick to determine hatch dates, but may be used by the database in
analysis to help determine the overall fate of the nest in some cases. It is particularly important to
minimize unknown nest status codes around expected laying, hatching or fledging dates. In other words,
it is important to see the nest contents the check before and after an egg is laid and a chick
hatches and fledges, and to reduce the visit interval as much as possible at those times.
Before leaving the site, check to see that your recorded status makes sense based on what you
saw last time (e.g., if you had a chick last visit, you shouldn’t have an egg this visit). Data strings that
don’t make sense will have to be discarded. If you decide a particular nest site is problematic and should
be tossed [e.g., grass grew during the season and obscured your view, or you aren’t certain of the
species (see Figure 8 for murre identification clues)], don’t erase the data from your field notebook and
electronic productivity data entry database but simply mark it as “exclude from analysis” in both places
and indicate your reasons in the comments section for that nest in the database (see Database User’s
Manual).
At the end of the day (or at the very least, before you take your data notebook into the field
again), enter the day’s plot data in the productivity data entry database (see Database User’s Manual).
4-3
Ledgenester productivity and phenology
Safety: Working on cliff tops require special safety considerations. At all times, be aware of
yourself in relation to the cliff edge. Watch out for overhanging tussocks or rocks that might look stable
but could give way under your weight and never blindly assume an observation point used in past years is
necessarily safe this year, as cliffs can erode over the winter. Refrain from leaning out “just a little more”
to see a bird. If you happen to drop something over the edge, never lunge for it: nothing (including data)
is worth endangering yourself or others. Also take care when hiking to plots along trails that may follow
the cliff edge, as vegetation late in the season may be rank and can catch your feet.
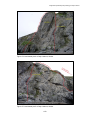
Mapping ledgenester productivity nests: Having accurate plot photos/maps is critical for following
individual nests throughout the season and thus collecting good ledgenester productivity data. It’s very
easy to lose track of the “marked” nests over the course of the season (especially for murres because
they don’t build nests, but it can happen with kittiwakes too if nests are completely lost). Do not rely on
variable characteristics such as position (e.g. #32 is the bird that usually faces the cliff) or order (e.g. #32
is the eighth bird in the row). You need to be able to identify each of your nests even if every neighbor
were to disappear (which may happen towards the end of the season as nests fail or fledge). To do this,
try to identify nests relative to rock or vegetation characteristics (although keep in mind that vegetation will
look dramatically different later in the season) and put effort into your maps. Photograph plots on slightly
overcast days - bright sunshine creates too much contrast and some sites will be in shadow. Also note
that rock formations appear differently depending on the weather and time of day; try to take plot
photographs during the time of day you expect most of your ledgenester monitoring to occur. If plots are
large, it can be useful to include zoomed-in insets or extra pages with zoomed-in windows that highlight
clusters with multiple sites and reveal details not visible in more zoomed-out photographs.
Timing when to take initial plot photos can be difficult. Maps need to be printed before monitoring
can begin, but if the photos are taken too early, birds may not be present at the sites where they will
ultimately breed. For kittiwakes, this is not an issue because their nests are immobile and adequately
spaced, making it difficult to confuse neighboring sites. You can take kittiwake map photos early in the
nest building process; if necessary, you can draw in new nests not present in the initial photo or take an
updated photo later.
Creating useful murre maps can be difficult because murres don’t build a nest structure, are
typically tightly spaced, and may not finalize positions on the cliff until most eggs are laid. You should
begin monitoring murres before all birds have laid (to catch birds failing early in incubation), however, so
you cannot wait until then to take initial plot photos (especially when laying is asynchronous). Therefore,
try to take murre plot photos when colony attendance becomes high but before the first eggs are laid.
Then, as laying proceeds and more birds settle into the positions they will retain throughout the season,
you can take new photos and transfer site numbers and notes onto updated maps.
If you have a laminator in camp, print maps on regular paper, laminate, and then use sharpies in
the field to write directly on the photo surface. If you use plastic sheet protectors, it is helpful to print initial
plot photos on waterproof paper so you can number sites/make notes using sharpies on the paper itself
(don’t write on plastic sleeves themselves because the inside map can shift around!); as the season
progresses and your maps are compete, tape the open edge of the plastic sheet protector shut to further
waterproof your maps. Using different colored markers to indicate different species or highlight rock
characteristics can be useful.
As with data notebooks, be conscious of losing maps over the cliff’s edge, especially in windy
conditions. Make sure to secure maps to a clipboard or three-ring binder that are themselves attached to
the observer or a stake. Any time you make additions or changes to a plot map (e.g., adding nest
numbers), take a photo for a backup copy in case the map is lost next time.
Data analysis.—Since 2010, calculations for productivity and phenology parameters for these
species have been automated in an Access database. Data should be entered and proofed as soon as
possible each day after returning from the field (see Data Entry Protocol). Proofed data will be uploaded
into the database for analysis at the end of the season.
The below analysis summary is included to help you to understand how your codes will be
interpreted by the database. This should give you an idea of what constitutes “good” data vs. data that
have to be discarded, which should help you schedule and prioritize your data collection efforts in the
field. The intent is not to reproduce the detailed documentation for the database and analysis process.
4-4
Ledgenester productivity and phenology
Phenology: Dates for egg laying, chick hatching and fledging are calculated using the midpoint dates.
The lay date (kittiwakes only) is assumed to be the midpoint between the last date when (definitely) no
egg was present and the first date when an egg was confirmed to be present. The hatch date is the
midpoint between the last time an egg was confirmed to be present and the first time a chick was
confirmed to be present. Not all nest sites are included in phenology calculations; we require confirmed
visualization of the empty nest site, egg, or chick (e.g., no U’s, BU’s, IP’s or BP’s) less than 7 days apart
for that site to be used. Because of this, try to project when each nest is expected to hatch and focus
extra attention on getting known statuses with short visit intervals around those times.
Occasionally, we record data that give us more exact information on laying, hatching and fledging
dates. If you observe an event occurring (e.g., the actual egg laying, hatching or fledging) during your
visit, we use the day of the observation as the date the event occurred and not the midpoint between
observations. Similarly, if a pipped egg is observed, we assume it will hatch the following day, and if a
wet chick is seen, we assume it hatched that day.
Productivity: Reproductive success is calculated as the number of known fate nest sites that fledged a
chick. If a nest “fails”, we keep track of what stage this happens (pre-laying, egg or chick period).
Determination of the fate of eggs and chicks is not always straightforward because we visit nests only
every 3-4 (and sometimes up to 7) days. As a result it is necessary to adopt some conventions for
consistency in interpretation.
For murres, incubating (IP) and brooding (BP) postures are used to imply an egg and chick,
respectively, for productivity purposes (but not, as indicated above, for phenology). Because it is possible
to misinterpret incubating postures, we use the convention that a site had to have a bird in IP on at least 2
consecutive checks to assume the presence of an egg. We consider brooding posture (BP) to be more
distinctive than incubating posture; therefore, 1 BP is sufficient to designate the presence of a chick.
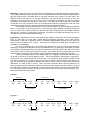
Unless you actually saw the chick departing the nest, “fledging” is determined arbitrarily based
on the age of the chick on the last date you saw it. This is determined by calculating the “egg period”,
“chick period”, and “uncertainty periods” for every nest. The “egg period” is the number of days from the
first definite observation of an egg (or the first of 2 IPs for murres) to the last definite observation of an
egg. The “chick period” is from the first definite observation of a chick (or BP in murres) to the last definite
observation of a chick (or BP in murres). There are some rules about what is and isn't allowed to be
within the egg and chick periods but in short, the data should make logical sense (for example, an egg in
the middle of a chick period would indicate a problem with the data and the nest site would be discarded).
The “uncertainty period” accounts for both the visit interval and any visits with unknown statuses (e.g.,
BU's) around hatch and fledge events.
Example 1:
Egg Period
Chick Period
11 Jun 18 Jun 24 Jun 30 Jun
BE
BE
BE
BU
3 Jul
BC
7 Jul
BC
13 Jul
BC
20 Jul
BC
Uncertainty Period
Around Hatch
24 Jul
BU
28 Jul
BU
4 Aug
N
8 Aug
N
4 Aug
N
8 Aug
N
Uncertainty Period
Around Fledge
Example 2:
Chick Period
Egg Period
11 Jun 18 Jun 24 Jun 30 Jun
BE
BE
BE
BE
3 Jul
BC
Uncertainty Period
Around Hatch
7 Jul
BC
13 Jul
BC
4-5
20 Jul
BC
24 Jul
BC
28 Jul
BC
Uncertainty Period
Around Fledge
Ledgenester productivity and phenology
From the length of the chick period and the uncertainty periods, we determine the minimum and
maximum possible age for the chick when it was last seen: a chick was at least as old as the length of the
chick period itself, and could possibly have been as old as the chick period + both uncertainty periods.
This information is then compared against fledging age conventions (see Table 1) to determine if the
chick failed, fledged, or if the nest should be discarded due to too much uncertainty. If a chick would
have been too young to fledge even at its maximum potential age (chick period + uncertainty), it is called
failed. If a chick would have been old enough to fledge even at its minimum age (chick period), it is called
fledged. If the chick would have fledged or failed based on the length of the uncertainty period, it is
considered unknown fate and discarded from the sample.
In general, the larger the uncertainty period, the more likely a nest will be discarded because the
chick’s fate cannot be determined. Therefore, large check intervals and/or many BU/U statuses around
hatch and fledge dates can cause a nest to be discarded from analysis. Keep this in mind when
collecting data (e.g., keep check intervals short and take the extra seconds to look extra hard for chicks
around expected hatch or fledge dates).
After determining a fate of each nest, the database will calculate summary statistics using all
nests with a known fate (not including any nests excluded manually by the data collector or discarded by
the database due to poor quality, unknown fate, etc.). Kittiwakes can have multiple eggs so we present
reproductive success for kittiwakes in two ways, using both the nest and the egg as a sample unit. For
kittiwakes, the database will calculate:
• Total nest starts (A) – number of known-fate active nest sites monitored
• Nest sites with eggs (B) – number of nest sites containing any eggs
• Total eggs (C) – number of eggs seen (the sum of the highest egg count from every nest)
• Nest sites with chick (D) – number of nest sites containing any chicks
• Total chicks (E) – number of chicks seen (the sum of the highest chick count from every nest)
• Nest sites with chicks fledged (F) – number of nest sites that fledged chicks
• Total chicks fledged (G) – number of fledglings (the sum of the highest fledgling count from
every nest).
From the above values, the following summary parameters are generated:
• Egg success (G/C)
• Laying success (B/A)
• Fledging success (F/D)
• Mean clutch size (C/B)
• Reproductive success (F/B)
• Nesting success (D/B)
• Fledglings per nest start (G/A)
• Hatching success (E/C)
• Productivity (F/A)
• Chick success (G/E)
Because murres lay just one egg and sites are not considered an active nest until an egg is laid, the nest
and the egg are essentially the same unit, so we only need to present murre reproductive success based
on one. For murres, the database will calculate:
• Nest sites with eggs (B) – number of nest sites containing any eggs
• Nest sites with chick (D) – number of nest sites containing any chicks
• Nest sites with chicks fledged (F) – number of nest sites that fledged chicks
From the above values, the following summary parameters are generated:
• Nesting success (D/B)
• Fledging success (F/D)
• Reproductive success (F/B)
For kittiwakes and murres, we also estimate variance around each reproductive success
parameter using ratio estimation procedures (Excel ratio estimator spreadsheet). This approach, also
known as cluster sampling, treats plots as the sample unit, rather than individual nest sites. We assume
that kittiwake and murre nest data are not always independent, as nests located close together (i.e., in a
plot) may be more likely to share a common fate (Byrd 1989).
4-6
Ledgenester productivity and phenology
Literature Cited
Ainley, D.G., D.N. Nettleship, H.R. Carter, and A.E. Storey. 2002. Common murre (Uria aalge). No. 666
in The Birds of North America (A. Poole, Ed.). Ithaca: Cornell Lab of Ornithology.
Byrd, G. V. 1989. Seabirds in the Pribilof Islands, Alaska: trends and monitoring methods. MS Thesis,
Univ. of Idaho, Moscow. 96 pp.
Byrd, G.V. and J.C. Williams.1993. Red-legged kittiwake (Rissa brevirostris). No. 60 in The Birds of North
America (A. Poole, Ed.). Ithaca: Cornell Lab of Ornithology.
Cairns, D.K. 1987. Seabirds as indicators of marine food supplies. Biologcal Oceanography 5:261-271.
Dragoo, D.E., G.V. Byrd, and D.B. Irons. 2010. Breeding status, population trends and diets of seabirds
in Alaska, 2007. U.S. Fish and Wildl. Serv. Report, AMNWR 2010/08. Homer,
Alaska.
Gaston, A.J. and J.M. Hipfner. 2000. Thick-billed murre (Uria lomvia). No. 497 in The Birds of North
America (A. Poole, Ed.). Ithaca: Cornell Lab of Ornithology.
Gill, V.A., S.A. Hatch, and R.B. Lanctot. 2002. Sensitivity of breeding parameters to food supply in blacklegged kittiwakes Rissa tridactyla. Ibis 144:268-283.
Hatch, S.A. and M.A. Hatch. 1988. Colony attendance and population monitoring of Black-legged
Kittiwakes on the Semidi Islands, Alaska. Condor 90:613-620.
Hatch, S.A., B.D. Roberts, and B.S. Fadely. 1993. Adult survival of black-legged kittiwakes Rissa
tridactyla in a Pacific colony. Ibis 135:247-254.
Hatch, S.A., G.J. Robertson and P.H. Baird. 2009. Black-legged kittiwake (Rissa tridactyla). No. 92 in The
Birds of North America (A. Poole, Ed.). Ithaca: Cornell Lab of Ornithology.
Kildaw, S.D. 1999. Competitive displacement? An experimental assessment of nest site preferences of
cliff-nesting gulls. Ecology 80:576–586.
Montevecchi W.A. 1993 Birds as indicators of change in marine prey stocks. Pp. 217-266 in Birds as
Monitors of Environmental Change (R.W. Furness and D.J. Greenwood, Eds.) London:
Chapman and Hall.
Thompson, N.J., H. Renner, J.H. Reynolds, and P.D. Sampson. 2010. Long-term monitoring of seabirds
on the Alaska Maritime NWR: a statistical review and analysis of productivity and hatch-timing for
black-legged kittiwake, murre, and least auklet colonies on Buldir Island. Unpublished report,
University of Washington.
4-7
Ledgenester productivity and phenology
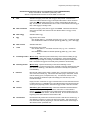
Standardized Productivity Codes: List of Productivity Codes (LEDGENESTERS)
Always use CAPITAL LETTERS for productivity codes
See list of “Important Rules to Follow” for more details on correct use
B
Bird
Adult bird occupying a nest site, with no egg or chick present. Used when the
observer is sure the bird has no egg or chick (this code means a site is confirmed
empty other than the adult bird, there is no need to combine B and N codes into
BN). For kittiwakes, used between the time a nest is constructed and the first egg is
laid, or after egg(s) or chick(s) is lost.
BU
Bird w/ Unknown
Adult bird occupying a site, with no egg or chick visible. Used when the observer
cannot see the entire nest contents to be sure whether there is an egg, a chick,
or nothing.
BE
Bird w/ Egg
Adult bird with an egg.
E
Egg
Egg present, with no adult.
Use numbers and/or “+” to indicate more than one (e.g., E2+ = at least two eggs)
Use standardized modifiers to describe special egg status (e.g., Ed = dead egg)
BC
Bird w/ Chick
Adult bird with chick.
C
Chick
Chick present, with no adult.
Use numbers and/or “+” to indicate more than one (e.g., C2+ = at least two
chicks)
Use standardized modifiers to describe special egg status (e.g., Cd = dead
chick)
IP
Incubating Posture (Murres only) A distinctive posture assumed by murres when incubating an egg.
Characterized by sitting well forward, tail clamped down, wings dropped slightly
with the wing tips usually not crossing, and a distinctive hump in the middle of the
back. Used when the egg was not actually seen (otherwise it would be BE).
BP
Brooding Posture
U
Unknown
(Murres only) A posture assumed by murres when sheltering a chick.
Characterized by a pronounced wing drop, especially of the wing sheltering the chick
(also known as mantling). Used when the chick was not actually seen (otherwise
it would be BC).
Nest site with nothing clearly visible. Seldom used - only when the observer is not
sure of the nest contents (e.g., cliff nest site obscured by fog or other birds, crevice
nest site offering a poor, incomplete view, etc.). If an observer records “U” many
times, especially at crucial times (hatch and fledge), the nest site may not be
included in analysis.
N
Nest
Empty nest site. Used when an egg or chick that was in the nest has been lost and
no adult is present. For kittiwakes, this code indicates that a nest structure from the
current year is physically present, either before eggs are laid or after the nest fails.
NN
No Nest
(Kittiwakes, gulls, cormorants only) Used when a kittiwake nest that had been
active in the current year disappears. Use this code when no nest material is
present, regardless of the presence of an adult bird (if a bird is standing at the old
site and no nest material remains, use NN and not B). Do not use this code at the
beginning of the season before a nest is built at a site.
NC
Not Checked
Used between the previous and current check, when a site was not checked (e.g., it
was skipped on purpose) or could not be found on that date. This code does not
have to be used at the very beginning or end of the season before checks begin or
after checks end for a particular nest.
4-8
Ledgenester productivity and phenology
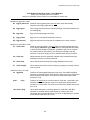
Standardized Productivity Codes: List of Modifiers
Always use lowercase letters for modifiers!
See list of “Important Rules to Follow” for more details on correct use
Modifiers to egg status codes
Eo Egg lay observed Observer sees egg being laid; used only when event was actually
observed, not simply suspected lay
Ep Egg pipped
Hole in egg, sometimes chick bill poking through; hatch date determined to
be following day
Ed Egg dead
Egg is obviously damaged or broken
Ej
Egg once in a nest ejected outside the nest cup
Egg ejected
Ely Egg last year
Egg assumed to be from last year from appearance or other evidence
Modifiers to chick status codes
Co Chick hatch
Observer sees chick hatch; used only when event was actually observed,
not for pipping observed eggs, observations of newly-hatched wet chicks,
or other reasons leading to suspected “probable” hatch. Do not combine
Co modifier with Cw (see below) if you observe a hatching event that
results in a wet chick; simply use Co to indicate hatch and not Cow/Cwo
Cw Chick wet
Newly-hatched wet chick observed; indicates chick hatched that day but
hatching event was not actually observed
Cd Chick dead
Chick actually observed dead (not simply disappeared from nest)
Cf
Chick actually observed in the act of flying (or jumping for murres) from the
nest; very rare!
Chick fledged
Additional clues to nest fate
sh eggshells
poop
poop
call chick calling
Presence of fresh eggshell fragments in the nest. Used ONLY with Bird
Unknown or Unknown status codes (BUsh or Ush) to give more information
about potential hatch; there is no need to use with known status codes
(such as C or N)
Presence of fresh poop in or at the entrance of the nest. Used ONLY with
Unknown status code (Upoop) to give more information about potential
presence of a chick; there is no need to use with known-status codes (such
as C or N)
Chick heard calling but not actually observed. Used ONLY with Bird
Unknown or Unknown status codes (BUcall or Ucall) to give more
information about potential presence of a chick; not appropriate to use with
known-status codes (such as C or N)
4-9
Ledgenester productivity and phenology
Standardized Productivity Codes: Important Rules to Follow
Use capital letters for basic productivity codes and lowercase letters for modifiers.
superscripts or subscripts for any modifiers. Do not put spaces between any characters.
Do not use
Use numbers to indicate quantities of birds, eggs, or chicks greater than one (do NOT use 1 to indicate
single numbers). Numbers should always go AFTER the code that the number describes.
e.g., B2E means two adult birds with a single egg
BE2 means a single adult bird with two eggs
Use a plus sign (+) when you can see at least some but not all nest contents in multiple-egg clutches. As
with numbers, the plus sign should always go AFTER the letter code (and when more than one, also after
the number) that is being described.
e.g., BE+ means an adult bird and at least one egg were observed but entire nest contents could
not be seen to determine if there was anything more
BE2+ means an adult bird and at least two eggs were observed but entire nest
contents could not be seen to determine if there was anything more
Some codes and modifiers can be combined when appropriate as long as order (see below) is
maintained. For instance, with multiple-egg species, if one egg hatches before another so that there is an
adult bird present with both an egg and a check, enter BEC.
The specific order in which these codes and modifiers are used is VERY IMPORTANT. The codes BEC
and BCE, or BE2+ and BE+2, may mean the same thing to us but they are NOT the same to the
computer database. Follow these rules for the correct order of codes and modifiers:
(1) Always write codes in the order of adult - egg - chick.
e.g., BE and not EB
(2) When adding modifiers (numbers, letters, or symbols that give more information), always
follow the order of: main productivity code - letter modifier - number - plus sign
e.g., BEp2+ for adult bird with at least two pipped eggs
BE2Cd for adult bird with two eggs and one dead chick
B2E+Cd for two adult birds with at least one egg and one dead chick
4-10
Ledgenester productivity and phenology
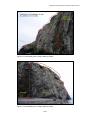
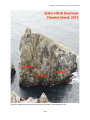
Figure 1. Example plot overview photo for ledgenester productivity, showing plot locations from the observation point (note: at
some sites, multiple plots are viewed from the same observation point, as shown here; at other sites, each plot has its own
observation point).
4-11
Ledgenester productivity and phenology
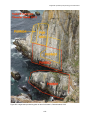
Figure 2. Example close-up plot photo for ledgenester productivity with numbered nest sites.
4-12
Ledgenester productivity and phenology
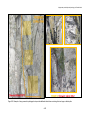
Figure 3. Another example close-up plot photo for ledgenester productivity with numbered nest sites.
4-13
Ledgenester productivity and phenology
Figure 4. Crew member doing ledgenester productivity check from observation point.
4-14
Ledgenester productivity and phenology
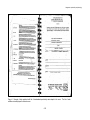
Figure 5. Example of data notebook page for recording ledge-nester productivity data.
4-15
Ledgenester productivity and phenology
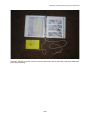
Figure 6. Example of data notebook with list of standardized productivity codes taped to the cover. The list of code
modifiers is similarly taped to the back cover.
4-16
Ledgenester productivity and phenology
Figure 7. Diagrams of incubating and brooding postures in murres.
4-17
Ledgenester productivity and phenology
Figure 8. Clues for distinguishing between common and thick-billed murres.
4-18
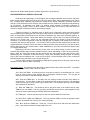
Ledgenester productivity and phenology at Aiktak Island
Attachment A. Aiktak Island specifics (includes Figure A1 and Table A1)
BACKGROUND AT AIKTAK
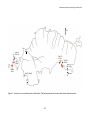
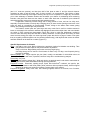
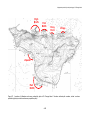
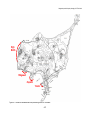
Productivity and phenology of common and thick-billed murres at Aiktak is monitored on seven
plots spread around the western and southern coasts (Figure A1 and Table A1). Murres generally begin
laying in July. Historically, birds on the easternmost plots (5, 8, and 10) often laid earlier, in early July,
while birds on the westernmost plots (1, 2, and 3) laid slightly later, in mid- to late July.
Since 2002, however, murre breeding at Aiktak has been scattered and unreliable, with few to no
birds laying in productivity plots. This failure makes monitoring murre productivity unsatisfying and you
will probably end up with just a few birds on each plot (if that!) to follow. Nonetheless, at the beginning of
the season you have to prepare for the best possible scenario (that many birds will lay and you will
achieve your full sample size); just don’t be surprised if they are late and not very productive.
Watch the behavior of birds attending the cliffs for clues as to when (or if) laying will occur.
Attendance on the cliffs starts to become more regular about week or two before laying commences, so
watching for attendance to stabilize can be a good way to predict when birds will begin to lay. You can
also get an idea of whether murres will breed by paying attention to their posture on the cliffs. Birds
oriented with their breasts inwards towards the cliffs and backs facing the ocean may be serious
breeders, while birds loafing on rocks with breasts facing outwards are not breeding.
PROCEDURE DETAILS SPECIFIC TO AIKTAK
Beginning in late June or early July, begin conducting reconnaissance of murre plots, looking for
indications that attendance is stabilizing or birds are showing signs of intention to breed (facing inwards
on the cliffs). Once murres begin laying, check nests every 4-7 days (4 day-intervals around expected
hatch and fledge dates) and aim to follow about 30 birds of each species (this is ideal: in reality at Aiktak
you will follow all birds with eggs in plots, far fewer than 30 per species). Ravens are often persistent and
effective predators of murre eggs on Aiktak (especially in years when few birds lay), so it is important to
catch and begin monitoring nests as soon as possible after they are laid to document egg loss to
predation.
Productivity plots on Aiktak are relatively far from observation points and require the use of a 1545x spotting scope. Some plots are divided into subplots in some year (two subplots in plots 8 and 10,
three in plot 3l); see plot photos for divisions. Note that all the productivity plots are also population plots
(see Ledgenester Population Protocol), but some are viewed from different observation points when
monitoring productivity versus populations. Even in years when there are only a few birds breeding, one
person should follow the same plot throughout the season; do not switch off, as this usually causes
confusion.
It is usually difficult to hike across the island to the plots on the far east end without getting
sweaty, which then makes for a very cold, clammy time sitting for hours in damp, sweaty clothes doing
murre productivity. Most people prefer to bring a spare set of clothes to change into once arriving at the
observations points.
The observation point for productivity in plots 1 and 2 is located on Big West Island (Figure 10),
which requires access through the intertidal area between Aiktak and Big West Island. This is only
accessible at negative tides, and even then often requires the use of high chest waders. You must plan
ahead for days with sufficiently low tides and take great care not to get stranded as the tide comes in. In
past years, some people have floated across to the island in survival suits, but the potential danger of
being swept away by a strong current is very real. In addition, it may be possible to use the skiff on calm
days to access a slot on the west side of the island, if you have a skiff available. However, this area is
very rocky and kelpy and there is often strong currents and surge between Big West Island and other
nearby islands, so use extreme caution (and make sure to fasten the anchor securely so that the skiff
does not drift away while you are doing your work). Ideally, try to access the island over land.
4-19
Ledgenester productivity and phenology at Aiktak Island
Specific Requirements for Aiktak
Dates: Late June or early July: Begin visiting plots to look for laying.
July-August: Check status of nests every 4-7 days, most frequently during hatching and fledging.
Optimal sample size: 30 per species per plot (ideal; usually not attainable at Aiktak).
Time of day: Any time.
Weather: Good visibility (minimal fog). Wind and rain do not preclude work but do tend to make birds sit
tighter and can make observations through optics problematic.
®
Equipment needed: Binoculars, spotting scope, tripod, Rite-in-the-Rain notebook, two pencils, plot
photos (laminated or with clear plastic photo protectors with tops taped closed).
Equipment suggested: Crazy creek chair, lens cleaning cloths, thermos of hot drink, lots of snacks,
complete change of clothes, camera.
4-20
Ledgenester productivity and phenology at Aiktak Island
N
Pole 48
(Plot 1, 2)
Pole 07
(Plot 7)
2
1
Big
West
I.
Pole 89
(Plot 8)
8 7
10
Tuxedo
Rock
Pole 51
(Plot 5,10)
5
Pole 23 (Plot 3)
Sail Rock
3
Figure A1. Locations of murre productivity plots at Aiktak Island. Red lines approximate plot locations; dots indicate observation points.
4-21
Ledgenester productivity and phenology at Aiktak Island
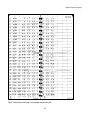
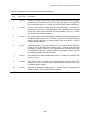
Table A1. Descriptions of murre productivity plots at Aiktak Island.
Plot
Obs. Point
Description
1
Pole 48
On the east side of Tuxedo Rock, a small island just beyond Big West Island.
Productivity is monitored from pole 48, on Big West Island (note: population
plot is counted from pole 01). To date, only common murres have nested here.
2
Pole 48
A small rocky peninsula jutting west off Big West Island. Productivity is
monitored from pole 48, on Big West Island (note: population plot is counted
from a large yellow lichen-encrusted rock just northwest of pole 23). To date,
only common murres have nested here.
3
Pole 23
The southern cliff of the Southwest Bight, including both the large cliff-face and
a smaller peninsula jutting out to the west. Usually a mix of thick-billed and
common murres nest here. Plot best viewed during the afternoon. Can be
divided into three subplots.
5
Pole 51
Triangular offshore rock at the southeast tip of the island, called Sail Rock.
Usually a mix of thick-billed and common murres. Productivity is monitored
from about 3m south of pole 51 (note: population plot is counted from about
2m southeast of pole 89). Caution should be used due to eroding soil and
overhanging vegetation around both areas.
7
Pole 07
Entire west face of small peninsula west of plot 6. Usually a mix of thick-billed
common murres.
8
Pole 89
Top portion of cliff face viewed look back at southern cliffs from east end of
island, east of plot 9. Usually a mix of thick-billed and common murres. Can
be divided into two subplots.
10
Pole 51
East face of peninsula containing plot 7. Usually a mix of thick-billed and
common murres. Can be divided into two subplots.
4-22
Ledgenester productivity and phenology at Buldir Island
Attachment B. Buldir Island specifics (includes Figures B1-2 and Table B1)
PROCEDURE DETAILS SPECIFIC TO BULDIR
Productivity and phenology of black-legged and red-legged kittiwakes and common and thickbilled murres at Buldir Island are monitored in two main areas: Spike Camp and Kittiwake Lane (Figure
B1). At Spike camp, kittiwakes and murres are monitored by viewing individually numbered nests and
sites at 4-7 day intervals from the cliff-tops; this provides the main measure of productivity and phenology
for all species. At Kittiwake Lane (KWL), an addition rough estimate of kittiwake productivity is
determined using using the “Boom or Bust” method, in which nests are counted in June and chicks are
counted in August to estimate maximum productivity potential.
Frequent monitoring of individual nests at Spike Camp: Historically, there have been several
more productivity plots along the cliffs near Spike Camp than are monitored now (Figure B2; Table B1).
Some of these plots were difficult to work because of persistent fog, have been combined together, or
have succumbed to erosion. Select plots where you will have a good view of at least 25-30 birds per
species in the current year. Since you are somewhat limited by the number of plots that can be
monitored, try to follow enough birds in each plot with the goal of reaching a total sample size of 250-300
monitored nest sites for each species. You will not be able to reach the ideal sample size for either redlegged kittiwakes or common murres but make an attempt to follow every nest site you can find for these
species wherever they are located unless it adds substantially to your time commitment at Spike Camp
(i.e. staying another day).
Beginning in the first or second week of June, hike over to Spike Camp to scout out plots, get
oriented and possibly begin selecting kittiwake nests to follow (depending on how far along they are).
Bring a GPS, last year’s plot photos and data books and take new photos of each plot from the main
observation point. Thereafter, revisit plots every 4-7 days, most frequently during the peak of hatching
(mid- to late June for kittiwakes, mid - to late July for murres). Around the third week of June, murres will
probably begin laying; add them to your sample as they do.
You can use the timing of the kittiwakes at Spike plots to gauge when to start your nest counts at
Kittiwake Lane for “Boom or Bust” monitoring.
Plot specific notes: The following notes are solely for plots that have been used since 2007. A complete
list of all plots that have been used is found in Table 5.
36A: BLKI and TBMU. A small plot and you may have to settle for a small sample size. Avoid
trying to follow murres in large clusters with no geographic reference points. You may get 20
sites if you continue to add late nesting individuals.
36B: BLKI and TBMU plot. Is far away from the viewing location and has many difficult to
observe sites. You may have to settle for a small sample size on this plot as well. Use a spotting
scope and feel free to move around to get a better view. You should be able to get 25-30 TBMU
sites combined in 36A and B.
37: BLKI and TBMU plot. You should be able to get good views of 25-30 BLKI and as many
TBMU as you can handle. This is a very large plot and the murres tend to crowd together so only
choose to monitor sites with good visibility and obvious landmarks.
38: TBMU plot. A narrow plot above plot 37 that can yield a handful of murre sites.
39: BLKI, RLKI, COMU, and TBMU plot. The only plot with COMU so make an attempt to follow
as many as possible even if they’re not of the best quality.
40A: BLKI, RLKI and TBMU plot. Good plot. Look for RLKI left of and below the observation
point. Use caution around the eroding edge of the cliff.
4-23
Ledgenester productivity and phenology at Buldir Island
40B: BLKI and TBMU plot. Plenty of good murre sites but it can get crowded so choose sites
with good visibility and obvious landmarks. Watch for potential RLKI nests lower on the cliff face.
45: BLKI, RLKI and TBMU plot. A good plot with the potential for several RLKI, particularly lower
on the cliff face. The growing vegetation will obscure your view of the lower nests but you can
clip the grass to maintain visibility. Do not hack at the vegetation with a machete as you will
disturb the birds nesting in plot 46 directly below your observation point.
46: BLKI, RLKI, and TBMU plot. Has lots of BLKI and a fair number of RLKI on the lower cliff
face. You may have to stand in order to follow as many as possible.
Suggested division of labor: Each crew member will have a set of plots he/she will monitor throughout the
entire season. Try to split the workload as evenly as possible, taking into account plot quality (i.e., don’t
give one person all the close, easy plots), species (i.e., don’t give one person all the kittiwakes and
another all the murres), and hiking time to plots. One suggestion for splitting the workload between three
crew members is as follows:
Person 1: 36 A,B, 39
Person 2: 37, 38, 45
Person 3: 40 A,B, 46
Of course, the above description is just a suggestion and can be adjusted based on the overall work load,
experience level and preferences of each observer.
Boom or Bust monitoring at Kittiwake Lane: In order to get some idea of geographic differences
in timing and success, kittiwake productivity is also estimated on the north side of the island using the
“Boom or Bust procedure.” This method generates success parameters from a count of nests conducted
early in the nesting period (representing initial reproductive effort) and then a count of visible large chicks
conducted late in the nesting period (representing success). This method can provide a rough index of
success, but no phenology data.
Early in the kittiwake nesting period (ideally when nest building is complete but before nests begin
to fail), count all nests for which you will later be able to determine the nest contents within several areas
at KWL. KWL is divided into 15 population plots, the boundaries of which are marked on the cliff and
documented on photo maps that are kept in the “Photos/Maps: Pop Counts” binder as well as on the
camp laptop. A fairly easy way to select an area to sample would be to count within the boundaries of a
population plot (often defined by large and obvious gullies) up to a height at which you will be able to
easily see the presence of chicks from the beach below. Photograph and draw an outline around these
areas for reference when returning for later counts. The areas counted may be different every year, but
generally the plots from 7-12 should be best for these purposes. You want a total of about 200-300+
nests if possible. Choose areas that are clearly defined (either on a photograph or with geographic
features) so that they are easily recognized and the exact same area will be counted on each visit.
Because you will probably find more BLKI than RLKI, you could possibly have different boundaries for
each species in order to obtain your sample size. Be sure to include as many plots as practical to reach
your sample size. If your entire nest count is made within one plot and a rockfall or large landslide occurs
between your counts, your data may be unusable.
Later in the nesting period, when chicks are large enough to be clearly visible from the beach
below nests, but before any chicks could have fledged, return to count all visible chicks in nests within the
exact same area you counted in spring. Record the number of chicks in each nest to attain information
on clutch sizes, as opposed to simply recording the overall total. Try to avoid counting chicks on cold,
wet, windy days when even large-sized chicks may be hunkered down in the nest out of view. If you
know that you conducted your count at the wrong time (not all nests built or chicks too small etc), recount
the same area and use your best count for your estimate.
Safety note: The cliffs of Buldir are comprised of rocks embedded in dirt and are very susceptible
to erosion and rockfalls. Use caution when selecting observation points as the cliff top can be undercut
with nothing below to support your weight. Try to view your intended observation point from a spot further
4-24
Ledgenester productivity and phenology at Buldir Island
along the cliff to determine if it is sufficiently stable. It is very important to always wear a hard hat and
stay alert whenever walking to/from or working at KWL. It is tempting to listen to music to make the walk
seem to pass more quickly but wearing earphones is not recommended as you will often hear rockfalls
and slides before you see them. When walking between Main Camp and KWL, be sure to pause at the
leading edge of any slides and check for activity before continuing. While counting birds and nests, do
not sit at the mouth of any gullies as rockfalls can occur without warning. The cliffs become more active
following heavy rains so be flexible in your scheduling of work at KWL to avoid these times. The hazards
of working under cliffs can be unpredictable but by remaining aware, using common sense and
minimizing your time in high-risk areas you will drastically reduce your exposure to any danger.
Specific Requirements for Buldir – Frequent Nest Monitoring (Spike Camp)
Dates: First or second week of June: Initial plot reconnaissance.
First week of June through end of season: Check status of nests every 4-7 days, most frequently
during the peak of hatching (mid- to late June for kittiwakes, mid- to late July for murres).
Third week of June: Begin adding murre sites once they begin laying.
Optimal sample size: Aim for minimum of 25-30 nests for each species per plot (250-300 total nests per
species); this will not be possible for red-legged kittiwakes or common murres.
Time of day: Daylight hours.
Weather: Good visibility (minimal fog). Wind and rain do not preclude work but do tend to make birds sit
tighter and can make observations through optics problematic.
®
Equipment needed: Binoculars, spotting scope, tripod, Rite-in-the-Rain notebook, two pencils, plot
photos (laminated or with clear plastic photo protectors with tops taped closed), ultra-fine tipped
Sharpies for writing nest numbers on photos.
Equipment suggested: Crazy Creek chair, clipboard, large rubber bands or binder clips to keep items
from blowing off of clipboard, thermos with a hot drink, lots of snacks, lens cleaning cloths, plenty
of warm clothes, camera, and machete (for trail to Spike Camp).
Specific Requirements for Buldir – Boom or Bust (KWL)
Dates: Mid-June to mid-July (when nest building is complete but before nests begin to fail; judge from
Spike Camp timing): Count nests on Boom or Bust plots.
Early to mid-August: Count large kittiwake chicks per nest on Boom or Bust plots.
Optimal sample size: Count all nests once, count all chicks once.
Time of day: Daylight hours.
Weather: Good visibility (minimal fog). Wind and rain do not preclude work but do tend to make birds sit
tighter and can make observations through optics problematic.
®
Equipment needed: Binoculars, spotting scope, tripod, Rite-in-the-Rain notebook, two pencils, plot
photos (laminated or with clear plastic photo protectors with tops taped closed), tally counters and
hard hat.
Equipment suggested: Crazy Creek chair, clipboard, large rubber bands or binder clips to keep items
from blowing off of clipboard, thermos with a hot drink, lots of snacks, lens cleaning cloths, and
plenty of warm clothes.
4-25
Ledgenester productivity and phenology at Buldir Island
MAIN
CAMP
NORTH
MARSH
Kittiwake Lane
SLIDE
MOUNTAIN
ROUND
MOUNTAIN
Spike Camp
SPIKE
CAMP
Figure B1. Locations of ledgenester productivity plot areas at Buldir Island. The red dashed line indicates the approximate route to Spike Camp
from the main camp.
4-26
Ledgenester productivity and phenology at Buldir Island
37
38
36
39
45
46
40
SPIKE
CAMP
Peregrine Pt.
Trail to beach
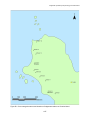
Figure B2. Locations of kittiwake and murre productivity plots at Spike Camp, Buldir Island.
4-27
Ledgenester productivity and phenology at Buldir Island
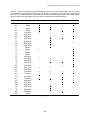
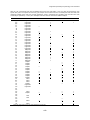
Table B1. List of Spike Camp productivity plots used for kittiwakes and murres at Buldir Island. Plot use
has varied over time; x’s indicate plots used since 2000, with underlines indicating those used most
recently (2007-2011).
Plot
BLKI
30 A,B
31 A,B
32
33
34 A-C
35
36 A,B
37 A,B
38 A,B
39 A-D
40 A
40 B
41
42
43
44
45
46
X
RLKI
COMU
X
X
X
X
X
X
X
X
X
X
X
X
X
X
X
X
4-28
X
TBMU
X
X
X
X
X
X
X
X
X
X
X
X
X
Ledgenester productivity and phenology at Cape Lisburne
Attachment C. Cape Lisburne specifics (includes Figures C1-7 and Table C1)
PROCEDURE DETAILS SPECIFIC TO CAPE LISBURNE
Black-legged kittiwake productivity is monitored every year at Cape Lisburne. Nest sites that are
low enough to allow for a reasonably good view of large chicks should be assigned numbers and labeled
on photos fairly early in the crew’s stay. Close-up photos of sections of the cliffs should be used for this
purpose. The population plot photos are not suitable to be used for marking individual nests.
Land-based plots are located along First Beach (Figure C1). To get to First Beach, drive east
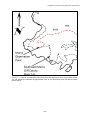
past the runway and turn right just before the western end of the runway (route marked in red on Figure
C2). Drive down the steep road between the wind sock and the gravel storage area to get to the beach.
Once on the beach, drive as near to the water’s edge as is safe (yellow “x” on Figure C2) and look
westward along First Beach through binoculars to check for bears on the beach (this also is a good place
to ensure that the surf is not too high to safely proceed down the beach to the plots). Be sure to look
behind you (eastward) to make sure there are no bears on the runway or on the seawall heading your
way; and scan the hills above the beach for bears that might be heading down.
If there is a bear (or bears) on the beach, do not proceed to the plots. Delay the work until the
bear(s) clears the area. Although there are two places (chutes) where a bear can potentially climb up
from the beach, it is best not to assume that they will do so. It is not a good idea to trap a bear at the
western end of the beach. If, after you get down to the plots, a bear enters onto the beach between you
and the way back to the buildings, proceed slowly towards the bear on your ATVs. Spread out and stand
up on your ATV to make as large a picture as possible and make a lot of noise. Once a bear sees you, it
usually will head back up the beach or climb the hills or chutes to allow you to pass. Make sure that your
bear defensive measures (spray, flash/bangs, gun) are readily accessible and give the bear ample time to
clear the area before proceeding. Be alert for bears any time you are outside of a building during
your stay at Cape Lisburne. Also, periodically scan for bears during counts. Don’t get so absorbed in
counting that you forget about situational awareness.
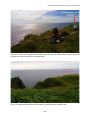
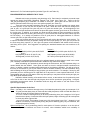
Productivity is monitored at a selection of relatively low nests on land plots 4, 5, 6, and 7 (Figures
C3-7; Table C1). Most viewable nests are on plots 4 and 5 but there might be a few on plot 6 and/or 7 in
some years. Once the nests are marked on the zoomed-in photos, check the numbered nests for large
chicks as soon as you are able to see chicks in the nest (usually sometime after the first week of August).
The plots should be visited several times as late in your stay as possible. Record which nests still contain
chicks and note how many chicks there are in each nest.
Specific Requirements for Cape Lisburne:
Dates: Mid- to late July (mark nests on photos) until as near the end of your stay as practicable, to allow
the chicks to grow as large as possible.
Optimal sample size: There usually are about 100 kittiwake nests that are low enough to use for
productivity. Use the maximum number that are viewable.
Time of day: Daylight hours.
Weather: Good visibility (minimal fog). Wind and rain do not preclude work but do tend to make birds sit
tighter and can make observations through optics problematic, especially looking up at nests from
the beach.
®
Equipment needed: Binoculars (10-power recommended), Rite-in-the-Rain notebook, two pencils, plot
photos (laminated or with clear plastic photo protectors with tops taped closed), ultra-fine tipped
Sharpies for writing nest numbers on photos, helmet for working near the base of the cliffs
(climbing helmets work best), bear defense equipment, hand-held radio, insect repellant.
Equipment suggested: Thermos of hot drink, lots of snacks, lens cleaning cloths, complete change of
clothes, camera, spare batteries (for radios, camera, etc.).
4-29
Ledgenester productivity and phenology at Cape Lisburne
(Land Plots 1-8 and A/B)
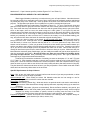
Figure C1. Map of seabird monitoring plots at Cape Lisburne, Alaska.
4-30
Ledgenester productivity and phenology at Cape Lisburne
Figure C2. Route from the Cape Lisburne living quarters/shop area to First Beach at the western end of
the runway (red line). Yellow “x” marks the location from which to scan for bears on the beach below the
land plots before proceeding to the plot area. Yellow circle is the location of the Flight Shack storage
building. Yellow square indicates the location of sea surface temperature measurement and skiff
launching beach.
4-31
Ledgenester productivity and phenology at Cape Lisburne
Table C1. Locations of First Beach land-based plots at Cape
Lisburne (in order from east to west). All coordinates are in
WGS84.
Plot
a
B/A
1
2
8
3
a
4/5
a
6/7
a
Latitude (º N)
68º 52.71’
68º 52.73’
68º 52.75’
68º 52.76’
68º 52.77’
68º 52.78’
68º 52.79’
Longitude (º W)
166º 09.72’
166º 09.97’
166º 10.26’
166º 10.45’
166º 10.57’
166º 10.74’
166º 10.80’
Midpoint between adjoining plots.
Figure C3. Kittiwake nest contents are observed from the beach below the cliffs. Observations are made
while seated on 4-wheeler ATVs, using binoculars. It’s a good idea to wear a helmet when working close
under the cliffs (right). Stay alert for bears.
4-32
Ledgenester productivity and phenology at Cape Lisburne
Figure C4. Land-based plot 4 at Cape Lisburne, Alaska.
Figure C5. Land-based plot 5 at Cape Lisburne, Alaska.
4-33
Ledgenester productivity and phenology at Cape Lisburne
Figure C6. Land-based plot 6 at Cape Lisburne, Alaska.
Figure C7. Land-based plot 7 at Cape Lisburne, Alaska.
4-34
Ledgenester productivity and phenology at Chowiet Island
Attachment D. Chowiet Island specifics (includes Figures D1-7 and Tables D1-2)
PROCEDURE DETAILS SPECIFIC TO CHOWIET
Productivity and phenology of black-legged kittiwakes and common and thick-billed murres at
Chowiet Island are monitored in one area: the Ledgenester Cliffs (Figure D1). In addition, a rough
estimated of northern fulmar productivity is determined by counting chicks late in the season.
Fulmar productivity has not been monitored intensively in recent years. Instead, the number of
chicks in each population plot is counted at the end of the season to get a rough index of productivity that
can be compared across years. Because the methodology of fulmar chick counts is nearly identical to
methods used for population counts, details are included in the Ledgenester Population Protocol.
Kittiwake and murre reproductive performance is monitored by viewing individually numbered
nests and sites at 3-5 day intervals (bad weather sometimes necessitates longer intervals between visits).
Shorter intervals are ideal, but on Chowiet, 4-5 day intervals are more realistic. A target of 10 plots with
adequate numbers of sites is recommended for each of the three species monitored at Chowiet; however,
it is often difficult to find enough thick-billed murres to constitute 10 plots, even when plots are combined
to increase sample sizes. Plots are viewed from a subset of the stakes used for ledgenester population
counts (Table D1 and Figure D1). Kittiwakes are typically monitored at stakes 3, 6, 9, 10 and 11 (although
too few nests have been present at stake 11 for monitoring in recent years). Common and thick-billed
murres are typically monitored at stakes 3 and 9. Although the number, naming and boundaries of plots
monitored has been somewhat variable among recent years, plot details for each species in 2012 (which
is representative of recent years) are presented in Table D2, and mapped in Figures D2-5. This table is a
good guideline for selecting which plots to monitor, and should be followed unless bird distribution is
atypical and not enough sites are present.
If different plots are monitored, ensure that the plots are representative of the island as a whole.
On Chowiet, most common murres breed in large, dense clusters of birds. Although plots in these areas
(such as P03M13,14,15 and 16) are more difficult to accurately monitor than plots with birds in more
linear and less dense configurations, it is important to monitor plots in these dense clusters to ensure
productivity measurements representative of the population.
As of 2012, the earliest first lay date recorded for black-legged kittiwakes on Chowiet was 2 June.
In order to obtain laying chronology data, it is recommended that nest monitoring begin as soon as nests
are present. Murres, however, are not monitored until an egg or incubation posture is seen. Scan plots for
any sign of egg laying, typically while conducting kittiwake monitoring, and begin monitoring sites as eggs
are laid. On Chowiet, mean hatch has occurred as early as 13 July, which indicates that mean lay has
occurred as early as mid-June. It is important to only monitor sites where the egg was identified soon
after it was laid in order to avoid biasing your sample towards more successful breeders (i.e. you
shouldn’t have sites where a chick is seen after only a couple of weeks of monitoring).
All plots at stakes 3, 10, and 11 can be monitored with binoculars (although some crews prefer
using a scope at 10 and 11). A spotting scope is imperative at stakes 6 and 9; because these sites are
monitored from a greater distance and at a higher elevation, monitoring attempts are more susceptible to
impediment by high winds or fog. Many crews find it useful to stash a tripod and scope at stake 9 (and
stake 6 if monitoring at these sites is conducted on the same day by different observers, see below).
Scopes and tripods left at the stakes should be stored inside a dry bag (with a trash bag liner) clipped to
the stake, and should not be put away wet. Because of exposure and the greatest distance from vantage
to plots, the heaviest tripod and best scope (presently the Pentax) should be devoted to stake 9. A lower
quality tripod and scope (presently the Bushnell) are adequate for stake 6 if a second set is to be stashed;
this frees up the Nikon scope for use at the cabin and during the raft count survey. Stake 3, where the
majority of plots occur, is fairly sheltered, and monitoring can be conducted in almost any weather.
Except late in the season or when failure rates are high, ledgenester monitoring on Chowiet
typically requires two full days by two people. Plots at stakes 6 and 9 take the longest to complete. At
sites monitored with binoculars, observers can scan large areas and quickly focus in on sites where the
bird is stirring and likely to reveal contents. Because monitoring is done by scope at 6 and 9, scanning is
more difficult and it is instead necessary to stare at small clusters of birds for more extended periods until
statuses have been obtained. This can be time consuming so it is recommended that fewer clusters—as
defined by the field of view of the scope—with more densely spaced sites (as opposed to a more
scattered collection of sites) be selected for monitoring. Having one observer committed to stakes 9, 10
4-35
Ledgenester productivity and phenology at Chowiet Island
(and 11 if nests are present), and less than half of the plots at stake 3, and the second observer
committed to stake 6 and the larger “half” of plots at stake 3 is recommended. This division of labor
ensures that all monitoring at the higher stakes (6 and 9) can be completed in a single day—this allows
you to take advantage of weather windows and increases your chance of maintaining ideal monitoring
intervals—and gives both observers the chance to work under both sets of conditions (more sheltered
and with binoculars versus more exposed and with spotting scopes).
Ledgenester monitoring involves sitting still for long periods of time, and can be chilly work,
especially at exposed stakes on windy days. Bringing plenty of warm clothes (storing some items in the
scope dry bags is a possibility) is recommended. Further, hiking to the stakes often means getting
sweaty, and a change of base layer may be desired.
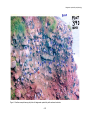
On Chowiet, several plots are quite large and many crews find it useful to include zoomed-in
insets or extra pages with zoomed-in windows that highlight clusters with multiple sites, and reveal details
not visible in more zoomed-out photographs (Figure D6). Keep in mind that ledgenester monitoring
occurs at sites with steep drop-offs and often in windy conditions. A useful system for working in these
areas involves storing plot maps in a three-ring binder (maps that involve a page of insets or two plots
that are regularly scanned together can be viewed simultaneously), with lanyards that secure the binder
and field notebook to the observer or stake (Figure D7).
Specific Requirements for Chowiet
Dates: Late May to early June: Begin visiting plots, particularly looking for kittiwake nest building. Take
plot photos and create maps as early in the season as possible.
Early to mid-June: Begin adding murre sites once they begin laying.
Late May through end of season: Check status of nests every 3-5 days, most frequently during
the peak of hatching.
Optimal sample size: 30 per species per plot (ideal; usually not attainable for thick-billed murres at
Chowiet). Start with more, if possible, because many will be excluded during analysis
Time of day: Any time.
Weather: Good visibility (minimal fog). Wind and rain do not preclude work but do tend to make birds sit
tighter and can make observations through optics problematic.
®
Equipment needed: Binoculars, spotting scope, tripod, Rite-in-the-Rain notebook, two pencils, plot
photos (laminated or with clear plastic photo protectors with tops taped closed), ultra-fine tipped
Sharpies for writing nest numbers on photos, camera (early in the season).
Equipment suggested: Crazy creek chair, lens cleaning supplies, thermos of hot drink, lots of snacks,
warm clothes.
4-36
Ledgenester productivity and phenology at Chowiet Island
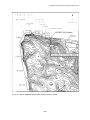
Figure D1. Current waypoint names and locations of ledgenester stakes on Chowiet Island.
4-37
Ledgenester productivity and phenology at Chowiet Island
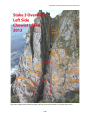
Figure D2. Ledgenester productivity plots (left side) as seen from stake 3, Chowiet Island, 2012.
4-38
Ledgenester productivity and phenology at Chowiet Island
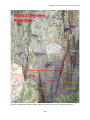
Figure D3. Ledgenester productivity plots (right side) as seen from stake 3, Chowiet Island, 2012.
4-39
Ledgenester productivity and phenology at Chowiet Island
Figure D4. Ledgenester productivity plots as seen from stake 6, Chowiet Island, 2012.
4-40
Ledgenester productivity and phenology at Chowiet Island
Figure D5. Ledgenester productivity plots as seen from stake 9, Chowiet Island, 2012.
4-41
Ledgenester productivity and phenology at Chowiet Island
B
A
C
P03MJH2 Chowiet Island 2012
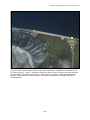
Figure D6. Example of using zoomed-in photographs to provide additional detail when monitoring birds on large or distant plots.
4-42
Ledgenester productivity and phenology at Chowiet Island
Figure D7. Example of system used to record and prevent the loss of data while conducting ledgenester
productivity monitoring.
4-43
Ledgenester productivity and phenology at Chowiet Island
Table D1. Coordinates and notes on locations of ledgenester stakes at Chowiet Island.
Stake
Coordinates
Notes
1
N56.03293 W156.74459
Top of ridge, marks top of trail down to stakes 2 and 3
2
N56.03310 W156.74643
On top of boulders above stake 3, visible from stake 1
3
N56.03313 W156.74660
Below and northwest of stake 2
4
N56.03483 W156.74733
Edge of cliff on top of ridge; not visible from trail
5
N56.03540 W156.74883
Top of ridge near cliff edge
6
N56.03600 W156.75001
Top of ridge; better view of the plots from below the stake
7
N56.03633 W156.75050
Short distance below and northwest of stake 6
8
coordinates unclear
9
N56.03733 W156.75050
Just downhill from stake 8
10
N56.03883 W156.75017
Distantly visible from stake 9, follow trail around cove
11
N56.03933 W156.75083
Northwest of stake 10
12
N56.04067 W156.75017
North of stake 10, follow trail around cove
Near ridge top; marks trail down to stake 9
4-44
Ledgenester productivity and phenology at Chowiet Island
Table D2. Plots used for productivity monitoring of ledgenester species on Chowiet Island in 2012. Some
variability exists among years in regards to number of plots, groupings based on sample sizes, and
species monitored at each plot; however, productivity monitoring in 2012 was typical of recent years and
this table should be used as a guideline for future monitoring.
Common
murre
Plot
3
P03M01
3
P03M02
3
P03M03
X
a
3
P03M04
X
a
3
P03M05
X
a
3
P03M06
X
b
3
P03M07
X
b
3
P03M13
X
3
P03M14
X
3
P03M15
X
3
P03M16
X
3
P03MJH1
3
P03MJH2
3
P03MJH3
3
P03MJH4
3
P03MJW1
3
P03B02
X
3
P03B03
X
3
P03B04
X
3
P03B05
X
6
P06B01
X
6
P06B02
X
6
P06B03
X
9
P09M01
X
9
P09M03
X
9
P09M04
X
9
P09B01
X
9
P09B02
X
10
P10B02
X
Total
Black-legged kittiwake
Thick-billed
murre
a
X
Stake
X
X
X
X
X
X
10
10
P03M01,2,3,4 and 5 combined for analysis in 2012
P03M06 and 7 combined for analysis in 2012
c
P03MJH1 and 3 combined for analysis in 2012
d
Regularly has small sample size, but not conducive to combination with other plot.
b
4-45
c
X
X
a
c
d
X
12 (7 after combined)
Ledgenester productivity and phenology at St. George Island
Attachment E. St. George Island specifics (includes Figure E1 and Table E1)
PROCEDURE DETAILS SPECIFIC TO ST. GEORGE
Kittiwake and murre productivity and phenology at St. George Island is monitored in several
areas around the island: Village, Rosy Finch, First Bluffs, High Bluffs, Zapadni, and Red Bluffs (see
Figure E1). Within these areas, some plots can be used for all four species, whereas others have only
one or two species present (see Table E1).
There are more potential productivity plots at St. George than you need to attain your sample
sizes for some species, so you may not use all plots in all years. Birds can move and cliffs can change
from year to year, so a good plot one year may not be a good one another year. At the beginning of the
season, scout all plot locations and choose the plots that appear the best (good views of 25-30 birds) in
the current year. In addition, try to spread your plots around the island as evenly as possible, to account
for geographic differences in timing and success (i.e., the north and the south side of the island, high and
low cliff areas). It is usually not possible to find 10 good plots for black-legged kittiwakes or common
murres at St. George, so just follow as many as you can.
Each crew member will have a set of plots he/she will monitor throughout the entire season. Try
to split the workload as evenly as possible, taking into account plot quality (i.e., don’t give one person all
the close easy plots), species (i.e., don’t give one person all the kittiwakes and another all the murres),
and hiking time to plots. One suggestion for splitting the workload between two crew members is as
follows, resulting in two full plot days and a third shorter day during which crews can do other projects:
Day 1
Day 2
Day 3
Person 1
Half High Bluffs
All Zapadni and all First Bluffs
Village (short day)
Person 2
Half High Bluffs
All Red Bluffs
Rosy Finch (short day)
Note, this is just a suggestion and may have to be adjusted based on which plots are used in the current
year; ultimately crews should split the workload in whatever way makes them happy.
Some productivity plots on St. George are also used for kittiwakes and murre survival (see
ledgenester survival protocol). These plots provide an excellent opportunity to resight banded birds while
you are spending hours at a plot anyway. However, these plots should not be used for productivity in
years when birds are also banded on the plot. For the following plots, we recommend a rotating schedule
of banding, in which the plot is used for productivity for 2-3 years and then skipped for a year so that a
mass of birds can be banded there:
Red-legged kittiwakes
• Survival Plot High Bluffs 70 - Overlaps entirely with Productivity Plot High Bluffs 70; cannot
band and do productivity in the same year.
• Survival Plot High Bluffs H1/H2 - H2 overlaps with Productivity Plot High Bluffs 92; capturing
in the H1 section of the plot should be okay as long as crews watch for potential disturbance.
Thick-billed murres
• Survival Plot High Bluffs 65 - Overlaps entirely with Productivity Plot High Bluffs 65; cannot
band and do productivity in the same year.
• Survival Plot Zapadni 74 - Survival plot is on the opposite cliff face from Productivity Plot
Zapadni 74 but is too close for banding to occur without disturbing the productivity plot;
cannot band and do productivity in the same year.
When scheduling your productivity checks during the field season, the most important thing is to
remain flexible with the weather. Some plots are easier to check in marginal weather conditions than
others: plots that are at lower elevations (e.g., Village) or close to observation points (e.g., Plots 70 and
65) may be more doable in fog and/or precipitation compared to other plots (e.g., First Bluffs is
notoriously difficult when foggy because plots are generally far from observation points). In addition,
weather conditions affect which parts of the island are workable (e.g., a strong north wind may make
checking plots on High Bluffs difficult but plots on the south side of the island may be relatively sheltered).
4-46
Ledgenester productivity and phenology at St. George Island
You will get a feel of this early in the season as you do plot checks in various weather conditions; use this
information along with knowledge of timing of breeding to help prioritize your work schedule. For
example, if heavy fog has prevented you from checking plots on First Bluffs for 5 days and it is near
expected hatch time, on the first available clear day you may want to ditch any other plans you may have
had for the day and get your First Bluffs plots checked instead.
Kittiwakes initiate breeding a few weeks before murres, so the busiest time for productivity work
at St. George is mid- to late June through early August, when all four species are going strong. In
August, productivity work becomes easier, as kittiwake chicks are large and easier to see and chicks of
both species begin fledging.
Specific Requirements for St. George
Dates: Late May-1 Jun: conduct a thorough survey of all kittiwake productivity plots, pick a sample of 1015 good plots that have plenty of nests and take initial plot photos; obtain an initial status of a
sample of nests (25-30 each species on each plot).
10-15 Jun: conduct a thorough survey of all murre productivity plots, pick a sample of
10-15
good plots that have plenty of nests and take initial plot photos; begin monitoring (25-30 each
species on each plot) when eggs are laid.
1 Jun-end of season: check status of nests every 3-4 days (optimal; up to 5-6 if dictated by bad
weather or workload), most frequently during the peak of hatching (early July for kittiwakes, late
July/early August for murres).
Optimal sample size: 10-15 productivity plots for each species. If forced to prioritize, err on the side of
more plots for kittiwakes and fewer for murres, since kittiwakes exhibit more variability in
reproductive success.
Time of day: Daylight hours.
Weather: Good visibility (minimal fog). Wind and rain do not preclude work but do tend to make birds sit
tighter and can make observations through optics problematic.
®
Equipment needed: Binoculars, spotting scope, tripod, Rite-in-the-Rain notebook, two pencils, plot
photos (laminated or with clear plastic photo protectors with tops taped closed), ultra-fine tipped
Sharpies for writing nest numbers on photos.
Equipment suggested: Crazy creek chair, clipboard, large rubber bands to keep items from flying off the
clipboard, safety equipment for tying into plots, thermos of hot drink, lots of snacks, lens cleaning
cloths, complete change of clothes, camera.
4-47
Ledgenester productivity and phenology at St. George Island
High
Bluffs
First
Bluffs
Rosy
Finch
Village
Zapadni
Red
Bluffs
Figure E1. Locations of kittiwakes and murre productivity plots at St. George Island. Numbers indicate plot numbers; circled numbers
productivity plots (uncircled numbers are population plots).
4-48
Ledgenester productivity and phenology at St. George Island
Table E1. List of productivity plots used for kittiwakes and murres at St. George Island. Only 10-15 plots
are monitored for each species each year so not all plots are used every year and plot use has varied
over time; x’s indicate plots used since 2000, with underlines indicating those used most recently (20082010). In some years, small plots near each other are combined for statistical analysis.
a
Plot
Location
BLKI
RLKI
56/57
60
61
62
64
65
66
67
68
69
70
71
72
73
74
76
77
78
79
80
82
83
84
85
86
87
88
89
90
a
91
a
92
93
94
Rosy Finch
Village
Village
Village
First Bluffs
High Bluffs
High Bluffs
High Bluffs
High Bluffs
High Bluffs
High Bluffs
Zapadni
Zapadni
Zapadni
Zapadni
Red Bluffs
Red Bluffs
High Bluffs
Red Bluffs
Red Bluffs
Rosy Finch
Red Bluffs
First Bluffs
First Bluffs
Red Bluffs
First Bluffs
High Bluffs
Red Bluffs
High Bluffs
High Bluffs
High Bluffs
Red Bluffs
Village
x
x
x
x
x
x
x
x
x
x
x
x
x
x
x
COMU
x
x
x
x
x
x
x
x
x
x
x
x
x
x
x
x
x
TBMU
x
x
x
x
x
x
x
x
x
x
x
x
x
x
x
x
x
x
x
x
x
x
x
x
x
x
x
x
x
x
x
x
x
x
x
x
x
Plots were created in 2008 but not marked; no photographs or exact locations could be found in 2010.
4-49
Ledgenester productivity and phenology at St. Lazaria Island
Attachment F. St. Lazaria Island specifics (includes Figures F1-5)
PROCEDURE DETAILS SPECIFIC TO ST. LAZARIA
Productivity and phenology of common and thick-billed murres at St. Lazaria are monitored at
nine productivity plots at the Southwest Cliff Colony (Figures F1-5). This isolated cliff, about 50 meters
high, is located on the southwestern side of the island. The observation location is at the end of the main
flagged trail, past storm-petrel productivity plot 16, and is marked with rebar. This trail should not be
difficult to find early season; however, the rye grass will need to be trimmed back later in the season for
ease of walking. Note that all the productivity plots 1-9 are also used for “land-based” murre population
plots (see Ledgenester Population Protocol); however, productivity monitored is conducted from a
different observation point, does not include population count plot 10, and does not divide plot 6 is divided
into two plots (6A and 6B).
Beginning in late June, begin conducting reconnaissance of murre plots and number of murres
rafting on the water, looking for indications that attendance is stabilizing or birds are showing signs of
intention to breed (facing inwards on the cliffs). Once murres begin laying, monitor nests every 3-5 days
(3 day-intervals around expected hatch and fledge dates). Ravens, crows, gulls, and eagles prey on
murre eggs at St. Lazaria so it is important to begin monitoring nests as soon as possible after eggs are
laid so that egg loss due to predation can be documented. In addition, pay attention to observations of
disturbance caused by these predators (e.g., causing part of or the entire colony to flush), as these can
be an opportunity to observe which nests have eggs or chicks.
Aim to follow about 30 nests of each species that are confirmed with an egg and that will provide
known nest statuses throughout the breeding season (i.e., you may want to avoid choosing to follow a
nest that has a tuft of rye grass nearby as it may preclude viewing the nest as vegetation grows taller
through the course of the summer). Use a spotting scope to attain nest statuses; all productivity plots at
the Southwest Cliff Colony are too far away to use binoculars. Even in years when there are only a few
birds breeding, one person should follow the same plot throughout the season; do not switch off, as this
usually causes confusion
Cache crazy creek chairs, tripods, and spotting scopes in a large dry-bag with several sheets of
newspaper crumpled up at the bottom (for moisture absorption) in a protected location near the
observation point (see Figure F4). That way all you will need to carry back and forth are your data
sheets, pencils, and plot photos. It can be windy at the observation point, so it is wise to pack extra
layers as well as a baseball hat to block the sun from your eyes. Always bring an umbrella to protect the
scope even if it is not raining when you head out, as you will be there for a few hours and the weather can
quickly change in that span of time. Observations can still be conducted in the rain and high winds if you
are able to observe the birds well enough to collect useful data; if, because of poor weather conditions,
you find you are recording a lot of U or BU nest statuses, this is an indication that you may want to come
back for your observations when the weather is better.
Specific Requirements for St. Lazaria
Dates: Late June: initial plot reconnaissance looking for most the colony on the cliff and laying.
July-September: Check status of nests every 3-5 days, most frequently during hatching and
fledging.
Optimal sample size: 30 per species for the entire Southwest Cliff Colony
Time of day: Day light hours.
Weather: Good visibility (minimal fog). Wind and rain do not preclude work but do tend to make birds sit
tighter and can make observations through optics problematic.
Equipment needed: Binoculars, spotting scope, tripod, murre productivity data recording sheet, clipboard,
two pencils, plot photos (laminated or with clear plastic photo protectors with tops taped closed),
raincoat, umbrella, large dry bag with newspaper at the bottom.
Equipment suggested: Crazy creek chair, lens cleaning cloths, thermos of hot drink, lots of snacks, extra
clothing, camera.
4-50
Ledgenester productivity and phenology at St. Lazaria Island
Figure F1. Locations of ledgenester productivity plots and observation point at St. Lazaria Island.
The red dashed line indicates the approximate route to the observation point from burrow nester
plots 8 and 16.
4-51
Ledgenester productivity and phenology at St. Lazaria Island
Figure F2. Plot boundaries of ledgenester productivity plots 1-9 on the Southwest Cliff at St. Lazaria
Island.
4-52
Ledgenester productivity and phenology at St. Lazaria Island
Figure F3. Photo of ledgenester productivity plots observation point (marked by rebar) at St. Lazaria
Island.
4-53
Ledgenester productivity and phenology at St. Lazaria Island
Figure F4. Photo showing ledgenester observation point and the gear cache location, surrounded by tall
rye grass to protect from winds, at St. Lazaria Island.
Figure F5. Ledgenester observation point viewed from plot BN 16 at St. Lazaria Island.
4-54
Ledgenester productivity and phenology at St. Paul Island
Attachment G. St. Paul Island specifics (includes Figure G1 and Table G1)
PROCEDURE DETAILS SPECIFIC TO ST. PAUL
Kittiwake and murre productivity and phenology at St. Paul Island is monitored at several areas
around the island: High Bluffs, Ridgewall, Zapadni, and Tolstoi (see Figure G1). Refer to the file
“StP_plot_descriptions_92_to 2008.doc” for details on each plot. Some plots can be used for all four
species, whereas others have only one or two species present (see Table G1).
There are more potential productivity plots at St. Paul than you need to attain your sample sizes
for some species, so you may not use all plots in all years. Birds can move and cliffs can change from
year to year, so a good plot one year may not be a good one another year. At the beginning of the
season, scout all plot locations and choose the plots that appear the best (good views of 25-30 birds) in
the current year. In addition, try to spread your plots around the island as evenly as possible, to account
for geographic differences in timing and success (i.e., the north and the south side of the island, high and
low cliff areas). It is usually not possible to find 10 good plots for red-legged kittiwakes or common
murres at St. Paul, so just follow as many as you can.
Each crew member will have a set of plots he/she will monitor throughout the entire season. Try
to split the workload as evenly as possible, taking into account plot quality (i.e., don’t give one person all
the close easy plots), species (i.e., don’t give one person all the kittiwakes and another all the murres),
and hiking time to plots. One suggestion for splitting the workload between two crew members is as
follows:
Person 1
Half High Bluffs (in 2010: plots 48,53,54,55
56,61)
Half Zapadni (in 2010: 85, 86, 87,104)
All Ridgewall (in 2010: 66,67,68,69)
Person 2
Half High Bluffs (in 2010: plots 49,50,51,53)
Half Zapadni (in 2010: plots 80,81,84,89)
All Tolstoi (in 2010:plots 90,90L,91,114)
Note, this is just a suggestion and may have to be adjusted based on which plots are used in the current
year; ultimately crews should split the workload in whatever way makes them happy.
When scheduling your productivity checks during the field season, the most important thing is to
remain flexible with the weather. Some plots are easier to check in marginal weather conditions than
others. In addition, weather conditions affect which parts of the island are workable. You will get a feel of
this early in the season as you do plot checks in various weather conditions; use this information along
with knowledge of timing of breeding to help prioritize your work schedule. For example, if heavy fog has
prevented you from checking plots on High Bluffs for 5 days and it is near expected hatch time, on the
first available clear day you may want to ditch any other plans you may have had for the day and get your
High Bluffs plots checked instead.
Kittiwakes initiate breeding a few weeks before murres, so the busiest time for productivity work
at St. Paul is mid- to late June through early August, when all four species are going strong. In August,
productivity work becomes easier, as kittiwake chicks are large and easier to see and chicks of both
species begin fledging.
Specific Requirements for St. Paul
Dates: Late May-1 Jun: conduct a thorough survey of all kittiwake productivity plots, pick a sample of 1015 good plots that have plenty of nests and take initial plot photos; obtain an initial the status of a
sample of nests (25-30 each species on each plot).
10-15 Jun: conduct a thorough survey of all murre productivity plots, pick a sample of 10-15 good
plots that have plenty of nests and take initial plot photos; begin monitoring (25-30 each species
on each plot) when eggs are laid.
1 Jun-end of season: check status of nests every 3-4 days (optimal; up to 5-6 if dictated by bad
weather or workload), most frequently during the peak of hatching (early July for kittiwakes, late
July/early August for murres).
Optimal sample size: 10-15 productivity plots for each species. If forced to prioritize, err on the side of
more plots for kittiwakes and fewer for murres, since kittiwakes exhibit more variability in
4-55
Ledgenester productivity and phenology at St. Paul Island
reproductive success.
Time of day: Daylight hours.
Weather: Good visibility (minimal fog). Wind and rain do not preclude work but do tend to make birds sit
tighter and can make observations through optics problematic.
®
Equipment needed: Binoculars, spotting scope, tripod, Rite-in-the-Rain notebook, two pencils, plot
photos (laminated or with clear plastic photo protectors with tops taped closed), ultra-fine tipped
Sharpies for writing nest numbers on photos.
Equipment suggested: Crazy creek chair, clipboard, large rubber bands to keep items from flying off the
clipboard, safety equipment for tying into plots, thermos of hot drink, lots of snacks, lens cleaning
cloths, complete change of clothes, camera.
4-56
Ledgenester productivity and phenology at St. Paul Island
High
Bluffs
Ridgewall
Zapadni
Tolstoi
Figure G1. Locations of kittiwakes and murre productivity plots at St. Paul Island.
4-57
Ledgenester productivity and phenology at St. Paul Island
Table G1. List of productivity plots used for kittiwakes and murres at St. Paul Island. Only 10-15 plots are monitored for each
species each year so not all plots are used every year and plot use has varied over time; x’s indicate plots used since 2000, with
underlines indicating those used most recently (2008-2010). Plots in parentheses are population plots that have been used
occasionally for productivity. In some years, small plots near each other are combined for statistical analysis.
Plot
Location
BLKI
(1)
(14)
(22)
43
44
45
46
47
47L
48
49
50
51
52
53
54
55
56
61
64
65
66
67
68
69
70
71
80
81
82
83
84
85
86
87
88
89
89R
90
90L
91
98
99
100
101
102
103
104
105
106
107
109
110
113
114
High Bluffsa
High Bluffs
High Bluffs
High Bluffs
High Bluffs
High Bluffs
High Bluffs
High Bluffs
High Bluffs
High Bluffs
High Bluffs
High Bluffs
High Bluffs
High Bluffs
High Bluffs
High Bluffs
High Bluffs
High Bluffs
High Bluffs
Ridgewallb
Ridgewall
Ridgewall
Ridgewall
Ridgewall
Ridgewall
Ridgewall
Ridgewall
Zapadni
Zapadni
Zapadni
Zapadni
Zapadni
Zapadni
Zapadni
Zapadni
Zapadni
Zapadni
Zapadni
Tolstoi
Tolstoi
Tolstoi
Zapadni
High Bluffs
High Bluffs
x
Tolstoi
Zapadni
RLKI
COMU
TBMU
x
x
x
x
x
x
x
x
x
x
x
x
x
x
x
x
x
x
x
x
x
x
x
x
x
x
x
x
x
x
x
x
x
x
x
x
x
x
x
x
x
x
x
x
x
x
x
x
x
x
x
x
x
x
x
x
x
x
x
x
x
x
x
x
x
x
x
x
x
x
x
x
x
x
x
x
x
x
x
x
x
x
x
x
x
x
x
x
x
x
x
x
x
x
x
x
x
x
x
x
x
x
x
x
x
x
x
x
x
x
x
x
x
x
x
x
x
x
x
x
x
x
Reef
Reef
Tolstoi
x
Tolstoi
a
Historically, High Bluffs has also been called West Bluffs or West Cliffs
b
Historically, Ridgewall has also been called Tourist Point
4-58
Protocol Revision History Log
Protocol Revision History Log
Revision
Date
New
version #
Changes made
April 2015
Minor clarifications made
1.4
April 2014
Changed font to Arial, added revision history log, replaced revision date with version # on first page, added protocol
# to first page, changed number format of tables and figures in island attachments, ordered island attachments
alphabetically, changed page number format to include protocol #, made minor grammatical edits, added murre
identification guide (Figure 1), added Cape Lisburne attachement
1.3
May 2013
Aiktak, Chowiet and St. Lazaria attachments added
1.2
May 2012
Buldir attachment added
1.1
May 2011
Protocol developed in standardized format from historic protocols, includes St. George and St. Paul attachments
1.0
4-59