1
User’s and Service Guide
Publication number D3000-97000
March 2005
©
Copyright Agilent Technologies 2005
All Rights Reserved
3000 Series Oscilloscopes
In This Book
This book gives you the information you need to begin using the 3000 Series
Oscilloscopes. It contains the following chapters:
Getting Started Chapter 1 contains inspection, power requirements, probe
compensation instructions, cleaning instructions, and setup information.
Using the Oscilloscope Chapter 2 gives information on how to use the front
panel and the graphical user interface, and tells you how to perform various
operations with the oscilloscope.
Specifications and Characteristics Chapter 3 gives specification and
characteristics of the oscilloscope.
Service Chapter 4 gives service and performance testing information for the
oscilloscope.
Contents
1 Getting Started
Inspecting the Package Contents 1-2
Performing a Functional Check 1-5
Compensating Probes 1-7
Front Panel and User Interface Descriptions
Automatically Displaying a Waveform 1-12
Cleaning the Oscilloscope 1-13
1-9
2 Using the Oscilloscope
Vertical Controls 2-3
Vertical System Setup 2-4
Channel Coupling Control 2-6
Bandwidth Limit Control 2-9
Probe Attenuation Control 2-11
Invert Control 2-12
Digital Filter Controls 2-14
Math Functions Control 2-15
Reference Control 2-19
Removing Waveforms from the Display
2-21
Horizontal Controls 2-22
Horizontal System Setup
Horizontal Knobs 2-24
Horizontal Menu 2-25
Roll Mode 2-29
2-23
Trigger Controls 2-30
Trigger System Setup
Trigger Modes 2-33
2-31
Waveform Controls 2-37
Stop Acquisition 2-38
Equivalent Time Sampling 2-38
Average Acquisition 2-38
Peak Detect 2-40
Sequence Capability 2-41
Display Controls 2-43
Save and Recall Controls 2-45
Contents-1
Contents
Waveforms 2-46
Setups 2-46
Default Setup 2-46
Load 2-46
Save 2-46
Utility Controls 2-47
Mask Test 2-49
I/O Setup Menu 2-51
System Info 2-52
Self-Calibration 2-53
Self-Test 2-54
Automatic Measurement Controls 2-55
Voltage Measurements 2-56
Time Measurements 2-57
Automatic Measurement Procedure
Measurement Concepts 2-59
2-58
Cursor Measurement Controls 2-63
Manual 2-64
Track 2-66
Auto Measure 2-67
Autoscale and Run/Stop Controls 2-68
Autoscale Button 2-69
Run/Stop Button 2-71
3 Specifications and Characteristics
Specifications 3-2
Characteristics 3-3
4 Service
!
Returning the oscilloscope to Agilent Technologies for service 4-2
Testing Performance 4-3
Before Performing Performance Verification Testing 4-5
DC Gain Accuracy Test 4-7
Analog Bandwidth - Maximum Frequency Check 4-13
Performance Test Record 4-21
Contents-2
1
Getting Started
Getting Started
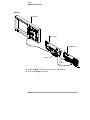
Inspecting the Package Contents
Inspecting the Package Contents
❏ Inspect the shipping container for damage.
Keep a damaged shipping container or cushioning material until you have
inspected the contents of the shipment for completeness and have checked the
oscilloscope mechanically and electrically.
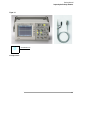
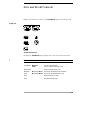
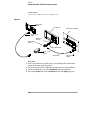
❏ Verify that you received the following items in the oscilloscope packaging.
• Oscilloscope
• (2) N2862A 10:1 10 MΩ passive probes (60 MHz and 100 MHz models)
• (2) N2863A 10:1 10 MΩ passive probes (150 MHz and 200 MHz models)
• CD-ROM containing user documentation
See Figure 1-1. (See table 1-1 for the power cord.) If anything is missing, contact
your nearest Agilent Technologies Sales Office. If the shipment was damaged,
contact the carrier, then contact the nearest Agilent Technologies Sales Office.
❏ Inspect the oscilloscope.
• If there is mechanical damage or a defect, or if the oscilloscope does not
operate properly or does not pass performance tests, notify your Agilent
Technologies Sales Office.
• If the shipping container is damaged, or the cushioning materials show signs
of stress, notify the carrier and your Agilent Technologies Sales Office. Keep
the shipping materials for the carrier’s inspection. The Agilent Technologies
Sales Office will arrange for repair or replacement at Agilent’s option without
waiting for claim settlement.
1-2
Getting Started
Inspecting the Package Contents
Figure 1-1
s
CD-ROM Manuals
Package Contents
1-3
Getting Started
Inspecting the Package Contents
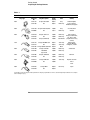
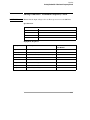
Table 1-1
Power Cords
Plug Type
Cable Part
No.
8120-1351
8120-1703
Color
Country
Straight *BS1363A
90°
Length
(in/cm)
90/228
90/228
Gray
Mint Gray
United Kingdom,
Cyprus, Nigeria,
Zimbabwe, Singapore
250V
8120-1369
8120-0696
Straight *NZSS198/ASC
90°
79/200
87/221
Gray
Mint Gray
Australia, New
Zealand
250V
8120-1689
8120-1692
8120-2857
Straight *CEE7-Y11
90°
Straight (Shielded)
79/200
79/200
79/200
Mint Gray
Mint Gray
Coco Brown
125V
8120-1378 Straight *NEMA5-15P
8120-1521
90°
8120-1992 Straight (Medical) UL544
8120-2104
Straight *SEV1011
8120-2296
1959-24507
Type 12 90°
8120-2956
Straight *DHCK107
8120-2957
90°
90/228
90/228
96/244
79/200
79/200
Jade Gray
Jade Gray
Black
Mint Gray
Mint Gray
East and West
Europe, Saudi Arabia,
So. Africa, India
(unpolarized in many
nations)
United States,
Canada, Mexico,
Philippines, Taiwan
79/200
79/200
Mint Gray
Mint Gray
Denmark
250V
8120-4211
8120-4600
Straight SABS164
90°
79/200
79/200
Jade Gray
Republic of South
Africa
India
100V
8120-4753
8120-4754
Straight MITI
90°
90/230
90/230
Dark Gray
Japan
250V
250V
220V
Plug Description
Switzerland
* Part number shown for plug is the industry identifier for the plug only. Number shown for cable is the Agilent part number for the complete
cable including the plug.
1-4
Getting Started
Performing a Functional Check
Performing a Functional Check
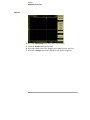
Perform this quick functional check to verify that your oscilloscope is operating
correctly. See Figure 1-2.
1 Turn on the oscilloscope. Use only power cords designed for your
oscilloscope. Use a power source that delivers 100 to 240 VAC, 47 Hz to
440 Hz. Wait until the display shows that all self-tests passed. Push the
Save/Recall button, select Setups in the top menu box and push the Default
Setup menu box.
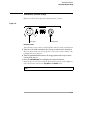
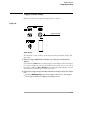
Figure 1-2
Save/Recall button
Front Panel Controls
WARNING
To avoid electric shock, be sure the oscilloscope is properly grounded.
2 Input a waveform to a channel of the oscilloscope.
3 Press the Autoscale button and observe the signal on the display.
1-5
Getting Started
Performing a Functional Check
CAUTION
!
To avoid damage to the oscilloscope, make sure that the input voltage at the
BNC connector does not exceed the maximum voltage (300 Vrms maximum).
1-6
Getting Started
Compensating Probes
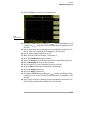
Compensating Probes
Perform this adjustment to match your probe to the input channel. This should
be done whenever you attach a probe for the first time to any input channel.
Low Frequency Compensation
1 Set the Probe menu attenuation to 10X. Press the appropriate channel
button on the front panel (1 or 2), then select the Probe menu item until
10X appears.
2 Attach the probe tip to the probe compensation connector and the
ground lead to the probe compensator ground connector. If you use the
probe hook-tip, ensure a proper connection by firmly inserting the tip
onto the probe.
3 Press the Autoscale front panel button.
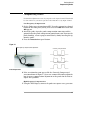
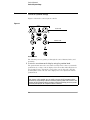
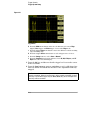
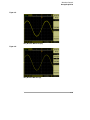
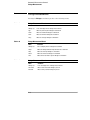
Figure 1-3
Low frequency compensation adjustment
Correctly Compensated
Over Compensated
Under Compensated
Probe Compensation
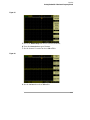
4 If the waveform does not appear like the Correctly Compensated
waveform shown in Figure 1-3, then use a nonmetallic tool to adjust the
low frequency compensation adjustment on the probe for the flattest
square wave possible.
High Frequency Compensation
1 Using the BNC adapter, connect the probe to a square wave generator.
1-7
Getting Started
Compensating Probes
2 Set the square wave generator to a frequency of 1 MHz and an amplitude
of 1 Vp-p.
3 Press the Autoscale front panel button.
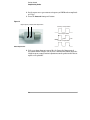
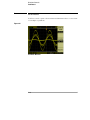
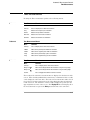
Figure 1-4
High frequency compensation adjustments
Correctly Compensated
Over Compensated
Under Compensated
Probe Compensation
4 If the waveform does not appear like the Correctly Compensated
waveform shown in Figure 1-4, then use a nonmetallic tool to adjust the
2 high frequency compensation adjustments on the probe for the flattest
square wave possible.
1-8
Getting Started
Front Panel and User Interface Descriptions
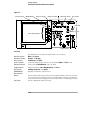
Front Panel and User Interface Descriptions
One of the first things you will want to do with your new oscilloscope is to
become acquainted with its front panel. The front panel has knobs and buttons.
The knobs are used most often and are similar to the knobs on other
oscilloscopes.
1-9
Getting Started
Front Panel and User Interface Descriptions
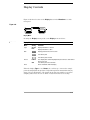
Figure 1-5
Vertical controls
MENU ON/OFF
Measure controls
Horizontal controls
Waveform controls
Run controls
Entry knob
Menu defined buttons
{
Menu controls
Trigger controls
Front Panel
Measure controls
Waveform controls
Menu controls
Vertical controls
Horizontal controls
Trigger controls
Run controls
MENU ON/OFF
Menu defined
buttons
Entry knob
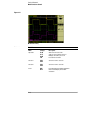
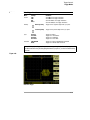
The definitions of the buttons and the knobs are as follows:
Meas and Cursors
Acquire and Display
Save/Recall and Utility
Vertical position knobs, vertical scale knobs, 1, 2, Math and Ref menus
Position knob, Main/Delayed, and scale knob
Trigger level knob, 50%, Mode/Coupling, and Force
Run/Stop, Autoscale, and Single
Displays or hides the current menu
Five gray buttons from top to bottom on the right-hand side of the screen, which
select the adjacent menu items in the currently displayed menu. Pressing any
of these when no menu is displayed activates the most recently displayed menu.
For the adjustment defined controls
1-10
Getting Started
Front Panel and User Interface Descriptions
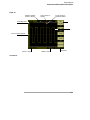
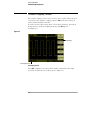
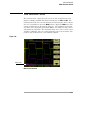
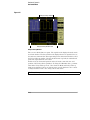
Figure 1-6
Waveform window
position in memory
Trigger position in
memory
Acquisition Status
Trigger position in
waveform window
Menu
Waveform
Channel 1 Ground Symbol
Channel 1 Status
Timebase Status
Sample Rate
User Interface
1-11
Getting Started
Automatically Displaying a Waveform
Automatically Displaying a Waveform
The oscilloscope has an Autoscale feature that automatically sets up the
oscilloscope to best display the input waveform. Using Autoscale requires
waveforms with a frequency greater than or equal to 50 Hz and a duty cycle
greater than 1%.
When you press the Autoscale button, the oscilloscope turns on and scales all
channels that have waveforms applied, and selects a time base range based on
the trigger source. The trigger source selected is the lowest numbered channel
that has a waveform applied. The 3000 Series Oscilloscopes are two channel
oscilloscopes with an external trigger input.
1-12
Getting Started
Cleaning the Oscilloscope
Cleaning the Oscilloscope
• Clean the oscilloscope with a soft cloth dampened with a mild soap and
water solution.
CAUTION
Do not use too much liquid in cleaning the oscilloscope. Water can enter the
oscilloscope’s front panel, damaging sensitive electronic components.
1-13
1-14
2
Using the Oscilloscope
Using the Oscilloscope
This chapter describes the oscilloscope’s buttons, knobs, and menus. It is
recommended that you perform all of the exercises in this chapter to become
familiar with the powerful measurement capabilities of the oscilloscope.
2-2
Vertical Controls
Each channel has a vertical controls menu that appears after pressing either
the 1 or the 2 front panel button. This section of the manual describes the
vertical channel controls.
2-3
Vertical Controls
Vertical System Setup
Vertical System Setup
Figure 2-1 shows the vertical system controls.
Figure 2-1
Scale knob
Position knob
Vertical Controls
The following exercise guides you through the vertical buttons, knobs, and
status bar.
1 Center the waveform on the display using the position knob.
The position knob moves the waveform vertically. Notice that as you turn the
position knob, a voltage value is displayed for a short time indicating how far
the ground reference is from the center of the screen. Also notice that the
ground symbol on the left side of the display moves in conjunction with the
position knob.
Measurement hints
If the channel is DC coupled, you can quickly measure the DC component of the
waveform by simply noting its distance from the ground symbol. If the channel is AC
coupled, the DC component of the waveform is blocked, allowing you to use greater
sensitivity to display the AC component of the waveform.
2-4
Vertical Controls
Vertical System Setup
2 Notice that changing the vertical setup also affects the status bar.
You can quickly determine the vertical setup from the status bar in the display.
a Change the vertical sensitivity with the scale knob and notice that it causes
the status bar to change.
b Press the 1 button. The CH1 menu appears and the channel is turned on.
c Toggle each of the menu buttons and notice which buttons cause the status
bar to change.
d Press the 1 button to turn the channel off or on. Press the MENU ON/OFF
button to hide the menu without turning the channel off.
Pressing the channel’s vertical scale knob toggles its sensitivity between coarse
and fine modes. In the coarse mode, the knob changes the Volts/Div scale in a 1-2-5
sequence from 2mV/div, 5mV/div, 10mV, ..., to 5 V/div. In the fine mode, the knob
changes the Volts/Div scale in small steps between the coarse settings. It is helpful
when you need to adjust the waveform's vertical size in finer steps.
2-5
Vertical Controls
Channel Coupling Control
Channel Coupling Control
The channel coupling control can be used to remove any DC offset voltage on
a waveform. By setting the coupling control to AC the DC offset voltage is
removed form the input waveform.
To remove any DC offset voltage from a waveform on channel 1, press the 1
front panel key. Press the Coupling menu key until AC appears.
See Figure 2-2.
Figure 2-2
AC Coupling
AC Coupling Status
AC Coupling Control
When DC coupling is selected, both AC and DC components of the input
waveform are passed to the oscilloscope. See Figure 2-3.
2-6
Vertical Controls
Channel Coupling Control
Figure 2-3
DC Coupling
DC Coupling Status
DC Coupling Control
2-7
Vertical Controls
Channel Coupling Control
When GND coupling is selected, the waveform is disconnected from the
oscilloscope input. See Figure 2-4.
Figure 2-4
Ground Coupling
Ground Coupling Status
GND Coupling Control
2-8
Vertical Controls
Bandwidth Limit Control
Bandwidth Limit Control
The bandwidth limit control can be used to remove high frequency components
on a waveform that are not important to the analysis of the waveform.
To remove high frequency components from a waveform on channel 1, press
the 1 front panel key. Press the BW Limit menu key until ON appears.
Frequencies above 20 MHz will be rejected. See Figure 2-5.
Figure 2-5
20 MHz Bandwidth
Bandwidth Limit ON Status
BW Limit Control ON
When the BW Limit control is set to OFF, the oscilloscope is set to full bandwidth.
See Figure 2-6.
2-9
Vertical Controls
Bandwidth Limit Control
Figure 2-6
Bandwidth limit OFF
BW Limit Control OFF
2-10
Vertical Controls
Probe Attenuation Control
Probe Attenuation Control
The probe attenuation control changes the attenuation factor for the probe.
The attenuation factor changes the vertical scaling of the oscilloscope so that
the measurement results reflect the actual voltage levels at the probe tip.
To change the probe attenuation factor for channel 1, press the 1 front panel
key. Press the Probe menu key to change the attenuation factor to match the
probe being used.
Figure 2-7 shows an example for using a 1000:1 probe.
Figure 2-7
Probe Attenuation
Probe Attenuation Set to 1000:1
Table 2-1
Probe attenuation factors and corresponding settings
1:1
1X
10:1
10X
100:1
100X
1000:1
1000X
2-11
Vertical Controls
Invert Control
Invert Control
The invert control inverts the displayed waveform with respect to the ground
level. When the oscilloscope is triggered on the inverted waveform, the trigger
is also inverted.
To invert the waveform on channel 1, press the 1 front panel key. Press the
Invert menu key until ON appears.
Figure 2-8 and Figure 2-9 show the changes before and after inversion.
Figure 2-8
The waveform before inversion.
2-12
Vertical Controls
Invert Control
Figure 2-9
The waveform after inversion.
2-13
Vertical Controls
Digital Filter Controls
Digital Filter Controls
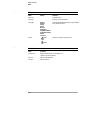
Pressing the Digital Filter menu key displays the Filter Controls. The filter
controls set the digital filter used to filter the sampled waveform data. The types
of filters that are available are shown in Table 2-2.
Table 2-2
Filter Menu
Menu
Setting
Description
Digital Filter
ON
OFF
Turns the filter for this channel on and off
Filter Type
LPF (Low Pass Filter)
HPF (High Pass Filter)
BPF (Band Pass Filter)
BRF(Band Reject Filter)
Upper Limit
The front panel entry knob sets the high limit
Lower Limit
The front panel entry knob sets the low limit
Pressing the Upper Limit or the Lower Limit menu keys turns the front panel entry
knob into a control that can set the high and low frequency limits of the digital
filter. The horizontal scale control determines the maximum value for the upper
and lower limits.
2-14
Vertical Controls
Math Functions Control
Math Functions Control
The math functions control allows the selection of the math functions add,
subtract, multiply, and FFT (Fast Fourier Transform) for CH1 and CH2. The
mathematical result can be measured visually and also using the cursor controls.
To select a math function, press the Math button to display the Math menu. The
settings of this menu are shown in the Table 2-3. The amplitude of the math
waveform can be adjusted by pressing the 1/2 key, selecting the scaling control,
and turning the entry knob. The adjustment range is in a 1-2-5 sequence from
1 mV/div to 10 kV/div. The scale setting is displayed above the status bar. The
position of the math function can be similarly adjusted.
Figure 2-10
Math Scale
Math Function Definition
2-15
Vertical Controls
Math Functions Control
Figure 2-11
Math Scale Setting
Table 2-3
Math Menu
Menu
Settings
Description
Operation
A+B
A-B
AxB
FFT
Add source A to source B
Subtract source B from source A
Multiply source B by source A
Fast Fourier Transform
Source A
CH1
CH2
Set CH1 or CH2 as source A
Source B
CH1
CH2
Set CH1 or CH2 as source B
Invert
ON
OFF
Inverted display of the Math waveform.
Non-inverted display of the Math
waveform.
2-16
Vertical Controls
Math Functions Control
Using the FFT
The FFT math function mathematically converts a time-domain waveform into
its frequency components. FFT waveforms are useful for finding the harmonic
content and distortion in systems, for characterizing noise in DC power supplies,
and for analyzing vibration.
The FFT of a waveform that has a DC component or offset can cause incorrect FFT
waveform magnitude values. To minimize the DC component, choose AC Coupling
on the source waveform.
To reduce random noise and aliasing components in repetitive or single-shot
waveforms, set the oscilloscope acquisition mode to averaging.
To display FFT waveforms with a large dynamic range, use the dBVrms scale. The
dBVrms scale displays component magnitudes using a log scale.
Selecting an FFT Window
There are 4 FFT windows. Each window has trade-offs between frequency
resolution and amplitude accuracy. Your source waveform characteristics along
with your measurement priorities help determine which window to use. Use the
following guidelines to select the best window.
Table 2-4
FFT Windows
Window
Characteristics
Best for measuring
Rectangle
Best frequency resolution, worst
magnitude resolution. This is
essentially the same as no window.
Symmetric transients or bursts.
Equal-amplitude sine waves with fixed
frequencies. Broadband random noise
with a relatively slowly varying spectrum.
Hanning and
Hamming
Better frequency, poorer magnitude
Sine, periodic, and narrow-band random
accuracy than Rectangular. Hamming noise. Asymmetic transients or bursts.
has slightly better frequency resolution
than Hanning.
Blackman
Best magnitude, worst frequency
resolution.
Single frequency waveforms, to find higher
order harmonics.
2-17
Vertical Controls
Math Functions Control
Key points
The FFT resolution is the quotient of the sampling rate and the number of FFT points.
With a fixed number of FFT points, the lower the sampling rate the better the
resolution.
The Nyquist frequency is the highest frequency that any real-time digitizing
oscilloscope can acquire without aliasing. This frequency is half that of the sample
rate, provided it is within the analog bandwidth of the oscilloscope. Frequencies
above the Nyquist frequency will be under sampled, which causes aliasing.
2-18
Vertical Controls
Reference Control
Reference Control
The reference control saves waveforms to a nonvolatile waveform memory. The
reference function becomes available after a waveform has been saved.
To display the reference waveform menu, press the Ref button.
Table 2-5
Ref Menu
Menu
Settings
Comments
Source
CH1
CH2
Select channel for the reference memory.
Save
Invert
Save selected source waveform into nonvolatile
waveform memory.
ON
OFF
Inverted display of the reference waveform.
Non-inverted display of the reference waveform.
Figure 2-12
Ref Menu
2-19
Vertical Controls
Reference Control
Saving a Reference Waveform.
1 Push the Ref button to show the reference waveform menu.
2 Set the Source to CH1 or CH2 to select the channel you want.
3 Press Save to save the selected channel into the reference memory.
The reference function is not available in X-Y mode.
You cannot adjust the horizontal position and scale of the reference waveform.
2-20
Vertical Controls
Removing Waveforms from the Display
Removing Waveforms from the Display
The channel 1 and channel 2 waveforms are turned on and off by pressing the
1 and 2 buttons on the front panel. The math functions and reference waveforms
are similarly turned on and off by pressing the Math and Ref buttons on the front
panel.
2-21
Horizontal Controls
The oscilloscope shows the time per division in the status bar. Since all
waveforms use the same time base, the oscilloscope only displays one value for
all channels, except when you use Delayed Sweep. The horizontal controls can
change the horizontal scale and position of waveforms. The horizontal center
of the screen is the time reference for waveforms. Changing the horizontal scale
causes the waveform to expand or contract around the screen center. The
horizontal position knob changes the position of the trigger point relative to the
center of the screen.
2-22
Horizontal Controls
Horizontal System Setup
Horizontal System Setup
Figure 2-13 shows the front panel horizontal system controls.
Figure 2-13
Scale knob
Position knob
Horizontal Controls
The following exercise guides you through these buttons, knobs, and status bar.
1 Turn the scale knob and notice the change it makes to the status bar.
The scale knob changes the sweep speed in a 1-2-5 step sequence and the value
is displayed in the status bar.
2 Turn the position knob to move the trigger point with respect to the
center of the screen.
3 Press the Main/Delayed key to display the associated menu.
In this menu, you can enter or exit the Delayed Sweep mode, set the display to
Y-T or X-Y format, and alter the Trig-Offset and Holdoff values.
Pressing the horizontal scale knob is another way to enter or exit the delayed sweep
mode.
2-23
Horizontal Controls
Horizontal Knobs
Horizontal Knobs
The position knob adjusts the horizontal position of all channels and math
functions. The resolution of this control varies with the time base. The
oscilloscope digitizes waveforms by acquiring the value of an input waveform
at discrete points. The time base allows you to control the sampling rate of this
digitizing process. The horizontal scale control changes the horizontal time/div
of the main time base. When delayed sweep is enabled, the horizontal scale
control changes the width of the delayed sweep window.
2-24
Horizontal Controls
Horizontal Menu
Horizontal Menu
Pressing the Main/Delayed button displays the associated menu. Figure 2-14
shows the screen icon descriptions and control indicators.
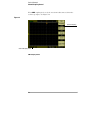
Figure 2-14
Displayed waveform window ([ ])
position in memory.
Trigger position in
memory.
Trigger position in
waveform window.
Sample Rate
Horizontal scale
setting.
Status bar, trigger position, and horizontal scale controls indicators
Delayed Sweep
The Delayed Sweep is used to magnify a portion of the main waveform window.
You can use Delayed Sweep to locate and horizontally expand part of the main
waveform window for a more detailed (higher horizontal resolution) analysis of
the waveform.
The Delayed Sweep time base setting cannot be set slower than the Main time base
setting.
2-25
Horizontal Controls
Horizontal Menu
Figure 2-15
Delayed Sweep window
Delayed Sweep window view
Delayed Sweep Window
The screen is divided into two parts. The top half of the display shows the main
waveform window. The bottom half of the displays shows an expanded view of
the main waveform window. This expanded portion of the main window is called
the Delayed Sweep window. Two blocks shadow the top half, the unshadowed
portion is expanded in the lower half.
In this mode, the horizontal position and scale knobs control the size and
position of the Delayed Sweep window. To change the Main time base, you must
turn off the Delayed Sweep mode. Since both the Main and Delayed Sweep
windows are displayed, there are half as many vertical divisions so the vertical
scaling is doubled. Notice the changes in the status bar.
The Delayed Sweep function can also be activated by pressing the horizontal scale knob.
2-26
Horizontal Controls
Horizontal Menu
X-Y Format
This format compares the voltage levels of two waveforms point by point. It is
useful for studying phase relationships between two waveforms. This format
only applies to channels 1 and 2. Choosing the X-Y display format displays
channel 1 on the horizontal axis and channel 2 on the vertical axis. The
oscilloscope uses the untriggered acquisition mode and waveform data is
displayed as dots. The sampling rate can vary from 2 kSa/s to 100 MSa/s, and
the default sampling rate is 1 MSa/s.
Figure 2-16
X-Y display format
The following modes or functions are not available in X-Y format.
• Automatic Measurements
• Cursor Measurements
• Mask Test
• Ref and Math Operations
• Delayed Sweep
• Vector Display Mode
• Horizontal position knob
• Trigger Controls
Trig-Offset Reset
This control resets the horizontal position to center screen or zero trigger offset.
2-27
Horizontal Controls
Horizontal Menu
Holdoff
Holdoff can be used to stabilize a waveform. The holdoff time is the
oscilloscope's waiting period before starting a new trigger. During the holdoff
time oscilloscope will not trigger until the holdoff has expired.
Figure 2-17
Holdoff
The following exercise guides you through setting the holdoff time.
1 Press the Main/Delayed front panel button to display the associated
menu.
2 Select the Holdoff menu button.
3 Adjust the entry knob to change the Holdoff time until the waveform is
stable.
4 Press the Holdoff Reset menu button to change the Holdoff time to the
100 ns minimum value.
2-28
Horizontal Controls
Roll Mode
Roll Mode
Roll mode continuously moves data across the display from left to right. It allows
you to see dynamic changes (like adjusting a potentiometer) on low frequency
waveforms. Two frequently used applications are transducer monitoring and
power supply testing. When in the Roll Mode, the oscilloscope is untriggered
and runs continuously. You can also make automatic measurements in the roll
mode.
The oscilloscope automatically enters the Roll Mode when the Horizontal Scale
control is set to 50 ms/div or slower and the trigger sweep is set to Auto.
2-29
Trigger Controls
The trigger determines when the oscilloscope starts to acquire data and display
a waveform. When a trigger is set up properly, it can convert unstable displays
or blank screens into meaningful waveforms. The oscilloscope acquires data
while waiting for the trigger condition to occur. After it detects a trigger, the
oscilloscope continues to acquire enough data so that it can draw the waveform
on the display.
2-30
Trigger Controls
Trigger System Setup
Trigger System Setup
Figure 2-18 shows the front panel trigger system controls.
Figure 2-18
Trigger level knob
Trigger Controls
The following exercise guides you through these trigger buttons, knobs, and
status bar.
1 Turn the trigger Level knob and notice the changes it makes to the
display.
As you turn the Level knob two things happen on the display. First, the trigger
level value is displayed at the lower left-hand corner of the screen. Second, if
the trigger coupling is DC or HF Reject, a line is displayed showing the location
of the trigger level with respect to the waveform.
2 Change the trigger setup and notice how these changes affect the status
bar.
a Press the Mode/Coupling button in the trigger controls area. The Trigger
menu appears. Figure 2-19 displays this trigger menu.
2-31
Trigger Controls
Trigger System Setup
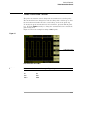
Figure 2-19
Trigger Menu
b Press the Mode menu button and notice the differences between Edge
trigger, Pulse trigger, and Video trigger. Leave in the Edge mode.
c Press the trigger Slope menu button to notice the differences between rising
edge and falling edge.
d Press the trigger Source menu button to select trigger source choices.
e Press the Sweep button to select Auto or Normal.
f Press the Coupling menu button and notice how AC, DC, LF Reject, and HF
Reject affect the waveform display.
3 Press the 50% key and observe that the trigger level is set to the center
of the waveform.
4 Press the Force button to start an acquisition even if a valid trigger has
not been found. This button has no effect if the acquisition is already
stopped.
The Force button has another function called Local when the oscilloscope is being
remotely controlled. When the oscilloscope is being remotely controlled, the front
panel keys are disabled. By pressing the Force (Local) key, the oscilloscope front
panel keys will be reenabled.
2-32
Trigger Controls
Trigger Modes
Trigger Modes
The oscilloscope provides three trigger modes: edge, pulse, and video. Edge
trigger can be used with analog and digital circuits. An edge trigger occurs when
the trigger input passes through a specified voltage level with the specified
slope. Pulse trigger is used to find pulses with certain pulse widths. Video is
used to trigger on fields or lines for standard video waveforms.
Edge Trigger
The Slope and Level controls help to define the Edge trigger. The Slope control
determines whether the oscilloscope finds the trigger point on the rising or the
falling edge of a waveform. The Level control determines voltage point on the
waveform where the trigger occurs.
Table 2-6
Edge Trigger Menu Buttons
Menu
Settings
Comments
Source
CH1
CH2
EXT
EXT/5
AC Line
Sets CH1 as the trigger source
Sets CH2 as the trigger source
Sets EXT TRIG as the trigger source
Sets EXT TRIG/5 as the trigger source
Sets the power line as the trigger source
Slope
Rising
Falling
Trigger on rising edge
Trigger on falling edge
Sweep
Auto
Normal
Acquire waveform even when no trigger occurs
Acquire waveform when trigger occurs.
Coupling
AC
DC
LF Reject
HF Reject
Sets the input coupling to AC (50 Hz cutoff)
Sets the input coupling to DC
Sets the input coupling to low frequency reject (100 kHz cutoff)
Sets the input coupling to high frequency reject (10 kHz cutoff)
2-33
Trigger Controls
Trigger Modes
Pulse Trigger
A pulse trigger occurs when a pulse is found in a waveform that matches the
pulse definition. The When and Setting menu buttons control the pulse
definition.
Table 2-7
Pulse Trigger Menu Buttons
Menu
Settings
Comments
Source
CH1
CH2
EXT
EXT/5
Sets channel 1 as the trigger source
Sets channel 2 as the trigger source
Sets EXT TRIG as the trigger source
Sets EXT TRIG/5 as the trigger source
When
Positive pulse width less than pulse width setting
Positive pulse width larger than pulse width setting
Positive pulse width equal to pulse width setting
Negative pulse width less than pulse width setting
Negative pulse width larger than pulse width setting
Negative pulse width equal to pulse width setting
Setting
Adjusts pulse width using the front panel entry knob
<Width>
Sweep
Auto
Normal
Acquire waveform even when no trigger occurs
Acquire waveform when trigger occurs
Coupling
AC
DC
HF Reject
LF Reject
Sets the input coupling to AC (50 Hz cutoff)
Sets the input coupling to DC
Sets the input coupling to low frequency reject (100 kHz cutoff)
Sets the input coupling to high frequency reject (10 kHz cutoff)
Video Trigger
Video triggering is used to trigger on fields or lines of NTSC, PAL, or SECAM
standard video waveforms. When Video is selected, the trigger coupling is set
to AC.
2-34
Trigger Controls
Trigger Modes
Table 2-8
Video Trigger Menu Buttons
Menu
Settings
Comments
Source
CH1
CH2
EXT
EXT/5
Sets CH1 as the trigger waveform
Sets CH2 as the trigger waveform
Sets EXT TRIG as the trigger waveform
Sets EXT TRIG/5 as the trigger waveform
Polarity
Normal polarity
Trigger on the negative edge of the sync pulse
Inverted polarity
Trigger on the positive edge of the sync pulse
Sync
All Lines
Line Num
Odd field
Even field
Trigger on all lines
Trigger on a selected line
Trigger on an odd field
Trigger on an even field
Standard
PAL/SECAM
NTSC
Trigger on a PAL or SECAM video waveform
Trigger on an NTSC video waveform
Normal Polarity Sync triggers always occur on negative-going horizontal sync pulses. If
the video waveform has positive-going horizontal sync pulses, use the Inverted Polarity
selection.
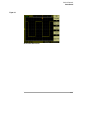
Figure 2-20
Video Line Trigger
2-35
Trigger Controls
Trigger Modes
Figure 2-21
Video Field Trigger
2-36
Waveform Controls
Figure 2-22 shows the location of the Acquire button in the Waveform section
of the front panel.
Figure 2-22
Waveform Controls
Pressing the Acquire button displays the Acquire menu as follows:
Table 2-9
Menu
Settings
Comments
Mode
Normal
Average
Peak Detect
Normal acquisition mode
Average acquisition mode
Peak Detect acquisition mode
Sampling
Real Time
Equ-Time
Real time sampling mode
Equivalent time sampling mode
Averages
2 to 256
Step by multiple of two. Set average counts from 2 to 256
Sequence
Activate sequential capture, store, and playback
Select Real Time sampling to observe single-shot or pulse waveforms.
Select Equ-Time sampling to observe high frequency repetitive waveforms.
To reduce the displayed random noise, select the Average acquisition. This mode
decreases screen refresh rate.
To avoid waveform aliasing, select Peak Detect acquisition.
2-37
Waveform Controls
Stop Acquisition
Stop Acquisition
When acquisition is stopped, the last acquired waveform is displayed. The
waveform can be moved by using the vertical and horizontal controls. When
the horizontal scale is set to 20 ns or faster, the oscilloscope uses sine(x)/x
interpolation to expand the horizontal signal resolution.
Equivalent Time Sampling
The equivalent time sampling mode can achieve up to 20 ps of horizontal
resolution (equivalent to 50 GSa/s). This mode is good for observing repetitive
waveforms and should not be used for single-shot events or pulse waveforms.
Average Acquisition
The Average Acquisition mode should be used to remove random noise from
the waveform and to improve measurement accuracy. See Figure 2-23 and
Figure 2-24. The averaged waveform is a running average over a specified
number of acquisitions from 2 to 256.
2-38
Waveform Controls
Average Acquisition
Figure 2-23
Noisy Waveform Without Averaging
Figure 2-24
Noisy Waveform With Averaging
2-39
Waveform Controls
Peak Detect
Peak Detect
Peak Detect mode captures the maximum and minimum values of a waveform
over multiple acquisitions.
Figure 2-25
Peak Detect Waveform
2-40
Waveform Controls
Sequence Capability
Sequence Capability
The sequence capability or waveform recorder can record input waveforms
from channel 1 or channel 2, with a maximum acquisition depth of 1000 frames.
This recording behavior can also be activated by the Mask Test, which makes
this function especially useful for capturing abnormal waveforms over a long
period of time.
Pressing the Sequence key produces the associated menu as follows:
Table 2-10
Sequence Menu
Menu
Settings
Comments
Mode
Capture
Play back
Save/Recall
Off
Select capture mode
Select play back mode
Select storage mode
Turn off all sequence functions
Source
CH1
CH2
Select capture source channel
Interval
Set time interval between captured frames using the entry knob
<1.00ms-1000s>
End Frame
Set number of captured frames using the entry knob
<1-1000>
Operate
(Record)
Press to start capturing
(Stop)
Press to stop capturing
2-41
Waveform Controls
Sequence Capability
Table 2-11
Playback Menu 1
Menu
Settings
Operation
Comments
(Play)
Press to start playback
(Stop)
Press to stop playback
Msg Display On
Off
Turn on recorder information display
Turn off recorder information display
Play mode
Set continuous play mode
Set one time play mode
Table 2-12
Playback Menu 2
Menu
Settings
Interval
Comments
Set time interval between frames using the front panel entry
knob
<1.00 ms to 20s>
Start frame
Set start frame using the front panel entry knob
<1 to 1000>
Select current frame to be played using the front panel entry
knob
Current
frame
<1 to 1000>
End frame
Set End frame using the front panel entry knob
<1 to 1000>
Table 2-13
Save/Recall Menu
Menu
Settings
Start frame
Comments
Set first frame to be saved using the front panel entry knob
<1 to 220>
End frame
Set last frame to be saved using the front panel entry knob
<1 to 220>
Save
Save the waveforms between start frame and end frame
Load
Load the saved waveforms from non-volatile memory
2-42
Display Controls
Figure 2-26 shows location of the Display button in the Waveform area of the
front panel.
Figure 2-26
Display Menu
Pressing the Display button produces the Display menu as follows:
Table 2-14
Display Menu 1
Menu
Setting
Comments
Type
Vectors
Dots
Display waveforms as vectors
Display waveforms as dots
Grid
Display grids and axes on the screen
Turn off the grids
Turn off the grids and axes
Persist
Infinite
OFF
Clear
The sample points remain displayed until persistence is set to "OFF" or
Clear is pressed
Turn off the persistence function
Clears waveforms from the display
When the display Type is set to Vectors, the oscilloscope connects the sample
points by using digital interpolation. Digital interpolation maintains linearity by
using a sin(x)/x digital filter. The digital interpolation is suitable for real time
sampling and is most effective at 20 ns or faster horizontal scale settings.
2-43
Display Controls
Sequence Capability
Table 2-15
Display Menu 2
Menu
Settings
Comments
Press to increase display brightness
Press to decrease display brightness
Menu Display
1s, 2s, 5s, 10s, 20s, and Infinite Sets the time before hiding menus
Screen
Normal
Invert
2-44
Sets to normal display colors
Sets to inverted display colors
Save and Recall Controls
Figure 2-27 shows the location of the Save/Recall button on the front panel.
Figure 2-27
Save/Recall Button Location
Pressing the Save/Recall button produces the associated menu as follows:
Table 2-16
Save/Recall Menu Buttons
Menu
Settings
Comments
Save/Recall
Waveforms
Setups
Save or recall waveforms
Save or recall an oscilloscope setup
Default Setup
Loads the factory default setup
Waveform
No.1 through No. 10
Sets the storage location of the waveform
Setup
No.1 through No. 10
Sets the storage location of the setup
Load
Recall waveforms or setups
Save
Save waveforms or setups
2-45
Save and Recall Controls
Waveforms
Waveforms
You can save 10 waveforms for the two channels in the nonvolatile memory of
the oscilloscope and overwrite the previously saved contents as needed.
Setups
You can save 10 settings in the nonvolatile memory of the oscilloscope and
overwrite previously saved setups. By default, the oscilloscope saves the
current setup each time it is turned off. The oscilloscope automatically recalls
this setup the next time it is turned on.
Default Setup
You can recall the factory default setup any time you want to return the
oscilloscope to the state it was in when you received it.
Load
The saved waveforms or setups can be recalled by pressing the Load menu
button.
Save
Either the waveforms or the current settings of the oscilloscope are saved to
nonvolatile memory by pressing the Save menu button. Wait at least five
seconds before turning off the oscilloscope after pressing this button.
2-46
Utility Controls
Figure 2-28 shows the location of the Utility button on the front panel.
Figure 2-28
Utility Button
Pressing the Utility button produces the associated menu as follows:
2-47
Utility Controls
Save
Table 2-17
Utility Menu 1
Menu
Setting
Mask Test
Setup Mask Test
I/O Setup
Language
Sound
Comments
Produces the I/O Setup menu
English
German
French
Italian
Russian
Portuguese
Simplified Chinese
Traditional Chinese
Korean
Japanese
(ON)
Select language (More languages may be added in
later software versions)
Switches the beeper sound on or off
(OFF)
Table 2-18
Utility Menu 2
Menu
Comments
System Info
Displays model number, serial number, and
software version information
Self-Cal
Execute Self-calibration
Self-Test
Execute Self-test
2-48
Utility Controls
Mask Test
Mask Test
The Mask Test function monitors waveform changes by comparing the
waveform to a predefined mask.
Pressing the Mask Test key produces the following menu:
Table 2-19
Mask Test Menu 1
Menu
Setting
Comments
Enable Test
On
Off
Turn on Mask Test
Turn off Mask Test
Source
CH1
CH2
Select Mask Test on CH1
Select Mask Test on CH2
Operation
Msg Display
Table 2-20
(Run)
Mask Test stopped, press to run
(Stop)
Mask Test running, press to stop
On
Off
Turn on Mask Test information display
Turn off Mask Test information display
Mask Test Menu 2
Menu
Settings
Comments
Output
Fail
Fail +
Pass
Pass +
Indicate when Fail condition detected
Indicate and beep when Fail condition detected
Indicate when Pass condition detected
Indicate and beep when Pass condition detected
Stop on Output On
Off
Stop when output condition occurs
Continue when output condition occurs
Load
Load a previously stored mask
2-49
Utility Controls
Mask Test
Table 2-21
Mask Test Menu 3
Menu
Settings
X Mask
Comments
Set the mask’s horizontal failure margin (0.04 div to 4.00 div)
< x div >
Y Mask
Set the mask’s vertical failure margin (0.04 div to 4.00 div)
< y div>
Create Mask
Create a mask from the current waveform using the above failure
margins
Save
Save the created mask
The Mask Test function is unavailable in X-Y mode .
The Output function is available on a BNC connector that is part of the optional I/O
module.
2-50
Utility Controls
I/O Setup Menu
I/O Setup Menu
Requires the I/O module to be installed before the GPIB and RS-232 ports can be
configured.
Before installing or uninstalling the I/O module, make sure that the oscilloscope
power is off. More details can be found in the Programmer’s Guide on the
CD-ROM.
Pressing the I/O Setup menu key produces the following menu.
Table 2-22
I/O Setup Menu
Menu
Settings
Comments
RS-232 Baud
300
2400
4800
9600
19200
38400
Sets the RS-232 baud rate
GPIB Address
0 through 30
Sets the GPIB address
USB connected
2-51
Utility Controls
System Info
System Info
Press this menu button to display the oscilloscope’s model number, serial
number, software version, and installed module information.
2-52
Utility Controls
Self-Calibration
Self-Calibration
Before performing the automatic calibration, allow the oscilloscope to warm-up at
least 30 minutes.
Pressing the Self-Cal menu key starts the automatic calibration routine which
adjusts the internal circuitry of the oscilloscope for the best measurement
accuracy. The the automatic calibration should be run when the ambient
temperature changes by 5 ºC or more.
Figure 2-29
Calibration Dialog Box
2-53
Utility Controls
Self-Test
Self-Test
Pressing the Self-Test key produces the Self-Test menu as follows:
Table 2-23
Self-Test Menu
Menu
Settings
Screen Test
Press to run the screen test
Key Test
Press to run the front panel key and knob test
Screen Test
Press this menu button to run the Screen Test program. Follow the on-screen
messages. The screen of the oscilloscope turns red, green and blue in sequence
when pressing the Run/Stop front panel key. Visually check the screen for
display failures.
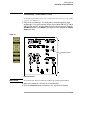
Key Test
Pressing this menu button runs the front panel key and knob test. The
on-screen shapes represent the front panel keys. The shapes with two arrows
beside them represent the front panel knobs. The squares represent the knob
presses for scale knobs. Test all keys and knobs and verify that all of the controls
turn green. During this test, you should also verify that all the backlit buttons
illuminate correctly.
To exit the key test, press the Run/Stop key three times in succession.
2-54
Automatic Measurement Controls
The Meas button located on the front panel actives the automatic measurement
system. The instructions below will guide you in using the various measurement
functions.
Pressing the Meas button produces the Measure menu used to select automatic
measurement. The oscilloscope has 20 automatic measurements: Vpp, Vmax,
Vmin, Vtop, Vbase, Vamp, Vavg, Vrms, Overshoot, Preshoot, Freq, Period, Rise
Time, Fall Time, Delay1-2, Delay1-2, +Width, -Width, +Duty, and -Duty. It also
has a hardware counter capability.
Figure 2-30
Meas Button
Table 2-24
Measure Menu
Menu
Settings
Comments
Source
CH1
CH2
Selects channel 1 or channel 2 as the waveform to be measured
Voltage
Selects the voltage measurement menu
Time
Selects the time measurement menu
Clear
Display All
Clears the on screen measurement results
OFF
ON
Turns off all measurements
Turns on all measurements
2-55
Automatic Measurement Controls
Voltage Measurements
Voltage Measurements
Pressing the Voltage menu button produces the following menus.
Table 2-25
Table 2-26
Table 2-27
Voltage Measurement Menu 1
Menu
Comments
Voltage 1/3
Press to display menu 2 voltage measurements
Vpp
Measure peak-to-peak voltage of a waveform
Vmax
Measure maximum voltage of a waveform
Vmin
Measure minimum voltage of a waveform
Vavg
Measure average voltage of a waveform
Voltage Measurement Menu 2
Menu
Comments
Voltage 2/3
Press to display menu 3 voltage measurements
Vamp
Measure voltage between Vtop and Vbase of a waveform
Vtop
Measure a flat top voltage of a waveform
Vbase
Measure a flat base voltage of a waveform
Vrms
Measure the root-mean-square voltage of a waveform
Voltage Measurement Menu 3
Menu
Comments
Voltage 3/3
Press to display menu 1 voltage measurements
Overshoot
Measure the overshoot voltage in percent
Preshoot
Measure the preshoot voltage in percent
2-56
Automatic Measurement Controls
Time Measurements
Time Measurements
Pressing the Time menu button produces the following menus.
Table 2-28
Table 2-29
Table 2-30
Time Measurement Menu 1
Menu
Comments
Time 1/3
Press to display menu 2 time measurements
Freq
Measure the frequency of a waveform
Period
Measure the period of a waveform
Rise Time
Measure the rise time of a waveform
Fall Time
Measure the fall time of a waveform
Time Measurement Menu 2
Menu
Comments
Time 2/3
Press to display menu 3 time measurements
+Width
Measure the positive pulse width of a waveform
-Width
Measure the negative pulse width of a waveform
+Duty
Measure the positive duty cycle of a waveform
-Duty
Measure the negative duty cycle of a waveform
Time Measurement Menu 3
Menu
Comments
Time 3/3
Press to display menu 1 time measurements
Delay1→2
Measure the delay between two waveforms using the rising edges
Delay1→2
Measure the delay between two waveforms using the falling edges
Counter
Press to toggle the hardware counter on and off
The results of the automatic measurements are displayed on the bottom of the
screen. When invoking individual measurements, a maximum of three results
can be displayed at the same time. The next new measurement result selected
moves the previous measurements to the left pushing the first measurement
result off screen. The hardware counter result is displayed separately in the
upper right-hand corner of the screen. The Display All function displays all of
the measurements except for the Delay measurements at the same time.
2-57
Automatic Measurement Controls
Automatic Measurement Procedure
Automatic Measurement Procedure
1 Select either CH1 or CH2 according to the waveform you want to measure.
2 To see all time and voltage measurement values, set the Display All menu
to ON.
3 Select the Voltage or Time menu button to display the list of
measurements.
4 Select the desired measurement menu button. The measurement result
is displayed at the bottom of the screen. If the measurement result is
displayed as "*****", then the measurement cannot be performed with
the current oscilloscope settings.
5 Press the Clear menu button to remove the individual automatic
measurements from the screen.
2-58
Automatic Measurement Controls
Measurement Concepts
Measurement Concepts
This section describes the way that the automatic measurements are made.
Voltage Measurements
There are 10 automatic voltage measurements:
• Vpp (Peak-to-Peak Voltage)
• Vmax (Maximum Voltage)
• Vmin (Minimum Voltage)
• Vavg (Average Voltage)
• Vamp (Amplitude Voltage = Vtop - Vbase)
• Vtop (Top Voltage)
• Vbase (Base Voltage)
• Vrms (True Root-Mean-Square Voltage)
• Overshoot
• Preshoot
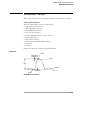
Figure 2-31 shows the voltage measurement points.
Figure 2-31
Vmax
Overshoot
Vtop
Vpp
Vbase
Preshoot
3000b01.cdr
Vmin
Voltage Measurement Points
2-59
Automatic Measurement Controls
Measurement Concepts
Time Measurements
There are 10 automatic time measurements:
• Frequency
• Period
• Rise Time
• Fall Time
• +Width
• -Width
• +Duty
• -Duty
• Delay 1→2
• Delay 1→2
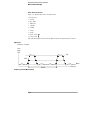
The following figures show how the different time measurements are made.
Figure 2-32
Frequency = 1/Period
Time
origin
line
Top
50%
Base
Period
Frequency and Period Measurements
2-60
54800b24.cdr
Automatic Measurement Controls
Measurement Concepts
Figure 2-33
Time
origin
line
Vtop
90% (upper)
50% (middle)
10% (lower)
Vbase
3000b02.cdr
Rising
edge
Falling
edge
Rise Time and Fall Time Measurements
Figure 2-34
Time
origin
line
Time
origin
line
90%
Amplitude
3000b04.cdr
50%
Amplitude
50%
10%
Top
Top
Base
0 Volts
Base
0 Volts
-Width
+Width
-Width and +Width Measurements
2-61
Automatic Measurement Controls
Measurement Concepts
Figure 2-35
Time
origin
line
Channel 1
50%
50%
Channel 2
3000b05.cdr
Delay from channel
1 to channel 2 falling edge
Time
origin
line
Channel 1
50%
50%
Channel 2
3000b06.cdr
Delay from channel
1 to channel 2 rising edge
Delay Measurements
2-62
Cursor Measurement Controls
Figure 2-36 shows the location of the Cursors button on the front panel.
Figure 2-36
Cursors Button
There are three cursor measurement modes.
• Manual
• Track
• Auto Measure
2-63
Cursor Measurement Controls
Manual
Manual
In the manual mode, the screen displays two parallel cursors. You can move the
cursors to make custom voltage or time measurements on the waveform. The
cursor values are displayed in the boxes at the top of the screen. Before using
cursors, you should make sure that you have set the waveform source to the
channel that is to be measured.
Table 2-31
Manual Cursors Menu
Menu
Settings
Comments
Mode
Manual
Set Manual mode for cursor measurement
Type
Voltage
Time
Use cursors to measure voltage parameters
Use cursors to measure time parameters
Source
CH1
CH2
Math
Sets the measurement waveform source
To do manual cursor measurements, use the following steps.
1 Press the Mode menu button until Manual appears.
2 Press Type menu button until the units that you want to measure appears.
3 Press the Source menu button until the source you want to measure
appears.
4 Move the cursors to the desired measurement position using the
information in Table 2-32.
Cursor movement is only possible while the Cursors menu is being displayed.
Table 2-32
Manual Cursors Adjustment Controls
Type
Operation
Voltage
Turn the entry knob to move the selected
cursor (A or B) up or down
Time
Turn the entry knob to move the selected
cursor (A or B) left or right
2-64
Cursor Measurement Controls
Manual
Table 2-33
Manual Cursors Position Readouts
Readout
Type
Description
CurA
Voltage
Time
Shows the current voltage value for Cursor A
Shows the time position for Cursor A
CurB
Voltage
Time
Shows the current voltage value for Cursor A
Shows the time position for Cursor A
∆Y
∆X
Voltage
Time
Shows the voltage difference between Cursor A and Cursor B
Shows the time difference between Cursor A and Cursor B
1/∆X
Time
Shows the frequency difference between Cursor A and Cursor B
2-65
Cursor Measurement Controls
Track
Track
In the track mode, the screen displays two cross hair cursors. The cross hair of
the cursor is positioned on the waveform automatically. You can adjust the
selected cursor's horizontal position on the waveform by turning the entry knob.
The oscilloscope displays the values of the coordinates in the boxes at the top
of the screen.
Table 2-34
Track Cursors Menu
Menu
Mode
Cursor A
Settings
Track
CH1
CH2
None
Cursor B
CH1
CH2
None
Comments
Set Track mode in cursor measurement
Set Cursor A track the waveform on channel 1
Set Cursor A to track the waveform on channel 2
Turn off Cursor A
Set Cursor B to track the waveform on channel 1
Set Cursor B to track the waveform on channel 2
Turn off Cursor B
In cursor track mode, the cursors move with the selected waveform.
2-66
Cursor Measurement Controls
Auto Measure
Auto Measure
The Auto Measure cursors mode is only available when automatic
measurements are on. The oscilloscope displays cursors corresponding to the
most recently invoked automatic measurement.
There will be no cursor display if no automatic measurements are selected in
the Measure menu.
2-67
Autoscale and Run/Stop Controls
The Autoscale button is used to automatically set the oscilloscope controls for
the input waveform that is present at the input of the oscilloscope. The Run/Stop
button is used to manually start or stop the oscilloscope’s acquisition system.
2-68
Autoscale and Run/Stop Controls
Autoscale Button
Autoscale Button
Figure 2-37 shows the location of the Autoscale button on the front panel.
Figure 2-37
Autoscale Button
The Autoscale feature automatically adjusts the scope to produce a usable
display of the input waveform(s).
2-69
Autoscale and Run/Stop Controls
Autoscale Button
After the Autoscale button is pressed the oscilloscope is configured to the
following default control settings.
Table 2-35
Menu
Settings
Display format
Y-T
Sampling mode
Real time
Acquire mode
Normal
Vertical coupling
Adjust to AC or DC according to the waveform
Vertical "V/div"
Adjusted according to the waveform
Vertical Knobs
Coarse mode
Bandwidth limit
OFF
Waveform invert
OFF
Horizontal position
Center
Horizontal "S/div"
Adjusted according to the waveform
Trigger type
Edge
Trigger source
Lowest numbered active channel
Trigger coupling
DC
Trigger voltage
Midpoint (50%) setting
Trigger sweep
Auto
2-70
Autoscale and Run/Stop Controls
Run/Stop Button
Run/Stop Button
The Run/Stop front panel button starts and stops the oscilloscope’s acquisition
system. When stopped, the button is red and the vertical and horizontal scales
can be adjusted within a fixed range. When the horizontal scale is 50 ms/div or
faster, the stopped waveform can be expanded or contracted by 5 horizontal
scale steps.
2-71
2-72
3
Specifications and Characteristics
Specifications and Characteristics
Specifications
Specifications
All specifications are warranted. Specifications are valid after a 30-minute warm-up
period and ±5 °C from last calibration temperature.
Bandwidth (-3dB)
DSO3062A: 60 MHz
DSO3102A: 100 MHz
DSO3152A: 150 MHz
DSO3202A: 200 MHz
2 mV/div to 5 mV/d: ±4.0% full scale
10 mV/div to 5 V/div: ±3.0% full scale
DC Vertical Gain Accuracy
3-2
Specifications and Characteristics
Characteristics
Characteristics
All characteristics are the typical performance values and are not warranted.
Characteristics are valid after a 30-minute warm-up period and ±5 °C from last
calibration temperature.
3-3
Specifications and Characteristics
Characteristics
Acquisition System
Max Sample rate
Vertical Resolution
Peak Detection
Averages
1 GSa/s
8 bits
5 ns
selectable from 2, 4, 8, 16, 32, 64, 128, and 256
Vertical System
Analog channels
Channels 1 and 2 simultaneous acquisition
DSO3062A: 60 MHz
DSO3102A: 100 MHz
DSO3152A: 150 MHz
DSO3202A: 200 MHz
DSO3202A: 1.8 ns
DSO3152A: 2.3 ns
DSO3102A: 3.5 ns
DSO3062A: 5.8 ns
2 mV/div to 5 V/div
CAT II 1 MΩ 300 Vrms
Calculated rise time
(= 0.35/bandwidth)
Range1
Maximum Input
Offset Range
±2 V 2 mV/div to 100 mV/div
±40 V on ranges 102 mV/div to 5 V/div
1 MΩ ±1%
~ 13 pF
AC, DC, ground
~ 20 MHz
±2 kV
2 mV/div to 5 mV/div: ±4%
10 mV/div to 5 V/div ±3%
±(3% x reading +0.1 div + 1mV) when 10 mV/div or greater is selected and vertical position
is at zero
±(3% x (reading + vertical position) + 1% of vertical position + 0.2 div) when 10 mV/div or
greater is selected and vertical position is not at zero
Add 2 mV for settings from 2 mV/div to 200 mV/div
Add 50 mV for settings > 200 mV/div to 5 V/div
Input Resistance
Input Capacitance
Coupling
BW Limit
ESD Tolerance
DC Vertical Gain Accuracy
DC Measurement
(≥ 16 waveform averages)
3-4
Specifications and Characteristics
Characteristics
Horizontal
Range
Timebase Accuracy
Modes
2 ns/div to 50 s/div
±100 ppm over any time interval ≥ 1 ms
Main, Delayed, Roll, XY
Trigger System
Sources
Sweep
Holdoff Time
Selections
Edge
Pulse Width
Video
Maximum Input
Trigger Level Range
Internal
EXT
EXT/5
Sensitivity
DC
AC
LF Reject
HF Reject
Channel 1, channel 2, ac line, ext, and ext/5
Auto and Normal
100 ns to 1.5 s
Trigger on a rising or falling edge of any source
Trigger when a positive-going or negative-going pulse is less than, greater than, or equal
to a specified value on any of the source channels
Range: 20 ns to 10 s
Trigger on any analog channel for NTSC, PAL, or SECAM broadcast standards on either
positive or negative composite video signals. Modes supported include Even Field, Odd
Field, all lines, or any line within a field.
CAT II 300 Vrms
±12 divisions from center screen
± 2.4 V
± 12 V
CH1, CH2: 1 div (DC to 10 MHz)
1.5 div (10 MHz to full bandwidth)
EXT: 100 mV (DC to 10 MHz), 200 mV (10 MHz to full bandwidth)
EXT/5: 500 mV (DC to 10 MHz), 1 V (10 MHz to full bandwidth)
Same as DC at 50 Hz and above
Same as DC limits for frequencies above 100 kHz. Waveforms below 8 kHz are attenuated
Same as DC limits for frequencies from DC to 10 kHz. Frequencies above 150 kHz are
attenuated
Display System
Display
Resolution
Display Brightness
5.7-inch (145 mm) diagonal liquid crystal display
240 vertical by 320 horizontal pixels
Adjustable
3-5
Specifications and Characteristics
Characteristics
Measurements
Automatic Measurements
Voltage
Peak-to-Peak (Vpp), Maximum (Vmax), Minimum (Vmin), Average (Vavg), Amplitude
(Vamp), Top (Vtop), Base (Vbase), Overshoot, Preshoot, RMS (Vrms)
Frequency (Freq), Period, Positive Pulse Width (+Width), Negative Pulse Width (-Width),
Positive Duty Cycle (+Duty), Minus Duty Cycle (-Duty), Rise Time, Fall Time, Rising Edge
), Falling Edge Time Delay from
Time Delay from Channel 1 to Channel 2 (Delay1→2
Channel 1 to Channel 2 (Delay1→2
), Hardware Counter
Time
General Characteristics
Physical:
Size
Weight
Calibrator Output
350 mm wide x 288 mm high x 145 mm deep (without handle)
4.8 kgs
Frequency 1 kHz; Amplitude 3 Vpp into 1 MΩ load
Power Requirements
Line Voltage Range
Line Frequency
Power Usage
100 to 240 VAC ±10%, CAT II, automatic selection
50 to 440 Hz
50 VA max
Environmental
Characteristics
Ambient Temperature
Operating 0 °C to +55 °C
Non-operating -40 °C to +70 °C
Operating 95% RH at 40 °C for 24 hr
Non-operating 90% RH at 65 °C for 24 hr
Operating to 4,570 m (15,00 ft)
Non-operating to 15,244 m (50,000 ft)
HP/Agilent class B1
HP/Agilent class B1
Normally only dry non-conductive pollution occurs. Occasionally a temporary
conductivity caused by condensation must be expected.
This instrument is rated for indoor use only
Humidity
Altitude
Vibration
Shock
Pollution degree2
Indoor use only
Installation categories
CAT I: Mains isolated
CAT II: Line voltage in appliance and to wall outlet
3-6
4
Service
Returning the oscilloscope to Agilent
Technologies for service
Before shipping the oscilloscope to Agilent Technologies, contact your
nearest Agilent Technologies oscilloscope Support Center (or Agilent
Technologies Service Center if outside the United States) for additional
details.
1 Write the following information on a tag and attach it to the
oscilloscope.
•
•
•
•
Name and address of owner
oscilloscope model numbers
oscilloscope serial numbers
Description of the service required or failure indications
2 Remove all accessories from the oscilloscope.
Accessories include all cables. Do not include accessories unless they are
associated with the failure symptoms.
3 Protect the oscilloscope by wrapping it in plastic or heavy paper.
4 Pack the oscilloscope in foam or other shock absorbing material and
place it in a strong shipping container.
You can use the original shipping materials or order materials from an Agilent
Technologies Sales Office. If neither are available, place 8 to 10 cm (3 to 4
inches) of shock-absorbing material around the oscilloscope and place it in a
box that does not allow movement during shipping.
5 Seal the shipping container securely.
6 Mark the shipping container as FRAGILE.
In any correspondence, refer to oscilloscope by model number and full serial
number.
4-2
Testing Performance
This section documents performance test procedures. Performance
verification for the products covered by this manual consists of three
main steps:
• Performing the internal product self-tests to ensure that the
measurement system is functioning properly
• Calibrating the product
• Testing the product to ensure that it is performing to specification
Performance Test Interval
The procedures in this section may be performed for incoming
inspection and should be performed periodically to verify that the
oscilloscope is operating within specification. The recommended test
interval is once per year or after 2000 hours of operation. Performance
should also be tested after repairs or major upgrades.
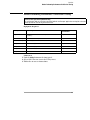
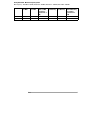
Performance Test Record
A test record form is provided at the end of this section. This record lists
performance tests, test limits and provides space to record test results.
Test Order
The tests in this section may be performed in any order desired.
However, it is recommended to conduct the tests in the order presented
in this manual as this represents an incremental approach to
performance verification. This may be useful if you are attempting to
troubleshoot a suspected problem.
Test Equipment
Lists of equipment needed to conduct each test are provided for each
test procedure. The procedures are written to minimize the number and
types of oscilloscopes and accessories required. The oscilloscopes in
these lists are ones that are currently available for sale by Agilent at the
time of writing this document. In some cases, the test procedures use
features specific to the oscilloscopes in the recommended equipment
4-3
Service
list. However, with some modification to the test procedures,
oscilloscopes, cables and accessories that satisfy the critical
specifications in these lists may be substituted for the recommended
models with some modification to the test procedures.
Contact Agilent Technologies for more information about the Agilent
products in these lists.
4-4
Service
Before Performing Performance Verification Testing
Before Performing Performance Verification Testing
Let the oscilloscope warm up before testing
The oscilloscope under test must be warmed up (with the oscilloscope application running) for at least 30
minutes prior to the start of any performance test.
Equipment Required
Description
Critical Specifications
Recommended Model/
Part Numbers
Digital Multimeter
DC voltage measurement accuracy better than ±0.1% of
reading
Agilent 34401A
Cable Assembly
50Ω characteristic impedance
Agilent 54855-61620
Cable Assembly
RS-232 (f)(f)
Agilent 34398A
Adapter
BNC Barrel (f)(f)
Agilent 1250-0080
Adapter
BNC shorting cap
Agilent 1250-0929
Adapter
Precision BNC (2)
Agilent 54855-67604
Adapter
BNC (f) to dual banana
Agilent 1251-2277
Calibration
1 Push the Utility button on the front panel.
2 Select Self-Cal menu item in the Utility menu.
3 Follow the on-screen instructions.
4-5
Vertical Performance Verification
This section contains the following vertical performance verification:
• DC Gain Accuracy Test
• Analog Bandwidth Test
4-6
Service
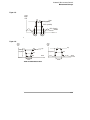
DC Gain Accuracy Test
DC Gain Accuracy Test
CAUTION
Ensure that the input voltage to the oscilloscope never exceeds 300 Vrms.
Specifications
DC Gain Accuracy
±1.5% of full scale at full resolution channel scale
Full scale is defined as 8 vertical divisions. The major scale settings are 2 mV, 5 mV, 10 mV, 20 mV, 50 mV, 100 mV, 200 mV, 500 mV,
1 V, 2 V, and 5 V.
Equipment Required
Description
Critical Specifications
Recommended Model/
Part Numbers
Power Supply
0 V to 35 V dc; 10 mV resolution
Agilent E3633A or E3634A
Digital Multimeter
DC voltage measurement accuracy better than ±0.1% of
reading
Agilent 34401A
Cable Assembly
(2 required)
50Ω characteristic impedance, BNC (m) connectors
Agilent 8120-1840
Adapter
BNC Tee (m)(f)(f)
Agilent 1250-0781
Adapter
(2 required)
BNC (f) to dual banana
Agilent 1251-2277
Procedure
1 Disconnect all cables from the oscilloscope channel inputs.
2 Press the Save/Recall front panel button.
3 Select the Storage item in the Save/Recall menu until Setups appears.
4-7
Service
DC Gain Accuracy Test
Figure 4-1
4
5
6
7
Select the Default Setup item in the Save/Recall menu.
Press the Acquire front panel button.
Select the mode item in the Acquire menu until Average appears.
Select the Averages item in the Acquire menu until 256 appears.
4-8
Service
DC Gain Accuracy Test
Figure 4-2
8 Set the channel 1 vertical sensitivity value to 2 mV/div.
9 Set the power supply to +6 mV.
10 Connect the equipment as shown in Figure 4-3.
4-9
Service
DC Gain Accuracy Test
Figure 4-3
Oscilloscope
Power Supply
Digital Multimeter
BNC tee
BNC (f) to
dual
banana
11 Press the Meas button on the front of the oscilloscope.
12 Select the Voltage menu item.
4-10
Service
DC Gain Accuracy Test
13 Select the Vavg measurement as shown below.
Vavg
measurement
14 Record the DMM voltage reading as VDMM+ and the oscilloscope Vavg
reading as VScope+ in the DC Gain Test section of the Performance Test
Record.
15 Repeat step 14 for the remaining vertical sensitivities for channel 1 in
the DC Gain Test section of the Performance Test Record.
16 Set the power supply voltage to +6 mV.
17 Move the BNC cable on channel 1 to channel 2.
18 Press the Save/Recall front panel button.
19 Select the Storage item in the Save/Recall menu until Setups appears.
20 Select Default Setup in the Save/Recall menu.
21 Set the channel 2 vertical sensitivity value to 2 mV/div.
22 Press the Meas button on the front of the oscilloscope.
23 Select the Voltage menu item.
24 Select the Vavg measurement.
25 Record the DMM voltage reading as VDMM- and the oscilloscope Vavg
reading as VScope- in the DC Gain Test section of the Performance Test
Record.
26 Repeat step 25 for the remaining vertical sensitivities for channel 2 in
the DC Gain section of the Performance Test Record.
4-11
Service
DC Gain Accuracy Test
27 Calculate the DC Gain using the following expression and record this
value in the DC Gain Test section of the Performance Test Record:
∆V out V scope+ – V scopeDCGain = -------------- = ----------------------------------------∆V in V DMM+ – V DMM-
4-12
Service
Analog Bandwidth - Maximum Frequency Check
Analog Bandwidth - Maximum Frequency Check
CAUTION
Ensure that the input voltage to the oscilloscope never exceeds 300 Vrms.
Specification
Analog Bandwidth (-3 dB)
DSO3062A
60 MHz
DSO3102A
100 MHz
DSO3152A
150 MHz
DSO3202A
200 MHz
Equipment Required
Description
Critical Specifications
Recommended Model/
Part Numbers
Signal Generator
100 kHz to 1 GHz at 200 mVrms
Agilent 8648A
Power Splitter
outputs differ by < 0.15 dB
Agilent 11667B
Power Meter
Agilent E-series with power sensor compatibility
Agilent E4418B
Power Sensor
100 kHz to 1 GHz ±3% accuracy
Agilent 8482A
SMA Cable
SMA (m) to SMA (m) 24 inch
Adapter
50 Ω BNC feed through terminator
Adapter
Type N (m) to SMA (f)
Agilent 1250-1250
Adapter
Type SMA (m) to BNC (m)
Agilent 1250-0831
4-13
Service
Analog Bandwidth - Maximum Frequency Check
Connections
Connect the equipment as shown in Figure 4-4.
Figure 4-4
Power meter
E4418B
Oscilloscope
Signal Generator 8648A
Power sensor
cable
50 Ω feed
through
Power splitter
11667B
SMA to BNC adapter
Power sensor
8482A
SMA cable
Type N to SMA
adapter
Procedure
1 Preset and calibrate the power meter according to the instructions
found in the power meter manual.
2 Set up the Power Meter to display measurements in units of Watts.
3 On the oscilloscope, press the Save/Recall front panel button.
4 Select the Storage item in the Save/Recall menu until Setups appears.
4-14
Service
Analog Bandwidth - Maximum Frequency Check
Figure 4-5
5 Select the Default Setup item in the Save/Recall menu.
6 Press the Autoscale front panel button.
7 Set the channel 1 vertical scale to 200 mV/div.
Figure 4-6
8 Set the horizontal scale to 500 ns/div.
4-15
Service
Analog Bandwidth - Maximum Frequency Check
Figure 4-7
9 Press the Acquire front panel button.
10 Select the Mode menu item until Average appears.
11 Select the Average menu item until 8 appears.
Figure 4-8
12 Press the Meas front panel button.
13 Select the Voltage menu item.
4-16
Service
Analog Bandwidth - Maximum Frequency Check
14 Select the Voltage menu item until 2/3 appears.
15 Select the Vpp menu item.
16 Set the signal generator to a 1 MHz sine wave with a peak-to-peak
amplitude of about 6 divisions as it appears on the oscilloscope screen.
Figure 4-9
Vpp reading
17 Using the Vpp reading, calculate the Vrms value using the following
expression and record it in the Performance Test Record (page 4-22):
Vpp 1MHz
Vout 1MHz = --------------------2 2
Example
For Vpp = 1.20 V
1.20 1.20
Vout 1MHz = ---------- = ------------- = 424 mV
2 2 2.828
4-17
Service
Analog Bandwidth - Maximum Frequency Check
18 Using the power meter reading, convert this measurement to Volts RMS
using the expression and record it in the Performance Test Record
(page 4-22):
Vin 1MHz =
Example
P meas × 50Ω
For Pmeas = 3.65 mW.
Vin 1MHz =
3.65 mW × 50Ω = 427 mV
19 Calculate the reference gain as follows:
Vout 1MHz
Gain1MHz = -------------------------Vin 1MHz
Record this value in the Calculated Gain @ 1 MHz column of the Performance
Test Record (page 4-22).
20 Change the signal generator frequency to the value for the model being
tested as shown in the table below.
Setting
Model
DSO3062A
DSO3102A
DSO3152A
DSO3202A
Frequency
60 MHz
100 MHz
150 MHz
200 MHz
Time Base
10 ns/div
5 ns/div
5 ns/div
2 ns/div
21 Change the oscilloscope time base to the value for the model being tests
as shown in the table above.
22 Using the Vpp reading, calculate the Vrms value using the following
expression and record it in the Performance Test Record (page 4-22):
Vpp max
Vout max = ----------------2 2
4-18
Service
Analog Bandwidth - Maximum Frequency Check
Example
For Vpp = 1.24 V
1.05 1.05
Vout max = ---------- = ------------- = 371 mV
2 2 2.828
23 Using the power meter reading, convert this measurement to Volts RMS
using the expression and record it in the Performance Test Record
(page 4-22):
Vin max =
Example
P meas × 50Ω
For Pmeas = 3.65 mW.
Vin max =
3.65 mW × 50Ω = 427 mV
24 Calculate the gain at the maximum frequency using the expression and
record it in the Performance Test Record (page 4-22):
Gain max = 20 log 10
Example
( Vout max ) ⁄ ( Vin max )
-------------------------------------------------------Gain 1MHz
For example, if (Vout @ Max Frequency) = 371 mV, (Vin @ Max Frequency) =
427 mV and Gain @ 1 MHz = 0.993, then:
371 mV ⁄ 427 mV
Gain Max Freq = 20 log 10 -------------------------------------------- = -1.16 dB
0.993
Record this value in the Calculated Gain @Max Freq column in the Analog
Bandwidth - Maximum Frequency Check section of the Performance Test
Record. To pass this test, this value must be greater than -3.0 dB.
4-19
Service
Analog Bandwidth - Maximum Frequency Check
25 Move the power splitter from channel 1 to channel 2 and repeat steps
3 through 24 using channel 2 as the source.
4-20
Service
Performance Test Record
Performance Test Record
DC Gain Test
Vertical
Sensitivity
Channel 1
2 mV/div
5 mV/div
10 mV/div
20 mV/div
50 mV/div
100 mV/div
200 mV/div
500 mV/div
1 V/div
2 V/div
5 V/div
Channel 2
2 mV/div
5 mV/div
10 mV/div
20 mV/div
50 mV/div
100 mV/div
200 mV/div
500 mV/div
1 V/div
2 V/div
5 V/div
Power
Supply
Setting
VDMM+
VDMM-
VScope+
VScope-
Calculated
DC Gain
Offset Gain
Test Limits
±6 mV
±15 mV
±30 mV
±60 mV
±150 mV
±300 mV
±600 mV
±1.5 V
±2.4 V
±6.0 V
±15.0 V
+0.96 to +1.04
+0.96 to +1.04
+0.97 to +1.03
+0.97 to +1.03
+0.97 to +1.03
+0.97 to +1.03
+0.97 to +1.03
+0.97 to +1.03
+0.97 to +1.03
+0.97 to +1.03
+0.97 to +1.03
±6 mV
±15 mV
±30 mV
±60 mV
±150 mV
±300 mV
±600 mV
±1.5 V
±2.4 V
±6.0 V
±15.0 V
+0.96 to +1.04
+0.96 to +1.04
+0.97 to +1.03
+0.97 to +1.03
+0.97 to +1.03
+0.97 to +1.03
+0.97 to +1.03
+0.97 to +1.03
+0.97 to +1.03
+0.97 to +1.03
+0.97 to +1.03
4-21
Analog Bandwidth - Maximum Frequency Check
Max frequency: DSO3062A = 60 MHz, DSO3102A = 100 MHz, DSO3152A = 150 MHz, DSO31202A = 200 MHz
Vin
@ 1 MHz
Vout
@ 1 MHz
Channel 1
Channel 2
4-22
Calculated
Gain @ 1 MHz
(Test Limit =
greater than -3
dB)
Vin
@ Max Freq
Vout
@ Max Freq
Calculated
Gain @ Max Freq
(Test Limit =
greater than -3
dB)
Index
A
accessories
supplied 1-2
Acquire
Average 2-38
Equivalent time sampling 2-38
Peak detect 2-40
Auto measurement cursors 2-67
Automatic measurements 2-55
Auto-scale 1-12
Auto-Scale button 2-69
Average acquisition 2-38
B
Bandwidth limit control 2-9
C
cables
power 1-4
Calibration
Oscilloscope 2-53
cautions
cleaning 1-13
Channel
Digital filter control 2-14
Invert control 2-12
Probe attenuation control 2-11
Channel Controls
Coupling 2-6
Channels
Bandwidth limit control 2-9
checking the oscilloscope 1-2
Cleaning oscilloscope 1-13
cleaning the instrument 1-1
cleaning the oscilloscope 1-13
Compensating probes 1-7
contents
of oscilloscope package 1-2
Controls
Vertical 2-3
Coupling control 2-6
Cursor measurements 2-63
Manual 2-64
Track mode 2-66
Cursors
Auto measure 2-67
D
Digital filter controls 2-14
Display
Controls 2-43
E
Edge trigger 2-33
Equivalent time sampling 2-38
F
Functional check 1-5
G
GPIB control 2-51
H
Horizontal
Controls 2-22
Main/Delayed control 2-25
I
I/O settings 2-51
inspecting the oscilloscope 1-2
Invert control 2-12
M
Manual cursor measurements 2-64
manuals 1-2
Math functions 2-15
Measurement
Concepts 2-59
Measurements
Automatic 2-55
Cursor 2-63
Time 2-57
O
options
power cable 1-4
Oscilloscope
Cleaning 1-13
oscilloscope
cleaning 1-13
inspecting 1-2
P
package contents 1-2
packing for return 4-2
Peak detect 2-40
performance characteristics 3-1
plugs
power 1-4
power cables 1-4
Probe Attenuation control 2-11
Probes
Compensating 1-7
R
Recalling
Factory setup 2-45
Setups 2-45
Waveforms 2-45
Ref control 2-19
returning the instrument to Agilent 4-2
Roll mode 2-29
RS-232 control 2-51
Run button 2-71
S
Saving
Setups 2-45
Waveforms 2-45
Self-Calibration control 2-53
Self-Test 2-54
Sequence capability control 2-41
standard accessories 1-2
Stop button 2-71
Stop control 2-38
T
Testing oscilloscope 1-5
Time measurements 2-57
Timebase
Main/Delayed 2-25
Track cursors 2-66
Trigger
Controls 2-30
Edge 2-33
Modes 2-33
Video 2-34
Trigger holdoff control 2-28
Index-1
Index
U
Utility
Controls 2-47
GPIB control 2-51
I/O settings 2-51
RS-232 control 2-51
Self-Calibration control 2-53
Self-Test 2-54
Sequence Capability control 2-41
V
Vertical
Bandwidth limit control 2-9
Controls 2-3
Coupling control 2-6
Digital filter control 2-14
Invert control 2-12
Math functions control 2-15
Probe attenuation control 2-11
Ref control 2-19
Video trigger 2-34
W
Waveform
Controls 2-37
Roll mode 2-29
Index-2
Safety
Notices
• Whenever it is likely that the
ground protection is impaired,
you must make the instrument
inoperative and secure it against
any unintended operation.
This apparatus has been
designed and tested in accordance with IEC Publication 1010,
Safety Requirements for Measuring Apparatus, and has been
supplied in a safe condition.
This is a Safety Class I instrument (provided with terminal for
protective earthing). Before
applying power, verify that the
correct safety precautions are
taken (see the following warnings). In addition, note the
external markings on the instrument that are described under
"Safety Symbols."
• Service instructions are for
trained service personnel. To
avoid dangerous electric shock,
do not perform any service
unless qualified to do so. Do not
attempt internal service or
adjustment unless another person, capable of rendering first
aid and resuscitation, is present.
Warnings
• Before turning on the instrument, you must connect the protective earth terminal of the
instrument to the protective conductor of the (mains) power
cord. The mains plug shall only
be inserted in a socket outlet
provided with a protective earth
contact. You must not negate
the protective action by using an
extension cord (power cable)
without a protective conductor
(grounding). Grounding one
conductor of a two-conductor
outlet is not sufficient protection.
• Do not operate the instrument
in the presence of flammable
gasses or fumes. Operation of
any electrical instrument in such
an environment constitutes a
definite safety hazard.
• Only fuses with the required
rated current, voltage, and specified type (normal blow, time
delay, etc.) should be used. Do
not use repaired fuses or shortcircuited fuseholders. To do so
could cause a shock or fire hazard.
Safety Symbols
!
Instruction manual symbol: the
product is marked with this symbol when it is necessary for you
to refer to the instruction manual in order to protect against
damage to the product.
Hazardous voltage symbol.
• Do not install substitute parts
or perform any unauthorized
modification to the instrument.
• Capacitors inside the instrument may retain a charge even if
the instrument is disconnected
from its source of supply.
• Do not use the instrument in a
manner not specified by the
manufacturer.
To clean the instrument
If the instrument requires cleaning: (1) Remove power from the
instrument. (2) Clean the external surfaces of the instrument
with a soft cloth dampened with
a mixture of mild detergent and
water. (3) Make sure that the
instrument is completely dry
before reconnecting it to a
power source.
• If you energize this instrument
by an auto transformer (for voltage reduction or mains isolation), the common terminal must
be connected to the earth terminal of the power source.
Agilent Technologies Inc.
P.O. Box 2197
1900 Garden of the Gods Road
Colorado Springs, CO 80901-2197, U.S.A.
Earth terminal symbol: Used to
indicate a circuit common connected to grounded chassis.
Notices
© Agilent Technologies, Inc.
2005
No part of this manual may be
reproduced in any form or by
any means (including electronic
storage and retrieval or translation into a foreign language)
without prior agreement and
written consent from Agilent
Technologies, Inc. as governed
by United States and international copyright laws.
Manual Part Number
D3000-97000, March 2005
Print History
D3000-97000, March 2005
Restricted Rights Legend
If software is for use in the performance of a U.S. Government
prime contract or subcontract,
Software is delivered and
licensed as “Commercial computer software” as defined in
DFAR 252.227-7014 (June 1995),
or as a “commercial item” as
defined in FAR 2.101(a) or as
“Restricted computer software”
as defined in FAR 52.227-19
(June 1987) or any equivalent
agency regulation or contract
clause. Use, duplication or disclosure of Software is subject to
Agilent Technologies’ standard
commercial license terms, and
non-DOD Departments and
Agencies of the U.S. Government will receive no greater
than Restricted Rights as
defined in FAR 52.227-19(c)(1-2)
(June 1987). U.S. Government
users will receive no greater
than Limited Rights as defined in
FAR 52.227-14 (June 1987) or
DFAR 252.227-7015 (b)(2)
(November 1995), as applicable
in any technical data.
Document Warranty
The material contained in
this document is provided
“as is,” and is subject to
being changed, without
notice, in future editions.
Further, to the maximum
extent permitted by applicable law, Agilent disclaims
all warranties, either
express or implied, with
regard to this manual and
any information contained
herein, including but not
limited to the implied warranties of merchantability
and fitness for a particular
purpose. Agilent shall not be
liable for errors or for incidental or consequential
damages in connection with
the furnishing, use, or performance of this document
or of any information contained herein. Should Agilent and the user have a
separate written agreement
with warranty terms covering the material in this document that conflict with these
terms, the warranty terms in
the separate agreement
shall control.
Technology Licenses
The hardware and/or software
described in this document are
furnished under a license and
may be used or copied only in
accordance with the terms of
such license.
WARNING
A WARNING notice
denotes a hazard. It calls
attention to an operating
procedure, practice, or
the like that, if not
correctly performed or
adhered to, could result
in personal injury or
death. Do not proceed
beyond a WARNING
notice until the indicated
conditions are fully
understood and met.
CAUTION
A CAUTION notice
denotes a hazard. It calls
attention to an operating
procedure, practice, or
the like that, if not
correctly performed or
adhered to, could result in
damage to the product or
loss of important data. Do
not proceed beyond a
CAUTION notice until the
indicated conditions are
fully understood and met.
Trademark Acknowledgements