1
5.3
5.3
Level Monitor
Level Monitor
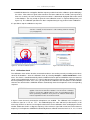
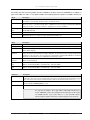
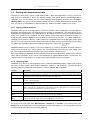
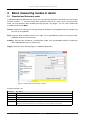
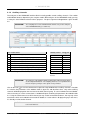
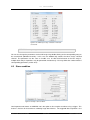
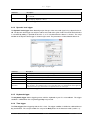
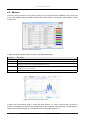
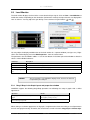
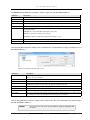
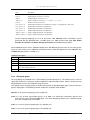
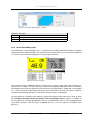
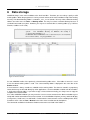
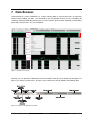
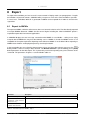
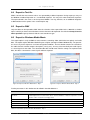
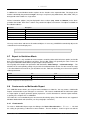
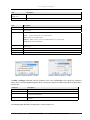
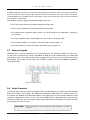
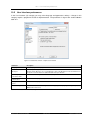
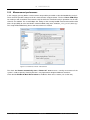
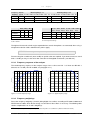
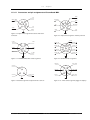
The level monitor displays the level of the current electrical input signal. Click on View -> Level Monitor to
enable the monitor. Depending on the orientation (horizontal or vertical) the input channels are displayed in
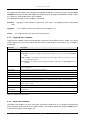
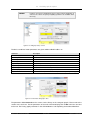
rows or columns. You may adjust the gain during a measurement using the buttons
and
.
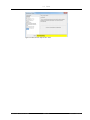
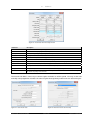
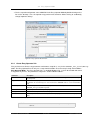
Figure 5.2: Level Monitor
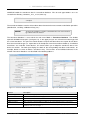
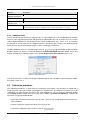
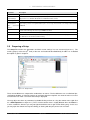
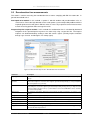
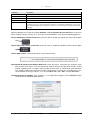
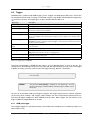
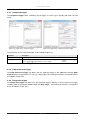
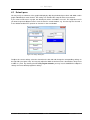
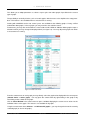
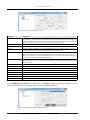
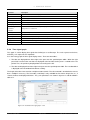
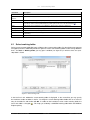
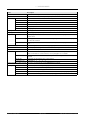
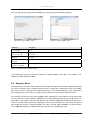
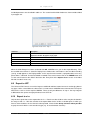
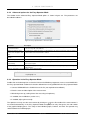
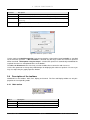
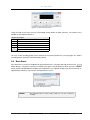
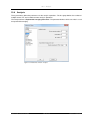
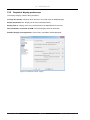
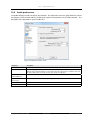
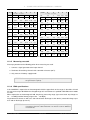
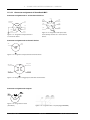
Figure 5.3: Level Monitor properties
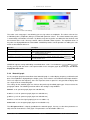
You may adjust the display and behaviour of the level monitor in a separate window (see figure 5.3). Rightclick in the monitor display and select Edit Properties... from the context menu.
The parameters are described in table 5.1. Use the four buttons in the lower part of the window to select the
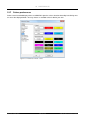
colours of the individual elements.
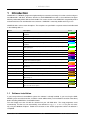
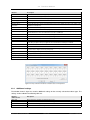
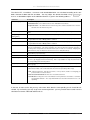
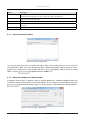
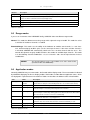
Parameter
Description
Window orientation
Define the orientation of the input channels in rows or columns.
Bar width
Define the width of the bar displayed for a channel.
Peak-Hold reset time
Define the hold time for the peak value display.
Enable adjust gain but- (Un-)Check this box to dis-/enable the adjust gain buttons.
tons
Table 5.1: Parameters level monitor
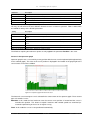
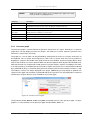
NOTICE!
5.3.1
The level monitor is not available in Replay mode, because the data are
not provided by the analyzer.
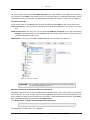
Drag’n’Drop in the Graph layout and properties window
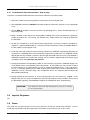
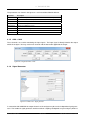
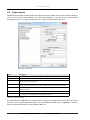
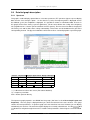
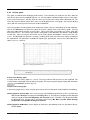
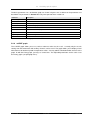
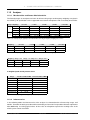
SAMURAI supports the following drag’n’drop operations for facilitating the setup of graphs with a similar
appearance:
Operation
Result
Drag a graph from the tree and drop it over another The graph style is widely copied from one to the
graph.
other graph (colour, pens etc.).
Drag a graph from the tree root and drop it into a A graph is assigned to the selected window.
pane of the Layout preview.
Table 5.2: Drag’n’Drop
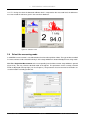
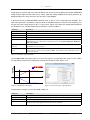
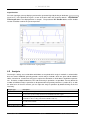
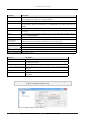
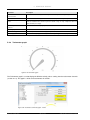
When aiming at a uniform appearance of all graphs, it might be rather time-consuming to set all parameters
for each new graph manually. Therefore, the context menu contains the items Copy Style and Paste Style.
SINUS Messtechnik GmbH
55 of 132
Manual SAMURAI