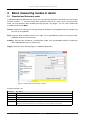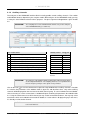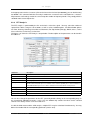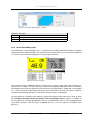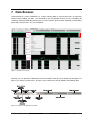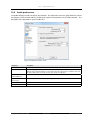
1
Basic Version Manual
Version 2.0
January 6, 2012
c SINUS Messtechnik GmbH
Foepplstrasse 13, 04347 Leipzig, Germany
http://www.soundbook.de/e
[email protected]
c SINUS Messtechnik GmbH
All rights reserved. No part of this manual may be reproduced, stored in a retrieval system or transmitted,
in any form or by any means, electronic, mechanical, photocopying, recording or otherwise, without the prior
written permission of SINUS Messtechnik GmbH. We reserve the right to alter the contents of this manual
without prior notice. SINUS Messtechnik GmbH accepts no responsibility for technical or typographical
errors or deficiencies in this manual. Furthermore, SINUS Messtechnik GmbH disclaims all liability for
damage occurring directly or indirectly as a result of the delivery, performance or usage of this material.
All products or services mentioned in this document are the trademarks or service marks of their respective
companies or organizations.
Manual SAMURAI
2 of 132
SINUS Messtechnik GmbH
CONTENTS
Contents
1 Introduction
1.1 Software installation . . . . . . . . .
1.1.1 SAMURAI installation routine
1.1.2 Licencing the software . . .
1.2 The Programme Surface . . . . . .
1.3 Command Line Switches . . . . . .
.
.
.
.
.
.
.
.
.
.
.
.
.
.
.
.
.
.
.
.
.
.
.
.
.
.
.
.
.
.
.
.
.
.
.
.
.
.
.
.
.
.
.
.
.
.
.
.
.
.
.
.
.
.
.
.
.
.
.
.
.
.
.
.
.
.
.
.
.
.
.
.
.
.
.
.
.
.
.
.
.
.
.
.
.
.
.
.
.
.
.
.
.
.
.
.
.
.
.
.
.
.
.
.
.
.
.
.
.
.
.
.
.
.
.
.
.
.
.
.
.
.
.
.
.
.
.
.
.
.
.
.
.
.
.
.
.
.
.
.
8
8
9
9
10
11
2 Performing a measurement
2.1 Activation of the measurement hardware
2.2 Transducer database . . . . . . . . . .
2.2.1 Additional settings . . . . . . .
2.2.2 Additional units . . . . . . . . .
2.3 Calibration procedure . . . . . . . . . .
2.3.1 Calibration check . . . . . . . .
2.4 Select the measuring mode . . . . . . .
2.5 Preparing a Setup . . . . . . . . . . . .
2.6 Display Measurements . . . . . . . . .
2.7 Dealing with measurement data . . . . .
2.7.1 Replay of Measurements . . . .
2.7.2 Exporting Data . . . . . . . . .
.
.
.
.
.
.
.
.
.
.
.
.
.
.
.
.
.
.
.
.
.
.
.
.
.
.
.
.
.
.
.
.
.
.
.
.
.
.
.
.
.
.
.
.
.
.
.
.
.
.
.
.
.
.
.
.
.
.
.
.
.
.
.
.
.
.
.
.
.
.
.
.
.
.
.
.
.
.
.
.
.
.
.
.
.
.
.
.
.
.
.
.
.
.
.
.
.
.
.
.
.
.
.
.
.
.
.
.
.
.
.
.
.
.
.
.
.
.
.
.
.
.
.
.
.
.
.
.
.
.
.
.
.
.
.
.
.
.
.
.
.
.
.
.
.
.
.
.
.
.
.
.
.
.
.
.
.
.
.
.
.
.
.
.
.
.
.
.
.
.
.
.
.
.
.
.
.
.
.
.
.
.
.
.
.
.
.
.
.
.
.
.
.
.
.
.
.
.
.
.
.
.
.
.
.
.
.
.
.
.
.
.
.
.
.
.
.
.
.
.
.
.
.
.
.
.
.
.
.
.
.
.
.
.
.
.
.
.
.
.
.
.
.
.
.
.
.
.
.
.
.
.
.
.
.
.
.
.
.
.
.
.
.
.
.
.
.
.
.
.
.
.
.
.
.
.
.
.
.
.
.
.
.
.
.
.
.
.
.
.
.
.
.
.
.
.
.
.
.
.
.
.
.
.
.
.
.
.
.
.
.
.
.
.
.
.
.
.
.
.
.
.
.
.
12
13
13
15
16
16
17
18
20
21
23
23
23
3 Basic measuring modes in detail
3.1 Standard and Autostore mode . . . . . . . . . . . . .
3.2 Reverberation time measurements . . . . . . . . . . .
3.2.1 Reverberation time measurement - Step by step
3.3 Impulse Response . . . . . . . . . . . . . . . . . . . .
3.4 Demo . . . . . . . . . . . . . . . . . . . . . . . . . .
.
.
.
.
.
.
.
.
.
.
.
.
.
.
.
.
.
.
.
.
.
.
.
.
.
.
.
.
.
.
.
.
.
.
.
.
.
.
.
.
.
.
.
.
.
.
.
.
.
.
.
.
.
.
.
.
.
.
.
.
.
.
.
.
.
.
.
.
.
.
.
.
.
.
.
.
.
.
.
.
.
.
.
.
.
.
.
.
.
.
.
.
.
.
.
24
24
25
28
28
28
4 The Setup-Tab
4.1 Hardware . . . . . . . . . . . .
4.1.1 Main Channels . . . . .
4.1.2 Auxillary channels . . . .
4.1.3 AUX channels Diff . . . .
4.1.4 Tachometer Channels . .
4.1.5 ADC -> DAC . . . . . .
4.1.6 Signal Generator . . . .
4.2 Analysis . . . . . . . . . . . . .
4.2.1 Signal Analysis . . . . .
4.2.2 1/3 Octave Analysis . . .
4.2.3 FFT Analysis . . . . . .
4.2.4 SLM Analysis . . . . . .
4.3 Store condition . . . . . . . . .
4.3.1 Triggered store condition
4.3.2 Timed store condition . .
4.4 Trigger . . . . . . . . . . . . . .
4.4.1 COM port trigger . . . .
4.4.2 Analyzer trigger . . . . .
4.4.3 Fixed level trigger . . . .
4.4.4 Dynamic level trigger . .
.
.
.
.
.
.
.
.
.
.
.
.
.
.
.
.
.
.
.
.
.
.
.
.
.
.
.
.
.
.
.
.
.
.
.
.
.
.
.
.
.
.
.
.
.
.
.
.
.
.
.
.
.
.
.
.
.
.
.
.
.
.
.
.
.
.
.
.
.
.
.
.
.
.
.
.
.
.
.
.
.
.
.
.
.
.
.
.
.
.
.
.
.
.
.
.
.
.
.
.
.
.
.
.
.
.
.
.
.
.
.
.
.
.
.
.
.
.
.
.
.
.
.
.
.
.
.
.
.
.
.
.
.
.
.
.
.
.
.
.
.
.
.
.
.
.
.
.
.
.
.
.
.
.
.
.
.
.
.
.
.
.
.
.
.
.
.
.
.
.
.
.
.
.
.
.
.
.
.
.
.
.
.
.
.
.
.
.
.
.
.
.
.
.
.
.
.
.
.
.
.
.
.
.
.
.
.
.
.
.
.
.
.
.
.
.
.
.
.
.
.
.
.
.
.
.
.
.
.
.
.
.
.
.
.
.
.
.
.
.
.
.
.
.
.
.
.
.
.
.
.
.
.
.
.
.
.
.
.
.
.
.
.
.
.
.
.
.
.
.
.
.
.
.
.
.
.
.
.
.
.
.
.
.
.
.
.
.
.
.
.
.
.
.
.
.
.
.
.
.
.
.
.
.
.
.
.
.
.
.
.
.
.
.
.
.
.
.
.
.
.
.
.
.
.
.
.
.
.
.
.
.
.
.
.
.
.
.
.
.
.
.
.
.
.
.
.
.
.
.
.
.
.
.
.
.
.
.
.
.
.
.
.
.
.
.
.
.
.
.
.
.
.
.
.
.
.
.
.
.
30
30
30
32
34
34
36
36
38
39
39
41
42
43
44
44
45
45
46
46
47
SINUS Messtechnik GmbH
.
.
.
.
.
.
.
.
.
.
.
.
.
.
.
.
.
.
.
.
.
.
.
.
.
.
.
.
.
.
.
.
.
.
.
.
.
.
.
.
.
.
.
.
.
.
.
.
.
.
.
.
.
.
.
.
.
.
.
.
.
.
.
.
.
.
.
.
.
.
.
.
.
.
.
.
.
.
.
.
.
.
.
.
.
.
.
.
.
.
.
.
.
.
.
.
.
.
.
.
.
.
.
.
.
.
.
.
.
.
.
.
.
.
.
.
.
.
.
.
.
.
.
.
.
.
.
.
.
.
.
.
.
.
.
.
.
.
.
.
.
.
.
.
.
.
.
.
.
.
.
.
.
.
.
.
.
.
.
.
.
.
.
.
.
3 of 132
.
.
.
.
.
.
.
.
.
.
.
.
.
.
.
.
.
.
.
.
.
.
.
.
.
.
.
.
.
.
.
.
.
.
.
.
.
.
.
.
.
.
.
.
.
.
.
.
.
.
.
.
.
.
.
.
.
.
.
.
.
.
.
.
.
.
.
.
.
.
.
.
.
.
.
.
.
.
.
.
Manual SAMURAI
CONTENTS
.
.
.
.
.
.
.
.
.
.
.
.
.
.
.
.
.
.
.
.
.
.
.
.
.
.
.
.
.
.
.
.
.
.
.
.
.
.
.
.
.
.
.
.
.
.
.
.
.
.
.
.
.
.
.
.
.
.
.
.
.
.
.
.
.
.
.
.
.
.
.
.
.
.
.
.
.
.
.
.
.
.
.
.
.
.
.
.
.
.
.
.
.
.
.
.
.
.
.
.
.
.
.
.
.
.
.
.
.
.
.
.
.
.
.
.
.
.
.
.
.
.
.
.
.
.
.
.
.
.
.
.
.
.
.
.
.
.
.
.
.
.
.
.
47
47
48
48
48
49
50
52
53
5 Graphical display
5.1 Panes layout . . . . . . . . . . . . . . . . . . . . . . . . . . .
5.2 Copy graph image . . . . . . . . . . . . . . . . . . . . . . . .
5.3 Level Monitor . . . . . . . . . . . . . . . . . . . . . . . . . .
5.3.1 Drag’n’Drop in the Graph layout and properties window
5.4 Detailed graph description . . . . . . . . . . . . . . . . . . . .
5.4.1 Spectrum . . . . . . . . . . . . . . . . . . . . . . . .
5.4.2 History graph . . . . . . . . . . . . . . . . . . . . . .
5.4.3 Sonogram graph . . . . . . . . . . . . . . . . . . . .
5.4.4 Waterfall graph . . . . . . . . . . . . . . . . . . . . .
5.4.5 Sound Level Meter graph . . . . . . . . . . . . . . . .
5.4.6 Time signal graph . . . . . . . . . . . . . . . . . . . .
5.4.7 Pure tone graph . . . . . . . . . . . . . . . . . . . . .
5.4.8 Tachometer graph . . . . . . . . . . . . . . . . . . . .
5.4.9 vsXREF graph . . . . . . . . . . . . . . . . . . . . .
.
.
.
.
.
.
.
.
.
.
.
.
.
.
.
.
.
.
.
.
.
.
.
.
.
.
.
.
.
.
.
.
.
.
.
.
.
.
.
.
.
.
.
.
.
.
.
.
.
.
.
.
.
.
.
.
.
.
.
.
.
.
.
.
.
.
.
.
.
.
.
.
.
.
.
.
.
.
.
.
.
.
.
.
.
.
.
.
.
.
.
.
.
.
.
.
.
.
.
.
.
.
.
.
.
.
.
.
.
.
.
.
.
.
.
.
.
.
.
.
.
.
.
.
.
.
.
.
.
.
.
.
.
.
.
.
.
.
.
.
.
.
.
.
.
.
.
.
.
.
.
.
.
.
.
.
.
.
.
.
.
.
.
.
.
.
.
.
.
.
.
.
.
.
.
.
.
.
.
.
.
.
.
.
.
.
.
.
.
.
.
.
.
.
.
.
.
.
.
.
.
.
.
.
.
.
.
.
.
.
54
54
54
55
55
57
57
62
63
64
65
68
69
70
71
6 Data storage
6.1 Select working folder . . . . . . . . . . . . .
6.1.1 Search for working folders . . . . . .
6.1.2 Advanced settings for a working folder
6.2 Disk usage . . . . . . . . . . . . . . . . . . .
6.3 Monitoring disk consumption . . . . . . . . .
6.4 SAMURAI data format . . . . . . . . . . . . .
.
.
.
.
.
.
.
.
.
.
.
.
.
.
.
.
.
.
.
.
.
.
.
.
.
.
.
.
.
.
.
.
.
.
.
.
.
.
.
.
.
.
.
.
.
.
.
.
.
.
.
.
.
.
.
.
.
.
.
.
.
.
.
.
.
.
.
.
.
.
.
.
.
.
.
.
.
.
.
.
.
.
.
.
.
.
.
.
.
.
.
.
.
.
.
.
.
.
.
.
.
.
.
.
.
.
.
.
.
.
.
.
.
.
.
.
.
.
.
.
.
.
.
.
.
.
.
.
.
.
.
.
.
.
.
.
.
.
.
.
.
.
.
.
72
73
74
74
75
75
76
7 Data Browser
7.1 Cursor mode . . . . . . . . . . . .
7.2 Recalculate measured values . . .
7.2.1 Recalculate interval values
7.2.2 SLM percentiles . . . . . .
7.2.3 Spectral LN . . . . . . . .
7.2.4 Community noise . . . . .
7.2.5 Report Viewer . . . . . . .
7.3 Color themes in the Data Browser
7.4 Color scale . . . . . . . . . . . .
.
.
.
.
.
.
.
.
.
.
.
.
.
.
.
.
.
.
.
.
.
.
.
.
.
.
.
.
.
.
.
.
.
.
.
.
.
.
.
.
.
.
.
.
.
.
.
.
.
.
.
.
.
.
.
.
.
.
.
.
.
.
.
.
.
.
.
.
.
.
.
.
.
.
.
.
.
.
.
.
.
.
.
.
.
.
.
.
.
.
.
.
.
.
.
.
.
.
.
.
.
.
.
.
.
.
.
.
.
.
.
.
.
.
.
.
.
.
.
.
.
.
.
.
.
.
.
.
.
.
.
.
.
.
.
.
.
.
.
.
.
.
.
.
.
.
.
.
.
.
.
.
.
.
.
.
.
.
.
.
.
.
.
.
.
.
.
.
.
.
.
.
.
.
.
.
.
.
.
.
.
.
.
.
.
.
.
.
.
.
.
.
.
.
.
.
.
.
.
.
.
.
.
.
.
.
.
.
.
.
.
.
.
.
.
.
.
.
.
.
.
.
.
.
.
.
.
.
.
.
.
.
.
.
.
.
.
.
.
.
.
.
.
.
.
.
.
.
.
.
.
.
.
.
.
.
.
.
.
.
.
.
.
.
.
.
.
.
.
.
79
81
81
81
82
82
83
83
83
83
8 Export
8.1 Export to NWWin . .
8.2 Export to Excel . . .
8.3 The automatic export
8.4 Export to Text file . .
8.5 Export to WAV . . . .
.
.
.
.
.
.
.
.
.
.
.
.
.
.
.
.
.
.
.
.
.
.
.
.
.
.
.
.
.
.
.
.
.
.
.
.
.
.
.
.
.
.
.
.
.
.
.
.
.
.
.
.
.
.
.
.
.
.
.
.
.
.
.
.
.
.
.
.
.
.
.
.
.
.
.
.
.
.
.
.
.
.
.
.
.
.
.
.
.
.
.
.
.
.
.
.
.
.
.
.
.
.
.
.
.
.
.
.
.
.
.
.
.
.
.
.
.
.
.
.
.
.
.
.
.
.
.
.
.
.
.
.
.
.
.
.
.
.
.
.
.
.
.
.
.
.
.
.
.
.
84
84
85
86
87
87
4.5
4.6
4.7
4.4.5 Keyboard trigger . . . . .
4.4.6 Time trigger . . . . . . . .
4.4.7 Compound trigger . . . . .
4.4.8 Edge mode level trigger . .
4.4.9 Range level trigger . . . .
4.4.10 Reference spectrum trigger
Output events . . . . . . . . . . .
Markers . . . . . . . . . . . . . .
Default pens . . . . . . . . . . . .
Manual SAMURAI
.
.
.
.
.
.
.
.
.
.
.
.
.
.
.
.
.
.
.
.
.
.
.
.
.
.
.
.
.
.
.
.
.
.
.
.
.
.
.
.
.
.
.
.
.
.
.
.
.
.
.
.
.
.
.
.
.
.
.
.
.
.
.
.
.
.
.
.
.
.
.
.
.
.
.
.
.
.
.
.
.
.
.
.
.
.
.
.
.
.
.
.
.
.
.
.
.
.
4 of 132
.
.
.
.
.
.
.
.
.
.
.
.
.
.
.
.
.
.
.
.
.
.
.
.
.
.
.
.
.
.
.
.
.
.
.
.
.
.
.
.
.
.
.
.
.
.
.
.
.
.
.
.
.
.
.
.
.
.
.
.
.
.
.
SINUS Messtechnik GmbH
CONTENTS
8.6
8.7
8.8
Export to Windows Media Movie .
Export to Quicktime Movie . . . .
Create movie as Multimedia Report
8.8.1 Create movie . . . . . . .
8.9 Export to UFF . . . . . . . . . . .
8.10 Export to si++ . . . . . . . . . . .
.
.
.
.
.
.
.
.
.
.
.
.
.
.
.
.
.
.
.
.
.
.
.
.
.
.
.
.
.
.
.
.
.
.
.
.
.
.
.
.
.
.
.
.
.
.
.
.
.
.
.
.
.
.
.
.
.
.
.
.
.
.
.
.
.
.
.
.
.
.
.
.
.
.
.
.
.
.
.
.
.
.
.
.
.
.
.
.
.
.
9 Special Functionality
9.1 Power Management . . . . . . . . . . . . . . . . . . . . . . .
9.1.1 Sleep mode . . . . . . . . . . . . . . . . . . . . . . .
9.1.2 Stop on battery low . . . . . . . . . . . . . . . . . . .
9.2 Easy Operator Mode . . . . . . . . . . . . . . . . . . . . . .
9.2.1 Create Easy Operator link . . . . . . . . . . . . . . .
9.2.2 Advanced options for the Easy Operator Mode . . . . .
9.2.3 Operation in the Easy Operator Mode . . . . . . . . .
9.2.4 The Easy Operator Mode in conjunction with auto start
9.3 Reference Spectra . . . . . . . . . . . . . . . . . . . . . . . .
9.3.1 Creating a reference spectrum . . . . . . . . . . . . .
9.3.2 Editing a reference spectrum . . . . . . . . . . . . . .
9.4 Description of the toolbars . . . . . . . . . . . . . . . . . . . .
9.4.1 Main toolbar . . . . . . . . . . . . . . . . . . . . . . .
9.4.2 Run toolbar . . . . . . . . . . . . . . . . . . . . . . .
9.4.3 Replay toolbar . . . . . . . . . . . . . . . . . . . . . .
9.4.4 Control toolbar . . . . . . . . . . . . . . . . . . . . .
9.4.5 Global Trigger Indicator . . . . . . . . . . . . . . . . .
9.4.6 Status bar . . . . . . . . . . . . . . . . . . . . . . . .
9.5 Range modes . . . . . . . . . . . . . . . . . . . . . . . . . .
9.6 Application modes . . . . . . . . . . . . . . . . . . . . . . . .
9.7 Numeric keypad . . . . . . . . . . . . . . . . . . . . . . . . .
9.8 Audio Comment . . . . . . . . . . . . . . . . . . . . . . . . .
9.9 Back Erase . . . . . . . . . . . . . . . . . . . . . . . . . . .
10 Preferences
10.1 General . . . . . . . . . . .
10.2 User Interface preferences .
10.3 Measurement preferences .
10.4 Analysis . . . . . . . . . . .
10.5 Graphical display preferences
10.6 Audio preferences . . . . . .
10.7 Colors preferences . . . . .
10.8 Miscellaneous preferences .
10.9 Sound Intensity preferences .
10.10 Messages preferences . . .
10.11 Post Processing preferences
10.12 SINUS driver preferences . .
.
.
.
.
.
.
.
.
.
.
.
.
.
.
.
.
.
.
.
.
.
.
.
.
.
.
.
.
.
.
.
.
.
.
.
.
.
.
.
.
.
.
.
.
.
.
.
.
.
.
.
.
.
.
.
.
.
.
.
.
.
.
.
.
.
.
.
.
.
.
.
.
.
.
.
.
.
.
.
.
.
.
.
.
.
.
.
.
.
.
.
.
.
.
.
.
.
.
.
.
.
.
.
.
.
.
.
.
.
.
.
.
.
.
.
.
.
.
.
.
.
.
.
.
.
.
.
.
.
.
.
.
.
.
.
.
.
.
.
.
.
.
.
.
.
.
.
.
.
.
.
.
.
.
.
.
.
.
.
.
.
.
.
.
.
.
.
.
.
.
.
.
.
.
.
.
.
.
.
.
.
.
.
.
.
.
.
.
.
.
.
.
.
.
.
.
.
.
.
.
.
.
.
.
.
.
.
.
.
.
.
.
.
.
.
.
.
.
.
.
.
.
.
.
.
.
.
.
.
.
.
.
.
.
.
.
.
.
.
.
.
.
.
.
.
.
.
.
.
.
.
.
.
.
.
.
.
.
.
.
.
.
.
.
.
.
.
.
.
.
.
.
.
.
.
.
.
.
.
.
.
.
.
.
.
.
.
.
.
.
.
.
.
.
.
.
.
.
.
.
.
.
.
.
.
.
.
.
.
.
.
.
.
.
.
.
.
.
.
.
.
.
.
.
.
.
.
.
.
.
.
.
.
.
.
.
.
.
.
.
.
.
.
.
.
.
.
.
.
.
.
.
.
.
.
.
.
.
.
.
.
.
.
.
.
.
.
.
.
.
.
.
.
.
.
.
.
.
.
.
.
.
.
.
.
.
.
.
.
.
.
.
.
.
.
.
.
.
.
.
.
.
.
.
.
.
.
.
.
.
.
.
.
.
.
.
.
.
.
.
.
.
.
.
.
.
.
.
.
.
.
.
.
.
.
.
.
.
.
.
.
.
.
.
.
.
.
.
.
.
.
.
.
.
.
.
.
.
.
.
.
.
11 Sound level meter Soundbook + SAMURAI
11.1 Technical specifications . . . . . . . . . . . . . . . . . . . . . . . . . . .
11.1.1 Specifications Soundbook MK2 + SAMURAI as sound level meter
11.1.2 Specifications Soundbook MK1 + SAMURAI as sound level meter
11.1.3 Specifications Soundbook octav + SAMURAI as sound level meter
SINUS Messtechnik GmbH
5 of 132
.
.
.
.
.
.
.
.
.
.
.
.
.
.
.
.
.
.
.
.
.
.
.
.
.
.
.
.
.
.
.
.
.
.
.
.
.
.
.
.
.
.
.
.
.
.
.
.
.
.
.
.
.
.
.
.
.
.
.
.
.
.
.
.
.
.
.
.
.
.
.
.
.
.
.
.
.
.
.
.
.
.
.
.
.
.
.
.
.
.
.
.
.
.
.
.
.
.
.
.
.
.
.
.
.
.
.
.
.
.
.
.
.
.
.
.
.
.
.
.
.
.
.
.
.
.
.
.
.
.
.
.
.
.
.
.
.
.
.
.
.
.
.
.
.
.
.
.
.
.
.
.
.
.
.
.
.
.
.
.
.
.
.
.
.
.
.
.
.
.
.
.
.
.
.
.
.
.
.
.
.
.
.
.
.
.
.
.
.
.
.
.
.
.
.
.
.
.
.
.
.
.
.
.
.
.
.
.
.
.
.
.
.
.
.
.
.
.
.
.
.
.
.
.
.
.
.
.
.
.
.
.
.
.
.
.
.
.
.
.
.
.
.
.
.
.
.
.
.
.
.
.
.
.
.
.
.
.
.
.
.
.
.
.
.
.
.
.
.
.
.
.
.
.
.
.
.
.
.
.
.
.
.
.
.
.
.
.
.
.
.
.
.
.
.
.
.
.
.
.
.
.
.
.
.
.
.
.
.
.
.
.
.
.
.
.
.
.
.
.
.
.
.
.
.
.
.
.
.
.
.
.
.
.
.
.
.
.
.
.
.
.
.
.
.
.
.
.
.
.
.
.
.
.
.
.
.
.
.
.
.
.
.
.
.
.
87
88
88
88
89
89
.
.
.
.
.
.
.
.
.
.
.
.
.
.
.
.
.
.
.
.
.
.
.
90
90
90
90
90
91
92
92
93
93
93
94
96
96
97
97
98
98
98
99
99
100
100
101
.
.
.
.
.
.
.
.
.
.
.
.
102
102
103
104
105
106
107
108
109
110
110
111
112
.
.
.
.
113
113
113
115
117
Manual SAMURAI
CONTENTS
11.2 Centre frequencies of fractional octaves . . . . . . . . . . . .
11.3 Analyzer . . . . . . . . . . . . . . . . . . . . . . . . . . . . .
11.3.1 Messbereiche und lineare Arbeitsbereiche . . . . . . .
11.3.2 Inherent noise . . . . . . . . . . . . . . . . . . . . . .
11.3.3 Frequency response of the analyzer . . . . . . . . . .
11.3.4 Frequency weightings . . . . . . . . . . . . . . . . . .
11.3.5 Measuring crosstalk . . . . . . . . . . . . . . . . . . .
11.3.6 EMC specifications . . . . . . . . . . . . . . . . . . .
11.3.7 Mains frequency and high frequency fields . . . . . . .
11.3.8 Mechanical vibrations . . . . . . . . . . . . . . . . . .
11.3.9 Microphone setup . . . . . . . . . . . . . . . . . . . .
11.3.10 Effect of the accessories in the measuring microphones
11.3.11 Connectors and pin assignments of Soundbook MK2 .
11.3.12 Connector assignment of Soundbook MK1 . . . . . . .
11.4 Specifications according to DIN EN 61672-1:2003 . . . . . . .
INDEX
Manual SAMURAI
.
.
.
.
.
.
.
.
.
.
.
.
.
.
.
.
.
.
.
.
.
.
.
.
.
.
.
.
.
.
.
.
.
.
.
.
.
.
.
.
.
.
.
.
.
.
.
.
.
.
.
.
.
.
.
.
.
.
.
.
.
.
.
.
.
.
.
.
.
.
.
.
.
.
.
.
.
.
.
.
.
.
.
.
.
.
.
.
.
.
.
.
.
.
.
.
.
.
.
.
.
.
.
.
.
.
.
.
.
.
.
.
.
.
.
.
.
.
.
.
.
.
.
.
.
.
.
.
.
.
.
.
.
.
.
.
.
.
.
.
.
.
.
.
.
.
.
.
.
.
.
.
.
.
.
.
.
.
.
.
.
.
.
.
.
.
.
.
.
.
.
.
.
.
.
.
.
.
.
.
.
.
.
.
.
.
.
.
.
.
.
.
.
.
.
.
.
.
.
.
.
.
.
.
.
.
.
.
.
.
.
.
.
.
.
.
.
.
.
.
.
.
.
.
.
119
122
122
122
123
123
124
124
125
126
126
126
127
128
129
130
6 of 132
SINUS Messtechnik GmbH
CONTENTS
Preface
Please read this manual carefully before using the software and the analyzer. The manual includes the
following signs to indicate important information:
NOTICE!
CAUTION!
ATTENTION!
These are information on the efficient use and correct handling of the analyzer as well as additional information.
These instructions shall avoid any hardware damages or dangers for
users.
These instructions shall avoid any measurement mistakes, hardware damages etc.
There are several SAMURAI options extending the range of use remarkably. These options are collocated
in table 1.1 and specified in a separate manual.
SINUS Messtechnik GmbH
7 of 132
Manual SAMURAI
1
1
INTRODUCTION
Introduction
SAMURAITM is a Windows programme implementing measurement and analysis functions for the analyzers
Soundbook Mk I and Mk II, the boxes APOLLOTM and HARMONIETM as well as the multichannel analyzer
MSX16 produced by SINUS Messtechnik GmbH. The current version 2.0 of SAMURAI is targeted to perform
environmental acoustic and vibration measurements. SAMURAI is extremely flexible and easy to use.
SAMURAI offers various extension options. These options are specified in a separate manual and collocated
in the following table 1.1.
Option
Description
Colour
HVMA
Human Vibration Multi Analysis according to ISO 8041, NS 8176, ISO 2631 and
ISO 5349
HVMA
Option
Automation
Control of external processes (via RS232, external executable programme)
Automation
Option
Passby
Measures noise of passing vehicles
Passby
NoiseCam
Recording video data with an USB WebCam
NoiseCAM
Vibration Meter
Measurement of vibrations according to DIN 45666, ISO 10816, ISO 7919 and
ISO 2954
Vibration
Meter
Signal Generator
Extension of the basic signal generator (white and pink noise) by adding various
other signal types
Signalgenerator
Fractional Octaves
Calculation and representation of 1/3, 1/6, 1/12 and 1/24 octaves
fractional
Octaves
TCP Server
TCP connection to external programmes (e.g. SAMBA, remoteSAMURAI)
TCP
Server
FRF / Cross Analysis
Measurement of transfer functions, auto correlations etc.
FRF
Option
Order Analysis
Measurement and representation of order spectra
Orderanalysis
Building Acoustics
Measurements according to ISO 140-4; ISO 140-5; ISO 140-7/8. This option also
requires the TCP Server option.
Buildingacoustic
SAMURAI Sound Intensity
Sound intensity/power measurements according to ISO 9614-1 and ISO 9614-2.
Soundintensity 1
Building Vibration
Measurement of structural vibrations in buildings according to DIN 4150-2 and
DIN 4150-3.
Buildingvibration
Sound Intensity Map
Creation of sound intensity maps of objects
Sound
Intensity Map
Post Processing
Post processing of audio data for calculating values
Post
Processing
Tone Assessment
Assessment of pure tones according to ISO 1996-2
Toneassessment
Room Acoustics
Measurement of acoustical parameters of a room as: RASTI, STI, STIPA, STITEL,
EDT, Clarity etc.
Roomacoustic
SAMURAI Sound Power
Sound power measurements according to ISO 3744, ISO 3745 and ISO 3746.
Soundpower
Weatherstation
Weatherstations by Reinhard or Vaisala are supported
Weatherstation
remoteSAMURAI
TCP client for remote control and monitoring of SAMURAI. This option also requires the TCP Server option.
remoteSAMURAI
Table 1.1: List of options
1.1
Software installation
If you have purchased a Soundbook system, the software is already installed. If you are using the HARMONIE system or an APOLLO-Box, install the current SINUS driver (see installation instruction of the driver)
before installing SAMURAI as head administrator.
To install simply insert the CD with the software into your CD ROM drive. The setup programme starts
automatically. If it does not run automatically, start SAMURAI-setup-2.0.x-xxx.exe on your CD manually using the Windows Explorer. Follow the instructions of the SETUP programme until the installation is
completed.
Manual SAMURAI
8 of 132
SINUS Messtechnik GmbH
1.1
1.1.1
Software installation
SAMURAI installation routine
The SAMURAI installation routine is similar to the installation routines of other Windows applications. Follow
the instructions given below:
1. Insert the installation CD. If the installation programme does not run automatically, run it manually
(<CD drive>:\Install\SAMURAI-setup-2.0.x-xxx.exe).
2. Select a language for the installation. The selected language will also be the default language of
SAMURAI.
NOTICE!
The language may be changed in the programme setup at any time.
3. Read the licence agreement!
4. Select the installation directory.
5. In the next step select the components for installation.
6. Now select the directory in the Windows Start menu to which all SAMURAI links shall be installed.
7. Choose whether you want to establish a link on the Windows desktop and/or on the Windows quick
start bar.
8. In the next window your selected settings are displayed. To install SAMURAI click on Install now.
NOTICE!
If a transducer database already exists within the selected installation directory, you have to decide whether the database should be replaced or
not.
9. Finally, a message will be displayed confirming the successful installation of SAMURAI.
ATTENTION!
1.1.2
If installing a new SAMURAI, a licence key with limited validity (60 days)
is installed to the system once. This period is granted only once per computer!
Licencing the software
Parallely to SAMURAI the SINUS Licence Manager is installed. It is a system tool for managing the licences
of SINUS Messtechnik GmbH. The tool automatically starts at system start and provides the licences for the
individual software packages.
The actual management is done by the SINUS Licence Administrator, which will also be installed. The
administrator is a small application with a separate graphical interface which lists the installed licences in a
table.
Start the programme via: <Start>\Programs\SINUS\Tools\SINUS Licence Administrator. If you
minimize the application window or click on the cross in the upper right corner of the window, the application
is minimized to the Windows system area, not to the taskbar! This state is saved and restored at the next
application start. If you open the application using the link in the Windows start menu, it may thus occur that
the application window will not open. Please pay attention to the corresponding icon ( ) in the Windows
system area in this case.
SINUS Messtechnik GmbH
9 of 132
Manual SAMURAI
1
INTRODUCTION
The licences are sent as *.lic file attached to an e-mail or are already located on the installation medium.
To install a licence file to the system, open the Licence Administrator and copy (drag and drop) the *.lic file
from the Windows Explorer to the table of the Licence Administrator. You may also use the item File->Install
Licence in the main menu. To delete a licence right click on the one you want to remove from the table
and select Remove Licence. To save licences select them from the table. Right click on the selected table
entries and select Export Licence.
1.2
The Programme Surface
SAMURAI’s window layout is similar to many other Windows applications (figure 1.1). It contains a menubar,
a toolbar, a section for the graphical display and a status bar. A short description of the most important
elements of the main application window follows (table 1.2).
Figure 1.1: Main application window
Element
Description
Window title
The window title contains the application name as well as additional information. Depending on the
application status, the following information may follow the application name SAMURAI (from left to
right): programme version, name of the active setup, name of the current measurement, current analyzer
mode (Start, Stop, Replay, Play).
Main menu
The File menu contains items to save or load a setup, to exit the application etc. The Measurement
menu contains items to change the measurement setup, to start/stop a measurement, to export data etc.
The Analyzer menu contains items to connect to the hardware, to adjust the input gain for all channels,
to check the calibration values, to set the AUX pin assignment etc. The File menu contains items to
open the transducer database, to manually calibrate the transducers, to open the dialogue for general
preferences etc. The File menu contains items to open dialogues to adjust the application appearance.
Manual SAMURAI
10 of 132
SINUS Messtechnik GmbH
1.3
Command Line Switches
Element
Description
Toolbars
The toolbars may be moved and docked (at the top or bottom) as usual. The main toolbar is always
displayed and contains buttons for the following operations: connect the analyzer, create a new measurement, set and change the graphical display. The run toolbar is only displayed in the Record mode
and contains the buttons Start, Stop, Pause and Audio comment depending on the analyzer state.
The replay toolbar is only displayed in the Replay mode and contains the buttons PLAY , Stop , Pause ,
Search , Audio comment and a selection box for the replay speed. A further toolbar contains the start
and record time, the overload and underrange indicator and the marker buttons.
Setup window
A tree structure in which the current setup for e.g. the analyzer and the data analysis is displayed and
may be changed.
Measure/Replay
window
The Measure window is used for display during a measurement. In Replay mode the Replay window
displays the already recorded and recalled measurements. Both windows can be divided into several
sections (up to 4 rows and 4 columns).
Data Browser
Overview over the data of the current measurement in Replay mode.
Status window
Display the current measurement’s status.
Log window
Display of relevant messages on the current measurement.
Browser window
List of the measurements which were created with SAMURAI and are stored in the current working
directory. You may find detailed information on the individual measurements using for example the main
menu (View -> View Browser -> View -> Details).
Status bar
Display of additional information when measuring or replaying (serial number of the analyzer, RPM
values, record mode, power supply etc.). When replaying a slider bar indicating the replay progress is
displayed additionally.
Table 1.2: Main application window
1.3
Command Line Switches
To start SAMURAI via the Windows command prompt or to manually adjust shortcuts to SAMURAI the
following command line switches are provided.
/O
Start SAMURAI in the “Easy Operator” mode (section 9.2). See below for specific command line switches
in this mode.
/NODATA Disable the storage of data ignoring all other settings.
/H
Hide the SAMURAI GUI. (Useful in connection with TCP clients.)
/F
Freeze the displayed graph (no updates). (Helpful in longterm monitoring to save processing time. Since
some computers (e.g. Soundbook) adjust the CPU clock rate dynamically this may also achieve energy
saving.
/S
Hide Connection window.
/R
Run the measurement automatically.
Command line switches for the „Easy Operator” mode
/I
Do not display window containing the name and description of the measurement.
/C
Ignore calibration check
/G
Switch off the window for adjusting gain
/W="directory " Determines (directory ) as working directory independent from settings in the programme surface.
SINUS Messtechnik GmbH
11 of 132
Manual SAMURAI
2
2
PERFORMING A MEASUREMENT
Performing a measurement
At first the connection between SAMURAI and the referring hardware of the measurement has to be enabled
by clicking the “Connect/Disconnect"-button . If multiple devices are connected to the PC, a dialogue
appears in which the devices can be selected (figure 2.1). The elements are described in table 2.1.
Figure 2.1: Setup of multiple devices
Parameter
Description
Device
Index of the detected hardware
Description
Short description of the device
Synchronization
Shows whether the device may be synchronized.
Hardware synchroniza- If this checkbox is checked, the hardware synchronization will be used.
tion
Master
Select the device index of the master device (synchronization to the clock of the selected device).
Use this configuration
as default
SAMURAI stores the selected configuration. When opened the next time, these settings will be restored.
Do not show this window The settings will be stored and when connecting to the analyzer next time they will be restored and
anymore
used without opening the dialogue window. You can still open the window by pressing the Ctrl key
when clicking on .
Table 2.1: Configuration of multiple devices
Version 2.0 of SAMURAI for the first time supports the synchronous recording of several instruments. PCI
devices of the HARMONIE family may only be synchronized via wire connection; other device versions via
GPS unit also. All devices of the APOLLO family may be synchronized using a synchronization cable or a
GPS unit. The synchronization via wire connection may be used for measurements in which the devices are
located in the same place. The synchronization via GPS unit may be used for devices which are located in
different places or if at least one device is moving (e. g. in a vehicle).
The synchronization accuracy via GPS is ±4µs for Soundbook MK1 and ±200ns for Soundbook MK2. The
synchronization accuracy via wire connection for devices of the APOLLO family is ±20 ns.
Manual SAMURAI
12 of 132
SINUS Messtechnik GmbH
2.1
2.1
Activation of the measurement hardware
Activation of the measurement hardware
Having been attached to the hardware the corresponding channels of the analyzers must be enabled under
Hardware in the Setup-Tab. The available settings may vary according to the device type and the installed
options (e.g. the number of channels or available couplings). The items under Hardware are described
briefly in the following table 2.2. A detailed description is given in section 4.1.
Items
Description
Main channels
This group contains the active main channels. The entries on the first level show the channel and the
selected transducer. You may change the hardware and transducer settings using the context menu or by
double-clicking on the icon (
).
Aux channels (Diff) Only the active auxiliary channels are listed (1st level). Similar to the main channels, you may view their
settings on the second level. Aux channels Diff are only available for the analyzers of the APOLLO family.
Tachometer
channels
Only two tachometer inputs are available at the analyzer. You may set the tachometer channels using the
context menu.
Temperature
This channel is used for recording the analyzer temperature. This is important in longterm monitoring stations with high ambient temperatures.
Power supply
This channel is used for recording the voltage of the internal power supply. This is important in longterm
monitoring stations which are powered with rechargeables or solar cells.
ADC -> DAC
By enabling these channels you may monitor the input signals.
Signal Generator
This group is containing up to four signal generators, which use the audio outputs of the Soundbook,
APOLLO or HARMONIE.
NoiseCAM
This icon is only available with the NoiseCAM option. You may open a window for setting the WebCam.
When using the Sound Intensity Map option, you may set the representation and the scanning parameters
of the map as well as the automatic path detection. The icon is only available if a WebCam driver is installed!
Weather Data
You may adjust the settings for the acquisition of weather data using this item. It is only available with the
weatherstation option.
Table 2.2: 1st level items - Hardware
2.2
Transducer database
Before measuring the transducers for a measurement must be included or entered in/to the transducer
database of SAMURAI. Transducers transform a physical quantity into an electrical signal which is measured
by the analyzer. SAMURAI divides transducers into types according to the physical quantity to be measured.
SAMURAI currently supports the following transducer types:
Type
Physical quantity
Unit
Microphone
Sound pressure
Pa
Accelerometer Vibration acceleration m/s2
Voltmeter
Electrical voltage
V
Velocity
Vibration velocity
m/s
Tachometer
Rotational speed
RPM or Hz
Force
Force
N
Thermometer
Temperature
K or ◦ C
Hygrometer
Relative humidity
%
Displacement
Displacement
m
Pressure
Pressure
N/m2
Torque
Torque
Nm
Intensity probe Sound intensity
Pa
Table 2.3: Supported transducers
SINUS Messtechnik GmbH
13 of 132
Manual SAMURAI
2
PERFORMING A MEASUREMENT
SAMURAI handles the transducer data in a transducer database. Files for each type TRNDC*.datx are
created in the directory <SAMURAI_Inst_Pfad>\SHSetup.
ATTENTION!
This data must not be deleted, otherwise the transducer database will be
corrupted.
The transducer database contains all transducer data relevant for the measurements and all other operations
(identification, sensitivity, calibration history, etc.).
NOTICE!
The transducer database contains a default transducer for each transducer
type which cannot be deleted.
The transducer database is accessed via the main menu Tools -> Transducer Database. The window
opened is divided into two parts (see figure 2.2). In the upper part you can select the transducer type and
the current transducer. This part also contains buttons to import transducer data or to export all transducer
data of one transducer type (f.e. export data of all microphones from the transducer database). If individual
transducers are used with several devices, this feature allows you to adopt the transducer data of one
device for another. The lower part displays the data for the corresponding transducer and contains, for
example, buttons to create or delete a transducer entry. The functions of the individual elements in the
window “Transducer Database” are described in the following table 2.4.
Figure 2.2: Transducer Database window
Figure 2.3: Additional settings window
Element
Description
Transducer type
Select transducer type (see table 2.3).
Current transducer
Name of the current transducer displayed in the lower part of the window.
Import
Import data of one transducer or of a whole transducer database.
Export all
Export all transducer data of the currently selected transducer type to a XML file.
Additional settings
Open a window containing additional settings for the current transducer type (section 2.2.1).
Name
Each transducer responds to its type and name. Therefore you may only assign an individual
transducer name once for a type.
Manual SAMURAI
14 of 132
SINUS Messtechnik GmbH
2.2
Transducer database
Element
Description
Manufacturer
The name of the manufacturer (optional).
Model
The name of the model (optional).
Serial number
The serial number of the transducer (optional).
Power Supply
Choose between: none, 200 V or ICP.
Current sensitivity
The transducer sensitivity entered manually or by the programme as a result of a calibration.
(A) Noise Floor
Correction
Level of the noise floor for the current transducer. Select 0 to disable this feature. This field is only
available for microphones.
Current offset
Physical value at 0 V input voltage. This value is not available for microphones.
dB reference
Reference value for the conversion of physical units to decibels.
Calibrate every n days
Interval (in days) before recalibration of a transducer is required. When running, the programme
checks whether one of the used transducers must be recalibrated.
Last calibration date
The date and time of the last calibration (read only).
Next calibration date
The date of the next required calibration (read only).
Comments
Optional notes/comments on the current transducer.
New [Transducer type]
Create a new transducer of the current transducer type. The current transducer is used as template;
all its data (except the name) are applied to the new transducer and may be modified.
Delete current
Delete current transducer.
Export current
Export transducer data of the current transducer to a file.
Random incidence correc- This button is only available for the microphones. Clicking on it opens an window in which the
tion
correction values may be entered (see Fig. 2.4).
Apply
Save and apply all changes to the current transducer.
Display history
Display a list of all calibration runs for the selected transducer.
Export history
Export calibration history of the selected transducer to an Excel file.
Close
Close the window.
Table 2.4: Transducer Database window
Figure 2.4: Entry of Random Incidence correction values for microphones
2.2.1
Additional settings
The window shown in figure 2.3 contains additional settings for the currently selected transducer type. The
settings are described in the following table 2.5 .
Element
Description
Additional units
Basic unit
Basic unit for the currently selected transducer type.
Name,Factor
List of additional units created for this transducer type and the conversion factor to the basic unit.
Add. . .
Open window for adding a new unit.
Edit . . .
Open window to edit the currently selected additional unit.
SINUS Messtechnik GmbH
15 of 132
Manual SAMURAI
2
PERFORMING A MEASUREMENT
Element
Description
Remove. . .
Delete an additional unit.
Displayed sensitivity unit
Voltage unit
Select in the corresponding box whether the voltage for the transducer sensitivity is displayed in mV
or V .
Physical unit
Select the physical unit to be used to display the transducer sensitivity.
Calibration check
Tolerance
During a calibration check, this value is considered the maximum permissible deviation of the measured sensitivity from the given sensitivity. It is the same for all transducers of one type!
Table 2.5: Window Additional settings
2.2.2
Additional units
To each transducer type at least one physical unit is assigned (table 2.3). The recorded data are stored in
the basic unit assigned to a transducer and generally also displayed in this unit. In certain cases it is useful to
store or display the data in a user-defined unit (e.g. for an accelerometer: m/s2 , mm/s2 , in/s2 , g). Therefore
it is possible to assign more than one additional unit to a transducer type. Except of the thermometer for
which you may only choose between Degrees Celsius and Degrees Fahrenheit.
To define additional units for a transducer type click on Additional settings... in the window of the transducer
database (figure 2.2). Figure 2.5 shows the window in which the units may be defined or edited. These units
may be selected for the individual graphs in the window Graph layout and properties (figure 2.12).
Figure 2.5: Edit additional units
The conversion factor is used for checking the calibration data for the selected transducer during the calibration check (section 2.3.1).
2.3
Calibration procedure
The calibration procedure is used to verify the sensitivity of a transducer. The transducer is excited with a
known reference signal (for example a pistonphone for microphones). To calibrate a transducer it must be
selected for one of the analyzer channels in the Setup window first. You can open the calibration window
via the Setup window context menu or the main menu (Tools -> Transducer Calibration). Calibrate the
transducer using the procedure below:
• Select the channel/transducer pair in the first line. The lines 2-4 contain information from the transducer database.
• Enter the reference signal level in dB or in the physical unit.
• Connect the calibrator to the transducer; click on
Manual SAMURAI
Start calibration
16 of 132
.
SINUS Messtechnik GmbH
2.3
Calibration procedure
• SAMURAI determines and applies both the frequency and the level of the calibrator signal and displays
the values. If the reference signal at the transducer has been stable for five seconds (after a queueing
time of 5 seconds), the new sensitivity of the transducer is determined, displayed and can be stored
to the database. You may accept or reject the new calibration value in a separate dialogue box (see
figure 2.8). The calibration procedure has been completed and you may perform further calibrations.
It is possible to stop the calibration at any time.
ATTENTION!
SAMURAI can only calibrate transducers at the main channels. You must
enter the sensitivity of the transducers at the auxiliary channels manually
(see paragraph 2.2).
Figure 2.7: Bad calibration warning
Figure 2.6: Transducer calibration process
2.3.1
Figure 2.8: Confirm the new sensitivity
Calibration check
The calibration check verifies whether connected transducers are working correctly according to the values
stored in the database. Start the calibration check by selecting Analyzer -> Check Calibration in main
menu. The check is started automatically after the window has been opened. SAMURAI checks for reference
signals at the enabled main channels. If a signal is detected at one of the channels, the calibration check for
the corresponding transducer starts. Thus, you may mount the calibrator to the microphones at the individual
channels one after the other. SAMURAI will then automatically check the microphones in the corresponding
sequence.
ATTENTION!
Please note that the sensitivity of the transducers is only checked and not
applied or stored to the transducer database. The measured sensitivity is,
however, stored to the calibration history of the corresponding transducer.
Before performing a calibration check you have to enable the SLM analysis
in the Setup window for the current measurement.
In figure 2.9 two channels connected to microphones are enabled. The calibrator in the example uses
a reference signal of 94 dB at 1 kHz . The window displays the state and level (in third octaves) of all
measuring channels on the left. On the right the data of the current calibration check are displayed: channel
number, third-octave level in a diagram, frequency of the reference signal and current level at the reference
frequency. For microphones SAMURAI automatically detects calibrator reference levels of 94, 104, 114 and
SINUS Messtechnik GmbH
17 of 132
Manual SAMURAI
2
PERFORMING A MEASUREMENT
124 dB . During the check the detected calibrator level is compared to the measured level; the difference
must not exceed the tolerance given in the transducer database.
Figure 2.9: Calibration check
2.4
Select the measuring mode
In SAMURAI a measurement is considered to be a time-based acquisition of data. The type of data recorded
in a measurement can be selected via Analysis in the Setup window or is determined by the measuring mode.
With File > Begin New Measurement or the corresponding icon the Measurement Setup window is opened
(figure 2.10). You may select the desired mode at the top-left. The parameters for the currently selected
mode are displayed at the top-right (see also chapter 3). The parameters that are common for all modes are
set at the bottom according to table 2.8.
Figure 2.10: Measurement setup window
Manual SAMURAI
18 of 132
SINUS Messtechnik GmbH
2.4
Select the measuring mode
An Outline over the measuring modes that are available in the basic version of SAMURAI or as options is
given in the tables 2.6 and 2.7. The optional modes are only displayed, if the option is included in the licence.
Mode
Description
Default
This is a general-purpose mode. The final values of the data measured between Run and the Stop command
are stored (f.e. level, spectra). No time history is stored in this mode.
Autostore
Similar to the Standard mode this mode is used for general measurements, but additionally the time history
data are stored. It is controlled manually (RUN- or STOP button), timed or triggered. Starting with SAMURAI
2.0 this mode replaces the modes “Autostore”, “Split Autostore”, “Event” and “Block”.
Reverberation
time
This mode is a standard SAMURAI feature which is used for reverberation time measurements complying
with EN ISO 3382:1997.
Room acoustics
Calculation of the acoustical parameters of a room (STI, STITEL, STIPA . . . )
Demo
No time history is stored to the hard disk in this mode. It is provided for demonstration purposes only. Further
application fields are f.e.: creation of setups, training, demonstrations etc.
Table 2.6: Basic measurement modes
Mode
Description
Impulse response This mode is used for modal analysis operations with an impulse hammer. (Option: FRF / Cross Analysis)
Passby
This mode is an option and is used for measuring the noise of a passing-by vehicle. (Option: Passby)
Delta Tacho
This mode allows to store the calculated data after definable speed intervals instead of defined time intervals.
(Option: Order Analysis)
Sound Intensity
Standard
In this mode global sound intensity values are measured and saved. (Option: Sound Intensity 1)
Despite the values being calculated according to ISO 9614, the measurement does not fully comply with the
standard since the level curves are not saved. For measurements complying with ISO 9614-1 and 9614-2
SINUS Messtechnik GmbH offers the ’SAMURAI Sound Intensity 2’ option.
Sound Intensity
Autostore
Same as ’Sound Intensity Standard’, but the time-weighted level curves are stored.
(Option: Sound Intensity 1)
Sound pressure
map
This mode allows to create sound pressure maps.
(Options: “Sound Intensity Map”, “Sound Intensity 1” and “NoiseCAM”)
Sound intensity
map
This mode allows to create sound intensity maps.
(Options: “Sound Intensity Map”, “Sound Intensity 1” and “NoiseCAM”)
Table 2.7: Optional measurement modes
Parameter
Description
Name
The measurement name. The measurement is stored to the hard disk using the specified name and a
counter value. The name of the associated folder consists of the measurement name followed by the counter
value. Therefore the name must not include characters that are not allowed for folder names (e.g. <, >, | ).
Working folder
The working folder to which the measurements are stored is indicated. To change the current folder use the
main menu Tools -> Working folder (see 6.1).
Number from
The starting number of the counter added to the name.
NOTICE!
SINUS Messtechnik GmbH
If individual measurements are deleted afterwards and thus gaps form in
the sequence of numbers, these gaps will be refilled with new measurements. SAMURAI searches the existing measurement names for the smallest available number. If you set the value to ”-1”, the count will continue
from the highest number found. This is vital for longterm measurements.
19 of 132
Manual SAMURAI
2
PERFORMING A MEASUREMENT
Parameter
Description
Export info
Entry of additional verbal information for the data export.
Export
automatically to
Format selection for automatic export (section 8.3): NWWin, Excel, UFF, text. Automatic export is not
supported for si++, Windows Media Movie and Quicktime Movie format.
Export options
Dialogues containing options for the automatic data export.
Delete temporary If checked, SAMURAI deletes the measured data from the working folder after a successful export. Use this
measurement
option only if you have severely limited disk space. If necessary, measurements can easily be deleted within
after
successful SAMURAI.
export
Export folder
The name of the folder to which the exported data is saved. This is not relevant for the NWWin format
because data is directly saved to an open NWWin document.
Browse
Browse for export destination folder (except NWWin).
Calibration Check
Enable the calibration check procedure for the Easy Operator mode. This allows the programme to check
the calibration of the transducers while running.
Adjust Gain
Enable the adjust gain procedure for the Easy Operator mode.
Table 2.8: Measurement setup
2.5
Preparing a Setup
The Setup-Tab contains the parameters and their current settings in a tree structure (figure 2.11). The
entries (groups) at the root (0th level) of the tree are listed and described briefly in table 2.9. A detailed
description is given in chapter 4.
Figure 2.11: Setup window
There are two differences compared to standard tree structures: The first difference are so-called tool tips,
small popup windows, to show the contents of each item whenever required. Just move the mouse cursor to
an item of the tree. After a short time the tool tip is displayed.
You may adjust tree items or parameters by double-clicking on them or using the context menu (right click
on -> Edit Properties see figure 2.11). The use of the context menu is slightly different when Soundbook is
used as a tablet PC, because you may not right-click with the mouse (pen for left-clicking only). In this case
you may open the context menu by left-clicking (or clicking with the pen) on the icon of an item .
Manual SAMURAI
20 of 132
SINUS Messtechnik GmbH
2.6
Display Measurements
Groups 0th level
Description
Hardware
Use the items below “Hardware” to modify the hardware settings or the software settings directly related to
the hardware.
Analysis
This group includes all analysis settings. By standard the 1st level contains the four analysis groups:
signal, 1/3 octave, FFT, SLM Each group contains the active main channels (2nd level) for which you
can enable/disable the corresponding analysis operation in the context menu. Currently the following four
groups are also optionally available: Fractional octaves, Order, HVMA, Vibration Meter.
Store condition
You may set the store conditions. The store conditions control the triggered data logging. You may use the
specific conditions for the parameterisation of the individual analysis operations.
Trigger
The 1st level lists the existing triggers. If no triggers are defined yet or if you want to change triggers, use
the context menu.
Output Event
Similar to triggers you may define events to control external processes (e.g. via the COM port).
Marker
The 1st level holds all enabled markers. Markers identify certain periods within a measurement. You may
enable a marker manually or defining a trigger event. SAMURAI can record up to ten different markers.
External data
Set the parameters for the data transfer from/to Starpass in a vehicle passby measurement. This group is
only displayed if the Passby option is included in your licence.
Default pen
Clicking on this item opens a window in which you may adjust the default settings for line colours and
widths for the current setup (see section 4.7).
Table 2.9: Setup window - Groups
2.6
Display Measurements
In the Graph layout and properties window you may adjust all settings for the graphical display of measured
data. The window (figure 2.12) can be divided into five areas as described in Table 2.10.
Figure 2.12: Graph layout and properties window
SAMURAI allows displaying measured data in various types of graphs. The different graphs do not depend
on the panes layout. Any type of graph may be displayed in any pane without limitations. You may create up
to 32 graphs, of which a maximum of 16 may be displayed on the screen simultaneously. The graphs which
are not displayed are calculated in the background. Thus the graphs can be displayed faster when switching
to the next graph.
There are different types of graphs as described in the tables 2.11 and 2.12. To adjust the graphical display
properties click on the Graph Properties command in the context menu of the graph or click on the corresponding button in the main toolbar. The Graph Layout and Properties window will open where you may
adjust all settings.
SINUS Messtechnik GmbH
21 of 132
Manual SAMURAI
2
PERFORMING A MEASUREMENT
Position
Description
Top-Left
The root items of the tree structure contain all defined graphs. The sub-items are the various groups of
settings which may vary with the different types of graphs. Click on those items on the first level to view
the current settings. The settings will be displayed in the top-right area.
Top-Right
Display of the settings for the item selected in the Top-Left tree.
Bottom-Left
This section contains the layout preview. To position a graph click on the item in the tree and drag it to the
desired field in the preview The field will then show the number of the selected graph.
Bottom-Right The preview of the currently selected graph. If you adjust any settings in Stop mode, the changes will be
displayed here immediately. In Record mode the real-time preview is not available.
Bottom
In the bottom line you can see several buttons. The Select Layout button opens a context menu for
adjusting the current graphical display properties. The Place Graph button opens a context menu for
selecting a graph for the current pane. Use the New graph and Remove graph buttons to create a new
or remove an existing graph. Press the OK button to apply changes or the Cancel button to cancel
changes.
Table 2.10: Partitioning of the Graph layout and properties window
Graph type
Description
Spectrum
Used to display spectral data. The x-axis represents the frequency, while the y-axis represents the amplitude.
The amplitude unit depends on the settings and the transducer type.
History
Used to display level history data. The horizontal axis represents the time and the vertical axis the amplitude.
Marker traces are only displayed in history graphs as coloured lines.
Sonogram
You may use sonogram graph to display spectral data over time or speed (RPM). The amplitude is represented
by a certain colour. You may use a default colour scale or define your own (section 5.4.3).
Waterfall
This three-dimensional graph shows the frequency on the x-axis, the amplitude on the y-axis and the time or
speed (RPM) on the z-axis.
SLM
In the SLM pane two selectable main values may be displayed on the screen as figures and as bars. Eight
further figures are given in a table which may be replaced by a history graph.
Time signal
You may display the analyzer time signal in this graph.
vsXREF
Diplay of a single value (a level mostly) versus a selectable base value (over time, RPM, AUX channel).
Pure tone graph(acc. to ISO226) This graph allows an analysis according to ISO 226 dealing with normal equal-loudness-level contours. (ISO
226: Hearing threshold and equal-loudness-level contours for sine tones in a free sound field when listening
binaurally.)
Tachometer
Display of RPM or velocity data.
Status
Display of the current SAMURAI status.
Table 2.11: Basic graph types
Graph type
Description
Contour map
The graph is used to display maps of spectral data interpolated or as iso-lines. (Option: Sound Intensity Map)
HVMA
This graph is used as human vibration analyzer. The levels of the three spatial directions as well as the sum
level are displayed. (Option: HVMA)
Vibration Meter
For vibration measurements according to DIN 45666 and ISO 2954. (Option: Vibration Meter)
Cross Analysis
Display of transfer functions, cross spectrums, correlations etc. (Option: FRF / Cross Analysis)
Sound Intensity
Display of the sound intensity values calculated according to ISO 9614. (Option: Sound Intensity 1)
Building Vibration Tabular and graphical display of the values according to DIN 4150-3. (Option: Building Vibration)
Weather Data
If a Reinhardt or Vaisala weather station is connected to the analyzer, you may display the temperature, wind
speed, wind direction, relative humidity, air pressure etc. in this graph. (Option: Weatherstation)
Table 2.12: Optional graph types
Manual SAMURAI
22 of 132
SINUS Messtechnik GmbH
2.7
2.7
Dealing with measurement data
Dealing with measurement data
Therefore you must always specify a valid working folder . When the programme is running a certain volume of the measured data is kept in the working memory. The default path for the Working Folder is
<SAMURAI_Inst_Pfad>\SHTMP. You may select a different working folder in the main menu via Tools >
Working folder. You may not select a network directory because it can be disconnected at any time. However, you may fix an external drive as working folder (e.g. USB 2.0, Firewire, CardBus or CF-Card).
2.7.1
Replay of Measurements
SAMURAI allows you to recall and replay a stored measurement. When replaying the measured data are
displayed; stored audio signals are replayed over the speakers or headphones. The replay feature is controlled with the Replay toolbar (see paragraph 9.4.3). The replay of a measurement is normally performed
at the same speed as it was recorded. You may, however, increase the replay speed by the factors 2 or
4 adjusting the parameter Speed in the Data Browser context menu (see Tab. 7.1). When SAMURAI is
replaying a measurement, it displays a slider control in the SAMURAI status bar showing the current replay
position. You may change the current replay position with the slider by first pausing the replay, then moving
the slider to the required position and restarting the replay with a click on the Pause button.
SAMURAI displays various statistics in the status window (e.g. number of overloads occurred, number of
marker events occurred, etc.). These statistics are calculated during measurement, but not stored. Thus
you have to replay the entire measurement if you want to view the statistical values.
Please pay attention to replaying the measurement starting at the first data block, otherwise the statistical
values will be corrupted. If you use the search operation or replay individual blocks several times, the
statistical values are calculated as in a regular measurement and thus become corrupted.
2.7.2
Exporting Data
SAMURAI stores data in its own proprietary format. Therefore SAMURAI provides a wide range of export
operations to further process data in other applications (table 2.13 and chapter 8). The ideal format for
exporting all measured data without restrictions is Noise & Vibration Works (NWWin).
Format
Description
NWWin
Application for post processing and reporting. All measured data are exported.
Excel
Data format of Microsoft Office spreadsheets. It is one of the most common file formats. It is however
limited by the number of possible rows and columns in a single sheet.
ASCII
This format allows you to view the data with a simple text editor or to export the data to other applications
(comma-separated CSV file).
UFF
This format is one of the longest-established formats for scientific data and is commonly used in the
automotive industry.
si++
This is a powerful analysis software package from Akustik Technologie Göttingen. Only the time signal
data is exported to si++; all data may be recalculated from the time signal data in si++. If the measurement
does not contain time signal data, no export file is created.
WAV
Only time signal data may be exported to the standard Windows WAV format.
Windows Media
Movie
This is the standard format for the Windows Media Player. Exporting to this format is only possible if the
recalled measurement includes video data (NoiseCam option required).
Quicktime
Movie
This format is intended for video data and was developed by Apple Computers
common for many operating systems (such as MacOSX, Unix, Linux etc.).
TM
. This format is very
Table 2.13: Export formats
You may use the main menu item (Measurement -> Export to -> <Format> ), the context menu in the
Browse-Tab or the context menu in the Data Browser to export data (table 7.1). It is also possible to specify
automatic export in the Measurement Setup (table 2.8).
SINUS Messtechnik GmbH
23 of 132
Manual SAMURAI
3
BASIC MEASURING MODES IN DETAIL
3
Basic measuring modes in detail
3.1
Standard and Autostore mode
In Standard mode only global data are stored. These are data that characterise the whole measurement (like
maximun, average, . . . ). If the time history data should be stored, too, it is necessary to use the Autostore
mode. You may control the data recording manually, timed or using triggers. You can set the mode to be
used with the parameter Mode.
Normal: Perform Run and Stop manually (by clicking on the buttons of the graphical interface or by pressing
F2 or F4 on the keyboard).
Daily: Enter the daily recording intervals into a table. If the specified block periods succeed each other,
SAMURAI will measure continuously.
Arbitrary: Enter the time and date of a recording into a table. If the specified block periods succeed each
other, SAMURAI will measure continuously.
Trigger: Define the Start and Stop triggers as additional parameters.
Figure 3.1: Window Measurement Setup - Standard
Further parameters are:
Parameter
Description
Start
Enter the time (in seconds) after which the measurement is started.
Duration
Select Free (0s) or Fixed (ns) duration.
Start trigger
If Trigger is selected for start mode, select the trigger.
Stop trigger
Select a stop trigger. You must define the trigger first (section 4.4).
Repeat count If you select the mode Daily, you may define the maximum number of data blocks using this setting (f.e.
daily measurement between 6:00 a.m. and 10:00 p.m. and 5 repetitions for five days).
Table 3.1: Parameters for the Standard and the Autostore Mode
Manual SAMURAI
24 of 132
SINUS Messtechnik GmbH
3.2
3.2
Reverberation time measurements
Reverberation time measurements
This mode is used for measuring the reverberation time of rooms complying with EN ISO 3382:1997. In
general two methods exist:
Interrupted noise method: In this method a speaker is fed with random and pseudo-random noise as
sound source. Due to the high demands on the used speaker system and possible problems with the
required signal-to-noise ratio given in EN ISO 3382, it is necessary to perform several measurements
at each measuring position and to average the results.
Integrated impulse response method: In this method the reverberation time is calculated by backward
integration of the squared impulse response of a room or by using a regression line. The impulse
response can be determined by exciting a room with various signals (currently impulse excitation
through a gun shot etc. and through a sine sweep signal).
Figure 3.2: Measurement setup window - Reverberation time measurement
Parameter
Description
Signal type
Defines how the analysed room is excited. Possible values are: “interrupted noise”, “impulse”,
“sweep”.
Use internal
generator
If “interrupted noise” is selected as signal type, this checkbox determines whether the internal generator of the analyzer is used or the noise signal is generated independently (f.e. using an amplifier
with an integrated noise generator).
Generator selection
If “Sweep” is selected as signal type, this parameter determines whether the internal signal generator
of the analyzer is used or the signal is generated independently. Among others, you may select the
external excitation through a sweep + synchronization sound. Thus SAMURAI is able to automate
the measurement partially.
Octave band
This parameter determines whether the measurement should be performed in 1/3 octaves or 1/1
octaves.
Range
Select the lower and upper frequency band to be measured.
Number of positions
Enter the number of measuring positions.
Averages per position
Define the number of measurements per measuring position used for averaging.
Approximate length
Enter the approximate length of one measurement.
Averaging mode
Determine which method is used to average the individual measurements.
Trigger level
Enter the trigger level for triggering the individual measurements. The source for this trigger is always
the last active main input channel.
SINUS Messtechnik GmbH
25 of 132
Manual SAMURAI
3
BASIC MEASURING MODES IN DETAIL
Parameter
Description
Store audio signal
Check this box to activate audio recording during the measurement.
Use reverse filtering
The audio signal is filtered chronologically reversed.
Generate signal with
sync. sound
Using this button you can create a WAV-file containing the exciting signal. Please note that you
have to create the WAV-file again if you have applied changes to the parameters influencing the
measuring bandwidth.
Table 3.2: Measurement setup - Reverberation time
When the measurement at one measuring position has been finished, a window opens containing the result
for this position (see fig. 3.3). You may now decide whether the given number of averages is sufficient for
the corresponding local measuring conditions or not. If necessary, you may adjust the settings. The window
in figure 3.3 is divided into three sections.
Top left: This part contains the recorded data in a tree structure. You may select to display the results for
the whole room, for individual measuring positions or for individual measurements.
Bottom left: This part contains several parameters for the calculation of the measuring values and the
graphical display.
Right: This part is used to display the measuring results graphically and numerically. By double-clicking on
a cell of the table you may view the level curve of the measurement for the corresponding value.
Figure 3.3: Results window - Reverberation time measurement
NOTICE!
The displayed
standard deviation is estimated.
v
u
u
sstd = t
Manual SAMURAI
n
X
1
·
(xi − x)2
n − 1 i=1
26 of 132
SINUS Messtechnik GmbH
3.2
Reverberation time measurements
The criteria “BT”, “Correlation”, “Curvature” und “Standard deviation” are calculated according to the standards ISO3382-2 2008 and ISO 354-2003. You may adjust the default thresholds using Commands ->
Marker. A detailed description of the individual elements is given in the following table 3.3.
Parameter
Description
Result averaging mode
Select the averaging method.
Reverberation time is the arithmetic mean of the individual measurements.
Group mean value is the arithmetic mean of the decay curves and the calculation of the reverberation time from the mean decay curve.
Backward integration
Check this box to calculate the reverberation time/decay curve using backward integrated measuring
values.
[EDT],[RT15],
[RT20],[RT30]
Use this buttons to switch the display between Early Decay Time, RT15, RT20 and RT30.
Number of rows
This parameter determines how many rows should be used in the adjoining display. This parameter
is only available if the button Decay curve is activated.
Number of columns
This parameter determines how many rows should be used in the adjoining display. This parameter
is only available if the button Decay curve is activated.
Numeric table
If this button is pressed, the results are displayed in a table. The values are marked with a grade
factor (in round brackets). This factor determines the extent to which the automatic detection of
the decay curve corresponds to the measured curve (100 =
b much; 0 =
b not much). If displayed in
square brackets [nf], the distance to the noise floor is too small (noise floor).
Decay curve
By clicking on this button you may view the decay curves of the individual measurements (averaged
measurements per position also).
Spectrum
If this button is pressed, the spectrum of the reverberation times is displayed.
Edit manually
If this box is checked, you may change the approximation line of the decay curve manually using
the mouse (by dragging the black, dashed line). This is only available for single measurements at
the corresponding measurement positions.
Copy to clipboard
Using this button you may copy the content displayed in the window on the right to the clipboard
(table or graph).
Commands
Clicking on this button will open a menu containing the following operations:
Reset Delete all data of the reverberation time measurement (all settings will be kept).
Resize Change parameters: microphone positions, source positions, number of averagings per
position, number of measurements.
Delete selected measurement Remove the selected measurement.
Color indicators Change the colour of the indicators for the parameters “Correlation”, “Curvature”
and “Standard deviation”. The setup window will not be described in detail since it is selfexplaining.
Table 3.3: Measurement setup - Reverberation time
In the tree structure on the left you may select from which data the corresponding results should be calculated. By unchecking (no tick) single measurements/positions you may exclude data records from the
calculation to remove undesired ambient noises.
SINUS Messtechnik GmbH
27 of 132
Manual SAMURAI
3
3.2.1
BASIC MEASURING MODES IN DETAIL
Reverberation time measurement - Step by step
To perform a standard reverberation time measurement follow the instructions below:
1. Define the number of measuring positions and averages for the analysed room.
2. Start SAMURAI and click on ON/OFF on the Main toolbar to connect the analyzer (see also paragraph
9.4.1).
3. Click on NEW to configure a new measurement (see paragraph 9.4.1). Select “Reverberation time” as
measuring mode.
4. Make a selection on the right of the setup window according to the measuring demands (signal type,
number of positions etc., see also fig. 3.2 and table 3.2). Finally confirm your settings by clicking on
the OK button.
5. Position the microphone(s) at the desired measuring position, connect the analyzer (microphones,
amplifiers, if required, dodecaeder etc.) and start the measurement by clicking on the Run button in
the Run toolbar (see paragraph 9.4.2).
6. Excite the room with the desired signal and pay attention on SAMURAI automatically detecting the
record event. If SAMURAI does not automatically recognize the record event or if SAMURAI records
data despite missing excitation, correct the preset trigger threshold in the measuring setup window. If
SAMURAI recognizes the record event correctly, you can continue and generate the excitation signal
according to your setting Averages per position.
7. Having performed the corresponding number of measurements per position, SAMURAI displays the
result window for the corresponding measuring position. In this window you may choose to repeat
the measurements at a certain position (in case of unexpected ambient noises). A first sign for this
case is *** frequently appearing in the table containing the numeric values for the reverberation time.
SAMURAI uses this character string if the reverberation time in this frequency band could not be
determined automatically.
8. Having finished all measurements at all measuring positions the measurement is stopped. In the
Replay mode you can recall a recorded measurement and export the measured data. Please check
the data before exporting. (Did SAMURAI recognize all reverberation times automatically?)
ATTENTION!
3.3
If you change the measured data manually (decay curve), these changes
are saved automatically!
Impulse Response
text
3.4
Demo
This mode has only little relevance for measuring, because no data are stored to the hard disk. Use this
mode only to get familiar with the programme or to read the measurement results on the screen.
Manual SAMURAI
28 of 132
SINUS Messtechnik GmbH
3.4
Demo
Figure 3.4: Measurement setup window - Demo
SINUS Messtechnik GmbH
29 of 132
Manual SAMURAI
4
4
THE SETUP-TAB
The Setup-Tab
In this chapter we describe in detail the type of data to be stored and the calculation methods to be used as
well as configuring the analyzer.
4.1
4.1.1
Hardware
Main Channels
The main channels correspond to the main input connectors of the analyzer (depending on your model two,
four, eight or more).
NOTICE!
Please note that the number of available main channels is halved in the
Extended mode. This mode is only available for the analyzers of the HARMONIE family (including Soundbook MK1).
Double-clicking on the Main Channels item (
4.1 will be displayed.
) will open the settings window. The window shown in figure
Figure 4.1: Main Channels Setup window
The elements in the window are displayed in a table: one column for each channel with the various settings
in the rows. The first column contains the settings for all channels. If you want to set all channels to the
same value, you must only change the value in the first column. If all channels have the same value for one
setting, it will be displayed in the first column. If the values for the channels vary, the field in the first column
is empty. The values for settings which are always the same for all channels are only displayed in the first
column.
Parameter
Description
Enable
This window always displays all available channels. All other windows for setting the main channel parameters
only contain the active channels. At least one channel must be enabled in order to proceed with OK .
Gain∗
Select the input gain for the main channels. The brackets contain the current measuring range corresponding to
the sensitivity of the connected transducer. You may also set this parameter using the buttons in the level monitor
display (see section 5.3).
Coupling∗
You may set the input coupling for the selected channel.
Input Filter∗
You may use this additional filter if required for your measurement task.
High Pass filter Dis-/Enable an analogue 1 Hz high pass filter for all channels.
Passby side
Defines at which side the microphones are placed in passby measurements. The parameter is only available as
part of the Passby option.
Table 4.1: Parameters - Main Channels
∗
The available settings may vary according to your analyzer type.
Manual SAMURAI
30 of 132
SINUS Messtechnik GmbH
4.1
Hardware
You only see the active channels below Main channels in the setup window. If you double-click on the entry
for a channel or select Edit in the context menu to set a channel, only the selected channel and the column
containing the value for all channels are displayed in the window. The settings are the same as in table 4.1.
Transducer Selection
In the context menu for an individual main channel you will find the item Edit as well as two further items:
Select a transducer: You may select a transducer from the transducer database in a submenu (see section
2.2).
Calibrate transducer: You may also use the command Calibrate transducer in the main menu below
Analyzer. The only difference is that SAMURAI will automatically select the main channel from which
you have opened the context menu.
RI Correction: You may use this field to enable/disable the RI correction for microphones.
Figure 4.2: Transducer selection
ATTENTION!
It is essential to select the correct transducer for each channel, otherwise
the measured data will be incorrect.
Measuring velocity or displacement with an accelerometer
SAMURAI is able to measure velocity and displacement by integrating a signal coming from an accelerometer once or twice. To use this function simply select the appropriate transducer for the corresponding channel.
In the submenu for the transducer selection you may select a single-integrated accelerometer under Velocity or a double-integrated accelerometer under Displacement
(e.g. Displacement -> Double Integrated Default Accelerometer).
NOTICE!
The spectra are integrated within the frequency domain.
The integration of sound levels is not scheduled.
SINUS Messtechnik GmbH
31 of 132
Manual SAMURAI
4
4.1.2
THE SETUP-TAB
Auxillary channels
The analyzers of the HARMONIE and the APOLLO family provide several auxiliary channels. The number
and individual features depend on your analyzer model. With analyzers of the HARMONIE family you may
use the pins of the LEMO8 socket for various purposes. The pin assignment and application is given in table
4.2.
ATTENTION!
The sampling rates for the individual AUX channels vary for the analyzers
of the HARMONIE family (see table 4.3)!
Figure 4.3: Auxiliary channels
Pin Possible values
Auxiliary channel
Sample rate
in s
1
Auxiliary channel 1 (S_IN1)
1
0.08
2
Tacho 1, Auxiliary channel 6 (S_IN6), Trigger input (TRG_IN1)
2
0.08
3
Auxiliary channel 2 (S_IN2)
3
0.16
4
Auxiliary channel 3 (S_IN3)
4
0.16
5
Ground
5
0.64
6
Tacho 2, Auxiliary channel 7 (S_IN7), Trigger input 2 (TRG_IN2)
6
0.64
7
Auxiliary channel 5 (S_IN5), Trigger output 1 (TRG_OUT1)
7
0.64
8
Auxiliary channel 4 (S_IN4), Trigger output 2 (TRG_OUT2)
Internal temperature
0.64
Voltage
0.64
Table 4.2: Pin assignment for the auxiliary channels
Table 4.3: Update rates for the auxiliary
channels
ATTENTION!
The analyzers of the APOLLO family usually provide 8 AUX channels which
are all sampled with 200 Hz. The sampling, however, is not equidistant and
thus the frequency analysis of the signals is not permitted.
Click on the icon ( ) or use the context menu to open the setup window for the auxiliary channels. The table
4.4 contains the parameters of the window shown in figure 4.3 and describes them. Only active auxiliary
channels will be displayed on the first level of the AUX channel group. To set an individual channel doubleclick on the entry or use the context menu. A window will open containing the parameters described in table
4.4. Using the context menu of an AUX channel you may set the connected transducer. You may only select
transducers which are included in the transducer database. If a transducer is displayed in grey in the menu,
it is already used at another channel.
NOTICE!
Manual SAMURAI
Please note that there is no option to calibrate the transducers connected
to the AUX channels.
32 of 132
SINUS Messtechnik GmbH
4.1
Hardware
Parameter
Description
Enable
En-/Disable an auxiliary channel. You may disable all auxiliary channels.
Averaging mode
Select Linear or Exponential averaging mode.
Linear count
Enter the number of values used for linear averaging.
Exp. time (s)
Enter the time constant for exponential averaging.
Delta time
Delta time is the time interval for storing the calculated values. It is only used with Exponential
averaging, because for Linear averaging the delta time is calculated by multiplying the Linear count
by the hardware update rate The time you enter must not exceed the time constant for exponential
averaging.
Table 4.4: Parameters for auxiliary channels
Open the dialogue in the main menu below Analyzer -> Pin assignment for aux channels to set the pins
for the auxiliary channels (see fig.: 4.4). There are several checkboxes. They have the following purposes:
Use the Two buttons remote control unit Check this box to enable the following remote control option
.
Use the Six buttons remote control unit Check this box to enable the following remote control option
.
Use the GPS receiver Check this box when using a GPS receiver.
NOTICE!
When both boxes are checked the corresponding tachometer channels of
the Soundbook MK1 are occupied and not available for other operations.
Synchronize the internal clock with the GPS clock Check this box to synchronize the analyzer’s clock
with the GPS time signal. The first tachometer channel receives the GPS data and the second
records a highly precise 1 s impulse from the GPS receiver which is used for time synchronization.
This enables simultaneous measurement with several devices on exactly the same time base. The
synchronization accuracy via GPS is ±4µs for Soundbook MK1 and ±200ns for Soundbook MK2.
Use AES channels (if available) If you analyzer is a so called PLUS analyzer of the HARMONIE family,
check this box to enable the AES channels.
Figure 4.4: Pin assignment for auxiliary channels
SINUS Messtechnik GmbH
33 of 132
Manual SAMURAI
4
4.1.3
THE SETUP-TAB
AUX channels Diff
These channels are only available with analyzers of the APOLLO family. They are differential inputs which
are derived from the AUX channels 1 to 8. The following are derived:
AUX channel 1 - AUX channel 2 = AUX channel Diff 1
AUX channel 3 - AUX channel 4 = AUX channel Diff 2
AUX channel 5 - AUX channel 6 = AUX channel Diff 3
etc.
The channels are applied when you use the SINUS Messtechnik GmbH PTrH transducer, for example.
The PTrH transducer
This transducer measures the static air pressure, the air temperature and the relative humidity. It is ideal for
measurements which must acquire values continuously or at the beginning and the end of a measurement
(e.g. building acoustics). Connect the transducer directly to the slow input channel of an APOLLO device.
The channel will also supply power to it.
Figure 4.5: PTrH transducer for measuring ambient temperature, relative humidity and
static air pressure
Setup the transducer database as described below:
V
rel. humidity: Power Supply: none; sensitivity: 0.0099 %
; Offset: 0 %; dB reference: 0
V
Temperature: Power Supply: none; sensitivity: 0.00495 K
; Offset: -50 K; dB reference: 0
N
Pressure: Power Supply: none; sensitivity: 2.673 · 105 VN ; Offset: 10555 m
2 ; dB reference: 0
2
m
4.1.4
Tachometer Channels
You may connect max. 2 tachometers to an analyzer. Similar to the main channels, only the active tachometer channels are displayed in this group. Double-click on the entry or use the context menu to enable them.
In figure 4.6 the window for setting the tachometer is shown and in table 4.5 all adjustable parameters for a
tachometer are listed and described.
Manual SAMURAI
34 of 132
SINUS Messtechnik GmbH
4.1
Hardware
Figure 4.6: Tachometer Channels Setup window
Parameter
Description
Enable
Enable or disable the corresponding tacho channel.
Unit
The unit used for displaying the rotational speed.
Pulse per revolution
Number of impulses given by the speed sensor per revolution.
Status bar
Displays the current tachometer value in the status bar.
Averaging mode
Select linear or exponential averaging mode.
Linear count
Enter the number of values used for linear averaging.
Exp. time (s)
Enter the desired time constant (in seconds) for the exponential averaging mode.
Delta time
Storage interval for the exponential averaging mode.
Tacho ratio
Displays the conversion factor between rotational speed (RPM) and vehicle velocity.
Change
Dialogue to adjust the transmission ratio (transmission data) (see figures 4.7 and 4.8).
Calculate distance
If checked, the distance is calculated from the speed of this tachometer and the time. You may use
this feature in passby measurements.
Table 4.5: Parameters for the tachometer channels
The transmission data is necessary to convert engine revolutions to vehicle speed. You may set the ratio
manually or the programme calculates the ratio using the wheel geometry and transmission ratio of the gear.
Figure 4.7: Transmission data
SINUS Messtechnik GmbH
Figure 4.8: Set transmission ratio manually
35 of 132
Manual SAMURAI
4
THE SETUP-TAB
The parameters are shown in the figures 4.7 and 4.8 and described in table 4.6.
Parameter
Description
Mode
Select manual input of ratio km/h to RPM or automatic calculation by SAMURAI.
Ratio
If you have selected manual input, enter ratio km/h to RPM.
Width
Enter the wheel width.
Height
Enter the wheel height.
Rim diameter
Enter the rim diameter in inches.
Wheel crushing Enter the wheel crushing.
Axes ratio
Enter the axes ratio.
Gear ratio
Enter the gear (transmission) ratio of the vehicle.
Table 4.6: Parameters Transmission data
4.1.5
ADC -> DAC
These channels are used for monitoring the input signals. The input signal is directly linked to the output
within the analyzer. You may set the main channel and the attenuation applied to the output.
Figure 4.9: Configuration ADC -> DAC
4.1.6
Signal Generator
Figure 4.10: White noise - Signal generator
In connection with SAMURAI the output channels of the analyzer may be used as independent signal generators. The number of signal generators and the maximum sampling rate depends on your analyzer (APOLLO
Manual SAMURAI
36 of 132
SINUS Messtechnik GmbH
4.1
Hardware
family always 2 channels with max. 204 kHz (Box version only 51.2 kHz) sampling rate and the HARMONIE
family mostly 4 output channels with max 51.2 kHz). Open the settings window for the signal generators by
double-clicking on the entry in the tree structure in the setup window.
In the basic version of SAMURAI White and Pink noise as well as a DC scaled signal are available. The
white noise generator is generating a signal in which all included frequencies have the same frequency. For
the pink noise the energy decreases by 3 dB per octave. Figure 4.10 shows the configuration window for
the white/pink noise. The description of the parameters is given in table 4.7.
Parameter
Description
Initial delay
Time in seconds to delay the signal generation.
Frequency
Frequency of the generated signal.
Amplitude
Amplitude of the signal (normalized to 1).
Mode
There are three modes for generation: Continuous, Burst Repeat, Burst Single.
Filter
This parameter is only available if generating noise. Using this parameter SAMURAI is able to generate
a band-limited noise. Possible values for this parameter are: no, Low pass, High pass, Band pass,
Third octave, Octave
High pass/Low pass
frequency
The two parameters define the cut-off frequencies for the corresponding filters. The parameters are
only available for noise generators.
Third
band
octave/Octave This parameter is only available when generating white or pink noise and when ’Third octave’ or
’Octave’ have been selected for the parameter Filter. The parameter defines which third octave or
octave band is filtered.
Table 4.7: Parameters - Signal Generator
Use the DC scaled signal type to put out a measuring signal as a proportional DC signal. For this, define
the signal to be put out or the ending points of the linear function for each (figure: 4.11).
Figure 4.11: Output DC-scaled signal
Figure 4.12: DC-scaled signal - Signal generator
The parameters of figure 4.12 are described in table 4.8.
Parameter
Description
Result/Bin
The two parameters define which calculated value is put out as voltage.
Scaling factors
The parameters in this box define the ending points of the linear function (figure: 4.11).
DC sign
Defines the sign for the output signal.
Exp. Average Time
To put out an (approximate) DC voltage SAMURAI exponentially averages the output signal. With
this parameter you may adjust the time constant for the calculation.
Table 4.8: Parameters scaled DC - Signal generator
SINUS Messtechnik GmbH
37 of 132
Manual SAMURAI
4
THE SETUP-TAB
Signal Preview
For each signal type you may display a preview of the generated signal by clicking on the button Signal preview...
(figure 4.13). In the preview the signal is shown in the time and in the frequency domain. The parameter
Time length defines the displayed time in samples. The parameter FFT window defines which window
function should be used for the spectrum preview.
Figure 4.13: Preview window - Signal generator
4.2
Analysis
The Analysis settings are used to define which data are acquired, which analysis method is used and which
data are stored. SAMURAI generally provides several analysis methods, which are given and described in
tables 4.9 and 4.10. Certain measuring tasks require the calculation of similar data using different parameters. Therefore, multiple third-octave, FFT and SLM analysis operations are provided. You may define the
number of individual analysis operations to be performed in the general preferences (section 10.4). As with
the other items in the tree structure you can adjust the analysis operations by double-clicking on the first
level entry.
Analysis type
Description
Signal
Time signal recording (decimated or not decimated).
1/3 Octave
The 1/3 octave analysis is performed by the analyzer. Averaging is done by the PC. The bandwidth of
the 1/3 octave spectra is independent from the bandwidth of the time signal.
FFT
The FFT analysis is performed by the PC on the basis of the time signal. Please pay attention to the
bandwidth for data recording (audio/FFT bandwidth in table 4.1).
SLM
Calculation of sound levels. They are partly calculated by the analyzer thus being independent from
the audio/FFT bandwidth.
Sound Power
Measurement of Sound Power according to ISO 3744-46.
Table 4.9: Basic types of analysis
Manual SAMURAI
38 of 132
SINUS Messtechnik GmbH
4.2
Analysis
Analysis type
Description
Fractional
octaves
The calculation of the fractional octaves is done by the PC. Because of that, the bandwidth of the
fractional octaves always depends on the audio signal bandwidth. (Option: Fractional Octaves)
Order
Calculation of spectra over orders of a fundamental oscillation. The fundamental oscillation is captured
with a speed sensor. (Option: Order Analysis)
Sound Intensity
Measurement of Sound Intensity according to ISO 1996 − 1, 1996 − 2, 1996 − 3, ECM A − 160 and
ANSI-S12 − 12 accross a defined surface. (Option: Sound Intensity 1)
HVMA
The data is calculated by the PC. (Option: HVMA)
Vibration Meter
Vibration measurements according to DIN 45666 and ISO 2954. (Option: Vibration Meter)
Building vibration
acc. to DIN 4150-2
Calculation of the frequency-weighted vibration signal according to DIN 4150 Part 2. (Option: Building
Vibration)
Building vibration
acc. to DIN 4150-3
Calculation of the max. vibration level according to DIN 4150 Part 3 for all three spatial directions.
(Option: Building Vibration)
Cross Analysis
Calculation of: cross spectrum, transfer function (FRF H1, 1/H1, H2, 1/H2), cross correlation, auto
correlation and cepstrum (complex). (Option: FRF / Cross Analysis)
Table 4.10: Optional types of analysis
4.2.1
Signal Analysis
You may only adjust the parameter Signal Enabled and Signal Disabled and the store condition to be used for
recording. Recording the time signal may be very useful especially if you want to reanalyze or replay/export
data (f.e. as *.wav file) later. One possible disadvantage of capturing the time signal is that large data
volumes are created. A one hour record, for example, using one channel at a bandwidth of 20 kHz requires
about 350 MByte (700 MB with Soundbook MK2).
4.2.2
1/3 Octave Analysis
If the 1/3 Octave Analysis is enabled for a channel, SAMURAI stores the 1/3 octave spectra calculated by the
analyzer. The maximum frequency range for third octave spectra depends on your analyzer model (Soundbook MK1: 0.04 Hz . . . 40 kHz; Soundbook MK2: 0.04 Hz and 80 kHz). The applied third octave centre
frequencies are shown in table 11.4. SAMURAI allows you to restrict the frequency range providing several
default ranges. You may also adjust the range freely within the limits. The default ranges are:
Acoustic measurement: 20 Hz – 20 kHz
Vibration measurement 1: 3.15 Hz – 2.5 kHz
Vibration measurement 2: 0.2 Hz – 200 Hz
The 1/3 octave spectra calculated by the analyzer are averaged by SAMURAI. Several averaging modes are
provided as shown and described in table 4.11.
Mode
Description
Linear single
The spectra calculated by the analyzer are averaged linearly based on a predefined number of spectra.
After that the measurement is stopped and stored. If other channels are set to use a larger number of
spectra for averaging, the measurements for those channels are stopped and only the acquired data are
averaged!
Linear repeat
Contrary to the Linear single mode the measurement is not interrupted. Every time the predefined
number of spectra is reached, the spectra are averaged linearly and the values are stored. After that a
new averaging run is started.
Exponential
Enter the averaging time in seconds for exponential averaging. The data are stored each averaging time
interval.
SINUS Messtechnik GmbH
39 of 132
Manual SAMURAI
4
THE SETUP-TAB
Mode
Description
Fast
Exponential averaging with time constant 0.125 s.
Slow
Exponential averaging with time constant 1 s.
BT (e=εdB)
An exponential averaging method with constant quality within the examined frequency range. Different
1
time constants are used for the frequency bands (τ = B
· ( 10·logε10 (e) )2 , e=
b Euler’s constant, ε=
b
permissible error).
Table 4.11: Averaging modes for 1/3 octave analysis
SAMURAI can also calculate percentile levels of spectral bands (seven standard level L1, L5, L10, L50, L90,
L95, L99 and three user selectable percentiles (section 10.4). You may dis-/enable the analysis for each
third octave channel.
You may adjust the parameters for the 1/3 octave spectra by double-clicking on the entry on the first level of
the tree structure in the setup window or by using the context menu. The setup window for the third octave
analysis is shown in figure 4.14 and the parameters are described in table 4.12.
Parameter
Description
1/3 Octave n
En-/Disable calculation of the nth 1/3 octave spectra for the selected channel. You may adjust the
number of individual analysis operations to be performed in the programme setup (section 10.4).
Store mode
Enter the store condition for the data acquisition operation. The configuration of the condition is
described in section 4.3.
Frequency range
Select the appropriate frequency range for you measuring task.
Lower band
Enter the lower 1/3 octave band if the frequency range is User defined.
Upper band
Enter the upper 1/3 octave band if the frequency range is User defined.
Averaging mode
The programme provides time averaging of spectra. Select the appropriate averaging mode for your
measuring task (see table 4.11).
Linear count
Enter the number of spectra used for linear averaging.
Exp. time (s)
The time constant for exponential averaging.
Delta time
The time interval for data storage.
LN Table
En-/Disable the calculation of percentile levels.
Table 4.12: Parameters for the 1/3 octave analysis window
Figure 4.14: Setup 1/3 octave analysis
You can also change the parameters for the 1/3 octaves by double-clicking on the corresponding entry on
the second level (individual channels). In this case, the window only contains the values for the selected
channel. The description of the parameters can be found in the table 4.12.
Manual SAMURAI
40 of 132
SINUS Messtechnik GmbH
4.2
Analysis
In the popup menu for the 1/3 octaves (click on the icon on the first level (1/3 octaves)) you can find the entry
1/1 octave. This command switches the analysis mode from 1/3 octaves to the calculation for 1/1 octaves.
All parameters and settings remain the same except the number of frequency bands. They comply with the
standard octave centre frequencies.
4.2.3
FFT Analysis
The FFT analysis is performed by the PC on the basis of the time signal. You may select the number of
spectral lines within a range of 101 to 25601 as well as various window options. Possible window options
are: Rect, Hanning, Hamming, Kaiser-Bessel, Blackman, Flat-Top, Bartlett (Triangle), Welch, Gauss, Cosine
N/4, Cosine N/8, Cosine N/16, Cosine N/32.
The figure 4.15 shows the FFT Analysis setup window. The description of the parameters can be found in
the table 4.13.
Figure 4.15: Setup FFT spectrum
Parameter
Description
Enable
En-/Disable calculation of FFT spectra.
Store mode
see table 4.12
Number of lines
Number of spectral lines; available values are: 101, 201, 401, 801, 1601, 3201, 6401, 12801, 25601.
Window
Select appropriate window option, for available settings see 4.15.
Overlap
Time slot overlap for FFT calculation. Please note that values exceeding 50 % at a bandwidth of
20 kHz could overload the processor and thus cause real-time capability losses and record failures.
A 700 MHz Pentium 3 processor is able to calculate four channels with an overlap of 50 %.
Averaging mode
see table 4.11
Linear count
see table 4.12
Exp. time (s)
see table 4.12
Delta time
see table 4.12
Table 4.13: Parameters for the FFT analysis window
You can also change the parameters for the FFT spectra by double-clicking on the corresponding entry on
the second level (individual channels). In this case, the window only contains the values for the selected
channel. The settings are the same as in table 4.13.
As with the third octave and the SLM analysis, multiple FFTs may be calculated simultaneously. You may
define the number with the corresponding parameter (section 10.4).
SINUS Messtechnik GmbH
41 of 132
Manual SAMURAI
4
THE SETUP-TAB
Figure 4.16: FFT windows
4.2.4
SLM Analysis
Not all SLM analysis operations are done by the PC. The PC receives the following data from the analyzer:
Leq levels, frequency weighted Leq levels, peak levels and frequency weighted peak levels. On their basis
SAMURAI calculates the following values: Fast, Slow, Impulse, Peak, Leq, percentiles and the Taktmaximal
according to DIN 45645-1 for 1, 3 or 5 seconds.
Figure 4.17: Setup SLM analysis
Please note that you may set a delta time greater than the time constants for exponential averaging. However, if you set a delta time greater than 0.125 s for example, the Fast and Impulse results will not be reliable.
If unreliable, the values will be marked with a (∗ ). In table 4.14 the parameters shown in figure 4.17 are listed
and described.
Parameter
Description
Enable
En-/disable sound level meter (SLM analysis) for the corresponding channel.
Store mode
see table 4.12
Selected values Use Edit to open a window for en-/disabling the acquisition of individual sound levels (see figure 4.18).
Delta time
Enter the time between two data storing operations (storage interval).
LN Table
En-/Disable the calculation of percentile levels with the checkbox.
Taktmaximal
Select the interval for the calculation of the Taktmaximal level. Possible values are: none, 1 s, 3 s , 5 s.
Table 4.14: Parameters for the SLM analysis window
Manual SAMURAI
42 of 132
SINUS Messtechnik GmbH
4.3
Store condition
Figure 4.18: SLM Analysis setup - Selection of individual
sound levels
ATTENTION!
Dependings of disabled values are also not calculated!
You can also change the parameters for the SLM analysis by double-clicking on the corresponding entry on
the second level (individual channels). In this case, the window only contains the values for the selected
channel. The parameters are the same as in table 4.14. As with the third octave or the FFT analysis,
multiple SLM analysis operations may be performed simultaneously. You may define the number with the
corresponding parameter (section 10.4).
4.3
Store condition
Figure 4.19: Setup - Store conditions
One important new feature of SAMURAI 2.0 is the option to also acquire most data using a trigger. This
feature is vital for all measurements collecting large data volumes. The triggered data acquisition is the
SINUS Messtechnik GmbH
43 of 132
Manual SAMURAI
4
THE SETUP-TAB
most important data compression operation to be applied already when measuring. For this purpose Store
conditions have been introduced in SAMURAI 2.0 allowing time- or trigger-controlled data storage. Figure
4.19 shows the setup window for the store conditions.
The following three types of store conditions are offered:
Standard . . . may delay a measurement or stop it early. (The setup is self-explaining and is not described
here.)
Triggered . . . uses a trigger to start a measurement (see paragraph 4.3.1)
Timed . . . uses a table in which you may enter measuring times.
4.3.1
Triggered store condition
Triggered store conditions allow the triggered data acquisition in the individual analysis modes. You should
always apply them if you want to reduce the data volume produced by a measurement (e.g. in longterm
monitoring).
Parameter
Description
Name
Define the name of a store condition. This helps identifying the condition during setup.
Duration
The measurement duration. Possible values are:
Fixed length The analyzer is always measuring for the duration (in seconds) entered for Fixed duration.
Variable duration The analyzer is measuring as long a the trigger condition is true, but also considers
the following parameters.
Stop on Trigger The analyzer is measuring until the trigger condition given for Stop Trigger has been
fulfilled.
Trigger
Define a trigger for starting the measurement. You may only select trigger which you have specified
before (section 4.4).
Stop trigger
Define the trigger for stopping the measurement.
Fixed duration
Fixed measurement duration after which it is stopped.
Pre trigger time
Enter the time in seconds to be recorded before the actual trigger event.
Minimum duration
The duration for which a trigger condition must be true before starting a measurement.
Maximum duration
If a trigger event lasts longer than specified here (in seconds without pre and post trigger time), the
measurement will be stopped after that time. The maximum duration may be 1,000,000 seconds.
Minimum separation
Minimum time between two trigger events before starting a new measurement. The minimum separation
may be 1,000 seconds.
Post trigger time
Enter the time to be recorded at the end of a measurement after the trigger condition fails to be true.
Rearm
automatically
Stores automatically new blocks of data after minimum seperation even if the trigger condition is permanently fulfilled.
Repeat count
Maximum number of individual measurements (0 for infinite).
Table 4.15: Parameters for store modes
4.3.2
Timed store condition
The timed store conditions are very useful when measuring at fixed times (e.g. in longterm environmental
noise monitoring at industrial plants or in public facilities). The setup resembles the setup of the Daily feature
in the Autostore mode (see paragraph 3.1).
Manual SAMURAI
44 of 132
SINUS Messtechnik GmbH
4.4
4.4
Trigger
Trigger
SAMURAI offers a powerful and flexible trigger system. A trigger can adopt two possible states: ON or OFF.
You may define how the state of a trigger is calculated using the setup window connected to the Trigger entry
( ) in the tree structure. The trigger types are given and described in table 4.16.
Trigger type
Description
Analyzertrigger input
The trigger state corresponds to the signal of the TRG_INn (see analyzer description).
COM Port Trigger
The trigger responds to level changes at one of the input pins of the RS232 connector of the PC.
Fixed level trigger
A value calculated by SAMURAI is compared to a fixed threshold. When the threshold is
reached, the condition has been fulfilled.
Dynamic level trigger
The threshold for this trigger is calculated from the Leq of the last n minutes of the signal.
Sound level trigger
Responds to a percentage excitation/modulation at the input of a main channel. This trigger
type is only available in the measuring mode “Impact response” (FRF / Cross Analysis option
required).
Compound trigger
Allows logically linking and combining several triggers to one new. Starting with version 2.0
SAMURAI also allows combining “compound triggers”. However, please avoid recursion when
combining compound triggers.
Reference spectrum
trigger
The trigger allows comparing a measured value to a reference spectrum. The setup and features
a described later.
Keyboard trigger
This trigger allows triggering with the keyboard of the PC.
Time trigger
The trigger condition is fulfilled at a defined time (PC). The setup resembles the setup of the
Daily feature in the Autostore mode (see paragraph 3.1).
Edge mode level trigger
This trigger resembles the “Fixed level trigger”, but you may specify additionally whether to
respond to a rising or falling edge.
Range level trigger
SAMURAI verifies whether the measured value lies within the range between two fixed values.
Table 4.16: Trigger types in SAMURAI
The trigger setup window is divided into two sections. A list of defined triggers is given on the left. The
settings for the selected trigger are given on the right. With two further buttons you may create a new trigger
or delete an existing. You may set the name of the trigger manually; default is <Automatic>.
NOTICE!
If you set trigger names manually, please note that the name of a trigger
must be unique.
NOTICE!
The parameter Invert polarity is available for each trigger type. You may
invert the ON (trigger condition fulfilled) and OFF (trigger condition not fulfilled) state.
You may set an evaluation mode for all triggers except the time trigger. Apart from the "‘Normal"’ operation
you also may select "‘Hold on"’ and "‘Toggle"’. With "‘Hold on"’ the state is held until the end of the measurement after der trigger condition has been fullfilled for the first time. With "‘Toggle"’ the state with the same
trigger condition is toggled between on and off.
4.4.1
COM port trigger
The COM port trigger has only two parameters: the number of the COM port to use and the input pin to use
(either DSR or CTS).
SINUS Messtechnik GmbH
45 of 132
Manual SAMURAI
4
4.4.2
THE SETUP-TAB
Analyzer trigger
The setup of the analyzer trigger input is shown in figure 4.20 and described in table 4.17.
Figure 4.20: Analyzer Trigger setup
Figure 4.21: Trigger Setup - Fixed level trigger
Parameter
Description
Name
Enter the desired trigger name.
Type
Define which trigger input is used.
Mode
Define how the trigger works.
Normal The trigger condition is fulfilled when a TTL "High" signal is detected at the analyzer trigger
input.
Rising edge Trigger is a rising edge at the analyzer trigger input and the trigger state is kept for a
definable time.
Falling edge Trigger is a falling edge at the analyzer trigger input and the trigger state is kept for a
definable time.
Duration
Duration for which the trigger state is kept.
Table 4.17: Setup analyzer trigger input
4.4.3
Fixed level trigger
The Fixed level trigger allows defining a threshold condition for a value calculated by SAMURAI. If the
threshold is exceeded, the trigger is ON, in any other case the trigger state is OFF. You may also set a
marker as trigger source (with a threshold of 0), enabling the triggering of a measurement if a marker is set.
The parameters for the fixed level trigger are described in table 4.18.
Parameter
Description
Checked result
Select a group of values to be monitored for this trigger.
Value
This value is the actual source for the trigger.
Threshold
The trigger state is ON when the value exceeds the specified threshold.
dB
Check this box to set the threshold to dB.
Weight
If you have specified a spectral source, you may select a frequency weighting.
Integration/Derivation
Select whether the values shall be integrated or differentiated before trigger analysis. Only available
for spectral sources.
Manual SAMURAI
46 of 132
SINUS Messtechnik GmbH
4.4
Trigger
Parameter
Description
Unit
Select the unit of the monitored value for FFT sources. Possible values are: RMS, Peak, Peak-Peak,
EU2 and PSD.
Complex
Select which component of the complex spectrum is used for FFT sources. Possible values are:
Real, Imaginary, Amplitude or Phase.
Table 4.18: Parameters for the fixed level trigger
4.4.4
Dynamic level trigger
The Dynamic level trigger allows detecting major changes of the measured signal using a dynamic threshold. The dynamic level trigger can only be used for measured values given in dB. The actual threshold value
is calculated by adding a specified offset to the Leq or LN calculated from the data of n minutes. The setup
window for the dynamic level trigger is shown in figure 4.22. The parameters are described in table 4.19.
Figure 4.22: Trigger setup - Dynamic trigger
Parameter
Description
Checked result
Select a group of values to be monitored for this trigger.
Value
This value is the actual source for the trigger.
Offset from base
Specify the offset for calculating the actual threshold value (see above).
Base parameter
Possible values are: Leq and LN.
LN
Enter the percentile base.
Calculation
time frame
Enter the preceding time frame to be taken into consideration when calculating the Leq or LN as basis
of the calculation. The maximum value is the normal time frame. The minimum time frame applied if
the measurement has just started and not enough data has been collected yet.
Table 4.19: Parameters for the dynamic level trigger
4.4.5
Keyboard trigger
The Keyboard trigger allows triggering events with the keyboard of your PC or Soundbook. The trigger
condition is fulfilled when the assigned trigger Key was pressed.
4.4.6
Time trigger
The Time trigger allows triggering with the PC’s clock. The trigger condition is fulfilled at a defined time of
day and duration. The setup resembles the setup of the Daily feature in the Autostore mode (section 3.1).
SINUS Messtechnik GmbH
47 of 132
Manual SAMURAI
4
4.4.7
THE SETUP-TAB
Compound trigger
The Compound trigger allows combining several triggers of various types logically (with AND, OR and
XOR).
Figure 4.23: Trigger setup - Compound trigger
Figure 4.24: Trigger setup - Reference spectrum trigger
The parameters for the compound trigger are described in table 4.20.
Parameter
Description
Logic condition
Select the type of logic linking condition. Possible values are: AND, OR, XOR.
Sub-trigger list
The list of basic triggers to be included in the compound trigger. Click on Add... to add a new trigger.
Click on Remove (see figure 4.20) to remove a trigger.
Table 4.20: Parameters for compound trigger
4.4.8
Edge mode level trigger
The Edge mode level trigger only differs from the fixed level trigger in the additional parameter Edge
mode defining to respond either to a rising or a falling edge. All remaining parameters correspond to those
described in section 4.4.3.
4.4.9
Range level trigger
The Range level trigger only differs from the fixed level trigger in defining a certain range for the trigger
condition (with the parameters Lower range and High range). All remaining parameters correspond to
those described in section 4.4.3.
Manual SAMURAI
48 of 132
SINUS Messtechnik GmbH
4.4
4.4.10
Trigger
Reference spectrum trigger
With the Reference spectrum trigger you may check whether a spectral value lies above, below or within
a certain reference spectrum. The parameters are shown in figure 4.24 and described in table 4.21. The
reference spectrum trigger is only available with the Automations option.
Parameter
Description
Type
Specify whether a value must lie below, above or between two reference spectra to trigger an event.
Checked result
Select a group of values to be monitored for this trigger.
Weight
Specify whether a frequency weighting shall be applied.
Integration/Derivation
Select whether the values shall be integrated or differentiated before trigger analysis.
Reference spectrum 1 Specify the first reference spectrum for checking.
Ref. 1 Offset
Enter an offset value to exceed or undercut Reference spectrum 2.
Reference spectrum 2 Specify the second reference spectrum for checking.
Ref. 2 Offset
Enter an offset value to exceed or undercut Reference spectrum 2.
Table 4.21: Parameters for the reference spectrum trigger
Figure 4.25: Replay Reference spectrum trigger
SINUS Messtechnik GmbH
49 of 132
Manual SAMURAI
4
4.5
THE SETUP-TAB
Output events
SAMURAI can generate so-called output events during the measurement. They can be used for example to
turn on or off or control external devices (e.g. motors or loudspeakers). They can also run any executable
programme on the PC. The types of output events are given and described in table 4.22.
Figure 4.26: Output events
Type
Description
COM port DTR
Sends the status to the DTR pin of the given RS232 port.
COM port RTS
Sends the status to the RTS pin of the given RS232 port.
External executable Runs an executable programme on the PC. You may use this feature to start your own
measurement control programme.
Sound
Output of a WAV file through the standard sound card or output of an acoustic message
through system loudspeaker (f.e. acoustic feedback, when the storage medium is full).
Message
Display of a message with definable text (e.g. triggered output of a message when a certain
speed is reached).
Send message
Send an e-mail or SMS.
TRG_OUT1 or 2
Sends the status to the TRG_OUT1 or TRG_OUT2 pin of the analyzer (see analyzer description). This type is only available for certain analyzer models.
Table 4.22: Output event types
Each timed event in SAMURAI has a start time, which is given as a duration after measurement start. Apart
from that, events may be repeated cyclically. The setup window for timed events in SAMURAI is shown in
figure 4.26 and the parameters are described in table 4.23.
Manual SAMURAI
50 of 132
SINUS Messtechnik GmbH
4.5
Output events
Type
Description
Enable event
Enable or disable the current output event.
Type
Select how an event is triggered. Possible values are:
Timed means that an event is put out at a defined time.
Triggered means that an event is put out when a trigger condition is fulfilled.
At Stop is similar to “Triggered”, but the event is put out at the end of the measurement (at STOP) (e.g. s
on the cooling after a measurement).
On Disk Full means that the event is put out when the corresponding value in the window shown in figure
is reached.
On Battery Low means that the event is put out when the corresponding value in the window shown in fi
10.1 is undercut.
Auto Cal. Check The event is used for the automatic calibration check (Option: Automation).
Time
Enter the measurement time (from start) in seconds after which the event is put out for the first time.
Repeat count
Number of repetitions. An event may be repeated infinite times.
Interval time
If you have selected a repeated event, enter the time interval between the event repetitions.
Trigger
Select the trigger used to put out the event.
Mode
Select in triggered output event mode whether an event is only put out once at a defined time or held
repeated.
Reset time
Time after which an event is reset inevitably.
Rearm time
Time after which an event may be put out again. If the reset time is set to 1 second, for example, and r
time to 2 s while the trigger is continuously ON, the application will generate an output event every 3 secon
Pin Status
Select the desired state for the pin at the COM port when the event is put out.
COM port
Specify the COM port to be used.
Status
Select the desired state for the output trigger pin when the event is put out.
Executable name or file name to open Enter the file name of the executable file to be run by the event.
Command line
Enter the possibly necessary command line switches.
E-mail address
E-mail address to which the message is sent (for server setup see paragraph 10.10).
SMS number
Telephone number of the SMS recipient (for setup see paragraph 10.10).
Subject
Subject line for the e-mail.
Message
Text to be sent via e-mail or SMS.
Table 4.23: Parameters for all output event types
SINUS Messtechnik GmbH
51 of 132
Manual SAMURAI
4
4.6
THE SETUP-TAB
Markers
You may use up to 10 markers to tag one or more parts of a measurement in SAMURAI. Click on the entry
in the setup window to open a window containing the marker settings. The markers setup window is shown
in figure 4.27.
Figure 4.27: Markers setup window
In table 4.24 the parameters for the markers are listed and described.
Parameter
Description
Enable
Un-/Check a box to dis-/enable the marker.
Name
Enter a marker name. You may not use a name twice or leave the name of an enabled marker empty.
Key
SAMURAI allows to activate a marker manually with the keyboard. Select a key from the list. Pressing the key
will toggle the marker state from ON to OFF and vice versa.
External trigger It is also possible to use a trigger to activate the marker. Select an existing trigger from the list. For the definition
of triggers please see section 4.4.
Color
Select a colour to represent the marker state graphically.
Table 4.24: Markers setup window - Parameters
Figure 4.28: History graph with three markers
In figure 4.28 a level history graph is shown with three markers set. There are three ways to activate a
marker: manually by pressing the corresponding key on the keyboard, automatically by a linked trigger or
with the mouse by left-clicking on a marker button in the control bar (figure 9.11).
Manual SAMURAI
52 of 132
SINUS Messtechnik GmbH
4.7
4.7
Default pens
Default pens
You may easily set elements of the graphical display by adjusting the default pen colour and width used in
graphs individually for each channel. The settings are stored to the setup file of the measurement.
If you create a new trace in a graph, the default pen colours and widths are used. This might be useful if
you want to represent different values of one channel in several windows, e.g. the time signal of channel 1
in one window and the FFT spectrum of channel 1 in the next window.
Figure 4.29: Setup default pens
To adjust the current settings select the channel on the left side and change the corresponding settings on
the right side (see figure 4.29). You may only adjust the width of continuous lines; dashed lines always have
a width of 1 pixel. By checking the box Use program defaults you may instruct SAMURAI to adopt the
settings from or to default programme settings.
SINUS Messtechnik GmbH
53 of 132
Manual SAMURAI
5
5
GRAPHICAL DISPLAY
Graphical display
Measured data is displayed in the Measure or Replay window, depending whether you are recording new
data or replaying a recalled measurement. If you adjust the settings for the graphical display of a measurement, these changes will also be adopted for the Replay mode.
5.1
Panes layout
one pane
two panes
horizontal
two panes
vertical
three panes
left
three panes
up
three panes
right
three panes
down
four panes
six panes
2 rows 3 cols
six panes
3 rows 2 cols
nine panes
twelve
3 rows 4 cols
twelve panes
4 rows 3 cols
sixteen panes
Figure 5.1: Panes layout
The graphical display divides windows into panes which may be combined and aligned in several ways (see
figure 5.1). You may adjust the window division in three ways: using the main menu View -> Graphical
Display, the main toolbar or the button Select layout in the graph layout and properties window (see figure
2.12).
The size of the panes can be adjusted freely by dragging the pane separators with the mouse. Use the View
-> Graphical Display -> Arrange panes command to reset the panes to their default size. Double-clicking
inside a pane will enlarge that pane to the full window size. Reverse the operation by double-clicking inside
the pane again.
In the top left corner of each pane a small field is displayed containing the number of the currently displayed
graph. The field allows opening the context menu in Tablet PC mode when right-clicking is not available.
The colour of the field indicates which pane is active at the moment (colours used according to MS Windows
setup).
5.2
Copy graph image
At any time (even when measuring) SAMURAI allows you to copy the image of any displayed graph to the
clipboard for use with other Windows applications. Select a graph, press Strg+C or select the context menu
command Copy Bitmap and paste the image from the clipboard to the target application (e.g. by pressing
Strg+V).
Manual SAMURAI
54 of 132
SINUS Messtechnik GmbH
5.3
5.3
Level Monitor
Level Monitor
The level monitor displays the level of the current electrical input signal. Click on View -> Level Monitor to
enable the monitor. Depending on the orientation (horizontal or vertical) the input channels are displayed in
rows or columns. You may adjust the gain during a measurement using the buttons
and
.
Figure 5.2: Level Monitor
Figure 5.3: Level Monitor properties
You may adjust the display and behaviour of the level monitor in a separate window (see figure 5.3). Rightclick in the monitor display and select Edit Properties... from the context menu.
The parameters are described in table 5.1. Use the four buttons in the lower part of the window to select the
colours of the individual elements.
Parameter
Description
Window orientation
Define the orientation of the input channels in rows or columns.
Bar width
Define the width of the bar displayed for a channel.
Peak-Hold reset time
Define the hold time for the peak value display.
Enable adjust gain but- (Un-)Check this box to dis-/enable the adjust gain buttons.
tons
Table 5.1: Parameters level monitor
NOTICE!
5.3.1
The level monitor is not available in Replay mode, because the data are
not provided by the analyzer.
Drag’n’Drop in the Graph layout and properties window
SAMURAI supports the following drag’n’drop operations for facilitating the setup of graphs with a similar
appearance:
Operation
Result
Drag a graph from the tree and drop it over another The graph style is widely copied from one to the
graph.
other graph (colour, pens etc.).
Drag a graph from the tree root and drop it into a A graph is assigned to the selected window.
pane of the Layout preview.
Table 5.2: Drag’n’Drop
When aiming at a uniform appearance of all graphs, it might be rather time-consuming to set all parameters
for each new graph manually. Therefore, the context menu contains the items Copy Style and Paste Style.
SINUS Messtechnik GmbH
55 of 132
Manual SAMURAI
5
GRAPHICAL DISPLAY
This allows you to adopt parameters as colours or pen styles from other graphs if possible for the current
type of graph.
The possibility to vertically shift the y-axis of certain graphs with the mouse also simplifies the setup procedure. This feature is also available when a measurement is running.
Starting with SAMURAI version 2.0, several y-axes are available for the following graphs: history, vsXRef
and weather data graphs. In these graphs you may move the axes with the mouse.
Furthermore, you may click on the label of a value inside a SLM, HVMA or Vibration Meter graph to open a
window in which you may change the displayed level (see figure 5.4). You may adjust the graph even when
a measurement is running.
Figure 5.4: Select sound level
From the context menu of each graph you may directly select the graph to be displayed in the current pane
(Context menu -> Select graph). You may open the context menu by right-clicking in the graph or by
left-clicking on the number of the graph.
Click on Value Window in the context menu to open a window displaying the current cursor values for the
individual values of the graph. This feature is not available in all graphs.
Using the context menu items All fonts... and All fonts/All graphs... you may change the font of the currently
selected graph (or also for all graphs).
Manual SAMURAI
56 of 132
SINUS Messtechnik GmbH
5.4
5.4
5.4.1
Detailed graph description
Detailed graph description
Spectrum
This graph is used to display spectral data as 1/3 octave spectrums, FFT spectrums (figure 5.5) or to display
data from the Cross Analysis option . On the abscissa (x-axis) the frequency/order is displayed and on
the ordinate (y-axis) the amplitude is displayed. It is possible to create an unlimited number of traces in
this graph, the first trace having a special significance. The first trace defines the scaling of the frequency
axis (logarithmic for 1/3 octave spectra and linear for FFT spectra). The first trace also defines the physical
unit of the y-axis and its limits when scaling automatically. These limits are calculated from the gain of the
corresponding channel. The physical unit defines which further values can be displayed in a spectrum graph.
Figure 5.5: Spectrum graph properties – Level 0
Selection
Physical unit Display in physical units Display in dB-values
RMS
Pa
Peak
Pa
Peak-Peak
Pa
2
EU
PSD
2∼
x
√
x
√
2· x
2
EU =P a
P a2
Hz
x
x
y = 20 · log ref
y + 3 dB
y + 9 dB
2
x2
∆f
y
y − 10 · log( ∆f
)
Hz
Table 5.3: Description of Displayed Units for FFT-Spectrum-Graphs
ref = dB-reference value of the sensor (Transducer database)
∆f = frequency resolution
PSD = Power spectrum density
The Spectrum graph properties are divided into five groups (five items in the window Graph Layout and
Properties). The first group is displayed when you select the root item in the tree structure. This group
contains the trace parameters. A spectrum graph can have more than one trace. However, you can display
and edit only one at a time. The text in the top line displays the currently selected trace. Use the Previous and
Next buttons to navigate through the trace list. In table 5.4 the parameters shown in figure 5.5 are described.
SINUS Messtechnik GmbH
57 of 132
Manual SAMURAI
5
GRAPHICAL DISPLAY
Parameter
Description
Result displayed
Select the data to be displayed. Here SAMURAI only offers the sources that are compatible with the
current graph type (e.g. FFT1 CH1 for Spectrum graphs).
Unit
Select the unit for FFT spectra: RMS, Peak, Peak-Peak, EU2 and PSD (for details see table 5.3).
Weight
Select the weighting trace in the frequency domain. Several traces (e.g. A and C) are already
provided, but it is possible to add new traces (see paragraph ??). The format is the same as in
NWWin.
Function
Several mathematic functions are available for processing data (see table 5.5).
Display
You may display a spectrum in several ways, for example as line, bar, bar contour (staircase function)
or roof top.
Value
Not available for spectrum graphs, generally selection of values which may vary with the different
settings for Result displayed.
Integration/Derivation
Define whether and how the values are integrated or differentiated.
Click on this button to open a window for configuring a mathematical operation for the selected trace.
Currently reference spectra may be subtracted from the selected spectrum.
Operation. . .
Use default channel pen Check this box to use the default pen for the selected trace (see paragraph 4.7).
Custom Pen
Click to edit the pen used for the current trace.
Replicate settings. . .
New trace
Use this button to define which settings are replicated when creating a new trace.
Create a new trace for the selected graph with just one click.
Remove trace
Remove the current trace from the selected graph.
Table 5.4: Parameters Spectrum graph - Level 0
Selection
Description
Live
currently measured value
Min, Max, Leq, SEL
Minimum, maximum, power average, exposition level based on 1 s for the expired measurement time
Power average all channels
Current average value of all enabled analysis operations
Leq Power average all channels Time-weighted power average of the previous value for the expired measurement time
At Max (LIN)
Display spectrum with highest sum value when using several spectra.
At Max (A)
Display spectrum with highest sum value when using several spectra, but with
A-weighting.
Table 5.5: Description of function settings
NOTICE!
In a SAMURAI spectrum graph only values having the same physical unit
or dB can be displayed simultaneously.
Figure 5.6: Properties Spectrum graph – General
Manual SAMURAI
58 of 132
SINUS Messtechnik GmbH
5.4
Detailed graph description
The General item provides the parameters shown in figure 5.6 and described in table 5.6.
Parameter
Description
Graph name
Enter the name of the graph.
Border pen
Click to define the pen used to draw the border of the graph.
Cursor pen
Click to define the pen used to draw the cursor.
Inside background
Select the colour of the background inside the graph borders.
Outside background Select the colour of the background outside the graph borders.
Header layout
If you want to display more than one trace in a graph, it might be useful to define your own header using
the following options:
horizontal The header data will be displayed in one line only.
vertical The data will be displayed in several lines.
Horizontal (n rows) The data will be displayed horizontally in n rows.
Short description
In the “horizontal” mode select the short description of the trace name if necessary.
Font
Click to adjust the header font.
Table 5.6: Parameters spectrum graph - General
Click on the x-axis to open the settings for the horizontal axis. The parameters in figure (see figure 5.7) are
described in table 5.7.
Figure 5.7: Parameters spectrum graph - x-axis
Parameter
Description
Auto scale on first trace
Check this box if SAMURAI shall calculate the x-axis limits. The values of the first trace in the graph
will be used for the calculation.
Start
Enter the x-axis start value when auto scale is disabled.
Stop
Enter the x-axis stop value when auto scale is disabled.
Division
Enter the number of grid divisions. The main grid dividers (lines) are emphasised in most cases and
are labelled at the axis. The lines of the sub-grid have no labels at the axis.
Main grid
Click here to adjust the main grid settings.
Sub-grid
Click here to adjust the main sub-grid settings.
Font
Click here to adjust the font settings for the x-axis.
Axis scaling
The x-axis is generally scaled using the data of the first trace displayed. Click here to adjust scaling
by selecting a 1/3 octave spectrum with a linear frequency axis, for example.
Table 5.7: Parameters spectrum graph - x-axis
Click on the y-axis item to view the settings for the vertical axis. The y-axis parameters are shown in figure
5.8 and described in table 5.8.
NOTICE!
SINUS Messtechnik GmbH
You may also move the y-axis directly within the graph by dragging it with
the mouse.
59 of 132
Manual SAMURAI
5
GRAPHICAL DISPLAY
Figure 5.8: Parameters spectrum graph - y-axis
Parameter
Description
Auto scale on first trace
Check this box if SAMURAI shall calculate the y-axis limits. The calculation is based on the gain and
the sensitivity of the transducers at the channel of the first trace. A maximum range for the expected
signals is determined. This range and the settings below are the basis for the upper and lower axis
limits in the graph. The limits do not depend on the actually measured signal.
Start
Enter the y-axis start value when auto scale is disabled.
Stop
Enter the y-axis stop value when auto scale is disabled.
Division
Enter the number of grid divisions. The main grid dividers (lines) are emphasised in most cases and
are labelled at the axis. The lines of the sub-grid have no labels at the axis.
Autorange amplitude
This parameter is only available when autoscaling is enabled and the axis unit is dB or EU logarithmic. If Automatic is selected, SAMURAI defines the y-axis range limits as described above (see
“Auto scale on first trace”). Use the remaining options to select a fixed range either from the upper
or from the lower limit of the maximum expected range.
Linear scale factor
This parameter is only available when autoscaling and linear EU-axis are set. The y-axis range
always starts at 0. The upper limit results from the division of the maximum possible range by the
linear scale factor.
EU units
Check this box to enable the display in physical units (Engineering Units).
EU logarithmic
Check this box to use logarithmic scaling of the y-axis for physical units (Engineering Unit).
Select units...
Open a window for selecting a unit for the y-axis.
Numeric format
Select Fixed or Exponential format.
Precision
Select the number of digits to the right of the decimal point.
Main grid
Click here to adjust the main grid settings.
Sub-grid
Click here to adjust the main sub-grid settings.
Font
Click here to adjust the font settings for the y-axis.
Table 5.8: Parameters spectrum graph - y-axis
Use the Reference spectrum item to define max. two additional reference spectra for a graph. The reference spectra parameters are shown in figure 5.9 and described in table 5.9.
Figure 5.9: Setup spectrum graph - Reference spectrum
Manual SAMURAI
60 of 132
SINUS Messtechnik GmbH
5.4
Parameter
Detailed graph description
Description
Reference spectrum [n] Select the desired Reference spectrum.
Position
Select the position of the reference spectrum: Background or Foreground (relative to measuring curve).
Display
Select the display mode: Line or Bar contour.
Offset
Define an offset value to move the reference spectrum vertically.
Pen
Click here to adjust the pen settings for the reference spectrum.
Table 5.9: Parameters spectrum graph - Reference spectrum
You may set a fill effect for the areas below or above the trace in a reference spectrum. Table 5.10 describes
the individual settings of the fill effect parameter.
Setting
Description
(none)
No fill effect is used for the reference spectra.
Fill above/inside
The area above the reference spectrum or between two reference spectra is filled with the selected
colour.
Fill below/outside
The area below the reference spectrum or outside two reference spectra is filled with the selected colour.
Pattern above/inside
The area above the reference spectrum or between two reference spectra is filled with the selected
colour.
Pattern below/outside
The area below the reference spectrum or outside two reference spectra is filled with the selected colour.
Shade
The area between two reference spectra is filled with a colour transition (shade).
Table 5.10: Parameters spectrum graph - Fill effect for reference spectra
The fill effects requiring two reference spectra are only applied if the parameter Position is the same.
Cursors in the Spectrum graph
Spectrum graphs have a cursor which you may position with the mouse or the keyboard (with keyboard only
in the selected graph). The value at the cursor position is displayed in the header of the graph right to the
curve name or in the values window.
Figure 5.10: Spectrum graph with Harmonic cursor
The harmonic cursor from figure 5.10 is activated in the context menu of the spectrum graph. There are two
types of harmonic cursors.
Moveable In this mode the local maximum near the current cursor position is located and the cursor is
moved to this position. This feature is helpful if machines with variable speeds are examined (f.e.
automatic repositioning of the cursor on engine run-up).
Fixed In this mode the cursor is not repositioned automatically.
SINUS Messtechnik GmbH
61 of 132
Manual SAMURAI
5
5.4.2
GRAPHICAL DISPLAY
History graph
This graph is predestined for displaying level histories. The horizontal axis represents the time, while the
vertical axis represents the amplitude (figure 5.11). You may add an unlimited number of traces to the graph.
If you create several traces, the data of the first trace are used for auto-scaling and the displayed unit. The
unit of the first trace defines which other values can be displayed in the same graph. You may only display
values with the same physical unit or levels in dB in SAMURAI.
The history graph is the only graph that can display the marker status (as coloured bar at the top or bottom).
Click on the General item to open the settings for markers’ display of the current history graph. You may
adjust the width and the position of the markers. Figure 4.28 shows an example of a history graph with
three marker traces. The colour of the markers corresponds to that defined in the Markers setup window
(section 4.6). Please specify the time frame size for history graphs with Time as unit for the x-axis (see
x-axis). The displayed time position is moving (“scrolling”) during the measurement or replay according to
the expired time. The parameters available for adjusting are generally the same as those described in the
tables 5.4, 5.6, 5.7 and 5.8.
Figure 5.11: History graph with cursor
NOTICE!
You may also move the y-axis directly within the graph by dragging it with
the mouse.
Cursor in the History graph
In replay mode the history graph has a cursor. You may position it with the mouse or the keyboard. The
cursor position is displayed at the top right in the graph. You may change the display settings with the button
Cursor pen in the General (similar in fig. 5.6).
Values in the history graph
In the history graph various values may be represented. The most important are described in the following.
History graph for spectral data In this case you may select individual spectral lines or the sum of the lines
defined under Analysis using the parameter Bin (table 5.4). The frequency weighting for the displayed
spectrum may be enabled with Weighting. With Function various calculations may be performed with
the displayed value. Possible values are: Live (current value), Min, Max, Leq, SEL, Power Average
all channels and Leq Power Average all channels.
History graph for SLM values For the display of SLM values the following values are possible for the parameter Value:
Manual SAMURAI
62 of 132
SINUS Messtechnik GmbH
5.4
Detailed graph description
Bin
Description
LtX
Current value without time weighting
Fast X
FAST-weighted sound level (τ =125 ms)
SLOW X
SLOW-weighted sound level (τ =1 s)
Impulse X
Impulse-weighted sound level (τrising =35 ms, τf alling =1.5 s)
Peak X
Maximum sound pressure level
Fast Max(t) X
FAST-weighted maximum of last Delta time (settings see paragraph 4.2.4, table 4.14)
Fast Min(t) X
FAST-weighted maximum of last Delta time
Slow Max(t) X
SLOW-weighted maximum of last Delta time
Slow Min(t) X
SLOW-weighted minimum of last Delta time
Impulse Ma(t) X
Impulse-weighted maximum of last Delta time
Impulse Min(t) X Impulse-weighted minimum of last Delta time
Set the frequency weighting Z, A or C for the value X. With Function various calculations may be
performed with the displayed value. Possible values are: Live (current value), Leq, SEL, Power
Average all channels, Leq Power Average all channels and the different percentiles.
Since SAMURAI version 2.0 it is allowed to display levels with different physical values in one history graph.
In this case one further y-axis is added for each physical value. Define the appearance of the additional axes
via More Axis (parameters see table 5.11).
Parameter Description
Start
see table 5.8
Stop
see table 5.8
Div.
Corresponds to the parameter Division in table 5.8.
H(%)
Height of the axis relative to the first y-axis (in per cent).
Color
Define the colour of the axis. Check the box Default to ignore the colour setting and to adopt the colour
of the trace relating to this axis.
Default
Use the colour of the trace relating to the axis as default.
Table 5.11: Parameters for “More Axis”
5.4.3
Sonogram graph
You may display the amplitude versus time/rotational speed and frequency. The horizontal axis is time or
speed, the vertical axis is frequency and the amplitude is represented by a colour. Please note that you may
only display the result of one calculation (only one trace).
The settings for the sonogram graph are similar to the previously described graph types. Please refer to the
previous paragraphs. The following overview outlines the analogue setup windows:
General as for spectrum graph (figure 5.6 or table 5.6)
x-axis as x-axis for time signal graph (figure 5.17 or table 5.17) Select time, tachometer channels and
AUX channels for the parameter Axis unit . This allows displaying spectra versus rotational speed,
pressure or temperature, for example.
y-axis as x-axis for spectrum graph (figure 5.7 and table 5.7)
z-axis as y-axis for spectrum graph (figure 5.8 and table 5.8)
SINUS Messtechnik GmbH
63 of 132
Manual SAMURAI
5
GRAPHICAL DISPLAY
Figure 5.12: Color scale settings
The colour scale setup page is new allowing you to assign colours to amplitudes. The colour scale consists
of individual points (amplitudes) being associated with particular colours. The colour between two points
is automatically calculated as transition. By default, only two key points are defined for the minimum and
the maximum of the scale. You may, however, add an unlimited number of points. The amplitude values of
the points are displayed below the coloured bar. SAMURAI provides several operations for editing the scale
which are described in table 5.12.
Operation
Description
Add a new key point
Click directly below the colour bar on a space with no key points.
Remove a key point
Select the key point and drag it outside the bar, or select a key point and click
on the Remove current color button.
Change the level of a key point
Select the key point and move it to the desired bar position with the mouse.
Change the colour of the current key point Select the key point to be changed. Double-click on the Current color and
select the desired colour.
Table 5.12: Parameters colour scale
SAMURAI supports storing and loading customized colour scales. Use the buttons Load scale and Save scale .
Finally, you may hide the colour scale representation in the sonogram graph by checking the box Do not
display the color scale.
5.4.4
Waterfall graph
As the sonogram graph the three-dimensional waterfall graph is used to display frequency- and time-based
data. The amplitude is displayed by the height (y-axis) and a colour in a three-dimensional representation.
The x-axis represents the frequency; the z-axis represents time or speed. It is only possible to display data
for a single result on a waterfall graph.
The settings for the waterfall graph are similar to the previously described graph types. Please refer to the
paragraphs above. The following overview outlines the analogue setup windows:
General as for spectrum graph (figure 5.6 and table 5.6)
x-axis as x-axis for spectrum graph (figure 5.7 and table 5.7)
y-axis as y-axis for spectrum graph (figure 5.8 and table 5.8)
z-axis as x-axis for time signal graph (figure 5.17 or table 5.17)
Color scale as for sonogram graph (figure 5.12 and table 5.12)
The 3D Layout window is uniquely provided for the waterfall graph. You may use the three parameters to
adjust the 3D characteristics of the graph. The parameters are described in table 5.13.
Manual SAMURAI
64 of 132
SINUS Messtechnik GmbH
5.4
Detailed graph description
Figure 5.13: Parameters Waterfall graph - 3D layout
Parameter
Description
Hidden lines Check the box to display hidden lines.
hRatio
The height of the vertical axis as a percentage of the height of the window (20 - 80 % ).
Angle
Viewing angle. Adjusting the angle will rotate the graph (5 ◦ - 90 ◦ ).
Table 5.13: Parameters Waterfall graph - 3D Layout
5.4.5
Sound Level Meter graph
The SLM Graph is a freely adjustable Class 1 sound level meter complying with the IEC 60651, IEC 60804
and DIN EN 61672-1:2003 standards. The sound level meter simultaneously uses the frequency weightings
A, C and Z as well as the time weightings Fast, Slow, Impulse and Peak.
Figure 5.14: Sound level meter
The sound level meter of SAMURAI displays two main values as figures and in a bar graph and eight secondary values in a table. You may select any sound level calculated by SAMURAI for main or secondary
value display. Please note that only levels of one main channel are displayed in a SLM graph (see paragraph
4.1.1). You may arrange the bar display of the main values horizontally or vertically. The colours of the bars
correspond to the background colours of the fields in which the figures are displayed.
You may replace the secondary values table by a single history graph for both main values. To do so check
the box Replace the table with the time history of the Left and Right values in figure 5.15. Table 5.14
lists all sound levels calculated by SAMURAI. The most A-weighted level values can also be displayed with
“Noise Floor Correction”. Then the values are labelled with [nfc] (see also section 2.2 and table 2.4 and
figure 5.4)..
SINUS Messtechnik GmbH
65 of 132
Manual SAMURAI
5
GRAPHICAL DISPLAY
Level
Description
LZF
SPL (Sound Pressure Level) with time constant FAST (time constant 125 ms), no weight
LZFmax
Maximum level of LZF
LZFmin
Minimum level of LZF
LAF
SPL with time constant FAST, A-weighted
LAFmax
Maximum level of LAF
LAFmin
Minimum level of LAF
LZS
SPL with time constant SLOW (time constant 1 s), no weighting
LZSmax
Maximum level of LZS
LZSmax
Minimum level of LZS
LAS
SPL with time constant SLOW, A-weighted
LASmax
Maximum level of LAS
LASmin
Minimum level of LAS
LZI
SPL with time constant IMPULSE (time constant 35 ms), no weighting
LZImax
Maximum level of LZI
LZImin
Minimum level of LZI
LAI
SPL with time constant IMPULSE, A-weighted
LAImax
Maximum level of LAI
LAImin
Minimum level of LAI
LZeq(t)
Equivalent Continuous SPL over the storage delta time (short Leq) no weighting
LAeq(t)
Equivalent Continuous SPL over the storage delta time (short Leq) A-weighted
LZeq
Equivalent Continuous SPL no weighting
LAeq
Equivalent Continuous SPL A-weighted
LZE
Sound Exposure Level (SEL) no weighting
LAE
Sound Exposure Level (SEL) A-weighted
LZIeq
Equivalent Continuous SPL no weighting, with time constant IMPULSE
LAIeq
Equivalent Continuous SPL A-weighted, with time constant IMPULSE
LAIeq -LAeq
(Equivalent Continuous SPL A-weighted, with time constant IMPULSE) " (Equivalent Continuous SPL A-weighted)
LZpk(t)
Peak value over the storage delta time (t) no weighting
LZpeak
Peak Sound Pressure no weighting
LApk(t)
Peak value over the storage delta time (t) A-weighted
LApeak
Peak Sound Pressure A-weighted
LAF1 ,LAF5
.. LAF99
Percentile level calculated over the LAF value. Seven standard predefined percentiles (1, 5, 10, 50, 90, 95, 99)
plus three user-defined percentiles are available (chapter 10 )
LAtmn(t)
Every n seconds the maximum value of the last n seconds of LAF is calculated (complying with DIN 45645-1). This
values depends on the setting Taktmaximal in table 4.14. (n =1 s, 3 s, 5 s)
LAtmn
Equivalent Continuous SPL calculated from the LAtmn(t) for the complete measuring time according to DIN 45645-1.
This values depends on the setting Taktmaximal in table 4.14. (n =1 s, 3 s, 5 s)
LAIeq -LAeq
(Equivalent Continuous SPL, A-weighted, with time constant Impulse) - (Equivalent Continuous SPL, A-weighted)
LC-LA
(C-weighted SPL) - (A-weighted SPL)
LCeq-LAeq
(C-weighted Equivalent Continuous SPL) - (A-weighted Equivalent Continuous SPL)
LAtmn-LAeq
(Equivalent Continuous SPL calculated from the Taktmaximal levels for the complete measuring time)-(A-weighted
Equivalent Continuous SPL for the complete measuring time); (n =1 s, 3 s, 5 s)
LCFmax-LAFmax (Level maximum of LCF for the current measuring time) - (Level maximum of LAF for the current measuring time)
Table 5.14: calculated sound pressure levels
Manual SAMURAI
66 of 132
SINUS Messtechnik GmbH
5.4
NOTICE!
Detailed graph description
In table 5.14 frequency weighting X may be replaced by the weightings Z,
A and C. The various frequency weighting operations are available simultaneously.
Figure 5.15: SLM graph setup - Level 0
The basic sound level meter parameters are given and described in table 5.15.
Parameter
Description
Channel displayed
Select the source channel for the sound level values.
[Left value] Value
Select the left main value from the list.
[Left value] Font
Click to select the font for the left main value.
[Left value] Color
Click to select the colour of the left main value.
[Right value] Value
Select the right main value from the list.
[Right value] Font
Click to select the font for the right main value.
[Right value] Color
Click to select the colour of the right main value.
Update display rate
Enter the update interval for the graph in seconds.
Replace the table with the time history Check this box to replace the SLM secondary values table by a single history graph.
Table 5.15: Parameters SLM - Level 0
Figure 5.16: Parameters SLM graph - Bars
The parameters below General are the same as for the history or the sonogram graphs. Please refer to the
sections 5.4.2 and 5.4.3. For the parameters of the main value bar display click on Bar in the tree structure
on the left. The history graph parameters in the SLM window are self-explaining and not described here.
SINUS Messtechnik GmbH
67 of 132
Manual SAMURAI
5
GRAPHICAL DISPLAY
Parameter
Description
Autoscale
Check this box to set autoscaling by SAMURAI.
Start
Enter the lower limit for the bar when autoscale is enabled.
Stop
Enter the upper limit for the bar when autoscale is enabled.
Division
Enter the number of scale divisions.
Autorange amplitude
Set the display range. For explanation see table 5.8
Bar display
Select horizontal or vertical arrangement of the bar display.
Use Warning
and Alarm
indication
Check this box to facilitate reading the display from a distance. The colour of the display bar will be
changed from a certain level.
Warning level
Specify warning limit level from which the bar colour is changed (yellow in most cases).
Alarm level
Specify alarm limit level from which the bar colour is changed (red in most cases).
Warning / Alarm color
Click to set the bar colour change when reaching a certain warning or alarm level.
Background
Click to set the background colour for the whole bar.
Empty color
Select a colour for the empty bar display areas.
Bar Font
Click to set the font used for the bar.
Table 5.16: Parameters SLM - Bar
5.4.6
Time signal graph
This graph is used to display time signal data similarly to an oscilloscope. The x-axis represents the time,
while the y-axis represents the amplitude.
As in the history graph the time signal display moves. There are two modes:
1. The data are displayed from left to right in the pane over the specified pane width. When the right
pane limit is reached, the new data are displayed at the left side, but the pane is scrolled to the next
period. Thus, the previously displayed data are moving to the left.
2. The data are displayed from left to right in the pane over the specified pane width. The next data block
is displayed at the left window limit without scrolling.
The length of the time frame must be a multiple of 0.02 seconds. The value entered is rounded to the nearest
0.02 s multiple if necessary. The first mode (scroll data) is only available for time frames longer than 2 s; if
shorter, the data are displayed in blocks. The y-axis parameters are shown in figure 5.17 and described in
table 5.17.
Figure 5.17: Parameters time signal graph - x-axis
Manual SAMURAI
68 of 132
SINUS Messtechnik GmbH
5.4
NOTICE!
Detailed graph description
Similar to the history graph a cursor is available for this graph in the replay
mode (for details see paragraph 5.4.2).
Parameter
Description
Axis unit
Always the same for time signals (time).
Division
Enter the number of grid divisions. The main grid dividers (lines) are emphasised in most cases and
are labelled at the axis. The lines of the sub-grid have no labels at the axis.
Time
Enter the length of the time frame in seconds.
Enable scroll for
time signal
Check this box to display the data in a scrolling pane (time frame > 2 s). If unchecked, the data are
displayed in blocks similarly to an oscilloscope.
Main grid
Click here to adjust the main grid settings.
Sub-grid
Click here to adjust the main sub-grid settings.
Font
Click here to adjust the font settings for the x-axis.
Table 5.17: Parameters time signal - x-axis
5.4.7
Pure tone graph
The Pure tone graph is used to examine the presence of pure tones in a signal. Basically it is a spectrum
graph which can only display one trace for analysis: the minimum 1/3 octave spectrum (spectrum of the
minimum 1/3 octave levels over time).
The graph has a cursor which can be positioned by clicking with the mouse or using the arrow keys on
the keyboard. The 1/3 octave centre frequency as well as the 1/3 octave value at the cursor position are
displayed as a figure in the header of the graph and in the value window. A pure tone graph detects which
levels of the minimum 1/3 octave spectrum differ from their two adjacent levels by more than defined value.
After that the levels are compared to a band spectrum using the loudness contours (according to ISO 226).
If no value (in phones) in the band spectrum exceeds or equals the contour, the 1/3 octave band is indicated
by a yellow/red flashing 1/3 octave bar during the measurement; after the measurement a red bar is used.
The loudness contours are always displayed in the graph. Additionally you may display an optional FFT
spectrum in the graph. No calculation is performed with the FFT spectrum; it is only displayed as a reference
and therefore not given above as trace available in a pure tone graph.
Figure 5.18: Parameters Pure Tone graph
The parameters below General, x-axis and y-axis correspond to those of the spectrum graph, see paragraph 5.4.1. The parameters for the pure tone graph are described in table 5.18.
SINUS Messtechnik GmbH
69 of 132
Manual SAMURAI
5
GRAPHICAL DISPLAY
Parameter
Description
Difference from
previous band
The difference between any band and its predecessor, required to recognize a pure tone.
Difference from next band
The difference between any band and its successor, required to recognize a pure tone.
Search includes first and last The first and last band only have one adjacent band. If this box is checked, the first and last
band
band are included in the search for pure tone bands. They are only compared to their one
adjacent band (left or right).
Normal equal loudness
contours
Select the standard underlying equal loudness contours.
Tone display
Select the two colours used to indicate the detected pure tone.
Loudness display
Select the pen and font used to display the equal loudness contours.
FFT Display
Enable the FFT display option and adjust the corresponding pen if necessary.
Table 5.18: Parameters - Pure Tone Graph
5.4.8
Tachometer graph
Figure 5.19: Tachometer graph
The Tachometer graph is used to display the RPM or velocity values coming from the tachometer channels
(section 4.1.4). The graph is similar to the tachometer in vehicles.
Figure 5.20: Parameters tachometer graph - Level 0
Manual SAMURAI
70 of 132
SINUS Messtechnik GmbH
5.4
Detailed graph description
The basic parameters for a tachometer graph are shown in figure 5.20. In table 5.19 the parameters are
described. The parameters in General basically correspond to those in table 5.6.
Parameter
Description
Result displayed
Select the source channel for the values.
Scale Start
Enter the start value for the scale division.
Scale Stop
Enter the stop value for the scale division.
Show scale as RPM x 100 Set scale change by the factor 100.
Scale font
Select the font of the scale labels.
Unit font
Select the font of the displayed unit.
Digit font
Select the font of the RPM value.
Digit background
Select the background colour of the RPM value.
Needle color
Select the colour of the display needle.
Table 5.19: Parameters tachometer graph - Level 0
5.4.9
vsXREF graph
The vsXREF graph allows you to use various reference values for the x-axis. Currently only the results
coming from the tachometer and auxiliary channels can be used. The graph allows you to display a level
with reference to rotational speed or temperature values. You may add an unlimited number of traces to the
graph. As with the history graph, you may use several axes. The adjustable parameters are the same as for
the history graph (see paragraph 5.4.2).
SINUS Messtechnik GmbH
71 of 132
Manual SAMURAI
6
6
DATA STORAGE
Data storage
SAMURAI always stores measured data to the local hard disk. Therefore you must always specify a valid
working folder . When the programme is running a certain volume of the measured data is kept in the working
memory. The default Working Folder is <SAMURAI_Inst_Pfad>\SHTMP. You may select a different working
folder in the main menu via Tools -> Working folder. You may not select a network directory because it
can be disconnected at any time. However, you may fix an external drive as working folder (e.g. USB 2.0,
Firewire, CardBus or CF-Card).
NOTICE!
The installation directory may vary depending on the operating
system.
The installation directory for Windows XP usually is
C:\Programme\SAMURAI 2.x.
For Windows Vista and Windows 7 it is C:\Benutzer\All Users\SINUS
Messtechnik GmbH, Leipzig\SAMURAI 2.x.
Figure 6.1: Browse window
At start SAMURAI verifies if the previously selected working folder exists. If the folder is found, it is used.
If not, the default working folder is used. The current working folder is displayed in the status bar of the
Browse window.
A measurement is always stored to a subfolder of the working folder. The data are stored in a proprietary
format which may not be read directly by other applications. Several subfolders and files will be created in
a single measurement folder. If you want to copy a measurement manually, you always have to copy the
complete measurement folder.
As in other SAMURAI windows you may move the cursor to a measurement in the Browse window to get a
tool tip with further information on that measurement. As in the Windows Explorer you may switch the display
to Large Icons, Small Icons, List and Details. Furthermore the measurements can be sorted by Name, Date,
Duration or Size. Click on View -> Browse in the main menu to enable the desired options.
The commands available in the Browse window context menu are listed in the Table 6.1.
Manual SAMURAI
72 of 132
SINUS Messtechnik GmbH
6.1
Select working folder
Command
Description
Recall
Recall the selected measurement.
Open in the Data Recall/Load the selected measurement and open it in the Data Browser.
Browser
Post Processing
Open selected data range in the post-processing window (Option: Post Processing)
Audio comment
Replay the audio comment of the selected measurement. The command is only available if the measurement has an audio comment (indicated by the yellow symbol in the icon of the measurement ).
View
Select Large Icons, Small Icons, List or Details as display option and/or the display font.
Arrange Icons
Define the criteria for sorting the displayed measurements (name, date, etc.).
Line up Icons
Align the measurements with a grid.
Delete
Delete the selected measurement(s). SAMURAI asks for confirmation before actually deleting the measurement(s).
Rename
Rename the selected measurement.
Table 6.1: Parameters context menu - Browse window
6.1
Select working folder
During a measurement SAMURAI stores all data to the current working folder. For the efficient management
of large data volumes SAMURAI provides the option to create several working folders and to change between
them. Via Tools -> Working folder you may open a window (see figure 6.2) in which at least one (max.
100) folder is listed.
Figure 6.2: Select working folder
In the first line in this window the current working folder is displayed. In the second line you may specify
the maximum number of folders in the list. To change the current working folder double-click on or select an
entry in the folder list and confirm with Ok. If a folder on the hard disk is to be used as working folder, the
icon of this folder is changed ( ). This helps you to identify a SAMURAI working folder within the Windows
Explorer quickly.
SINUS Messtechnik GmbH
73 of 132
Manual SAMURAI
6
DATA STORAGE
Button
Description
Add...
Click to open a Windows standard dialogue for selecting a folder. If the selected folder is no SAMURAI
working folder, the programme asks you to confirm the folder as working folder.
Remove
Click to remove a folder from the working folder list (not from the hard disk). This command can not by
applied to the current working folder.
Rename
Rename a folder. This command can not by applied to the current working folder.
Select
Click to open a window in which the hard disk may be searched for SAMURAI working folders (see
figure 6.3).
Advanced settings. . . Open a window for setting additional parameters (for description see section 6.1.2).
Table 6.2: Edit the working folder list
6.1.1
Search for working folders
Figure 6.3: Search for working folders
You may select the drives to be searched in the upper section of the window; there you can also start the
search operation. When the search operation has been completed and folders were found, these are displayed in a list. Now you may select a folder and click on Remember to add the folder to the list of working
folders. Click on Set to normal folder to add and select the folder.
6.1.2
Advanced settings for a working folder
In longterm measurements it might be useful to regularly delete data. Therefore SAMURAI allows you
to limit the number of measurements in the working folder. You may open the setup window by clicking on
Advanced settings. . . in the window shown in figure 6.2. The parameters are described in the following table 6.3.
Figure 6.4: Advanced settings - Working folder
Manual SAMURAI
74 of 132
SINUS Messtechnik GmbH
6.2
Parameter
Disk usage
Description
Limit the number of measurements in the se- Check this box to limit the number of measurements in the working folder.
lected Working Folder
Delete measurements older than a predefined Enter the number of days after which a measurement shall be deleted.
number of days
Leave a maximum number of measurements in Maximum number of measurements in the working folder. The oldest measurefolder
ment will be deleted.
Zip and archive measurement before deleting
Check this box to zip and copy the measurement to the archive folder before it is
deleted.
Table 6.3: Parameters - Advanced settings for working folders
6.2
Disk usage
The amount of data that can be generated by a multi-channel analyzer may be huge. For short-time measurements, modern hard disks are in any case big enough. In the case of multi-channel longterm measurements, however, the required storage shall be estimated roughly before measuring. An example follows as
explanation:
We examine an audio measurement with a bandwidth of 20kHz, 1/3 octave from 20 Hz to 20 kHz (every
0.12 s), a FFT spectrum with 400 lines and SLM values (every 0.125 s). The data are stored in the IEEE
float format and therefore require 4 bytes per value.
Time signal (Block) = 1024 * 4 Bytes = 4096
Bytes 1/3 octaves = 31 * 4 Bytes = 124 Bytes
FFT = 401 * 4 Bytes = 1604 Bytes
SLM = 10 * 4 = 40 Bytes
Thus, the size of one second signal is:
Time signal
1/3 octaves
FFT = FFT *
SLM = SLM *
= Time signal * 50 = 204800 Bytes
= 1/3 octaves * 8 = 992 Bytes
50 = 80200 Bytes
8 = 320 Bytes
The total data storage consumption for 1s is 286312 bytes. 1 hour will require about 0.96 GBytes and a oneday measurement will require 23.03 GBytes of storage. Of course, if more channels are used all figures must
be multiplied by the number of channels. For this reason only those data shall be stored during a longterm
measurement which are actually required. Furthermore, SAMURAI provides the option to record data only
if a trigger condition is fulfilled (section 4.4). In order to help you calculating the storage requirements,
SAMURAI displays an estimation of the disk space consumption per hour and per day in the Status window.
Since it might not be predicted how often a trigger event occurs, you may enter a percentage specifying
an estimate number of occurrences in the general preferences (see section 10). Based on the specified
percentage an estimation of the required storage is given in the Status window.
6.3
Monitoring disk consumption
SAMURAI provides two options to monitor storage consumption:
• Verification of the free storage in the working folder at measurement start. If a predefined limit is
undercut, a warning is displayed.
• Monitoring of the free storage when measuring and stopping the measurement when undercutting a
predefined value. When using a Windows operating system a certain hard disk volume shall always
be available otherwise major operating system failures may occur.
You can define the limit values for both cases in the general preferences (see section 10).
SINUS Messtechnik GmbH
75 of 132
Manual SAMURAI
6
6.4
DATA STORAGE
SAMURAI data format
SAMURAI, version 1.7 or higher, does not only store measurement data, but also a description how the
data were stored. Thus, other software manufacturers have the opportunity to offer a tool to import SAMURAI measurements to their programmes. Furthermore, customers with the necessary experience have the
possibility to process the data of only one SAMURAI measurement, if of special interest.
The description of the measurement data is included in a XML document with the file name DataDescription.XML in the folder of the corresponding measurement. It contains information on reading binary files
(number format, number of rows and columns for multidimensional values etc.) and all details for the conversion of the stored values to the correct physical unit (information on used sensor, unit).
In the following an example of a description file is given.
<?xml version="1.0" encoding="windows-1250"?>
<data>
<measurementstart>2008-02-15 10:43:35</measurementstart>
<result>
<name>Overload</name>
<binaryfilename>.\00000009_0_1\DATA.DAT</binaryfilename>
<datatype>DWORD</datatype>
<deltatime>0.02</deltatime>
<numcolumn>1</numcolumn>
<numrow>4919</numrow>
<bit0>CH1</bit0>
</result>
<result>
<name>Underrange</name>
<binaryfilename>.\00000009_0_2\DATA.DAT</binaryfilename>
<datatype>DWORD</datatype>
<deltatime>0.02</deltatime>
<numcolumn>1</numcolumn>
<numrow>4919</numrow>
<bit0>CH1</bit0>
</result>
<result>
<name>Signal1</name>
<binaryfilename>.\00000064_2_1\DATA.DAT</binaryfilename>
<datatype>float</datatype>
<deltatime>0.02</deltatime>
<numcolumn>1024</numcolumn>
<numrow>4919</numrow>
<transducer>
<guid>GUID_4A44A8DE-04CF-43DB-ABDD-DB4AA56DB593</guid>
<name>Default Microphone</name>
<serial/>
<unitname>Pa</unitname>
<lastcaldate>15.02.2008 10:37:34</lastcaldate>
<sensitivity>0.05</sensitivity>
<dbref>2e-005</dbref>
</transducer>
</result>
<result>
<name>Octave1</name>
<binaryfilename>.\00000066_2_1\DATA.DAT</binaryfilename>
<datatype>float</datatype>
<deltatime>0.12</deltatime>
<numcolumn>30</numcolumn>
<numrow>819</numrow>
Manual SAMURAI
76 of 132
SINUS Messtechnik GmbH
6.4
SAMURAI data format
<spectrumoct>1;-25;30</spectrumoct>
<dbref>2e-005</dbref>
<unit>Pa</unit>
<transducer>
<guid>GUID_4A44A8DE-04CF-43DB-ABDD-DB4AA56DB593</guid>
<name>Default Microphone</name>
<serial/>
<unitname>Pa</unitname>
<lastcaldate>15.02.2008 10:37:34</lastcaldate>
<sensitivity>0.05</sensitivity>
<dbref>2e-005</dbref>
</transducer>
</result>
<result>
<name>FFT1</name>
<binaryfilename>.\000000CB_2_1\DATA.DAT</binaryfilename>
<datatype>float</datatype>
<deltatime>0.12</deltatime>
<numcolumn>1602</numcolumn>
<numrow>819</numrow>
<spectrumfft>25;801</spectrumfft>
<dbref>2e-005</dbref>
<value>fftreal;fftimag</value>
<unit>Pa</unit>
<transducer>
<guid>GUID_4A44A8DE-04CF-43DB-ABDD-DB4AA56DB593</guid>
<name>Default Microphone</name>
<serial/>
<unitname>Pa</unitname>
<lastcaldate>15.02.2008 10:37:34</lastcaldate>
<sensitivity>0.05</sensitivity>
<dbref>2e-005</dbref>
</transducer>
</result>
<result>
<name>SLM1</name>
<binaryfilename>.\00000065_2_1\DATA.DAT</binaryfilename>
<datatype>float</datatype>
<deltatime>0.1</deltatime>
<numcolumn>33</numcolumn>
<numrow>983</numrow>
<value>Lt Z;Fast Z;Slow Z;Impulse Z;Peak Z;Fast Max (t) Z;←Fast Min (t) Z;Slow Max (t) Z;Slow Min (t) Z;Impl. Max (t) Z;←Impl. Min (t) Z;Lt A;Fast A;Slow A;Impulse A;Peak A;←Fast Max (t) A;Fast Min (t) A;Slow Max (t) A;Slow Min (t) A;←Impl. Max (t) A;Impl. Min (t) A;Lt C;Fast C;Slow C;Impulse C;←Peak C;Fast Max (t) C;Fast Min (t) C;Slow Max (t) C;←Slow Min (t) C;Impl. Max (t) C;Impl. Min (t) C
</value>
<unit>dB;dB;dB;dB;dB;dB;dB;dB;dB;dB;dB;dB;dB;dB;dB;dB;dB;dB;dB;dB;dB;dB;←dB;dB;dB;dB;dB;dB;dB;dB;dB;dB;dB
</unit>
<transducer>
<guid>GUID_4A44A8DE-04CF-43DB-ABDD-DB4AA56DB593</guid>
<name>Default Microphone</name>
<serial/>
<unitname>Pa</unitname>
SINUS Messtechnik GmbH
77 of 132
Manual SAMURAI
6
DATA STORAGE
<lastcaldate>15.02.2008 10:37:34</lastcaldate>
<sensitivity>0.05</sensitivity>
<dbref>2e-005</dbref>
</transducer>
</result>
<result>
<name>Marker</name>
<binaryfilename>.\00000008_0_1\DATA.DAT</binaryfilename>
<datatype>DWORD</datatype>
<deltatime>0.02</deltatime>
<numcolumn>1</numcolumn>
<numrow>4919</numrow>
<bit0>Aircraft</bit0>
</result>
</data>
Manual SAMURAI
78 of 132
SINUS Messtechnik GmbH
7
Data Browser
The data browser is new in SAMURAI 2.0. It helps orienting within a measurement and is an important
interface when handling your data. The data browser not only provides features for easy navigation (by
scrolling or zooming) and finding relevant parts of a measurement, but also allows exporting or recalculating
(percentiles, interval values, etc.) measured data.
Figure 7.1: Data Browser window
Generally, you can operate the Data Browser from the toolbar at the top of the window (for description see
figure 7.2) or from the context menu. The items of the context menu are described in the following table.
Figure 7.2: Features of the Data Browser toolbar
SINUS Messtechnik GmbH
79 of 132
Manual SAMURAI
7
DATA BROWSER
Item
Description
Cursor mode
Open a window to adjust the cursor behaviour (see paragraph 7.1).
Select all
Zoom
Select the entire measurement (entire period).
In
Zoom in measurement time scale at the cursor position.
Out
Zoom out measurement time scale at the cursor position.
Selection
Zoom in selected period.
All
Zoom to view entire measurement.
Zoom In Amplitude
Magnify amplitude.
Zoom Out Amplitude Demagnify amplitude.
Replay
Start replay of measurement at the cursor position (in Replay mode).
Replay speed
Select replay speed (1x, 2x, 4x).
Play Audio
All
Start replay of the selected audio data at the cursor position and replay until the end of the
measurement.
Selection
Start replay of the selected audio data at the beginning of the selected data and replay until
the end of the selection.
Block
Start replay of the selected audio data at the cursor position and replay until the end of the
block.
Play audio (Loop)
Same as Play audio, but instead of stopping replay is restarted at the cursor position.
Post Process
Start the post processing mode and use selected data range.
Export to
Export the selected period.
Recalculate Intervals
Open a window for recalculating of interval values. This item is only available if SLM, 1/3
octave or FFT data are selected. Please refer to paragraph 7.2.1 for details.
SLM Percentiles
Recalculate percentiles of the selected range. This item is only available if SLM data ere
selected.
Spectral LN
Recalculate spectral LN based on selected range.
Community noise
Recalculate Ldn, LDay, LNight, Lden, LEvening.
Extract Selection to Measurement Export the selected period to a new SAMURAI measurement.
Settings
Size to Fit
Automatic amplitude scaling for the graphs.
Minimum Size
Smallest possible amplitude scaling for the graphs.
Show Result Name
En-/Disable result name display.
Color theme
Open a window to adjust the colours used in the Data Browser (see paragraph 7.3).
Color scale
Open a window for setting the color scale (see paragraph 7.4).
Table 7.1: Items of the Data Browser context menu
Manual SAMURAI
80 of 132
SINUS Messtechnik GmbH
7.1
7.1
Cursor mode
Cursor mode
The cursor in the Data Browser works in different modes simplifying navigation and data selection. You may
set the modes in the window shown in figure 7.3.
Figure 7.3: Setup - Cursor modes
The following modes are available:
Free selection You may freely set the cursor to the desired starting point and period.
Fixed selection Set the cursor to a fixed starting point (Begin in the window) and a fixed ending point (End
in the window). The selection is fixed and you may not change it with the mouse later.
Fixed length You may select the starting point with the mouse. The ending point is resulting from the
starting point plus an adjustable length of time (define Length in the window).
Furthermore the cursor may snap to defined time limits (set Snap in the window).
The parameter Display format defines how the times are displayed in the Data Browser toolbar.
NOTICE!
7.2
You may also set the display format by left-clicking on the time display in
the toolbar.
Recalculate measured values
If you have selected SLM, 1/3 octave or FFT channels in the Data Browser, you may recalculate different
values. The following paragraphs 7.2.1 to 7.2.4 explain the available recalculation operations.
7.2.1
Recalculate interval values
If you have selected SLM, 1/3 octave or FFT channels in the Data Browser, you may recalculate different
values from a selected period using the Recalculate feature. The values are collected in a report container
within the programme and may be exported later. Figure 7.4 shows the recalculation setup window.
SINUS Messtechnik GmbH
81 of 132
Manual SAMURAI
7
DATA BROWSER
Figure 7.4: Setup - Recalculation of interval values
The parameters of the setup window are described in table 7.2.
Parameter
Description
Analysis mode
Time Resampling means recalculating levels on a different time base. Advanced Intervals means recalculating of statistical values from a base value (set Select value in
the window).
Value
Base value if Advanced Intervals has been selected for Analysis mode.
Interval type
Select by predefined times or user-defined intervals.
Custom interval duration
Duration of an interval for customized intervals.
Synchronize interval start
Check this box to synchronize the interval limits when customized intervals are used.
Day/Evening/Night begins at:
Enter time values of the individual times of day.
Advanced intervals
optional parameters
Check these boxes to enable recalculation of the values.
Table 7.2: Setup - Recalculation of interval values
7.2.2
SLM percentiles
Click on this item to open a window for selecting the percentiles you want to calculate. You may select 6
adjustable percentiles or all integer percentiles (check the box All integer percentiles). Use the parameter
Value to define the base value.
7.2.3
Spectral LN
You may calculate 6 adjustable percentiles. The feature can be applied to 1/3 octaves as well as to FFTs.
The setup is similar to the SLM percentiles setup.
Manual SAMURAI
82 of 132
SINUS Messtechnik GmbH
7.3
7.2.4
Color themes in the Data Browser
Community noise
Select this item to calculate the values Ldn, LDay, LNight, Lden and LEvening according to ISO 1996-2: 1987. As with
other recalculation operations the data are stored to the report container.
7.2.5
Report Viewer
All data resulting from recalculation operations are collected in a report container. When a recalculation
operation is finished the data are displayed in a window (Report Viewer see figure 7.5 ).
Figure 7.5: Report Viewer
You may copy the data from this window to the clipboard by clicking on Copy . If you want to delete the
selected tab (including the data in the report container, click on Delete . Click on Delete all to remove all data
from the report container.
If you want to export the data to files, click on Export to open an export window. The following formats are
supported currently: ASCII files (CSV), Excel and DIF. On the left you may select the Report tab for export
and on the right you may set the export parameters. This allows you to define an individual name for each
data set.
7.3
Color themes in the Data Browser
Click on Color theme to select the color theme to be used. The sections of the selection window are
self-explaining and not described here.
NOTICE!
7.4
This setting is part of the programme properties and will not be stored to
the *.SHX file of the measurement.
Color scale
The color scale setup is similar to the scale setup for sonogram graphs (see paragraph 5.4.3). You may also
store and reload color scales.
SINUS Messtechnik GmbH
83 of 132
Manual SAMURAI
8
8
EXPORT
Export
To export measured data you have to recall a measurement in Replay mode (see paragraph 9.6. Despite
the limitations of particular formats, SAMURAI will try to export as much of the measured data as possible.
In some cases, a Windows WAV file is generated in addition to the exported file in order to store the time
signal data.
8.1
Export to NWWin
The export to NWWin, unlike the other formats, does not convert the data to a file. The data directly exported
to an open NWWin document. NWWin Version 2.0.9 or higher including the “SINUS SAMURAI” option is
required to import data from external applications.
If SAMURAI displays the error message “Connection with NWWin is not available...” while you are trying
to export data to NWWin this may have the following causes: NWWin is closed, the NWWin version is not
compatible or the option required for importing external data to NWWin is not enabled. When exporting to
NWWin three windows are displayed requesting several export details.
In the first window you must select the data for export. Since very large data volumes may occur, the Select
button provides a menu assisting in data selection. The Default selection is special allowing you to specify
default parameters for the data export. This is particularly useful when exporting many measurements of the
same kind. The parameters in figure 8.1 are described in table 8.1.
Figure 8.1: Export to NWWin - Step 1
Parameter
Description
Save Time History
Check to select time history for export also.
Save Global Data
SAMURAI may also export global information on the measurements
(comments, setup, measurement name etc.).
Save each result in a
separate measurement
Check to export each result to a separate measurement.
Table 8.1: Parameters export to NWWin - Step 1
Manual SAMURAI
84 of 132
SINUS Messtechnik GmbH
8.2
Export to Excel
In the second step of the data export to NWWin you have to specify the following parameters:
Figure 8.2: Export to NWWin - Step 2
Figure 8.3: Export to NWWin - Step 3
Parameter
Description
Associate auxiliary results
to spectral data
Check this box if you want to associate the data from the auxiliary channels to the spectral data
timed.
When possible
convert result to dB.
Check to convert the data to dB when a dB reference value is included in the transducer database
for the data.
Activate the
application...
Check this box to automatically start the application to which the data have been exported successfully.
Save signal as
WAV data
Check to enable time signal data storing in a wav file.
Group signals in two
channels (stereo) WAV
Check to group the time signal data in stereo wav files.
Table 8.2: Parameters export to NWWin - Step 2
In the third export step you may make annotations or add descriptions to the data. The window is selfexplaining and not further described.
8.2
Export to Excel
The Excel format is one of the most common formats for the exchange of numeric data. However, the format
has serious restrictions since a maximum of 256 columns x 65536 rows is allowed per sheet. Each SAMURAI result is saved as a separate sheet inside the Excel file. In each sheet the data are usually saved storing
one sample per row. If the number of samples exceeds 65536, the measurement will be truncated.
The restrictions of Excel cause a general problem when exporting FFT spectra because only spectra with
less than 256 lines may be exported. SAMURAI solves the problem by automatically transposing the exported data. If you export a spectrum with 400 lines, for example, SAMURAI automatically transposes the
matrix, i.e. the first column will contain all 400 lines of the first transformation etc. This restricts the data to
256 samples per channel. The export wizard is the same as for the export to NWWin. You may, however,
set an additional integration or differentiation of the spectra in the second export step.
SINUS Messtechnik GmbH
85 of 132
Manual SAMURAI
8
8.3
EXPORT
The automatic export
The automatic export can be arranged by clicking on Export options... in the measurement setup window 2.10.
The windows resemble those for the manual export (see section 8). In the first dialogue (figure 8.4) you may
select the file types for export by enabling the corresponding checkboxes.
With the buttons SLM values , HVMA values , VIB values and Cross function you can select individual levels for
export. If you enable the checkbox Save Time History, SAMURAI will export a curve for each selected
value documenting the value change over time (e.g. level history). The remaining controls in the window are
self-explaining and therefore not described here.
Clicking on Next will open the next window containing the export options (figure 8.5). You may set additional
options here. The options are described in table 8.3.
Figure 8.4: Export selection
Figure 8.5: Export options
Parameter
Description
Complex data options
Select for FFT spectra export: as real/imaginary part or as Magnitude/Phase.
Do not save phase for FFT If enabled, only the spectra magnitudes are exported.
spectrum
Associate auxiliary results to If enabled, the data from the auxiliary channels will be associated to the spectral data. If there
spectral data
are spectral results in several blocks, the data from the auxiliary channels will be associated and
interpolated. If this box is not checked, auxiliary channel data will be exported as separate channels.
When possible convert values If the transducer database contains a reference value for the corresponding transducer, the amplito dB
tude values are automatically converted to dB.
Save each result in a separate Only for NWWin: If checked, each selected result will be saved in a separate measurement in
measurement
NWWin.
Save signal as WAV file
Checkbox for exporting samples as WAV file. The data are normalized to 1 according to the set
physical range and exported as WAV file.
Group signals in two channels If checked, adjacent channels are exported as two-channel WAV file. This might help if you want to
(stereo) WAV
replay audio data in stereo.
Integration/Derivation
If checked, the exported spectra may be integrated or differentiated.
Table 8.3: Export options
Manual SAMURAI
86 of 132
SINUS Messtechnik GmbH
8.4
8.4
Export to Text file
Export to Text file
Within a text file the measurement values are separated by a defined separator. During export you may use
the Windows Standard Separator or a user-defined separator. You may also select the decimal separator.
The export wizard is the same as for the export to NWWin. You may, however, set an additional integration
or differentiation of the spectra in the second export step.
8.5
Export to WAV
Only time data can be exported to WAV. After the selection of the export folder for the *.wav files a window
opens in which you have to check the boxes for the channels to be exported. Check the box Group channels
where possible to group channels with the same transducer type.
8.6
Export to Windows Media Movie
This export option is only available for measurements containing video (with NoiseCam option) and audio
data. The export requires Windows Media Player 9 or higher (already included in WindowsXP). The parameters necessary for the export are set in two configuration windows. The first window contains the selection of
the audio channels and the compression options (see fig. 8.6). You may select maximally two audio signals
as sound signals for the video. The selected audio data should match with the settings for exported audio
data; the data is converted to a mono signal and then exported.
Figure 8.6: Export to Windows Media Movie - Step 1
Figure 8.7: Export to Windows Media Movie - Step 2
Further parameters in this window are described in the table below 8.4.
Parameter
Description
Group all video chunks in Video data over NoiseCam may also be recorded using triggers which means that several blocks
one movie
of data might have been saved. If this box is checked, all blocks of data are exported to one file.
Otherwise a file is created for each trigger event.
Video codec
Select the video codec.
Video Bitrate
Select the desired bit rate for the video data.
Audio codec
Select the audio codec.
Audio Format
Select the desired audio quality.
Table 8.4: Parameters export to Windows Media Movie - Step 1
SINUS Messtechnik GmbH
87 of 132
Manual SAMURAI
8
EXPORT
In addition the second window contains options for the “header” of the exported video. The length of the
header is defined by the parameter Length. You may use a picture (only 24bit formats, DIB, JPEG, TIFF) as
background of the header or a single colour.
Various information (objects) may be displayed in three sections (top, center and bottom) on the background of the header. Each of this sections may contain two objects at maximum. The objects available are
described in table 8.5.
Parameter
Description
Measurement name
Name of the current measurement.
Date and time
Starting time and date of the measurement.
Note
Stored notes on the measurement.
Progressive number
Consecutive number of a data block within the measurement.
Bitmap Logo
User-defined logo (only 24bit formats, DIB, JPEG, TIFF).
Table 8.5: Parameters export to Windows Media Movie - Step 2
You may set the colour and font for all text-based objects. If necessary, SAMURAI automatically adjusts the
selected font size to the display area.
NOTICE!
8.7
Uncheck all boxes in the window shown in figure 8.7 to disable the header.
Export to Quicktime Movie
This export option is only available for measurements containing video (with NoiseCam option) and audio
data. The export requires Quicktime 6 or higher. The possible settings are generally the same as those for
the export to Windows Media Movie (except compression parameters).
You may adjust the compression parameters with the buttons Video settings... and Sound settings.... The
windows for the corresponding settings are part of the installed Quicktime version. For this reason the setup
is also described in the manual for your Quicktime version. Table 8.6 shall help you to choose the optimal
video export format.
Format
Pro
Con
Windows Media Movie
Better compression
New format, worse quality
Quicktime
High quality, smooth picture
worse compression
Table 8.6: Comparison of video export formats
8.8
Create movie as Multimedia Report
This SAMURAI feature allows you to export measured data to a video file. You may create a “Multimedia
Report” and forward it to your colleagues or costumers. This feature combined with the NoiseCam option
as export option (or report generation option) represents a useful alternative to common export methods,
especially if the recipient has no SAMURAI.
The video file is not created during the measurement, but during replay. Two video formats are supported:
Windows Media Movie and Quicktime (see also paragraphs 8.6 and 8.7).
8.8.1
Create movie
To create a “Multimedia Report” open the dialogue via Tools->Record movie->< F ormat >. You find
the setting for generating a video file in three windows. The first window is shown in figure 8.8 and the
Manual SAMURAI
88 of 132
SINUS Messtechnik GmbH
8.9
Export to UFF
included parameters are described in table 8.7. The second and the third window are shown and described
in paragraph 8.6.
Figure 8.8: Create movie - Step 1
Parameter
Description
Create from
Source from which the movie is created, possible values are:
Application window, All graphs, Single graph.
Select Pane
Window to be used as video source.
Select
Select the window using the mouse or the pen in tablet-PC mode.
Output Mode
Select whether one file for all data blocks/events is created or one file for each block.
Frame rate
Number of frames per second.
Table 8.7: Parameters for creating ”Multimedia Reports”
When the third dialogue has been confirmed with OK, SAMURAI asks you for the export directory. Then
the recalled measurement is started in Replay-Pause mode and a new button to start the video recording
(see fig. 9.10b) appears in the Replay toolbar. In this step the measurement is replayed and the necessary
picture data is collected. To move backward or forward in the measurement click on the PAUSE button and
use the search feature or the slider in the Status bar. Every click on the Capture button creates a new video
file with a header if necessary.
8.9
Export to UFF
The Universal File Format is one of the longest-established and best-known formats for exchanging data of
any type. It offers several datasets; dataset 58 is used to transfer SAMURAI measurement data. The export
wizard is the same as for the export to NWWin. There are only two difference in step 2. You may integrate
or differentiate the spectra and group the data in one UFF file.
8.10
Export to si++
Only the time signal data can be exported to the si++. From these data all other values may be calculated in
the analysis with si++. After the selection of the export folder for the *.si files a window opens in which you
have to check the boxes for the channels to be exported. Check the box Group channels where possible
to group channels with the same transducer type (e.g. all accelerometer channels).
SINUS Messtechnik GmbH
89 of 132
Manual SAMURAI
9
SPECIAL FUNCTIONALITY
9
Special Functionality
9.1
Power Management
One of the most important features of modern portable analyzers and PCs is the power management option.
SAMURAI supports all standard power-saving options in order to keep battery consumption to the lowest
possible level. There are two main features in the SAMURAI power management:
• the use of the Sleep mode and
• the command Stop on low battery.
9.1.1
Sleep mode
The Sleep mode of a Windows PC is one major way to reduce power consumption. Depending on the PC
and Windows version you may use several sleep mode levels.
Since the Sleep mode can interfere with the correct functioning of the analyzer, SAMURAI prevents any
sleep mode when the hardware is connected. As a consequence, you shall always disconnect the analyzer
if you do not use it. This reduces power consumption since the analyzer is turned off completely and you
allow Windows to control the power-saving options again.
SAMURAI is able to enter into sleep mode by itself between two acquisition blocks if the pause between
the two blocks lasts for at least five minutes. A couple of minutes before the next block the PC is restarted
automatically, SAMURAI reconnects to the hardware and starts the measurement.
9.1.2
Stop on battery low
If the battery fails completely, power supply is cut off and the PC is turned off incorrectly. Open measurement
files cannot be closed correctly and will be corrupted.
In order to avoid that, SAMURAI stops the running measurement either when it receives the battery low
message from the operating system or when the battery level falls below a predefined value. You may set
the value for stopping the current measurement in the general preferences (see section 10.1).
The reason for supporting two different turn-off methods is that not all PCs support the Windows stop-onlow-battery option. If you use a PC with a rather old battery, a secure value for the automatic turn-off is a
battery charge of 23-30 %.
9.2
Easy Operator Mode
Performing multi-channel measurements is a complex task requiring expert knowledge, experience and time.
For this reason the simplification of those measuring tasks for inexperienced or non-expert users is highly
desirable.
SAMURAI offers a solution to this problem providing the Easy Operator Mode. In addition to the powerful
features already described in this manual, SAMURAI allows you to predefine a simplified setup which can
be used by less experienced users. The Easy Operator Mode still utilizes SAMURAI with all its features, but
requires only a minimum of commands and operations from the operator for the same measuring tasks. The
Easy Operator Mode is used as follows:
• The expert operator creates a measurement setup including all the required settings and saves the
setup in the <SAMURAI_Inst_Pfad>\SHSetup folder.
• Via File -> Easy Operator Mode the expert creates a link which enables the less experienced operator
to run this setup.
Manual SAMURAI
90 of 132
SINUS Messtechnik GmbH
9.2
Easy Operator Mode
• The less experienced operator starts SAMURAI in the Easy Operator Mode by double-clicking on the
link on the desktop. Thus the operator may perform measurements without risking to accidentally
change important settings.
Figure 9.1: Easy Operator Mode window
9.2.1
Create Easy Operator link
First you have to set all necessary parameters and create a setup file (*.sh0) in the <SAMURAI_Inst_Pfad>\SHSetup
folder. The Easy Operator link can only use a setup from that folder. Once the setup is ready, click on File ->
Easy Operator Mode. The Easy Operator link is a standard Windows link, so it can be created and stored
in any place on your PC. The parameters in figure 9.1 are described in table 9.1.
Parameter
Description
Save link to
Select a location to which the link is saved. Possible values are: the Program menu, the Desktop or
the Setup folder.
Program menu folder
Select the Windows program menu folder to which the link is saved. To avoid any damages to other
programmes we recommend you to save the link to the SAMURAI folder or a user-created folder
only.
Select setup to load
Select the setup to be loaded for the Easy Operator Mode. The setups listed are those saved in the
<SAMURAI_Inst_Pfad>\SHSetup folder.
Link name
Enter a simple link name to help identifying it later.
Description
Enter a brief description, if desired. It is displayed when the cursor is moved to the link.
Advanced...
Click to open a window to set further parameters specifying the behaviour in the Easy Operator
Mode.
Table 9.1: Parameters Easy Operator Mode
NOTICE!
SINUS Messtechnik GmbH
For a list of command line switches to edit desktop links manually see section 1.3.
91 of 132
Manual SAMURAI
9
9.2.2
SPECIAL FUNCTIONALITY
Advanced options for the Easy Operator Mode
The window for the advanced Easy Operator Mode options is shown in figure 9.2. The parameters are
described in table 9.2.
Figure 9.2: Easy Operator Mode - Advanced options
Parameter
Description
Display the initial
Connection window
Uncheck this box to suppress the message asking you to connect the analyzer to PCMCIA (which
is not necessary with a Soundbook).
Display the Measurement
Check this box to enable the display of a window where the measurement name and a description
name and description win- is entered before the measurement is started.
dow
Easy Operator Calibration Check this box to enable a calibration check before measuring (section 2.3.1).
Check
Allow the Adjust Gain...
Check this box to allow the operator to adjust the gain manually.
Run the measurement
automatically
Set to run measurement automatically after the application start and the input of the measurement
name and description.
Freeze display
Set to deactivate graphical display. This feature is helpful for low-capacity computers or longterm
monitoring tasks.
Table 9.2: Parameters advanced options - Easy Operator Mode
NOTICE!
9.2.3
A list of the command line switches for the manual editing of links is given
in paragraph 1.3.
Operation in the Easy Operator Mode
Double-click on the desktop link or select the link from the Windows programmes menu to start SAMURAI in
the Easy Operator Mode. Follow the instructions below when running SAMURAI in the Easy Operator Mode:
• Connect HARMONIE to the PCMCIA slot of the PC (not required for Soundbook).
• Enter the name and description of the measurement.
• Wait during warm-up (settling time of the measuring microphones).
• If enabled, check calibration (section 2.3.1).
• If enabled, adjust gain manually.
The operator can only start the measurement by clicking on Run in the Run toolbar if the measurement is
not started automatically. In the Easy Operator Mode the operator can only change the size and number
of the graphical display panes. The setups of the individual graphs, however, are fixed. The operator may
switch between the enabled graphs.
Manual SAMURAI
92 of 132
SINUS Messtechnik GmbH
9.3
9.2.4
Reference Spectra
The Easy Operator Mode in conjunction with auto start
The Easy Operator Mode can be used to start a measurement directly after the system start. This is very
important in long-term monitoring stations when measurements have to be restarted automatically after a
power supply failure, for example. Follow the instructions below:
1. Create an Easy Operator Link using a setup file of your choice. Only check the box “Run the measurement automatically” in the window in figure 9.2.
2. Move the Link to the Windows auto start menu.
3. Enable the “Autologin”-Feature of Windows (see Windows user administration or use separate applications as “TweakUI”).
Enable “Autologin” in Windows manually
You may utilize the following alternative procedure for enabling the auto-login feature in Windows:
1. Create a ASCII file named autologin.reg with the following contents 1 :
Windows Registry Editor Version 5.00
[HKEY_LOCAL_MACHINE\SOFTWARE\Microsoft\Windows NT\CurrentVersion\Winlogon]
"DefaultUserName"="Administrator"
"DefaultPassword"="soundbook"
"AutoAdminLogon"="1"
2. Obtain administrator privileges for the PC (default with Soundbook) and double click on the created
file in the Explorer. Thus you save the data to the windows registry.
3. Test the Autologin.
9.3
Reference Spectra
SAMURAI allows you to define reference spectra. They help as visual reference during a measurement or
assist with the reference spectrum trigger (section 4.4). You may embed a reference spectrum into a measurement automatically or save it to an external file in the folder <SAMURAI_Inst_Pfad>\SHRefSpectrum.
Embedded spectra are included in the measurement setup and thus are replicated in any new measurement
using that setup.
9.3.1
Creating a reference spectrum
A reference spectrum is always created on the basis of a measured spectrum. First, recall a measurement
or create a new one which contains a spectrum and display the result in Replay mode as spectrum graph.
Click on Create reference spectrum with in the context menu to select one of the displayed spectra as
basis for the creation of the reference spectrum. The selected spectrum is now converted to a reference
spectrum which you may edit in the window opened after conversion. When saved, the reference spectrum
is automatically embedded into the current measurement.
1
Adjust the user name and password if necessary.
SINUS Messtechnik GmbH
93 of 132
Manual SAMURAI
9
9.3.2
SPECIAL FUNCTIONALITY
Editing a reference spectrum
You may edit the reference spectrum as described in the edit window at its creation or later by selecting
Tools -> Reference Spectra... from the main menu. When editing via the Tools menu you may select any
embedded or external reference spectrum for editing; at creation you may only edit the reference spectrum
just created. Please note that you may not edit and store a weight curve because this would corrupt the
measurements basing on that weight curve. You may not load the weight curves for A, B, C and D since they
are already fixed in the programme and may not be changed.
The reference spectrum edit window is divided into three areas (see figure 9.3). At the top you may select
the reference spectrum for editing. In the centre the spectrum is displayed as graph and as table. At the
bottom you find the command buttons for the modification of the reference spectrum, which will be described
later.
Figure 9.3: Reference spectrum edit window
You may modify a reference spectrum in three ways:
• By dragging one or several points with the mouse directly into the graph.
• By manually editing values in the table.
• By using the various item of the Edit menu.
In the bottom bar you will find several buttons for rescaling the graph, for applying changes or for opening
further sub-menus. The context menus File and Edit are described in the tables 9.3 and 9.4.
Item
Description
Save as...
Save the current reference spectrum as an external file to any location of the file system. Please
note that SAMURAI is only able to load external reference spectra if they are stored in the
<SAMURAI_Inst_Pfad>\SHRefSpectrum folder.
Duplicate
Duplicate the current reference spectrum and embed copy into the current measurement This is the
only way to embed an external reference spectrum into a measurement.
Import
weight curve
Import a weight curve ( “*.cwg”) from the file system and use it as reference spectrum.
Manual SAMURAI
94 of 132
SINUS Messtechnik GmbH
9.3
Reference Spectra
Item
Description
Export
weight curve
Export a reference spectrum as a weight curve.
Delete
Delete an embedded or external reference spectrum from a measurement or from the hard disk.
Table 9.3: Items File menu - Edit reference spectrum
Item
Description
Convert to
Convert the spectrum levels from dB to Linear and vice versa.
Add a point...
Insert a new point half-way between the current point and its predecessor (only available if the frequency
axis is linear).
Selection
This sub-menu contains command for simultaneously editing values of previously selected points.
Set to... Set all selected points to an entered value.
Offset Add a user-specified offset.
Offset to Add an offset to reach a user-defined value for one of the points.
Delete Delete the selected points.
Enlarge...
Find peaks in the current reference spectrum and enlarge them, see details below (only for linear frequency axis).
Smooth
Smooth the current curve. The values of the smoothed curve result from weighted averaging.
Simplify
Simplify the current curve by removing certain points (only for linear frequency axis).
Settings...
Open dialogues with curve properties.
Table 9.4: Item Edit menu - Edit reference spectrum
Figure 9.4: Reference spectrum - Enlarge
Figure 9.5: Reference spectrum - Simplify
The Edit -> Enlarge command searches for peaks in the curve and broadens those peaks by setting the
values of the selected neighbouring points to the same level as the peak. Table 9.5 describes the parameters
in figure 9.4.
Parameter
Description
Enlarge by
The number of points to the left and to the right of the peak that will be adjusted.
Threshold
The threshold below the maximum. It is used to exclude the lowest peaks from the search.
Max number of peaks
The maximum number of peaks to be analyzed. It is possible that the search will find fewer
peaks than the maximum.
Align points below threshold Check this box to increase the values of all points below the threshold to the specified threshold value.
Table 9.5: Parameters of the Enlarge command
The following table describes the parameters shown in figure 9.5.
SINUS Messtechnik GmbH
95 of 132
Manual SAMURAI
9
SPECIAL FUNCTIONALITY
Parameter
Description
Mode
Select the mode for simplifying the curve (see following three lines.)
Reduction factor
A specified number of points which are summarized to a single averaged point.
Number of points Enter the number of points for the recalculated reference spectrum . (it is inter-/extrapolated
if necessary).
Delta frequency
Enter the frequency step for calculating a new reference spectrum with equidistant frequency
steps.
Table 9.6: Parameters - Simplify reference spectrum
Figure 9.6: Reference spectrum - Setup
Use the settings for Outside extension if you want to examine a signal with a larger bandwidth as specified
for the reference spectrum . If Do not extend is selected, only the range used in the reference spectrum
will be examined. If Extrapolate using last slope is selected, the spectrum is automatically extended to the
required size and uses extrapolated values at the borders.
The Unit and dB reference are exclusively used for the dB to linear conversion and vice versa.
Use the Pen parameter to change the predefined pen for displaying the reference spectrum. Of course you
may also adjust the pen graph properties window.
9.4
Description of the toolbars
SAMURAI has four toolbars: Main, Run, Replay and Control. The Run and Replay toolbars are only displayed in the corresponding mode.
9.4.1
Main toolbar
Figure 9.7: Main toolbar
Button
Description
On/Off
(De)Activate the analyzer hardware (same as Analyzer -> Connect).
Post Processing En-/Disable post processing mode.
New
Create a new measurement (same as File -> Begin New Measurement).
Manual SAMURAI
96 of 132
SINUS Messtechnik GmbH
9.4
Description of the toolbars
Button Description
Graph
Open the Graph layout and properties window.
Layout
Adjust the general layout of the Measurement and Replay windows.
Table 9.7: Main toolbar
9.4.2
Run toolbar
This toolbar changes its appearance dynamically, i. e. depending on the situation the
or the Pause button is displayed.
Figure 9.8: Run toolbar in Record mode
Button
Description
Run
Start the measurement (F2 key).
Audio Comment
button
Figure 9.9: Run toolbar in Stop mode
Audio Comment Add an audio comment.
Pause
Pause measurement (F3 key).
Stop
Stop measurement (F4 key).
Table 9.8: Run toolbar
9.4.3
Replay toolbar
This toolbar also changes its appearance dynamically, i. e. before and during replay the
button or the Pause button is displayed.
Audio Comment
(a)
(b)
Figure 9.10: Replay toolbar
Button
Description
PLAY
Start replay (F5 key).
Audio Comment Add an audio comment.
Pause
Pause replay (F3 key).
Stop
Stop replay (F4 key).
Table 9.9: Buttons of the replay toolbar
NOTICE!
Clicking on PLAY while pressing the ”Ctrl” key when more than one audio
signal is available will open the dialogue for selecting the channels to be put
out by the sound card.
SINUS Messtechnik GmbH
97 of 132
Manual SAMURAI
9
9.4.4
SPECIAL FUNCTIONALITY
Control toolbar
Figure 9.11: Control toolbar
Element
Description
Start
Indicates the start time of the current measurement (also in Replay mode).
Run time
Indicates the record time of the current measurement (also in Replay mode). By clicking on this field once
you may switch between seconds, date+time and hours:minutes:seconds:milliseconds.
Over
Indicates whether an overload occurred during the measurement.
Under
Indicates whether an underrange condition occurred during the measurement.
Marker (M1, ...) Buttons to set a marker manually (see paragraph 4.6).
Table 9.10: Control toolbar
NOTICE!
9.4.5
If an instrument of the APOLLO family is used for the measurement, an
overload is also indicated when a sensor error occurs (defect cable, defect
sensor etc.). Additionally the red note “Sensor error” is flashing in the status
bar.
Global Trigger Indicator
On the right of the control toolbar a trigger indicator is displayed which shows whether a trigger condition is
or has been fulfilled at that moment (modes see fig. 9.4.5).
a)
b)
c)
Figure 9.12:
a) no trigger condition fulfilled;
b) trigger condition was fulfilled;
c) trigger condition is fulfilled
9.4.6
Status bar
Just like any other Windows application SAMURAI has a status bar that is used to display additional information. The status bar elements are described in the following.
Figure 9.13: Status bar
Element
Description
Trigger
Information on warm-up time, the recording event status and sensor errors.
Measurement Mode Colour-highlighted display of the current measurement. The colour assignment may be changed in the
programme setup.
Manual SAMURAI
98 of 132
SINUS Messtechnik GmbH
9.5
Range modes
Element
Description
Range
Display of the current range mode (Norm or Ext) (see paragraph 9.5).
Serial number Display of the serial number of the currently connected unit (in Record mode), or that of the unit which was
used to record the recalled measurement (in Replay mode).
RPM
Display of current speed value(s), if one (two) tacho input(s) is (are) enabled in the auxiliary channels.
Power supply
Display of the voltage at the auxiliary channel with power supply, if enabled.
Block/Event
Display of the number of the current Block/Event if a measurement contains several blocks.
Table 9.11: Status bar
9.5
Range modes
If you use an instrument of the HARMONIE family, SAMURAI offers two different range modes.
Normal: This mode has different measuring ranges with a dynamic range of 80 dB. This mode has to be
used if the full number of channels is needed.
Extended Range: This mode uses the ability of the hardware to combine two channels, i.e. two channels, which overlap by 40 dB in gain, use the same input channel. If the more sensitive channel is
in overload, SAMURAI will automatically switch to the less sensitive channel and vice versa. This
extends the dynamic range by 40 dB, but halves the number of available input channels. The mode
uses the following channel combinations: 1/2; 3/4. Channel 1 and 3 are the input channels in these
combinations.
NOTICE!
9.6
The Extended Range mode is only available for 2 and 4 channel units
(Soundbook MK1 and HARMONIE).
Application modes
Generally SAMURAI may run in two modes, the Record and the Replay mode. The current mode is indicated
by SAMURAI displaying the Run or Replay toolbar. Both modes include different application states, which
are displayed in square brackets in the title bar. Table 9.12 describes the different states of both modes.
State
Mode
Description
No display
Not
relevant
The application ist not connected to the analyzer and could not automatically recall a
measurement on start (the current working folder does not contain measurements).
Stop
Recording
A measurement has been stopped or a new measurement has been created.
Run
Recording
The measurement has been started (using the main menu or the Run toolbar). If in this
mode the analyzer is measuring and storing data to the hard disk.
Pause
Recording
The measurement has been paused; no data are stored to the hard disk. The measurement may be continued by clicking again on the Pause button in the Run toolbar.
The measurement count does not increase automatically!
Timer
Recording
The application is waiting between two measurements (e.g. when using “Daily” in the
measuring mode “Autostore”, see paragraph 3.1).
Recall
Recall
An existing measurement has been loaded. This is the normal state entered after
application start, since the last measurement is recalled automatically on start.
PLAY
Replaying
SAMURAI is replaying the recalled measurement.
Pause
Replaying
The replay of the recalled measurement has been paused.
Table 9.12: Application modes
SINUS Messtechnik GmbH
99 of 132
Manual SAMURAI
9
SPECIAL FUNCTIONALITY
In Replay mode you may not run a new measurement directly. You have to create a new measurement first.
Even if you want to chose an alternative setup for the new measurement, you have to create a new measurement before you can load or create a new setup. In any case you may only create a new measurement
if the analyzer is connected!
The following restrictions apply to the individual modes and states:
• The current measurement may only be configured in Stop mode.
• The transducer calibration can only be performed in Stop mode.
• The window with the graphical display options can not be opened if the application is replaying a
measurement.
• The manual Export functions are disabled unless the analyzer is in Replay mode.
• The transducer database can only be used in Stop mode (see paragraph 2.2).
• The working folder can only be changed in Stop mode (see paragraph 6.1).
9.7
Numeric keypad
SAMURAI offers a numeric keypad for each numeric input field. The input tool facilitates the input of numerical values especially when using the Soundbook in Tablet PC mode. Double-clicking on an input field
(with the pen or the mouse) will open the numeric keypad, which you may now use for the quick entry of the
desired digits. For the input of names, labels etc. in Tablet PC mode use of the virtual Windows keyboard is
still recommended.
Figure 9.14: Numeric keypad
9.8
Audio Comment
To record an audio comment connect a microphone to the soundcard of your PC and press the corresponding
button in the Replay or Run toolbar. The window for recording an audio comment is shown in figure 9.15.
It resembles the Windows Soundrecorder window. In the upper part the current position within the audio
comment is displayed on the left. In the centre the recorded signal is displayed and the upper left part
contains the total length. You may record an audio comment directly after finishing the measurement or later
when replaying the measurement.
ATTENTION!
Manual SAMURAI
Please note that you can record only one audio comment for each measurement.
100 of 132
SINUS Messtechnik GmbH
9.9
Back Erase
Figure 9.15: Audio comment window
Using the slider in the centre you may skip forward or back within an audio comment. The controls in the
window are described in table 9.13.
Element Description
Forward to the end.
Rewind to the beginning.
Start replaying. / Pause
Stop recording or replaying.
Start recording.
Clear
Press this button to delete the recorded Audio Comment .
Table 9.13: Parameters Audio comment
You may set the recording quality of the comment in the general preferences (see paragraph 10). Before
recording please check the record and replay volume.
9.9
Back Erase
If the “Back Erase” function is enabled in the general preferences (see page 104) and you click on the PAUSE Button during a running measurement, a window (see figure 9.16) will appear in which you may select the
length of time to be deleted from the data measured before. This might be of help if you want to measure an
approximately stationary signal and an unexpected noise occurs.
Figure 9.16: Back erase window
NOTICE!
SINUS Messtechnik GmbH
The statistical values as LXXmax, LXXmin, LXXeq etc. are also set back accordingly.
101 of 132
Manual SAMURAI
10
10
PREFERENCES
Preferences
The preferences define the appearance and behaviour of SAMURAI. Open the preferences window by selecting Tolls -> Preferences from the main menu. The preferences are divided into categories displayed on
the left side of the preferences window (see figure 10.1).
10.1
General
In the General category, there are three groups of parameters. The first group defines the programme
behaviour, when the disk storage capacity is decreasing (section 6). The second group controls the power
management of the programme (section 9.1). The parameters are self-explaining and not further described.
With the third group SAMURAI may perform a PC restart. This feature is designed for long-term monitoring
stations. The parameter Execute application before restarting allows starting external applications for
copying/sending/deleting exported data for example.
Figure 10.1: Preferences window - General
Manual SAMURAI
102 of 132
SINUS Messtechnik GmbH
10.2
10.2
User Interface preferences
User Interface preferences
In the User Interface (UI) category you may select language and appearance settings. Changes in this
category require a programme restart for implementation. The parameters in figure 10.2 are described in
table 10.1.
Figure 10.2: Preferences window - Graphical user interface
Parameter
Description
Language
Select the programme language.
Tabbed windows /
Workspace
Select the general appearance of the SAMURAI window. In Tabbed windows mode all SAMURAI
windows (Setup, Measure, etc.) are identified by a tab. In the Workspace mode the windows are
grouped in a usual dockable or floatable Windows workspace window.
Automatic position
of docked toolbars
Check this box to arrange the toolbars automatically.
Display text under
toolbar buttons.
Check this box to display a description below each toolbar button.
Flat style toolbar
buttons
Check this box to display flat toolbar buttons.
Enable the “Logo” window Check this box to enable a floating window for displaying a company logo. For logo setup select
View from the main menu.
Table 10.1: Parameters for the User Interface preferences
SINUS Messtechnik GmbH
103 of 132
Manual SAMURAI
10
10.3
PREFERENCES
Measurement preferences
In this category you may define a measurement setup and the percentiles to be calculated during analysis.
There are three possible settings for the first measurement setup parameter. The first is Basic SLM Setup
for creating a new sound level measurement setup in which the sound level analysis operations for all main
channels are enabled. The second adopts the settings of the currently loaded measurement and the third
offers the possibility to select and load a stored standard setup (from <SAMURAI_Inst_Pfad>\SHSetup).
This setup will be loaded every time a new measurement is created.
Figure 10.3: Preferences window - Measurement
The check box Restart automatically after a “Buffer full” error restarts a running measurement if the
system is used to capacity. Checking this box is very important for longterm field measurements .
Check the box Enable the Back Erase feature to enable the “Back erase” feature (see section 9.9).
Manual SAMURAI
104 of 132
SINUS Messtechnik GmbH
10.4
10.4
Analysis
Analysis
These parameters define the preferences for the analysis operations. The first group defines the number of
multiple octave, FFT and sound level meter analysis operations.
The next parameter is Exponential averaging start value. The parameter defines which start value is used
for exponential averaging.
Figure 10.4: Preferences window - Analysis
SINUS Messtechnik GmbH
105 of 132
Manual SAMURAI
10
10.5
PREFERENCES
Graphical display preferences
The Display category contains three parameters.
Increase font size by: Factor by which the font is increased in the full window display.
Display temperature as: Display unit for measured temperatures.
Display time as: Display of the measurement time for the defined time zone format.
GPS coordinates conversion to UTM: Select the display format for GPS data.
Realtime display of averaged data: Select if only stored data shall be displayed.
Figure 10.5: Preferences window - Display
Manual SAMURAI
106 of 132
SINUS Messtechnik GmbH
10.6
10.6
Audio preferences
Audio preferences
The Audio category includes two groups of parameters. The parameters in the first group define the volume
for replaying a measurement and the second group contains the parameters for the audio comment . The
description of the parameters is given in table 10.2.
Figure 10.6: Preferences window - Audio
Parameter
Description
Normal range
Define the output gain of the PC’s sound card for the range mode Normal.
Extended range
Define the output gain of the PC’s sound card for the range mode Extended. Please note that the
dynamic range in Extended Range is much higher than that supported by a standard sound card.
To replay a faint signal over the PC speakers you should set a high gain.
Apply gain to
exported WAV files
The gain settings are also applied to exported WAV files.
Export WAV as
16 bit integer
If the box is unchecked, WAV files are generally saved in the 32 bits float format.
Max. length
Define the maximum length of an audio comment .
Audio quality
Define the audio quality of the audio comment .
Table 10.2: Parameter Preferences - Audio
SINUS Messtechnik GmbH
107 of 132
Manual SAMURAI
10
10.7
PREFERENCES
Colors preferences
Define several standard display colours of SAMURAI. Open the colour selection wizzard by left-clicking once
on one of the displayed fields. You may choose an available colour or define your own.
Figure 10.7: Preferences window - Colors
Manual SAMURAI
108 of 132
SINUS Messtechnik GmbH
10.8
10.8
Miscellaneous preferences
Miscellaneous preferences
The Miscellaneous category contains several groups of parameters.
Data storage estimation For the calculation of the storage consumed by triggered data recording an estimation of the event duration and the audio signal duration is required (section 6). You may give these
values as percentages of the total measurement duration.
LOG file Here the size of the current <SAMURAI_Inst_Pfad>SAMURAI.LOG file is displayed and restricted
by the parameter Max allowed log file size. If the maximum size is exceeded, the file is deleted just
after a program restart. With the buttons View... and Delete you may view the content of the log file or
delete it.
Enable confirmation ... Check the box to enable an additional dialogue at the end of a measurement in
which you will have to accept or discard the measurement.
Figure 10.8: Preferences window - Miscellaneous
SINUS Messtechnik GmbH
109 of 132
Manual SAMURAI
10
10.9
PREFERENCES
Sound Intensity preferences
Specify the minimum number of FFT lines in the lowest third-octave band for the display of the sound intensity
values (in third octaves) in FFT spectra. The remaining parameters in the window shown in figure 10.9
control the export of sound intensity values (suffix for the sound intensity direction and number of decimal
digits when exporting (in dB or as Engineering Unit)).
Figure 10.9: Preferences window - Sound Intensity
10.10
Messages preferences
SAMURAI may send e-mails or short messages by using output events (see paragraph 4.5). You may set
the parameters for this in the window shown in figure 10.10 .
Figure 10.10: Preferences window - Messages
Manual SAMURAI
110 of 132
SINUS Messtechnik GmbH
10.11
Post Processing preferences
Parameter
Description
Mail Server Name
Alias name or IP address of the mail server
Sender address
E-mail address of the sender
Use e-mail authentication If checked, a login and password is required for logon to the mail server.
Login
Login for authentication
Password
Password for authentication
Mobile/Modem Port
Serial port for connecting a mobile phone or modem.
Baudrate
Data transfer rate of the serial port
PIN of SIM card
Enter the PIN of the used SIM card (leave empty if unnecessary).
Table 10.3: Parameter preferences - messages
10.11
Post Processing preferences
The Post processing group contains the following parameters:
Remember peak files Check this box to permanently save peak files (recommended for long measurements).
Color theme Select colour theme to be used in the post processing window.
New measurement name behaviour When creating a new post processing measurement the name may
be created from the measurement setup file or from the channels name of the first source channel.
Figure 10.11: Preferences Window - Post processing
SINUS Messtechnik GmbH
111 of 132
Manual SAMURAI
10
10.12
PREFERENCES
SINUS driver preferences
SAMURAI may automatically create several additional log files containing important information on possible
hardware or software errors for the service technician. You may define the behaviour of the hardware driver
with respect to individual log files here. Generally, the log files for the measuring hardware are disabled.
Enable the log files if analyzer problems occur. The log file parameters are self-explaining and not described
here (please refer to figure 10.12).
The parameter Number of samples to offset is used for the synchronization of the output data at the device
output with the input data. This feature allows measuring synchronously to the excitation of measurement
alignments.
Check the box Enable the Weather Station driver to enable weather station support.
The parameter Log file verbosity level defines which information are stored to the hardware driver log file.
Figure 10.12: Preferences window - SINUS driver
Manual SAMURAI
112 of 132
SINUS Messtechnik GmbH
11
Sound level meter Soundbook + SAMURAI
11.1
Technical specifications
11.1.1
Specifications Soundbook MK2 + SAMURAI as sound level meter
All technical specifications refer to approved measurement microphones with a sensitivity of 50 mV/Pa.
Technical Specifications:
Scope:
Soundbook (base CF-19 with Windows) and measuring software
Number of channels:
2, 4 or 8 measuring channels
Accuracy:
According to EN 60651 and EN 60804 class 1, IEC 61672-1 class 1, group Z, percentiles according to
DIN 45657
Minimum Configuration:
Soundbook with min. one microphone, cable and calibrator
Display of measurement results:
TFT display with analogue and digital display (CF-19)
Display range:
See table 11.8
Storage of measured values:
SPM, 1/3 octaves, FFT, audio signals, HVMA, Vibration Meter, RPM, GPS-data, Slow input channels,
weather data to hard disk
Measurement period /
Integration time:
0.02 sec . . . n h (n depends on the configuration and frequency of occurrences of trigger events, up to
months), Start/Stop manually or by trigger
Integration response time:
Immediately
Reset (for Over-/Underrangedisplay,
Leq,Lpeak,Ln,Lmax,Lmin etc.)
only by Start/Stop of the measurement (manual or automatically)
Bandwidth for sound recording:
78.125 Hz, 156.25 Hz, 312.5 Hz, 625 Hz, 1.25 kHz / 2.5 kHz / 5 kHz / 10 kHz / 20 kHz / 40 kHz / (optional
80 kHz)
1/3 octave filter:
Complying with EN 61260 class 1, 6 pole, elliptical, base 2
Further operation of features:
Pause of integration time, automatic impulse detector, markers
Interface:
RS232, VGA, LAN, modem, PCMCIA, 2 x USB 2.0, no feedback2
Warm-up-/transient time:
15 sec (only ICP and polarized microphones)
Startup time:
ca. 1 min
Influence of accessories:
Not measurable
Reference conditions:
See registration of applied microphones, (e. g. MK221 from Microtech Gefell PTB Reg.No.: 21.31 92.58)
Acoustic centre:
Centre of the membrane on the surface in reference direction
Max. drift of the internal time:
max. 1.728 ms in 24 h
Freedom from feedback:
All interfaces are free of feedback if there are no ground loops.
Battery:
Li-ion battery CF-VZSU48U, min. measuring time in battery operation > 3 h
External power supply:
100 . . . 240 VAC with adapter CF-AA1633A, input voltage at the Soundbook MK2 15 V
Input channels:
Resolution:
24 Bit
Sampling rates:
51.2 kHz∗ , 102.4 kHz, (optional 204.8 kHz) switchable per channel (currently only in the SMT)
Lower measuring limit:
See table 11.8
Upper measuring limit:
See table 11.8
Frequency weighting:
A, C, Z simultaneously, see table 11.15
Time weighting:
F (Fast, τ = 0.125 s), S (Slow, τ = 1 s), I (Impulse, τincrease = 0.035 s, τdecrease = 1.5 s), peak
(τ = 20 µs)
Crosstalk:
> 80 dB
Decimation rates:
down to 200 Hz sampling rate
Anti-alias Filter:
22.4 kHz @ 51.2 kHz
Overload display:
yes
Phase shift:
< 0.01 ◦ @ -20 dB, 20 Hz . . . 20 kHz
Input filter:
DC, AC fg =0.13 Hz
Transducer supply:
polarization voltage 20 V, 63 V or 200V and ICP (2 mA, 4 mA) (selectable per channel)
Max. electr. measuring range:
± 10 V (+8 % overload backup)
2
avoid ground loops
SINUS Messtechnik GmbH
113 of 132
Manual SAMURAI
11
SOUND LEVEL METER SOUNDBOOK + SAMURAI
Umax at input:
±30 Vpeak
Inherent noise level (at 0 dB
gain):
<6 dB(A), <8 dB(C), <15 dB(Z) (using MV203 and substitute impedance K65), <3 dB(A), <2 dB(C), <5
dB(Z) bei 50 Ω direct at input
Primary measuring range:
30 dB . . . 140 dB (frequency weighting A)
Linearity range:
See table 11.8
Impulse range:
> 55 dB
Sampling rate level/1/3 octave values: 5 . . . 125 ms (higher values possible, but without FAST weighting)
Slow input channels:
Resolution:
24 Bit
Sampling rate:
200 Hz per channel
Input voltage:
± 27.5 V
Input impedance:
100 kΩ
Tacho input:
Frequency:
0.1 Hz . . . 6 MHz
Trigger level:
setable ± 12.5 V
Output channels:
Sampling rate:
25.6, 51.2, 102.4 kHz (optional 204.8 kHz)
Band width:
DC . . . 40 kHz (optional 80 kHz)
Max. output voltage:
±3.7 Vpeak
Attenuation:
0 dB . . . 85 dB in 5 dB-steps
Connectors:
Input channels:
see paragraph 11.3.11
Slow input channels:
see paragraph 11.3.11
Ausgänge:
see paragraph 11.3.11
Dimensions and weights:
Dimensions:
280 mm x 220 mm x 65 mm
Weight:
3100 g
Reference data
Reference sound level:
94 dB∗
Reference frequency:
1 kHz∗
Reference measuring range:
20 . . . 120 dB∗ (gain 0 dB)
Reference direction:
Along the microphone axis
Surrounding conditions
Temperature:
Deviation of calibration < 0,3 dB within a temperature range of -20 ◦ C to 50 ◦ C at a relative humidity of
65 %. After temperature changes of more than 15 ◦ C allow the analyzer to adjust to the temperature for
30 min.
Humidity:
Deviation of calibration < 0,1 dB within a relative humidity range of 30 to 90 % at a temperature of 40 ◦ C
Magnetic fields:
A field of 80 A/m (50 Hz) results in a display of < 20 dB (A), 45 dB (C) and 45 dB (Z)
Vibration:
Acceleration 1 m/s2 (frequency 20 Hz . . . 1 kHz): < 0,1 dB @ 50 dB level
Influence of user:
User has no influence if the microphones are set up at a distance of 1.5 m.
Storage conditions:
-20 ◦ C . . . +60 ◦ C, humidity max. 95 %
Shock resistance:
Complying with MIL-STD 810F 516.5
Electro-magnetic compatibility:
Emission:
Complying with EN 61000-6-1 (2007)
Immunity:
Complying with EN 61000-6-2 (2006)
Configuration:
Soundbook with 4 x MK221/MV203 and 1.5 m cable each
Approved accessories (options):
AC adapter:
CF-AA1633A
Microphone extension cable 5 m:
961014.1
Microphone accessories:
see type approval
Table 11.1:Technical specifications Soundbook MK2 + SAMURAI
Manual SAMURAI
114 of 132
SINUS Messtechnik GmbH
11.1
Technical specifications
The parameters signed with ∗ refer to the model registration according to DIN EN 61672-1:2003. The version
numbers for the driver and SAMURAI are contained in the model registration for the corresponding country.
11.1.2
Specifications Soundbook MK1 + SAMURAI as sound level meter
All technical specifications refer to approved measurement microphones with a sensitivity of 50 mV/Pa.
Technical Specifications:
Scope:
Soundbook (base CF-19 with Windows) and measuring software
Number of channels:
4(2) measuring channels (Normal) or 2(1) measuring channels (extended range)
Accuracy:
According to EN 60651 and EN 60804 class 1, IEC 61672-1 class 1, percentiles according to DIN 45657
Display of measurement results:
TFT display with analogue and digital display (CF-19)
Display range:
See table 11.9
Storage of measured values:
SPM, 1/3 octaves, FFT, audio signals, HVMA, Vibration Meter to hard disk
Measurement period /
Integration time:
0.02 sec . . . 24 h (typical), Start/Stop manually or by trigger
Integration response time:
Immediately
Bandwidth for sound recording:
39.06 Hz, 78.125 Hz, 156.25 Hz, 312.5 Hz, 625 Hz, 1.25 kHz, 2.5 kHz, 5 kHz, 10 kHz, 20 kHz, 40 kHz
1/3 octave filter:
Complying with EN 61260 class 1, 6 pole, elliptical, base 2
Further operation of features:
Pause of integration time, automatic impulse detector, markers
Interface:
RS232, VGA, LAN, modem, PCMCIA, 2 x USB 2.0, no feedback
Warm-up-/transient time:
15 sec (ICP microphone, 200 V microphone)
Influence of accessories:
Not measurable
Reference conditions:
See registration of applied microphones, (e. g. MK221 from Microtech Gefell PTB Reg.No.: 21.31 92.58)
Acoustic centre:
Centre of the membrane on the surface in reference direction
Battery:
Li-ion battery CF-VZSU48U, min. measuring time in battery operation > 3 h
External power supply:
100 . . . 240 VAC with adapter CF-AA1633A, input voltage at the Soundbook MK1 15 V
Input channels 1 - 4 (1 - 2):
Resolution:
20 Bit (level) and 16 Bit (wav)
Sampling rates:
102.4 kHz, 51.2 kHz∗
Lower measuring limit:
See table 11.9
Upper measuring limit:
See table 11.9
Frequency weighting:
A, C, Z simultaneously, see table 11.15
Time weighting:
F (Fast, τ = 0.125 s), S (Slow, τ = 1 s), I (Impulse, τincrease = 0.035 s, τdecrease = 1.5 s), peak
(τ = 20 µs)
Crosstalk:
> 80 dB
Decimation rates:
1/2/4/8 . . . 1024 (by DSP)
Anti-alias filter:
22.4 kHz @ 51.2 kHz
Overload display:
Yes, also for out-of-band frequency
Phase shift:
< 0.1 ◦ @ -20 dB, 20 Hz . . . 20 kHz
Offset correction:
Yes, automatically when self-calibrating
Input filter:
DC, AC 0.15 Hz, HP 10 Hz, LP 2 kHz
Channel cascading:
(Extended-range mode)
Yes, channel 1+2, channel 3+4
Transducer supply:
Microphone: ± 14 V, + 200 V, ICP 2 mA
TEDS according to IEEE P1451:
Yes
Max. electr. measuring range:
± 10 V (+15 % overload backup)
Umax at input:
±15 Vpeak
Inherent noise level (noise floor):
<16 dB(A), <18.8 dB(C), <19.2 dB(Z) (in ”extended range” using MV203 and substitute impedance K65),
<10 dB(ACZ) with 50 Ω at input
Primary measuring range:
50 dB . . . 130 dB (frequency weighting Z); 20 dB . . . 140 dB in ”extended range”
Linearity range:
See table 11.9
Impulse range:
> 55 dB
SINUS Messtechnik GmbH
115 of 132
Manual SAMURAI
11
SOUND LEVEL METER SOUNDBOOK + SAMURAI
Sampling rate level/1/3 octave values: 20 . . . 125 ms (higher values possible, but without FAST weighting)
Slow input channels 5 - 11:
Resolution:
12 Bit
Sum sampling rate:
50 Hz
Input voltage:
0 . . . 15 V
Input impedance:
12 kΩ for channel 5 - 9; 2.5 kΩ for channel 10 + 11
Tacho input:
Frequency:
1/60 Hz . . . 819.2 kHz
Trigger level:
TTL, max. +15 VDC
Oversample trigger:
Sampling rate:
819.2 kHz
Output channels 1 - 4 (1 - 2):
Sampling rate:
As for channel 1 - 4 (1 - 2)
Bandwidth:
DC . . . 40 kHz
Max. output voltage:
±3.16 Vpeak
Attenuation:
+10 dB . . . -50 dB in 1 dB steps
Connectors:
2/4 channel: Inputs 1 - 4
4 x LEMO7, model 1
x
1 x LEMO8, model 1
Inputs 5 - 11
Outputs 1 + 2 / 3 + 4
4 x sound signal, 2x Lemo 3, model 0, short-circuit-proof, ± 3.16 Vpeak
Dimensions and weights:
Dimensions:
280 mm x 220 mm x 65 mm
Weight:
3100 g
Reference data:
Reference sound level:
94 dB∗
Reference frequency:
1 kHz∗
Reference measuring range:
40 . . . 115 dB∗ (gain 0 dB), (20) . . . 135∗ dB in „extended range”
Reference direction:
Along the microphone axis
Surrounding conditions:
Temperature:
Deviation of calibration < 0,3 dB within a temperature range of -20 ◦ C to 50 ◦ C at a relative humidity of
65 %. After temperature changes of more than 15 ◦ C allow the analyzer to adjust to the temperature for
30 min.
Humidity:
Deviation of calibration < 0,1 dB within a relative humidity range of 30 to 90 % at a temperature of 40 ◦ C
Magnetic fields:
A field of 80 A/m (50 Hz) results in a display of < 20 dB (A), 45 dB (C) and 45 dB (Z)
Vibration:
Acceleration 1 m/s2 (frequency 20 Hz . . . 1 kHz): < 0,1 dB @ 50 dB level
Influence of user:
User has no influence if the microphones are set up at a distance of 1.5 m.
Storage conditions:
-20 ◦ C . . . +60 ◦ C, humidity max. 95 %
Shock resistance:
Complying with MIL-STD 810F 516.5
Electro-magnetic compatibility:
Emission:
Complying with EN 61000-6-4 (2007)
Immunity:
Complying with EN 61000-6-2 (2006)
Configuration:
Soundbook with 4 x MK221/MV203 and 1.5 m cable each
Approved accessories (options):
AC adapter:
CF-AA1633A
Microphone extension cable 5 m:
961014.1
Microphone accessories:
see type approval
Table 11.2:Technical specifications Soundbook MK1 + SAMURAI
The parameters signed with ∗ refer to the model registration according to DIN EN 61672-1:2003. The version
numbers for the driver and SAMURAI are contained in the model registration for the corresponding country.
Manual SAMURAI
116 of 132
SINUS Messtechnik GmbH
11.1
11.1.3
Technical specifications
Specifications Soundbook octav + SAMURAI as sound level meter
All technical specifications refer to approved measurement microphones with a sensitivity of 50 mV/Pa.
Technical Specifications:
Scope:
SAMURAI (base CF-19 with Windows XP) and measuring software
Number of channels:
8 measuring channels
Accuracy:
According to EN 60651 and EN 60804 class 1, IEC 61672-1 class 1, percentiles according to DIN 45657
Display of measurement results:
TFT display with analogue and digital display (CF-19)
Display range:
See table 11.10
Storage of measured values:
SPM, 1/3 octaves, FFT, audio signals, HVMA, Vibration Meter to hard disk
Measurement period /
Integration time:
0.02 sec . . . 24 h (typical), Start/Stop manually or by trigger
Integration response time:
Immediately
Bandwidth for sound recording:
39.06 Hz, 78.125 Hz, 156,25 Hz, 312.5 Hz, 625 Hz, 1.25 kHz / 2.5 kHz / 5 kHz / 10 kHz / 20 kHz
1/3 octave filter:
Complying with EN 61260 class 1, 6 pole, elliptical, base 2
Further operation of features:
Pause of integration time, automatic impulse detector, markers
Interface:
RS232, VGA, LAN, modem, PCMCIA, 2 x USB 2.0, no feedback
Warm-up-/transient time:
15 sec (ICP microphone)
Influence of accessories:
Not measurable
Reference conditions:
See registration of applied microphones, (e. g. MK221 from Microtech Gefell PTB Reg.No.: 21.31 92.58)
Acoustic centre:
Centre of the membrane on the surface in reference direction
Battery:
Li-ion battery CF-VZSU48U, min. measuring time in battery operation > 3 h
External power supply:
100 . . . 240 VAC with adapter CF-AA1633A, input voltage at the Soundbook 15 V
Input channels 1 - 8 :
Resolution:
20 Bit (level) and 16 Bit (wav)
Sampling rates:
51.2 kHz∗
Lower measuring limit:
See table 11.10
Upper measuring limit:
See table 11.10
Frequency weighting:
A, C, Z simultaneously, see table 11.15
Time weighting:
F (Fast, τ = 0.125 s), S (Slow, τ = 1 s), I (Impulse, τincrease = 0.035 s, τdecrease = 1.5 s), peak
(τ = 20µs)
Crosstalk:
> 80 dB
Decimation rates:
1/2/4/8 . . . 1024 (by DSP)
Anti-alias filter:
22.4 kHz @ 51.2 kHz
Overload display:
Yes, also for out-of-band frequency
Phase shift:
< 0.1 ◦ @ -20 dB, 20 Hz . . . 20 kHz
Offset correction:
Yes, automatically when self-calibrating
Input filter:
DC, AC 0.15 Hz, HP 10 Hz
Channel cascading:
(Extended-range mode)
No
Transducer supply:
ICP (2 mA)
TEDS according to IEEE P1451:
Yes
Max. electr. measuring range:
± 10 V (+15 % overload backup)
Umax at input:
±15 Vpeak
Inherent noise level (noise floor):
<16 dB(A), <18.8 dB(C), <19.2 dB(Z) (with 20 dB gain using MV203 and substitute impedance K65),
<10 dB(ACZ) with 50 Ω at input
Primary measuring range:
40 dB . . . 130 dB (frequency weighting Z)
Linearity range:
See table 11.10
Impulse range:
> 55 dB
Sampling rate level/1/3 octave values: 20 . . . 125 ms (higher values possible, but without FAST weighting)
Tacho input:
Frequency:
SINUS Messtechnik GmbH
1/60 Hz . . . 819.2 kHz
117 of 132
Manual SAMURAI
11
Trigger level:
SOUND LEVEL METER SOUNDBOOK + SAMURAI
TTL, max. +15 VDC
Oversample trigger:
Sampling rate:
819.2 kHz
Output channels 1 - 4:
Sampling rate:
As for channel 1 - 8
Bandwidth:
DC . . . 20 kHz
Max. output voltage:
±3.16 Vpeak
Attenuation:
+10 dB . . . -50 dB in 1 dB steps
Connectors:
Inputs 1 - 8
8 x LEMO-Triax
Outputs 1 + 2 / 3 + 4
4 x sound signal, 2x Lemo 3, model 0, short-circuit-proof, ± 3.16 Vpeak
Dimensions and weights:
Dimensions:
280 mm x 220 mm x 65 mm
Weight:
3100 g
Reference data:
Reference sound level:
94 dB∗
Reference frequency:
1 kHz∗
Reference measuring range:
45 . . . 120 dB∗
Reference direction:
Along the microphone axis
Surrounding conditions:
Temperature:
Deviation of calibration < 0,3 dB within a temperature range of -20 ◦ C to 50 ◦ C at a relative humidity of
65 %. After temperature changes of more than 15 ◦ C allow the analyzer to adjust to the temperature for
30 min.
Humidity:
Deviation of calibration < 0,1 dB within a relative humidity range of 30 to 90 % at a temperature of 40 ◦ C
Magnetic fields:
A field of 80 A/m (50 Hz) results in a display of < 20 dB (A), 45 dB (C) and 45 dB (Z)
Vibration:
Acceleration 1 m/s2 (frequency 20 Hz . . . 1 kHz): < 0,1 dB @ 50 dB level
Influence of user:
User has no influence if the microphones are set up at a distance of 1.5 m.
Storage conditions:
-20 ◦ C . . . +60 ◦ C, humidity max. 95 %
Shock resistance:
Complying with MIL-STD 810F 516.5
Electro-magnetic compatibility:
Emission:
Complying with EN 50081-1 (1992)
Immunity:
Complying with EN 50082-1 (1997)
Approved accessories (options):
AC adapter:
CF-AA1633A
Microphone extension cable 5 m:
961014.1
Microphone accessories:
See certification
Table 11.3:Technical specifications Soundbook octav + SAMURAI
The parameters signed with ∗ refer to the model registration according to DIN EN 61672-1:2003. The version
numbers for the driver and SAMURAI are contained in the model registration for the corresponding country.
Manual SAMURAI
118 of 132
SINUS Messtechnik GmbH
11.2
11.2
Centre frequencies of fractional octaves
Centre frequencies of fractional octaves
The centre frequencies of fractional octave bands are given for a sampling rate 51.2 kHz (bandwidth of
20 kHz). If you change the bandwidth in the setup, the centre frequencies are shifted by the same factor to
51.2 kHz.
Index fmin Hz
Index fmin Hz
Index fmin Hz
Index fmin Hz
Index fmin Hz
13
20158
1
1259
-11
78,7
-23
4,92
-35
0,308
12
16000
0
1000
-12
62,5
-24
3,90
-36
0,244
11
12699
-1
793
-13
49,6
-25
3,10
-37
0,194
10
10079
-2
629
-14
39,4
-26
2,46
-38
0,154
9
8000
-3
500
-15
31,25
-27
1,953
-39
0,122
8
6349
-4
396
-16
24,80
-28
1,550
-40
0,097
7
5039
-5
315
-17
19,69
-29
1,230
-41
0,077
6
4000
-6
250
-18
15,63
-30
0,977
-42
0,061
5
3174
-7
198,4
-19
12,40
-31
0,775
-43
0,048
4
2519
-8
157,5
-20
9,84
-32
0,615
-44
0,038
3
2000
-9
125,0
-21
7,81
-33
0,488
2
1587
-10
99,2
-22
6,20
-34
0,388
Table 11.4: Center frequencies for 1/3 octaves and fractional octaves according to EN 61260
Index fmin Hz
Index fmin Hz
Index fmin Hz
Index fmin Hz
Index fmin Hz
Index fmin Hz
26
21357
6
2119
-14
210
-34
20,86
-54
2,07
-74
0,205
25
19027
5
1888
-15
187
-35
18,58
-55
1,85
-75
0,183
24
16951
4
1682
-16
167
-36
16,55
-56
1,64
-76
0,163
23
15102
3
1498
-17
149
-37
14,75
-57
1,46
-77
0,145
22
13454
2
1335
-18
132
-38
13,14
-58
1,30
-78
0,129
21
11986
1
1189
-19
118
-39
11,71
-59
1,16
-79
0,115
20
10679
0
1059
-20
105
-40
10,43
-60
1,03
-80
0,103
19
9514
-1
944
-21
93,64
-41
9,29
-61
0,922
-81
0,091
18
8476
-2
841
-22
83,43
-42
8,28
-62
0,821
-82
0,081
17
7551
-3
749
-23
74,33
-43
7,37
-63
0,732
-83
0,073
16
6727
-4
667
-24
66,22
-44
6,57
-64
0,652
-84
0,065
15
5993
-5
595
-25
59,0
-45
5,85
-65
0,581
-85
0,058
14
5339
-6
530
-26
52,56
-46
5,21
-66
0,517
-86
0,051
13
4757
-7
472
-27
46,82
-47
4,65
-67
0,461
-87
0,046
12
4238
-8
420
-28
41,71
-48
4,14
-68
0,411
-88
0,041
11
3775
-9
375
-29
37,16
-49
3,69
-69
0,366
10
3364
-10
334
-30
33,11
-50
3,29
-70
0,326
9
2997
-11
297
-31
29,50
-51
2,93
-71
0,290
8
2670
-12
265
-32
26,28
-52
2,61
-72
0,259
7
2378
-13
236
-33
23,41
-53
2,32
-73
0,230
Table 11.5: Center frequencies for fractional 1/6 octaves according to EN 61260
SINUS Messtechnik GmbH
119 of 132
Manual SAMURAI
11
Index fmin Hz
Index fmin Hz
SOUND LEVEL METER SOUNDBOOK + SAMURAI
Index fmin Hz
Index fmin Hz
Index fmin Hz
Index fmin Hz
53
21983
15
2448
-23
272.6
-61
30.36
-99
3.381
-137
0.377
52
20749
14
2311
-24
257.3
-62
28.656
-100
3.191
-138
0.355
51
19585
13
2181
-25
242.9
-63
27.048
-101
3.012
-139
0.335
50
18486
12
2059
-26
229.3
-64
25.53
-102
2.843
-140
0.317
49
17448
11
1943
-27
216.4
-65
24.097
-103
2.684
-141
0.299
48
16469
10
1834
-28
204.2
-66
22.745
-104
2.533
-142
0.282
47
15545
9
1731
-29
192.8
-67
21.468
-105
2.391
-143
0.266
46
14672
8
1634
-30
182
-68
20.263
-106
2.257
-144
0.251
45
13849
7
1542
-31
171.7
-69
19.126
-107
2.13
-145
0.237
44
13071
6
1456
-32
162.1
-70
18.052
-108
2.01
-146
0.224
43
12338
5
1374
-33
153
-71
17.039
-109
1.898
-147
0.211
42
11645
4
1297
-34
144.4
-72
16.083
-110
1.791
-148
0.199
41
10992
3
1224
-35
136.3
-73
15.18
-111
1.691
-149
0.188
40
10375
2
1155
-36
128.7
-74
14.328
-112
1.596
-150
0.178
39
9792
1
1091
-37
121.4
-75
13.524
-113
1.506
-151
0.168
38
9243
0
1029
-38
114.6
-76
12.765
-114
1.422
-152
0.158
37
8724
-1
971.5
-39
108.2
-77
12.049
-115
1.342
-153
0.149
36
8234
-2
917
-40
102.1
-78
11.372
-116
1.266
-154
0.141
35
7772
-3
865.5
-41
96.388
-79
10.734
-117
1.195
-155
0.133
34
7336
-4
817
-42
90.978
-80
10.132
-118
1.128
-156
0.126
33
6924
-5
771.1
-43
85.872
-81
9.563
-119
1.065
-157
0.119
32
6536
-6
727.8
-44
81.052
-82
9.026
-120
1.005
-158
0.112
31
6169
-7
687
-45
76.503
-83
8.52
-121
0.949
-159
0.106
30
5823
-8
648.4
-46
72.21
-84
8.041
-122
0.896
-160
0.1
29
5496
-9
612
-47
68.157
-85
7.59
-123
0.845
-161
0.094
28
5187
-10
577.7
-48
64.331
-86
7.164
-124
0.798
-162
0.089
27
4896
-11
545.3
-49
60.721
-87
6.762
-125
0.753
-163
0.084
26
4621
-12
514.7
-50
57.313
-88
6.382
-126
0.711
-164
0.079
25
4362
-13
485.8
-51
54.096
-89
6.024
-127
0.671
-165
0.075
24
4117
-14
458.5
-52
51.06
-90
5.686
-128
0.633
-166
0.071
23
3886
-15
432.8
-53
48.194
-91
5.367
-129
0.598
-167
0.067
22
3668
-16
408.5
-54
45.489
-92
5.066
-130
0.564
-168
0.063
21
3462
-17
385.6
-55
42.936
-93
4.781
-131
0.532
-169
0.059
20
3268
-18
363.9
-56
40.526
-94
4.513
-132
0.503
-170
0.056
19
3084
-19
343.5
-57
38.252
-95
4.26
-133
0.474
-171
0.053
18
2911
-20
324.2
-58
36.105
-96
4.021
-134
0.448
-172
0.05
17
2748
-21
306
-59
34.078
-97
3.795
-135
0.423
-173
0.047
16
2594
-22
288.8
-60
32.166
-98
3.582
-136
0.399
-174
0.044
Table 11.6: Center frequencies for fractional 1/12 octaves according to EN 61260
Manual SAMURAI
120 of 132
SINUS Messtechnik GmbH
11.2
Index
fmin Hz
Index
fmin Hz
Index
fmin Hz
Centre frequencies of fractional octaves
fmin Hz
Index
fmin Hz
Index
fmin Hz
Index
fmin Hz
Index
fmin Hz
107
22303
50
4299
-7
828.8
Index
-64
159.8
-121
30.802
-178
5.938
-235
1.145
-292
0.221
106
21668
49
4177
-8
805.2
-65
155.2
-122
29.925
-179
5.769
-236
1.112
-293
0.214
105
21051
48
4058
-9
782.3
-66
150.8
-123
29.073
-180
5.605
-237
1.08
-294
0.208
104
20452
47
3943
-10
760.1
-67
146.5
-124
28.246
-181
5.445
-238
1.05
-295
0.202
103
19870
46
3830
-11
738.4
-68
142.3
-125
27.441
-182
5.29
-239
1.02
-296
0.197
102
19304
45
3721
-12
717.4
-69
138.3
-126
26.66
-183
5.139
-240
0.991
-297
0.191
101
18755
44
3615
-13
697
-70
134.4
-127
25.901
-184
4.993
-241
0.963
-298
0.186
100
18221
43
3513
-14
677.1
-71
130.5
-128
25.164
-185
4.851
-242
0.935
-299
0.18
99
17702
42
3413
-15
657.9
-72
126.8
-129
24.448
-186
4.713
-243
0.909
-300
0.175
98
17198
41
3315
-16
639.1
-73
123.2
-130
23.752
-187
4.579
-244
0.883
-301
0.17
97
16708
40
3221
-17
620.9
-74
119.7
-131
23.075
-188
4.448
-245
0.858
-302
0.165
96
16233
39
3129
-18
603.3
-75
116.3
-132
22.418
-189
4.322
-246
0.833
-303
0.161
95
15771
38
3040
-19
586.1
-76
113
-133
21.78
-190
4.199
-247
0.809
-304
0.156
94
15322
37
2954
-20
569.4
-77
109.8
-134
21.16
-191
4.079
-248
0.786
-305
0.152
93
14885
36
2870
-21
553.2
-78
106.6
-135
20.558
-192
3.963
-249
0.764
-306
0.147
92
14462
35
2788
-22
537.4
-79
103.6
-136
19.973
-193
3.85
-250
0.742
-307
0.143
91
14050
34
2709
-23
522.1
-80
100.7
-137
19.404
-194
3.741
-251
0.721
-308
0.139
90
13650
33
2631
-24
507.3
-81
97.79
-138
18.852
-195
3.634
-252
0.701
-309
0.135
89
13261
32
2556
-25
492.8
-82
95.006
-139
18.315
-196
3.531
-253
0.681
-310
0.131
88
12884
31
2484
-26
478.8
-83
92.302
-140
17.794
-197
3.43
-254
0.661
-311
0.127
87
12517
30
2413
-27
465.2
-84
89.674
-141
17.287
-198
3.333
-255
0.642
-312
0.124
86
12161
29
2344
-28
451.9
-85
87.121
-142
16.795
-199
3.238
-256
0.624
-313
0.12
85
11815
28
2278
-29
439.1
-86
84.641
-143
16.317
-200
3.145
-257
0.606
-314
0.117
84
11478
27
2213
-30
426.6
-87
82.231
-144
15.852
-201
3.056
-258
0.589
-315
0.114
83
11152
26
2150
-31
414.4
-88
79.89
-145
15.401
-202
2.969
-259
0.572
-316
0.11
82
10834
25
2089
-32
402.6
-89
77.616
-146
14.963
-203
2.884
-260
0.556
-317
0.107
81
10526
24
2029
-33
391.2
-90
75.407
-147
14.537
-204
2.802
-261
0.54
-318
0.104
80
10226
23
1971
-34
380
-91
73.26
-148
14.123
-205
2.723
-262
0.525
-319
0.101
79
9935
22
1915
-35
369.2
-92
71.174
-149
13.721
-206
2.645
-263
0.51
-320
0.098
78
9652
21
1861
-36
358.7
-93
69.148
-150
13.33
-207
2.57
-264
0.495
-321
0.095
77
9377
20
1808
-37
348.5
-94
67.18
-151
12.951
-208
2.497
-265
0.481
-322
0.093
76
9110
19
1756
-38
338.6
-95
65.267
-152
12.582
-209
2.426
-266
0.468
-323
0.09
75
8851
18
1706
-39
328.9
-96
63.409
-153
12.224
-210
2.356
-267
0.454
-324
0.088
74
8599
17
1658
-40
319.6
-97
61.604
-154
11.876
-211
2.289
-268
0.441
-325
0.085
73
8354
16
1610
-41
310.5
-98
59.85
-155
11.538
-212
2.224
-269
0.429
-326
0.083
72
8116
15
1565
-42
301.6
-99
58.146
-156
11.209
-213
2.161
-270
0.417
-327
0.08
71
7885
14
1520
-43
293
-100
56.491
-157
10.89
-214
2.099
-271
0.405
-328
0.078
70
7661
13
1477
-44
284.7
-101
54.883
-158
10.58
-215
2.04
-272
0.393
-329
0.076
69
7443
12
1435
-45
276.6
-102
53.32
-159
10.279
-216
1.982
-273
0.382
-330
0.074
68
7231
11
1394
-46
268.7
-103
51.803
-160
9.986
-217
1.925
-274
0.371
-331
0.072
67
7025
10
1354
-47
261.1
-104
50.328
-161
9.702
-218
1.87
-275
0.361
-332
0.07
66
6825
9
1316
-48
253.6
-105
48.895
-162
9.426
-219
1.817
-276
0.35
-333
0.068
65
6631
8
1278
-49
246.4
-106
47.503
-163
9.157
-220
1.765
-277
0.34
-334
0.066
64
6442
7
1242
-50
239.4
-107
46.151
-164
8.897
-221
1.715
-278
0.331
-335
0.064
63
6259
6
1207
-51
232.6
-108
44.837
-165
8.644
-222
1.666
-279
0.321
-336
0.062
62
6080
5
1172
-52
226
-109
43.561
-166
8.397
-223
1.619
-280
0.312
-337
0.06
61
5907
4
1139
-53
219.5
-110
42.32
-167
8.158
-224
1.573
-281
0.303
-338
0.058
60
5739
3
1106
-54
213.3
-111
41.116
-168
7.926
-225
1.528
-282
0.295
-339
0.057
59
5576
2
1075
-55
207.2
-112
39.945
-169
7.7
-226
1.484
-283
0.286
-340
0.055
58
5417
1
1044
-56
201.3
-113
38.808
-170
7.481
-227
1.442
-284
0.278
-341
0.054
57
5263
0
1015
-57
195.6
-114
37.703
-171
7.268
-228
1.401
-285
0.27
-342
0.052
56
5113
-1
985.7
-58
190
-115
36.63
-172
7.061
-229
1.361
-286
0.262
-343
0.051
55
4967
-2
957.6
-59
184.6
-116
35.587
-173
6.86
-230
1.323
-287
0.255
-344
0.049
54
4826
-3
930.3
-60
179.3
-117
34.574
-174
6.665
-231
1.285
-288
0.248
-345
0.048
53
4689
-4
903.9
-61
174.2
-118
33.59
-175
6.475
-232
1.248
-289
0.241
-346
0.046
52
4555
-5
878.1
-62
169.3
-119
32.634
-176
6.291
-233
1.213
-290
0.234
-347
0.045
51
4425
-6
853.1
-63
164.5
-120
31.705
-177
6.112
-234
1.178
-291
0.227
-348
0.044
Table 11.7: Center frequencies for fractional 1/24 octaves according to EN 61260
SINUS Messtechnik GmbH
121 of 132
Manual SAMURAI
11
SOUND LEVEL METER SOUNDBOOK + SAMURAI
11.3
Analyzer
11.3.1
Messbereiche und lineare Arbeitsbereiche
The linearity ranges of sound pressure levels for all measuring ranges and frequency weightings are given in
the following. All specifications refer to approved measurement microphones with a sensitivity of 50 mV/Pa.
f =31.5 Hz
Range Weighting
Z
1V
f =4 kHz
f =8 kHz
f =12.5 kHz
14.4 . . . 118.7 dB 15.3 . . . 118.7 dB 15.0 . . . 118.7 dB 15.1 . . . 118.7 dB 14.7 . . . 118.7 dB
A
10 V
f =1 kHz
9.9 . . . 78.3 dB 11.3 . . . 119.3 dB 12.1 . . . 119.4 dB 10.4 . . . 117.5 dB
9.1 . . . 114.3 dB
C
12.5 . . . 115.8 dB 13.5 . . . 118.7 dB 13.0 . . . 117.9 dB 12.6 . . . 115.6 dB 12.4 . . . 112.3 dB
Z
26.2 . . . 138.7 dB 28.6 . . . 138.7 dB 27.3 . . . 138.7 dB 27.4 . . . 138.7 dB 27.3 . . . 138.7 dB
A
23.4 . . . 98.3 dB 24.4 . . . 139.2 dB 24.0 . . . 139.6 dB 24.5 . . . 137.5 dB 23.8 . . . 134.3 dB
C
23.7 . . . 135.6 dB 24.7 . . . 138.7 dB 23.4 . . . 137.8 dB 24.0 . . . 135.6 dB 23.3 . . . 132.4 dB
Table 11.8: Linearity ranges (typical) for Soundbook MK2 according to frequency weightings Z, A and C
f =31.5 Hz
Weighting
f =1 kHz
f =4 kHz
f =8 kHz
f =12.5 kHz
Z
45.0 . . . 135.0 dB 38.0 . . . 135.0 dB 36.0 . . . 135.0 dB 34.0 . . . 135.0 dB 34.0 . . . 135.0 dB
A
16.0 . . . 94.5 dB 16.0 . . . 135.0 dB 16.0 . . . 136.0 dB 16.0 . . . 133.9 dB 16.0 . . . 130.6 dB
C
41.5 . . . 132.0 dB 17.0 . . . 135.0 dB 17.0 . . . 134.2 dB 17.0 . . . 132.0 dB 17.0 . . . 128.7 dB
Table 11.9: Linearity ranges (typical) for Soundbook MK1 in the extended measuring range
Weighting Range: 10 V
Range: 1 V Range: 0.1 V Range: 0.01 V
Z
65 . . . 130 dB 45 . . . 120 dB 40 . . . 100 dB
40 . . . 80 dB
A
65 . . . 130 dB 45 . . . 120 dB 28 . . . 100 dB
28 . . . 80 dB
C
65 . . . 130 dB 45 . . . 120 dB 40 . . . 100 dB
34 . . . 80 dB
Table 11.10: Linearity range for Soundbook MK1„octav” at 1 kHz
C-weighted peak sound pressure level:
Range
C-Peak Soundbook MK1
C-Peak Soundbook MK2
10 V
65 . . . 138 dB
30 . . . 138 dB
3.16 V
55 . . . 130 dB
-
1V
45 . . . 120 dB
18 . . . 118 dB
0.316 V
35 . . . 110 dB
-
0.1 V
25 . . . 100 dB
-
0.0316 V
25 . . . 90 dB
-
0.01 V
25 . . . 80 dB
-
extended range
25 . . . 138 dB
-
Table 11.11: Linearity ranges of C-weighted peak sound pressure level
11.3.2
Inherent noise
In the following tables the inherent noise of the analyser ist characterized for all measuring ranges until
20 kHz. Therefore the testing was done with a terminating resistor of 50 Ω only and the alternate capacitance
K65 additionally. Assuming typical values for the noise of microphone capsule the resulting noise of the
whole system can be calculated.
Manual SAMURAI
122 of 132
SINUS Messtechnik GmbH
11.3
Frequency Capsule
weighting
typical
Analyzer
Measuring Range: 1 V
Measuring Range: 10 V
Soundbook MK2 Soundbook MK2 + K65
All
Soundbook MK2 Soundbook MK2 + K65
All
dB(Z)
20.0
5.3
12.3
20.7
19.8
21.0
23.5
dB(A)
16.0
2.3
5.2
16.3
16.9
17.0
19.5
dB(C)
16.0
1.2
6.7
16.5
15.8
16.5
19.3
Table 11.12: Inherent noise of Soundbook MK2 alone, with preamplifier and with microphone capsule
dB(A) dB(Z) dB(C)
3
Microphone
16.0
20.0
16
Soundbook +
preamplifier
3.0
15.4
15.5
total
16.2
21.3
electric 10 Hz - 20 kHz acoustic 10 Hz - 20 kHz
dBV(Z) dBV(A) dBV(C) dB(Z) dB(A)
MV203+MK221
-80
-85
-84
20
15
16
MM210
-80
-84
-84
20
16
16
WME952
-80
-84
-84
20
16
16
18.8
Tolerance ±0.2 dB each
dB(C)
Table 11.14: Inherent noise of the microphones (Declared by supplier at
Table 11.13: Inherent noise in the range
10 Hz - 20 kHz
50 mV/Pa capsule sensitivity)
The highest inherent noise level may be expected when several microphones are connected, when using a
microphone extension cable and with mains power supply.
ATTENTION!
Avoid ground loops at the input channels.
For measuring low sound levels (20 to 74 dB) no special action are required. If you want to measure sound
levels < 20 dB, you may use the noise floor correction for A-weighted sound levels (see table 2.4).
11.3.3
Frequency response of the analyzer
0
0
−0.5
−0.5
−1
−1
−1.5
−1.5
Amplitude in dB
Amplitude in dB
The rated frequency response of the analyzer ranges from 2.3 Hz to 22 kHz. It is linear at 0 dB with a
tolerance of ±0.1 dB (1 Hz HP enabled, see paragraph 4.1.1).
−2
−2
−2.5
−2.5
−3
−3
−3.5
−3.5
−4
0.6
0.8
1
1.2
1.4
1.6
1.8
Frequenz in Hz
2
Figure 11.1: Lower frequency range
11.3.4
2.2
2.4
2.6
−4
18
19
20
21
22
Frequenz in kHz
23
24
25
Figure 11.2: Upper frequency range
Frequency weightings
Due to the frequency weightings (A and C) being digital class 0 filters according to IEC 60651/ 60804 and
DIN EN 61672-1:2003, which do not change, no correction of these filters is necessary. The following table
contains amplifications for A- and C-weightings.
3
The microphone capsule was replaced by a substitute impedance closed with 50 Ω (K65 from Microtech Gefell).
SINUS Messtechnik GmbH
123 of 132
Manual SAMURAI
11
SOUND LEVEL METER SOUNDBOOK + SAMURAI
A
C
acc. to 60651
acc. to 60651
A
C
acc. to 60651
acc. to 60651
A
C
Z
10
-70.0
-14.3
-69.52 -14.36 -0.04
500
-3.2
0
-3.25
0.03
0.00
12.5
-63.4
-11.2
-63.40 -11.36 -0.03
630
-1.9
0
-1.91
0.03
0.00
16
-56.7
-8.5
-56.40
-8.44
-0.01
800
-0.8
0
-0.77
0.05
0.03
20
-50.5
-6.2
-50.42
-6.25
-0.03
1.0k
0
0
0.03
0.03
0.03
25
-44.7
-4.4
-44.86
-4.48
-0.04
1.25k
0.6
0
0.58
-0.03
0.00
31.5
-39.4
-3.0
-39.54
-3.04
0.00
1.6k
1.0
-0.1
1.01
-0.08
0.01
40
-34.6
-2.0
-34.55
-1.99
-0.01
2.0k
1.2
-0.2
1.20
-0.17
-0.01
50
-30.2
-1.3
-30.29
-1.31
-0.01
2.50k
1.3
-0.3
1.27
-0.3
-0.02
63
-26.2
-0.8
-26.23
-0.83
0.00
3.15k
1.2
-0.5
1.23
-0.48
0.01
80
-22.5
-0.5
-22.38
-0.47
0.03
4.0k
1.0
-0.8
1.00
-0.81
0.00
100
-19.1
-0.3
-19.12
-0.28
0.02
5.0k
0.5
-1.3
0.61
-1.26
-0.01
125
-16.1
-0.2
-16.19
-0.17
0.01
6.3k
-0.1
-2.0
-0.04
-1.96
0.00
160
-13.4
-0.1
-13.23
-0.06
0.02
8.0k
-1.1
-3.0
-1.02
-2.98
0.02
200
-10.9
0
-10.85
-0.03
0.00
10.0k
-2.5
-4.4
-2.36
-4.35
0.02
250
-8.6
0
-8.69
-0.01
-0.01
12.5k
-4.3
-6.2
-4.17
-6.18
0.00
315
-6.6
0
-6.63
0.03
0.02
16.0k
-6.6
-8.5
-6.68
-8.69
0.01
400
-4.8
0
-4.77
0.03
0.01
20.0k
-9.3
-11.2
-9.25 -11.23 -0.01
f in Hz
A
C
Z
f in Hz
Table 11.15: frequency weighting curves IEC 60651/60804 and SAMURAI (dB)
11.3.5
Measuring crosstalk
Please pay attention to the following points when measuring crosstalk.
1. Connect a signal generator to the input channel.
2. Terminate all remaining channels with a terminal resistance (50 Ω).
3. Only measure in battery supply mode!
ATTENTION!
11.3.6
Avoid ground loops at the input channels (use an isolation transformer for
the generator, if required).
EMC specifications
If the SAMURAI is exposed to an electromagnetic field, the upper limits of the ranges in the tables ?? and
?? may increase by 5 dB. Within the changed ranges the error tolerances specified in DIN EN 61672-1:2003
are met.
When exposed to an electromagnetic field, the primary measuring range (up to crest factor 10) changes to
38. . . 118 dB(Z) and the linearity range to 29. . . 135 dB(A).
No performance decreases will occur after electrostatic discharges at the device (contact discharge up to
4 kV and air discharge up to 8 kV).
ATTENTION!
Manual SAMURAI
For EMC reasons only the original LEMO BNC adapter and the original
microphone extensions cables with ferrite core must be used for calibrated
measurements.
124 of 132
SINUS Messtechnik GmbH
11.3
11.3.7
Analyzer
ATTENTION!
When exposed to electromagnetic fields of 10 V/m, the device is not specified for the measurement of sound levels below 74 dB.
ATTENTION!
When exposed to electromagnetic fields of more than 10 V/m, the device
is not specified for measurements in all level ranges.
Mains frequency and high frequency fields
With respect to the immunity to mains and high frequency fields Soundbook complies with the requirements
of DIN EN 61672-1:2003.
The immunity to mains and high frequency fields is highest in battery supply mode with short microphone
cables (1.5 m).
In the configuration with long cables (3 m and longer), in mains supply mode and measuring, the HF emissions of the device are highest. The immunity to mains and high frequency fields is lowest in this configuration (configuration see figure 11.3). A lower emission level is reached if the device is in STOP mode in the
same hardware configuration.
The sound level meter may not be used for measuring levels below 74 dB according to section 6.6.9 of DIN
EN 61672-1:2003.
The sound level meter is not designed for an electric field strength of more than 10 V/m.
ATTENTION!
Avoid ground loops at the input channels.
Figure 11.3: Configuration measurement HF immunity
SINUS Messtechnik GmbH
125 of 132
Manual SAMURAI
11
11.3.8
SOUND LEVEL METER SOUNDBOOK + SAMURAI
Mechanical vibrations
The influence of mechanical vibrations only depends on the used microphone.
Mechanical vibrations at the Soundbook do not affect the measuring result, unless they exceed the permitted
values specified in the tables 11.2 and 11.3 or in the Soundbook user’s manual.
11.3.9
Microphone setup
Only use the supplied stand for setting up the microphones. Set up the stand at the largest possible distance
to the Soundbook to minimize the effect of the person performing the measurement and the Soundbook
itself on the measurement. Please note the sketch in figure 11.4. If you need to wind up a cable, place it at
the nearest possible distance to the Soundbook to avoid negative effects. Fixing cables to the microphone
stand is not necessary.
Since the microphone reference direction runs along the microphone axis, you have to position the microphone with its longitudinal axis vertical to the sound source.
If the microphones are exposed to mechanical vibrations, the longitudinal axis of the microphone has to be
vertical to the excitation direction. If that is not possible, you have to decouple the microphone mechanically.
When setting up the microphones, please ensure that no ground connection may be established between
the microphones. Use the original microphone stands and cables for avoiding a connection to ground. Also
avoid ground loops caused by parts clinging to the microphones/microphone stands.
Figure 11.4: Setting up the microphone
11.3.10
Effect of the accessories in the measuring microphones
The microphones are always connected to the device via extension cables. Therefore the effect of the Soundbook or of persons on the measurement may be ignored due to the spatial separation. When calibrating a
microphone, always use the corresponding cable to connect the microphone to the device. Accordingly, you
have to recalibrate the microphone if you exchange a cable (f.e. 3 m cable). The optional windscreen has
no measurable effect on the measurement results.
Manual SAMURAI
126 of 132
SINUS Messtechnik GmbH
11.3
11.3.11
Analyzer
Connectors and pin assignments of Soundbook MK2
LED2
+14V
BUTTON1
INPUT_GND
1
LED1
6
1
2
7
5
-14V
2
7
8
BUTTON2
3
6
-14V
3
4
4
+200V
5
INPUT
+200V
Figure 11.5: Input socket assignment for devices with Lemo7
connectors
+14V
Figure 11.6: Input socket assignment - Auxiliary channels
V_BAT
V_BAT
RXD
1
SLOW_IN1
1
6
SLOW_IN2
7
V_BAT
SLOW_IN8
7
3
2
6
SLOW_IN3
3
PPS
SLOW_IN7
9
TXD
5
8
2
SLOW_IN6
4
5
4
SLOW_IN4
V_USB
Figure 11.7: ”POWER,SYNC,GPS” socket assignment
SLOW_IN5
Figure 11.8: SLOW channels assignment
TRG_IN1
TRG_OUT2
OUTPUT1
1
1
6
7
TRG_IN2
5
TRG_COM
2
2
3
3
OUTPUT2
V_BAT
OUTPUT_GND
Figure 11.9: Socket assignment of output channels ”OUT 1/2”
SINUS Messtechnik GmbH
127 of 132
4
TRG_OUT1
Figure 11.10: ”TRG” socket assignment (trigger in-/outputs)
Manual SAMURAI
11
11.3.12
SOUND LEVEL METER SOUNDBOOK + SAMURAI
Connector assignment of Soundbook MK1
Connector assignment for 2- and 4-channel devices
S_IN1
CALIBRATION
S_IN6
TRG_IN1
TACHO
+14V
S_IN5
TRG_OUT1
1
2
7
1
8
S_IN2
6
3
6
7
SSI
5
4
2
5
S_IN3
-14V
3
S_IN7
TRG_IN2
S_IN4
TRG_OUT2
4
+200V
INPUT
Figure 11.12: Assignment of the input socket
for the auxiliary channels for 2- and 4-channel
devices
Figure 11.11: Assignment of input socket for 2and 4-channel devices
Connector assignment for 8-channel devices
INPUT
GND
Figure 11.13: Assignment of input socket for 8-channel devices
TRG_OUT2
TRG_OUT1
1
4
2
3
TRG_IN1
TRG_IN2
Figure 11.14: Assignment of trigger input socket for 8-channel devices
Connector assignment for outputs
Figure 11.15: assignment for Lemo3
(Soundbook)
Manual SAMURAI
Figure 11.16: assignment for 6.3 mm jack plugs(HARMONIE)
128 of 132
SINUS Messtechnik GmbH
11.4
11.4
Specifications according to DIN EN 61672-1:2003
Specifications according to DIN EN 61672-1:2003
DIN EN 61672-1:2003
Description
Manual section
5.1.4
Configuration for normal operation
Table 11.2, 11.3
5.1.10
Description frequency weighting
Section 11.3.4, page 123
5.1.12
Specification level range
Section 11.3.1, page 122
5.1.13
Reference values
Table 11.2, 11.3
5.1.14
Description of the Start/Stop functionality
Section 9.4.3, page 97
5.1.18
Warm-up time
Table 11.2, 11.3
5.2,5.3
Details on level correction, refer to technical documentation of the microphones
5.5.3, -9, -10, -11
5.6, 9.2.5 d)
5.7
5.10, 5.11, 9.2.5 k)
Level linearity
Section 11.3.1, page 122
Inherent noise, measurement of low sound levels
Section 11.3.2, page 122
Time weightings
Table 11.2, 11.3
Overload/Underrange indication
Section 9.4.4, page 98
Measuring range LCpeak
Section 11.3.1, page 122
5.13, 9.2.5 j)
Reset
Table 11.2, 11.3
5.14, 9.2.5 l)
Trigger
Section 4.4, page 45
5.15
Display
Sections 5.4.1, 5.4.2, 5.4.3, 5.4.5, 5.4.4
Settings integration time (measurement period)
Table 11.2, 11.3 und
5.12.1
5.17.1
Section 3.1
5.17.2, 9.2.5 h)
5.18.1, -2, 9.2.7 c)
5.19
5.20, 9.2.3, 9.3 j)
shortest integration time
Table 11.2, 11.3
Mains and high frequency fields
Section 11.3.7, page 125
Crosstalk
Section 11.3.5, page 124
Power supply
Table 11.2, 11.3
6.1.2, 9.3 l)
Acclimatization period
Tables 11.2, 11.3, pages 116, 118
6.5.2, 9.3 m)
Electrostatic discharge
Section 11.3.6, page 124
6.6.1, 6.6.3, 6.6.9, 9.3 o) Mains and high frequency field
Section 11.3.7, page 125
9.2.2 a)
Measurement values and display
9.2.2 c)
Frequency weightings
Section 5.14, page 66
Table 11.2, 11.3
9.2.2 d)
Time weightings
Table 11.2, 11.3
9.2.2 e)
Level ranges
Section 11.3.1, page 122
9.2.2 f)
Switching level ranges
Section 4.1.1 Table 4.1
9.2.2 g)
Display
Sections 5.4.1, 5.4.2, 5.4.3, 5.4.5, 5.4.4
9.2.2 h)
Total range of A-weighted sound levels
Section 11.3.1, page 122
9.2.2 i)
LCpeak measurement range
Section 11.3.1, page 122
9.2.2 j)
Software operation
Sections 1 to 10
9.2.5 a)
Reference direction
Table 11.2, 11.3
9.2.5 b)
Effect of the device / of persons on the sound field
Section 11.3.10, page 126
9.2.5 e)
Start-up period until stable operation conditions
Table 11.2, 11.3
9.2.5 f)
Integration response
Table 11.2, 11.3
9.2.5 g)
Settings integration time
Table 11.2, 11.3 and
Section 3.1
9.2.5 i)
9.2.5 o), 9.3 h)
9.2.7 b)
9.3 a), b) c)
Hold-feature (Pause)
Section 9.4.2, page 97
Inherent noise, measurement of low sound levels
Section 11.3.2, page 122
Operation restrictions through electrostatic discharge
Section 11.3.6, page 124
Reference sound pressure level, reference level range,
Acoustic centre of the microphones
Table 11.2, 11.3
9.3 e)
Level ranges
Section 11.3.1, page 122
9.3 f)
Level linearity
Section 11.3.1, page 122
9.3 g)
refer to technical documentation of the microphones
9.3 i)
Maximum permissible input voltage
SINUS Messtechnik GmbH
129 of 132
Table 11.2, 11.3
Manual SAMURAI
INDEX
Index
A
Accelerometer . . . . . . . . . . . . . . . . . . . . . . . . . . . . . . . . . . . 31
Analysis . . . . . . . . . . . . . . . . . . . . . . . . . . . . . . . . . . . . . . . . . 38
1/3 Octave . . . . . . . . . . . . . . . . . . . . . . . . . . . . . . . . . . 39
FFT . . . . . . . . . . . . . . . . . . . . . . . . . . . . . . . . . . . . . . . . . 41
Octaves . . . . . . . . . . . . . . . . . . . . . . . . . . . . . . . . . . . . . 40
Signal . . . . . . . . . . . . . . . . . . . . . . . . . . . . . . . . . . . . . . . 39
SLM . . . . . . . . . . . . . . . . . . . . . . . . . . . . . . . . . . . . . . . . 42
Analyzer. . . . . . . . . . . . . . . . . . . . . . . . . . . . . . . . . . . . . . . .122
Analyzer trigger input . . . . . . . . . . . . . . . . . . . . . . . . . . . . 46
Application modes . . . . . . . . . . . . . . . . . . . . . . . . . . . . . . . 99
Arbeitsbereiche. . . . . . . . . . . . . . . . . . . . . . . . . . . . . . . . .122
Audio Comment . . . . . . . . . . . . . . . . . . . . . . . . . . . 100, 101
Audio comment . . . . . . . . . . . . . . . . . . . . 11, 73, 100, 107
Autologin Windows . . . . . . . . . . . . . . . . . . . . . . . . . . . . . . 93
AUX channels . . . . . . . . . . . . . . . . . . . . . . . . . . . . . . . . . . . 32
B
Back Erase . . . . . . . . . . . . . . . . . . . . . . . . . . . . . . . . 101, 104
Browser window . . . . . . . . . . . . . . . . . . . . . . . . . . . . . . . . . 11
Setup . . . . . . . . . . . . . . . . . . . . . . . . . . . . . . . . . . . . . . 110
Early Decay Time . . . . . . . . . . . . . . . . . . . . . . . . . . . . . . . . 27
Easy Operator
Create link . . . . . . . . . . . . . . . . . . . . . . . . . . . . . . . . . . 91
Easy Operator Mode . . . . . . . . . . . . . . . . . . . . . . . . . 90–93
Advanced options . . . . . . . . . . . . . . . . . . . . . . . . . . . 92
Operation . . . . . . . . . . . . . . . . . . . . . . . . . . . . . . . . . . . 92
EDT . . . . . . . . . . . . . . . . . . . . . . . . . . . . . . . . . . . . . . . . . . . . . 27
EMC . . . . . . . . . . . . . . . . . . . . . . . . . . . . . . . . . . . . . . . . . . . 124
EU . . . . . . . . . . . . . . . . . . . . . . . . . . . . . . . . . . . . . . . 47, 58, 60
Export . . . . . . . . . . . . . . . . . . . . . . . . . . . . . . . . . . . . . . . 84–89
Excel . . . . . . . . . . . . . . . . . . . . . . . . . . . . . . . . . . . . . . . 85
NWWin . . . . . . . . . . . . . . . . . . . . . . . . . . . . . . . . . . . . . 84
Outline . . . . . . . . . . . . . . . . . . . . . . . . . . . . . . . . . . . . . . 23
Quicktime Movie . . . . . . . . . . . . . . . . . . . . . . . . . . . . 88
si++ . . . . . . . . . . . . . . . . . . . . . . . . . . . . . . . . . . . . . . . . . 89
Text . . . . . . . . . . . . . . . . . . . . . . . . . . . . . . . . . . . . . . . . . 87
UFF . . . . . . . . . . . . . . . . . . . . . . . . . . . . . . . . . . . . . . . . . 89
WAV . . . . . . . . . . . . . . . . . . . . . . . . . . . . . . . . . . . . . . . . 87
Windows Media Movie . . . . . . . . . . . . . . . . . . . . . . 87
C
Calibration . . . . . . . . . . . . . . . . . . . . . . . . . . . . . . . . . . . . . . . 16
Check . . . . . . . . . . . . . . . . . . . . . . . . . . . . . . . . . . . . . . . 17
Color scale
Data Browser . . . . . . . . . . . . . . . . . . . . . . . . . . . . . . . 83
Color theme
Data Browser . . . . . . . . . . . . . . . . . . . . . . . . . . . . . . . 83
Command Line . . . . . . . . . . . . . . . . . . . . . . . . . . . . . . . . . . 11
Command Line Switches . . . . . . . . . . . . . . . . . . . . . . . . 11
Context menu. . . . . . . . . . . . . . . . . . . . . . . . . . . . . . . . . . . .20
In Tablet PC mode . . . . . . . . . . . . . . . . . . . . . . . . . . 20
Contour map . . . . . . . . . . . . . . . . . . . . . . . . . . . . . . . . . . . . 22
Cross Analysis . . . . . . . . . . . . . . . . . . . . . . . . . . . . . . . . . . . 57
Crosstalk . . . . . . . . . . . . . . . . . . . . . . . . . . . . . . . . . . . . . . . 124
Cursor mode
Data Browser . . . . . . . . . . . . . . . . . . . . . . . . . . . . . . . 81
F
Frequency weightings . . . . . . . . . . . . . . . . . . . . . . . . . . 123
D
Data Storage . . . . . . . . . . . . . . . . . . . . . . . . . . . . . . . . . . . . 72
Data storage . . . . . . . . . . . . . . . . . . . . . . . . . . . . . . . . . . . . . 78
Decay curve . . . . . . . . . . . . . . . . . . . . . . . . . . . . . . . . . . . . . 27
Default pens . . . . . . . . . . . . . . . . . . . . . . . . . . . . . . . . . . . . . 53
Drag’n’Drop. . . . . . . . . . . . . . . . . . . . . . . . . . . . . . . . . . . . . .55
Drag’n’Drop in the Graph layout and properties window . . . . . . . . . . . . . . . . . . . . . . . . . . . . . . . . . . . . 55
H
History . . . . . . . . . . . . . . . . . . . . . . . . . . . . . . . . . . . . . . . . . . 22
History Graph. . . . . . . . . . . . . . . . . . . . . . . . . . . . . . . . . . . .62
History graph
Cursor in the . . . . . . . . . . . . . . . . . . . . . . . . . . . . . . . . 62
Values in the . . . . . . . . . . . . . . . . . . . . . . . . . . . . . . . . 62
HVMA . . . . . . . . . . . . . . . . . . . . . . . . . . . . . . . . . . . . . . . . . . . 22
E
E-mail
Manual SAMURAI
G
Graphical display . . . . . . . . . . . . . . . . . . . . . . . . . . . . . . . . 54
Graphs . . . . . . . . . . . . . . . . . . . . . . . . . . . . . . . . . . . . . . . . . . 57
History . . . . . . . . . . . . . . . . . . . . . . . . . . . . . . . . . . . . . . 62
Pure tone . . . . . . . . . . . . . . . . . . . . . . . . . . . . . . . . . . . 69
SLM . . . . . . . . . . . . . . . . . . . . . . . . . . . . . . . . . . . . . . . . 65
Sonogram. . . . . . . . . . . . . . . . . . . . . . . . . . . . . . . . . . .63
Spectrum graph . . . . . . . . . . . . . . . . . . . . . . . . . . . . . 57
Tachometer . . . . . . . . . . . . . . . . . . . . . . . . . . . . . . . . . 70
Time Signal . . . . . . . . . . . . . . . . . . . . . . . . . . . . . . . . . 68
vsXREF . . . . . . . . . . . . . . . . . . . . . . . . . . . . . . . . . . . . . 71
Waterfall . . . . . . . . . . . . . . . . . . . . . . . . . . . . . . . . . . . . 64
Ground loops . . . . . . . . . . . . . . . . . . . . . . . . . . . . . . 123–125
I
Inherent noise . . . . . . . . . . . . . . . . . . . . . . . . . . . . . . . . . . 122
Integration . . . . . . . . . . . . . . . . . . . . . . . . . . . . . . . . . . . . . . . 31
130 of 132
SINUS Messtechnik GmbH
INDEX
Interval values
Data Browser . . . . . . . . . . . . . . . . . . . . . . . . . . . . . . . 81
Recalculate . . . . . . . . . . . . . . . . . . . . . . . . . . . . . . . . . 81
L
Level Monitor . . . . . . . . . . . . . . . . . . . . . . . . . . . . . . . . . . . . 55
Log window . . . . . . . . . . . . . . . . . . . . . . . . . . . . . . . . . . . . . . 11
Longterm measurements . . . . . . . . . . . . . . . . . . . . . . . 104
M
Main Channels . . . . . . . . . . . . . . . . . . . . . . . . . . . . . . . . . . 30
Main menu . . . . . . . . . . . . . . . . . . . . . . . . . . . . . . . . . . . . . . 10
Markers . . . . . . . . . . . . . . . . . . . . . . . . . . . . . . . . . . . . . . . . . 52
Measurement . . . . . . . . . . . . . . . . . . . . . . . . . . . . . . . . . . . . 12
Data . . . . . . . . . . . . . . . . . . . . . . . . . . . . . . . . . . . . . . . . 23
Display . . . . . . . . . . . . . . . . . . . . . . . . . . . . . . . . . . . . . . 21
Measurement Modes
Autostore . . . . . . . . . . . . . . . . . . . . . . . . . . . . . . . . . . . 24
Standard . . . . . . . . . . . . . . . . . . . . . . . . . . . . . . . . . . . . 24
Measurements . . . . . . . . . . . . . . . . . . . . . . . . . . . . . . . 24, 29
Demo . . . . . . . . . . . . . . . . . . . . . . . . . . . . . . . . . . . . . . . 28
Impulse Response . . . . . . . . . . . . . . . . . . . . . . . . . . 28
Reverberation time . . . . . . . . . . . . . . . . . . . . . . . . . . 25
Measuring mode . . . . . . . . . . . . . . . . . . . . . . . . . . . . . . . . . 18
Messages . . . . . . . . . . . . . . . . . . . . . . . . . . . . . . . . . . . . . . 110
Microphone
Effect of accessories . . . . . . . . . . . . . . . . . . . . . . . 126
Extension cable . . . . . . . . . . . . . . . . . . . . . . . . . . . . 123
Longitudinal axis . . . . . . . . . . . . . . . . . . . . . . . . . . . 126
Mechanical vibration . . . . . . . . . . . . . . . . . . . . . . . 126
Reference direction . . . . . . . . . . . . . . . . . . . . . . . . 126
Microphone extension cable . . . . . . . . . . . . . . . . . . . . 123
Microphones
Setup . . . . . . . . . . . . . . . . . . . . . . . . . . . . . . . . . . . . . . 126
Movie . . . . . . . . . . . . . . . . . . . . . . . . . . . . . . . . . . . . . . . . . . . . 88
Multimedia Report . . . . . . . . . . . . . . . . . . . . . . . . . . . . . . . 88
N
Noise Floor Correction . . . . . . . . . . . . . . . . . . . . . . . 15, 65
Numeric keypad . . . . . . . . . . . . . . . . . . . . . . . . . . . . . . . . 100
O
Octaves . . . . . . . . . . . . . . . . . . . . . . . . . . . . . . . . . . . . . . . . . 40
Outpunt event . . . . . . . . . . . . . . . . . . . . . . . . . . . . . . . . . . . 50
P
Panes
Layout . . . . . . . . . . . . . . . . . . . . . . . . . . . . . . . . . . . . . . 54
Power Management . . . . . . . . . . . . . . . . . . . . . . . . . . . . . 90
Battery low . . . . . . . . . . . . . . . . . . . . . . . . . . . . . . . . . . 90
Preferences . . . . . . . . . . . . . . . . . . . . . . . . . . . . . . . . . . . . 112
SINUS Messtechnik GmbH
Audio . . . . . . . . . . . . . . . . . . . . . . . . . . . . . . . . . . . . . . 107
Colors . . . . . . . . . . . . . . . . . . . . . . . . . . . . . . . . . . . . . 108
General . . . . . . . . . . . . . . . . . . . . . . . . . . . . . . . . . . . . 102
Graphical display . . . . . . . . . . . . . . . . . . . . . . . . . . 106
Measurement . . . . . . . . . . . . . . . . . . . . . . . . . . . . . . 104
Miscellaneous . . . . . . . . . . . . . . . . . . . . . . . . . . . . . 109
SINUS driver. . . . . . . . . . . . . . . . . . . . . . . . . . . . . . .112
User Interface. . . . . . . . . . . . . . . . . . . . . . . . . . . . . .103
Preferences( . . . . . . . . . . . . . . . . . . . . . . . . . . . . . . . . . . . 102
Pure tone graph. . . . . . . . . . . . . . . . . . . . . . . . . . . . . .22, 69
R
Range modes . . . . . . . . . . . . . . . . . . . . . . . . . . . . . . . . . . . 99
Reference Spectrum . . . . . . . . . . . . . . . . . . . . . . . . . . . . . 93
Reference spectrum . . . . . . . . . . 45, 49, 60, 61, 93–96
Creating . . . . . . . . . . . . . . . . . . . . . . . . . . . . . . . . . . . . 93
Editing . . . . . . . . . . . . . . . . . . . . . . . . . . . . . . . . . . . . . . 94
Replay . . . . . . . . . . . . . . . . . . . . . . . . . . . . . . . . . . . . . . . . . . . 23
Reverberation time. . . . . . . . . . . . . . . . . . . . . . . . . . . . . . .25
Integrated impulse response . . . . . . . . . . . . . . . . 25
Interrupted noise . . . . . . . . . . . . . . . . . . . . . . . . . . . . 25
RT15 . . . . . . . . . . . . . . . . . . . . . . . . . . . . . . . . . . . . . . . . . . . . 27
RT20 . . . . . . . . . . . . . . . . . . . . . . . . . . . . . . . . . . . . . . . . . . . . 27
RT30 . . . . . . . . . . . . . . . . . . . . . . . . . . . . . . . . . . . . . . . . . . . . 27
S
Search and replay . . . . . . . . . . . . . . . . . . . . . . . . . . . . . . . 23
Serial number . . . . . . . . . . . . . . . . . . . . . . . . . . . . . . . . . . . 11
Setup . . . . . . . . . . . . . . . . . . . . . . . . . . . . . . . . . . . . . . . . 30–53
Analysis. . . . . . . . . . . . . . . . . . . . . . . . . . . . . . . . . . . . .38
AUX channels . . . . . . . . . . . . . . . . . . . . . . . . . . . . . . . 32
Default pens . . . . . . . . . . . . . . . . . . . . . . . . . . . . . . . . 53
Main Channels . . . . . . . . . . . . . . . . . . . . . . . . . . . . . . 30
Markers . . . . . . . . . . . . . . . . . . . . . . . . . . . . . . . . . . . . . 52
Output event . . . . . . . . . . . . . . . . . . . . . . . . . . . . . . . . 50
Preparation . . . . . . . . . . . . . . . . . . . . . . . . . . . . . . . . . 20
Signal Generator . . . . . . . . . . . . . . . . . . . . . . . . . . . . 36
Tachometer . . . . . . . . . . . . . . . . . . . . . . . . . . . . . . . . . 34
Setup window. . . . . . . . . . . . . . . . . . . . . . . . . . . . . . . . . . . .11
Signal Generator . . . . . . . . . . . . . . . . . . . . . . . . . . . . . . . . 38
Signal Preview . . . . . . . . . . . . . . . . . . . . . . . . . . . . . . 38
SignalGenerator . . . . . . . . . . . . . . . . . . . . . . . . . . . . . . . . . 36
Sleep mode . . . . . . . . . . . . . . . . . . . . . . . . . . . . . . . . . . . . . 90
SLM . . . . . . . . . . . . . . . . . . . . . . . . . . . . . . . . . . . . . . . . . . . . . 22
SLM graph. . . . . . . . . . . . . . . . . . . . . . . . . . . . . . . . . . . . . . .65
SMS
Setup . . . . . . . . . . . . . . . . . . . . . . . . . . . . . . . . . . . . . . 110
Software installation. . . . . . . . . . . . . . . . . . . . . . . . . . . . . . .8
Sonogram . . . . . . . . . . . . . . . . . . . . . . . . . . . . . . . . . . . . . . . 22
Sonogram graph . . . . . . . . . . . . . . . . . . . . . . . . . . . . . . . . . 63
Sound level . . . . . . . . . . . . . . . . . . . . . . . . . . . . . . . . . . . . . . 65
131 of 132
Manual SAMURAI
INDEX
Spectrum . . . . . . . . . . . . . . . . . . . . . . . . . . . . . . . . . . . . . . . . 22
Spectrum graph . . . . . . . . . . . . . . . . . . . . . . . . . . . . . . . . . 57
Status bar . . . . . . . . . . . . . . . . . . . . . . . . . . . . . . . . . . . 11, 98
Status window . . . . . . . . . . . . . . . . . . . . . . . . . . . . . . . . . . . 11
Store condition . . . . . . . . . . . . . . . . . . . . . . . . . . . . . . . 21, 43
T
Tachometer . . . . . . . . . . . . . . . . . . . . . . . . . . . . . . . . . . 22, 34
Tachometer graph . . . . . . . . . . . . . . . . . . . . . . . . . . . . . . . 70
Time signal . . . . . . . . . . . . . . . . . . . . . . . . . . . . . . . . . . . . . . 22
Time signal graph . . . . . . . . . . . . . . . . . . . . . . . . . . . . . . . . 68
Toolbars . . . . . . . . . . . . . . . . . . . . . . . . . . . . . . . . . . . . . 11, 96
Control . . . . . . . . . . . . . . . . . . . . . . . . . . . . . . . . . . . . . . 98
Main . . . . . . . . . . . . . . . . . . . . . . . . . . . . . . . . . . . . . . . . 96
Run . . . . . . . . . . . . . . . . . . . . . . . . . . . . . . . . . . . . . . . . . 97
Toolsbars
Replay . . . . . . . . . . . . . . . . . . . . . . . . . . . . . . . . . . . . . . 97
Transducer
Selection . . . . . . . . . . . . . . . . . . . . . . . . . . . . . . . . . . . . 31
Transducer Database
Additional units . . . . . . . . . . . . . . . . . . . . . . . . . . . . . . 16
Transducer database . . . . . . . . . . . . . . . . . . . . . . . . . . . . 13
Transducers
Manual SAMURAI
Calibrate . . . . . . . . . . . . . . . . . . . . . . . . . . . . . . . . . . . . 31
Trigger . . . . . . . . . . . . . . . . . . . . . . . . . . . . . . . . . . . . . . . . . . . 45
Analyzer trigger . . . . . . . . . . . . . . . . . . . . . . . . . . . . . 46
COM port trigger . . . . . . . . . . . . . . . . . . . . . . . . . . . . 45
Compound trigger . . . . . . . . . . . . . . . . . . . . . . . . . . . 48
Coumpound trigger. . . . . . . . . . . . . . . . . . . . . . . . . .48
Dynamic level trigger . . . . . . . . . . . . . . . . . . . . . . . . 47
Fixed level trigger . . . . . . . . . . . . . . . . . . . . . . . . . . . 46
Keyboard trigger . . . . . . . . . . . . . . . . . . . . . . . . . . . . 47
Reference spectrum trigger . . . . . . . . . . . . . . . . . 49
Time trigger . . . . . . . . . . . . . . . . . . . . . . . . . . . . . . . . . 47
V
vsXREF . . . . . . . . . . . . . . . . . . . . . . . . . . . . . . . . . . . . . . . . . 22
vsXREF graph . . . . . . . . . . . . . . . . . . . . . . . . . . . . . . . . . . . 71
W
Waterfall . . . . . . . . . . . . . . . . . . . . . . . . . . . . . . . . . . . . . . . . . 22
Waterfall graph . . . . . . . . . . . . . . . . . . . . . . . . . . . . . . . . . . 64
Working folder . . . . . . . . . . . . . . . . . . . . . . . . 23, 72, 75, 99
Advanced settings. . . . . . . . . . . . . . . . . . . . . . . . . . .74
Search . . . . . . . . . . . . . . . . . . . . . . . . . . . . . . . . . . . . . . 74
Select . . . . . . . . . . . . . . . . . . . . . . . . . . . . . . . . . . . . . . . 73
132 of 132
SINUS Messtechnik GmbH