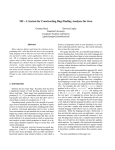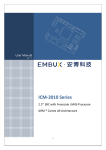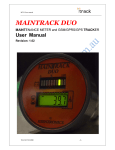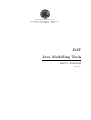
1
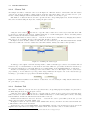
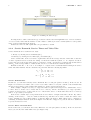
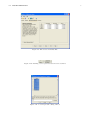
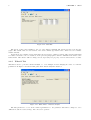
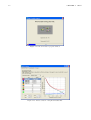
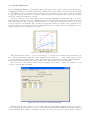
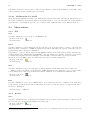
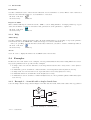
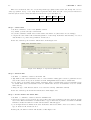
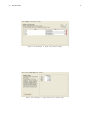
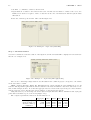
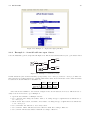
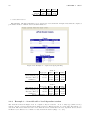
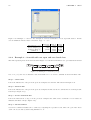
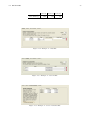
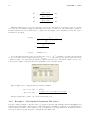
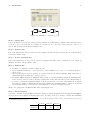
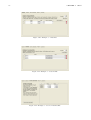
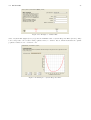
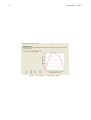
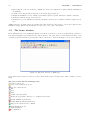
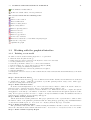
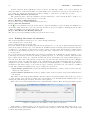
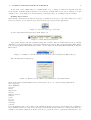
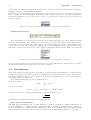
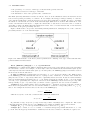
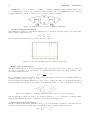
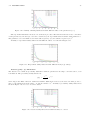
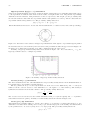
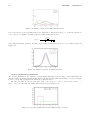
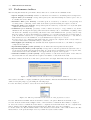
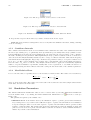
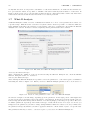
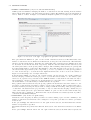
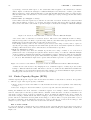
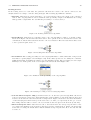
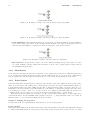
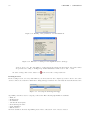
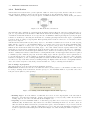
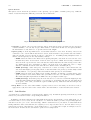
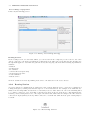
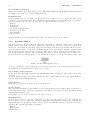
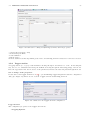
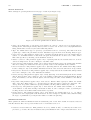
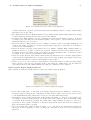
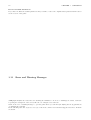
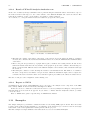
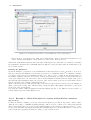
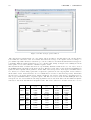
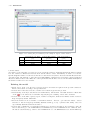
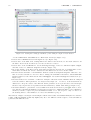
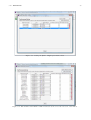
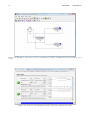
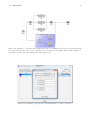
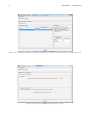
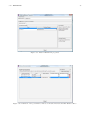
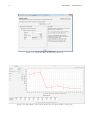
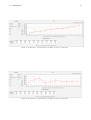
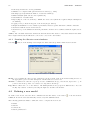
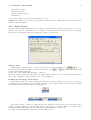
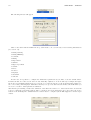
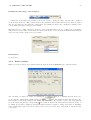
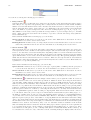
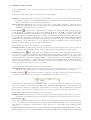
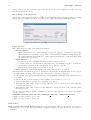
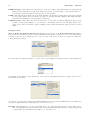
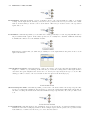
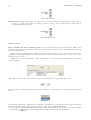
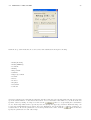
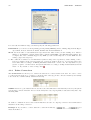
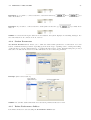
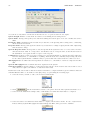
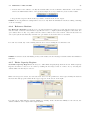
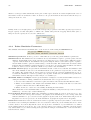
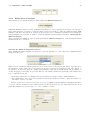
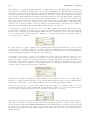
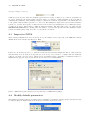
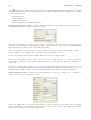
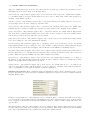
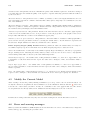
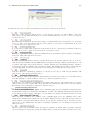
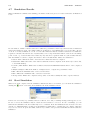
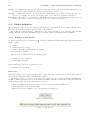
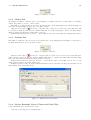
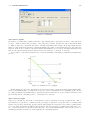
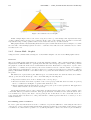
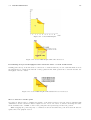
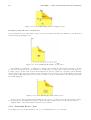
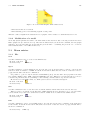
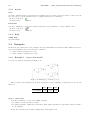
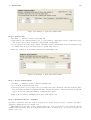
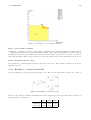
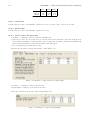
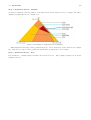
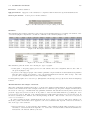
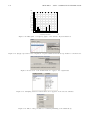
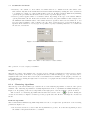
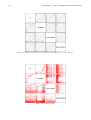
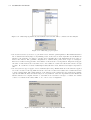
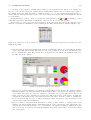
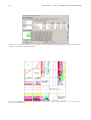
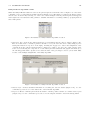
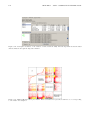
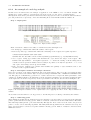
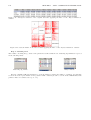
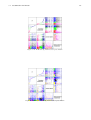
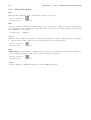
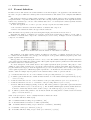
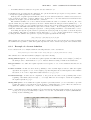
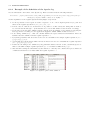
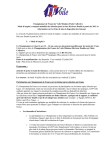
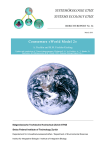
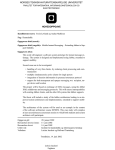
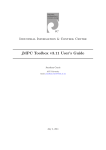
134
CHAPTER 6. JWAT - WORKLOAD ANALYZER TOOL
3
x10
2.2
2.0
F
r
e
q
u
e
n
c
i
e
s
1.8
1.6
1.4
1.2
1.0
0.8
0.6
0.4
0.2
0.0
0.0
0.5
1.0
1.5
2.0
2.5
3.0
Variable Bytes transferred
3.5
4.0
4
x10
Figure 6.22: Histogram, or frequency graph, of the variable ”Bytes transferred”
Figure 6.23: QQ-plot preview for the comparison of a given distribution with an exponential or a normal ones.
Figure 6.24: Selection of the transformation to apply to the original data
Figure 6.25: Sampling extraction criteria that can be applied on the selected variables
Figure 6.26: Filter of the percentiles of a variable (trimming of the distribution)