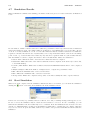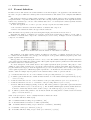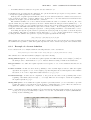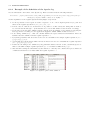
1
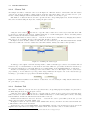
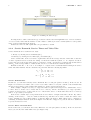
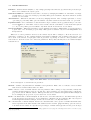
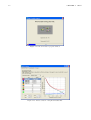
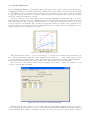
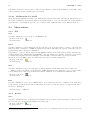
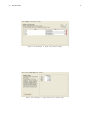
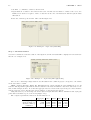
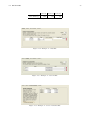
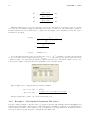
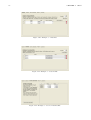
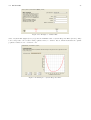
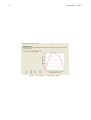
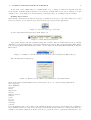
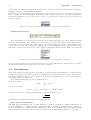
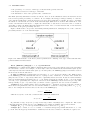
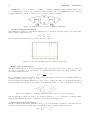
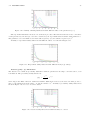
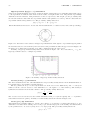
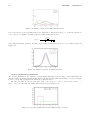
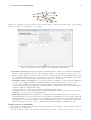
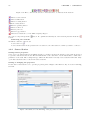
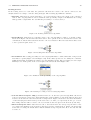
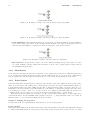
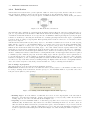
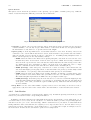
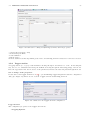
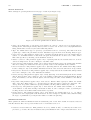
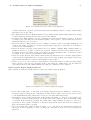
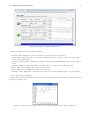
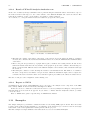
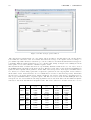
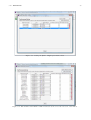
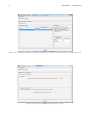
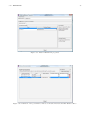
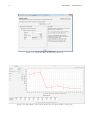
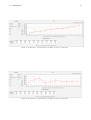
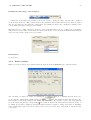
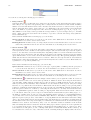
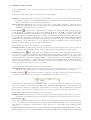
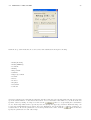
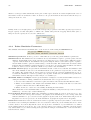
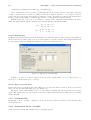
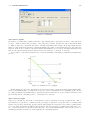
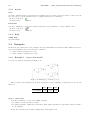
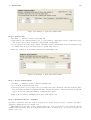
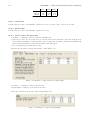
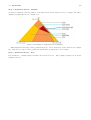
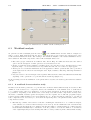
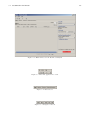
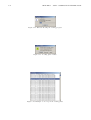
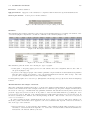
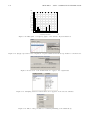
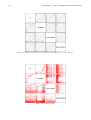
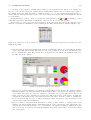
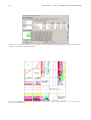
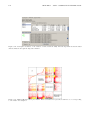
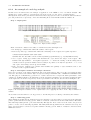
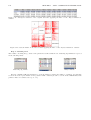
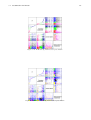
3.12. RESULTS OF SIMULATION
65
Figure 3.68: Results of a single simulation run.
Values are available for the following parameters:
• Station Name: This is the name of the station for which the index is computed
• Class Name: This is the name of the class for which the index is computed at the station (it could be
”All”, to mean All Classes)
• Conf.In / Max Rel.Err.: This is the Confidence Interval and Maximum Relative Error of the computed
index
• Analyzed Samples: This is the number of samples used to compute the performance index
• Min.: This is the minimum value observed for the index
• Max.: This is the maximum value observed for the index
• Average Value: This is the computed average value of the index, usually the value of greater interest.
Click on the graph to magnify it.
Each graph plotted represents the values of the corresponding index (blue line) with the Confidence Interval
(red lines), see Figure 3.69.
Figure 3.69: Plots representing the value of a performance index and its Confidence Interval.