1
Amazon Elastic Compute Cloud User Guide for Linux
Graphing Metrics
Graphing Metrics
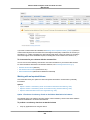
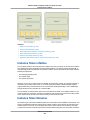
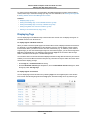
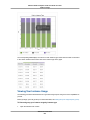
After you launch an instance, you can go to the Amazon EC2 console and view the instance's monitoring
graphs. They're displayed when you select the instance on the Instances page in the EC2 Dashboard.
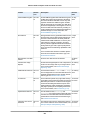
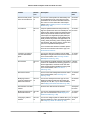
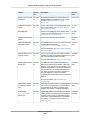
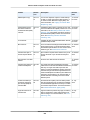
A Monitoring tab is displayed next to the instance's Description tab. The following graphs are available:
• Average CPU Utilization (Percent)
• Average Disk Reads (Bytes)
• Average Disk Writes (Bytes)
• Maximum Network In (Bytes)
• Maximum Network Out (Bytes)
• Summary Disk Read Operations (Count)
• Summary Disk Write Operations (Count)
• Summary Status (Any)
• Summary Status Instance (Count)
• Summary Status System (Count)
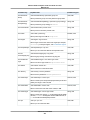
Each graph is based on one of the available Amazon EC2 metrics. For more information about the metrics
and the data they provide to the graphs, see View Amazon EC2 Metrics (p. 320).
You can also use the CloudWatch console to graph metric data generated by Amazon EC2 and other
AWS services to make it easier to see what's going on. You can use the following procedures to graph
metrics in CloudWatch.
Contents
• Graph a Metric (p. 343)
• Graph a Metric Across Resources (p. 344)
Graph a Metric
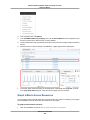
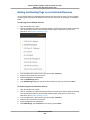
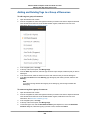
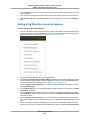
You can select a metric and create a graph of the data in CloudWatch. For example, you can select the
CPUUtilization metric for an Amazon EC2 instance and display a graph of CPU usage over time for that
instance.
To graph a metric
1.
2.
Open the CloudWatch console at https://console.amazonaws.cn/cloudwatch/.
If necessary, change the region. From the navigation bar, select the region that meets your needs.
For more information, see Regions and Endpoints in the Amazon Web Services General Reference.
API Version 2015-04-15
343