1
page 583.
•
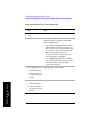
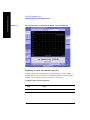
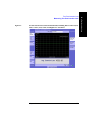
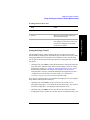
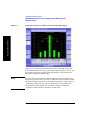
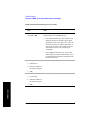
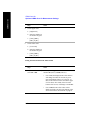
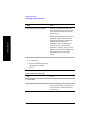
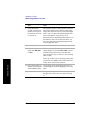
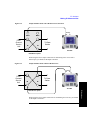
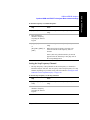
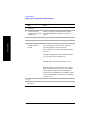
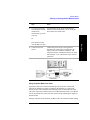
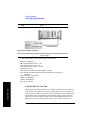
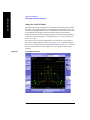
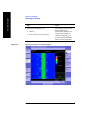
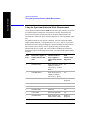
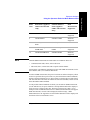
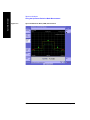
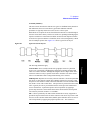
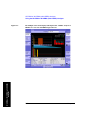
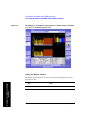
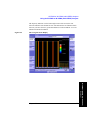
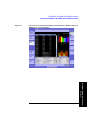
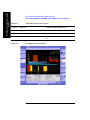
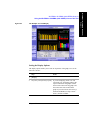
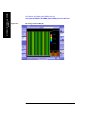
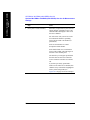
Zoom view: The left graph (Codogram view) provides a display of data
captured over time. The OVSF codes are shown on the X-axis and correspond to
the light blue highlight on the Code Domain Trace view. The OVSF codes
selected for your Zoom View are determined by the Position setting, which sets
the lowest (or left) OVSF code, and by the Width setting, which sets the number
of OVSF codes displayed. For example, with Position set to 400, and Width set
to 32, your Zoom View will show codes 400 to 431, that is, from Position 400
for a Width of 32 codes.
You can change the time interval to allow longer spectrum history. The color
corresponds to the OVSF channel strength.
•
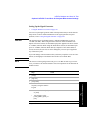
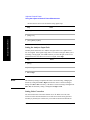
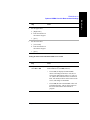
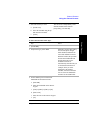
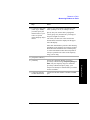
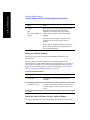
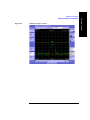
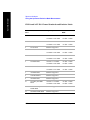
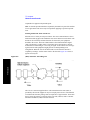
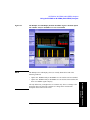
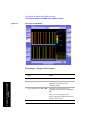
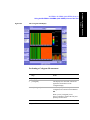
Full view: The top-left graph (Codogram view) shows the power in the first half
of the OVSF channels (SF512 channels 0 - 255). The lower-left graph shows the
power in the other half of the channels (SF512 channels 256-511). Both graphs
provide a display of data captured over time.
You can change the time interval to allow longer spectrum history. The color
corresponds to the OVSF channel strength.
•
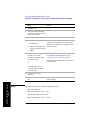
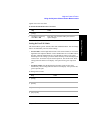
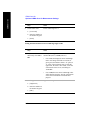
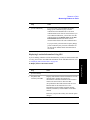
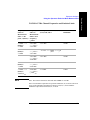
Zoom and Full views: The top-right graph (Color Legend) provides a color vs.
power legend to help you interpret the power level in the Codogram.
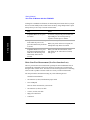
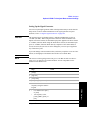
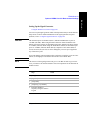
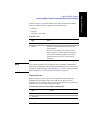
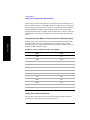
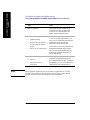
The Update Interval is the interval, measured in whole seconds, between successive
records displayed on the codogram. In other words, if you set the update interval to
5 seconds, the codogram display will not update until the after the first complete
measurement following a gap of five seconds. Alternatively, you can set the update
interval to provide the maximum data collection speed by pressing [Max Speed], or
by setting the update interval to 0 (zero) seconds.
NOTE
It is not always possible for the analyzer to match the update interval you specify. It
is possible, for example, to set your update interval to zero seconds (the maximum
speed), and then to find that the analyzer can not update any faster than once every
two seconds.
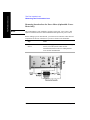
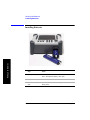
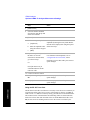
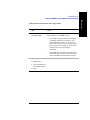
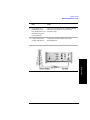
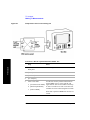
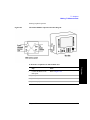
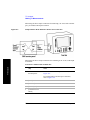
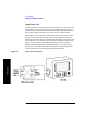
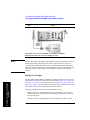
The frequency indicator is at the bottom right corner of the screen, the time
reference indicator at the bottom left. For each indicator the text indicates which
reference you have chosen. A green LED indicates a locked condition. A red “X”
indicates an unlocked condition.
Chapter 20
589
W-CDMA or W-CDMA (with HSDPA)
Over Air
W-CDMA or W-CDMA (with HSDPA) Over Air
Using the W-CDMA or W-CDMA (with HSDPA) Over the Air Tool