1
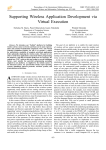
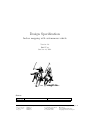
Design Specification Indoor mapping with autonomous vehicle Version 1.0 Emil Torp October 29, 2012 Status Reviewed Approved Course name: Project group: Course code: Project: - - Control Project Laboratory MARCO TSRT10 MARCO E-mail: Document responsible: Author’s E-mail: Document name: [email protected] Emil Torp [email protected] DesignSpecificationV10.pdf Project Identity Group E-mail: Homepage: [email protected] http://is.gd/tsrt10kartering Orderer: André Carvalho Bittencourt, Linköping University E-mail: [email protected] Customer: Joakim Rydell, Sensorinformatik, FOI E-mail: [email protected] Course Responsible: Daniel Axehill, Linköping University E-mail: [email protected] Advisor: Michael Roth, Linköping University E-mail: [email protected] Group Members Name Responsibility Phone LiU-ID Martin Åbom Emil Torp Martin Larsson Johan Dahlin Patrik Önnegren Joel Wastesson Claes Hallström Project Manager Documents, Design Mapping Localization Path following Trajectory planning Tests 0733444011 0709905868 0707771169 0733145270 0704150288 0739198673 0700904370 marab256 emito172 marla289 johda609 paton487 joewa179 claha288 Document History Version 0.1 0.2 0.3 1.0 Date 2012-10-01 2012-10-04 2012-10-09 2012-10-11 Course name: Project group: Course code: Project: Changes made First draft. Second draft Third draft First version Control Project Laboratory MARCO TSRT10 MARCO Sign All All All All E-mail: Document responsible: Author’s E-mail: Document name: Reviewer All All All ET [email protected] Emil Torp [email protected] DesignSpecificationV10.pdf Contents 1 Introduction 1 2 System Overview 1 2.1 Subsystems . . . . . . . . . . . . . . . . . . . . . . . . . . . . . . . . . . . . . . . . . . . . 3 Sensors 3.1 3.2 3.3 2 XSens MTi-G IMU . . . . . . . . . . . . . . . . . . . . . . . . . . . . . . . . . . . . . . . . 2 3.1.1 Mounting of the IMU . . . . . . . . . . . . . . . . . . . . . . . . . . . . . . . . . . 2 3.1.2 Technical Specifications . . . . . . . . . . . . . . . . . . . . . . . . . . . . . . . . . 3 3.1.3 Communication . . . . . . . . . . . . . . . . . . . . . . . . . . . . . . . . . . . . . . 3 3.1.4 Code . . . . . . . . . . . . . . . . . . . . . . . . . . . . . . . . . . . . . . . . . . . . 3 SICK LMS-511-20100 . . . . . . . . . . . . . . . . . . . . . . . . . . . . . . . . . . . . . . 3 3.2.1 Technical Specifications . . . . . . . . . . . . . . . . . . . . . . . . . . . . . . . . . 3 3.2.2 Communication . . . . . . . . . . . . . . . . . . . . . . . . . . . . . . . . . . . . . . 4 3.2.3 Code . . . . . . . . . . . . . . . . . . . . . . . . . . . . . . . . . . . . . . . . . . . . 4 Odometers . . . . . . . . . . . . . . . . . . . . . . . . . . . . . . . . . . . . . . . . . . . . . 4 3.3.1 4 Technical Specifications . . . . . . . . . . . . . . . . . . . . . . . . . . . . . . . . . 4 Simultaneous Localization and Mapping 4.1 4.2 4.3 2 5 Sensor Models . . . . . . . . . . . . . . . . . . . . . . . . . . . . . . . . . . . . . . . . . . . 6 4.1.1 SICK LMS-511-20100 . . . . . . . . . . . . . . . . . . . . . . . . . . . . . . . . . . 6 4.1.2 Odometers . . . . . . . . . . . . . . . . . . . . . . . . . . . . . . . . . . . . . . . . 7 Extended Kalman Filter . . . . . . . . . . . . . . . . . . . . . . . . . . . . . . . . . . . . . 7 4.2.1 Motion Model . . . . . . . . . . . . . . . . . . . . . . . . . . . . . . . . . . . . . . . 8 4.2.2 Measurements 8 . . . . . . . . . . . . . . . . . . . . . . . . . . . . . . . . . . . . . . Scan Matching . . . . . . . . . . . . . . . . . . . . . . . . . . . . . . . . . . . . . . . . . . 9 4.3.1 Strong Links . . . . . . . . . . . . . . . . . . . . . . . . . . . . . . . . . . . . . . . 11 4.3.2 Closest Pair of Points . . . . . . . . . . . . . . . . . . . . . . . . . . . . . . . . . . 11 4.3.3 Pose Estimation . . . . . . . . . . . . . . . . . . . . . . . . . . . . . . . . . . . . . 11 4.4 Generation of Mapping Data . . . . . . . . . . . . . . . . . . . . . . . . . . . . . . . . . . 11 4.5 Building Local Map 4.6 . . . . . . . . . . . . . . . . . . . . . . . . . . . . . . . . . . . . . . . 12 4.5.1 Building Local Map - An Example . . . . . . . . . . . . . . . . . . . . . . . . . . . 12 4.5.2 Starting Procedure . . . . . . . . . . . . . . . . . . . . . . . . . . . . . . . . . . . . 13 Building Global Map . . . . . . . . . . . . . . . . . . . . . . . . . . . . . . . . . . . . . . . 13 4.6.1 13 An Example . . . . . . . . . . . . . . . . . . . . . . . . . . . . . . . . . . . . . . . 5 Trajectory Planning 5.1 14 Acquire Target . . . . . . . . . . . . . . . . . . . . . . . . . . . . . . . . . . . . . . . . . . 14 5.1.1 An Example 14 5.1.2 Target Sub-matrix Size 5.1.3 . . . . . . . . . . . . . . . . . . . . . . . . . . . . . . . . . . . . . . . . . . . . . . . . . . . . . . . . . . . . . . . . . . . . . . . . 15 Alternative Fast Target Search . . . . . . . . . . . . . . . . . . . . . . . . . . . . . 15 5.2 Generate Cost Matrices . . . . . . . . . . . . . . . . . . . . . . . . . . . . . . . . . . . . . 16 5.3 Generate Trajectories 5.2.1 An Example . . . . . . . . . . . . . . . . . . . . . . . . . . . . . . . . . . . . . . . 17 . . . . . . . . . . . . . . . . . . . . . . . . . . . . . . . . . . . . . . 17 5.3.1 An Example . . . . . . . . . . . . . . . . . . . . . . . . . . . . . . . . . . . . . . . 17 5.3.2 Reduction of Calculation Intensiveness . . . . . . . . . . . . . . . . . . . . . . . . . 18 5.4 5.3.3 Cost Sub-matrix Size . . . . . . . . . . . . . . . . . . . . . . . . . . . . . . . . . . . 18 5.3.4 Alternative Cost Calculation . . . . . . . . . . . . . . . . . . . . . . . . . . . . . . 19 Choose Best Target . . . . . . . . . . . . . . . . . . . . . . . . . . . . . . . . . . . . . . . . 19 5.4.1 An Example 19 5.4.2 Alternative Decision Equation . . . . . . . . . . . . . . . . . . . . . . . . . . . . . . . . . . . . . . . . . . . . . . . . . . . . . . . . . . . . . . . . . . . . 20 5.5 Algorithm . . . . . . . . . . . . . . . . . . . . . . . . . . . . . . . . . . . . . . . . . . . . . 21 5.6 Trajectory Update . . . . . . . . . . . . . . . . . . . . . . . . . . . . . . . . . . . . . . . . 22 5.7 Mapping Termination . . . . . . . . . . . . . . . . . . . . . . . . . . . . . . . . . . . . . . 22 6 Path Following 6.1 6.2 22 PID Controller . . . . . . . . . . . . . . . . . . . . . . . . . . . . . . . . . . . . . . . . . . 22 6.1.1 Feed-forward . . . . . . . . . . . . . . . . . . . . . . . . . . . . . . . . . . . . . . . 23 6.1.2 Potential Problems with PID . . . . . . . . . . . . . . . . . . . . . . . . . . . . . . 23 MPC Controller . . . . . . . . . . . . . . . . . . . . . . . . . . . . . . . . . . . . . . . . . . 23 7 Collision System 25 8 Code and Document Conventions 26 8.1 Code Conventions . . . . . . . . . . . . . . . . . . . . . . . . . . . . . . . . . . . . . . . . 26 8.2 Document Conventions . . . . . . . . . . . . . . . . . . . . . . . . . . . . . . . . . . . . . . 26 Course name: Project group: Course code: Project: Control Project Laboratory MARCO TSRT10 MARCO E-mail: Document responsible: Author’s E-mail: Document name: [email protected] Emil Torp [email protected] DesignSpecificationV10.pdf MARCO 1 1 Introduction This document gives an overview of how the autonomous mapping robot is going to be designed. It specifies what hardware will be used and the basic structure of the software. The robot will navigate in an indoor environment with the aid of several sensors. When the mapping is done there should be a map of the environment available on a computer. 2 System Overview The robot platform will be from Segway. Information of the environment around the robot will be gathered with the aid of a SICK laser range sensor mounted on the robot. Additional information about the movement will be provided from an IMU-device. The robot is equipped with odometers which can be used to estimate the traveled distance. The on-board mounted computer will calculate a trajectory based on the information and guide the robot through the environment to collect the necessary data to produce a map of the area. The robot will autonomously estimate its orientation and position while navigating through the environment and simultaneously mapping its surroundings. When this is finished the user will have a complete map of the environment available on the computer. The order of the operations is shown in Figure 1. Figure 1: Software overview. The user starts the process via a GUI on the computer. The system then runs its initiate function and starts the main loop. The collected sensor data will be available for all operations in the main loop. All different operations in the main loop are explained in the following parts of this document, see sections: 4 , 5 , 6 and 7. When the system indicates that all information needed to create a map over the enclosed area have been gathered, the on-board computer will display a map and the robot will terminate the process. Course name: Project group: Course code: Project: Control Project Laboratory MARCO TSRT10 MARCO E-mail: Document responsible: Author’s E-mail: Document name: [email protected] Emil Torp [email protected] DesignSpecificationV10.pdf MARCO 2.1 2 Subsystems The system has two subsystems, the robot and the laptop. The laptop will communicate with the sensor mounted on the robot through Ethernet and RS-232 and contain all the developed software. The software will be developed in MATLAB. The software will contain a GUI in which the user can start the robot, set parameters and in the end see a complete map. Some useful data about the robot. • Track width: 53 cm • Tire diameter: 48 cm 3 Sensors The systems data collection depends on different sensors which will be discussed in this section. 3.1 XSens MTi-G IMU The IMU provides 3D accelerometer, gyroscopic data and an estimation of the orientation. The accelerometers in x- and y-direction will be used together with the estimation of the orientation in the horizontal plane (xy-plane) to estimate the position (2D) and orientation of the robot. The angular velocity in z-direction will be used in the controller. 3.1.1 Mounting of the IMU When the robot turns centripetal acceleration will be generated, which will effect the IMU. To minimize these transient accelerations the IMU will be placed in the center of the robot. Furthermore, the IMU will be mounted in a way in which the IMU’s and robot’s coordinate systems will overlap. The IMU’s default coordinate system is shown in Figure 2 below. Figure 2: IMU’s default coordinate system Course name: Project group: Course code: Project: Control Project Laboratory MARCO TSRT10 MARCO E-mail: Document responsible: Author’s E-mail: Document name: [email protected] Emil Torp [email protected] DesignSpecificationV10.pdf MARCO 3 Before the robot starts to explore the environment the accelerometers need to be calibrated. This is done by storing the accelerometer values when the robot stands still and then subtracting this from the new measurements. This has to be done because the earth’s gravitational force acts on the accelerometers. The accelerometers should have the value zero when the robot stands still. 3.1.2 Technical Specifications The default sampling frequency is 100Hz which will be used to sample data. The maximum sample rate is 512Hz. 3.1.3 Communication There is one data interface available for the IMU. It uses serial communication over RS232. A message sent to or received from the IMU over the interface will have the following structure. PRE 1 byte BID 1 byte MID 1 byte LEN 1 byte DATA 0-254 bytes CS 1 byte Preamble (PRE): This byte always has the value 0xFA. Bus identifier (BID) or Address: This byte always has the value 0xFA. Message identifier (MID): This byte identifies what type of message is being sent. Length (LEN): This byte specifies how many bytes the data field will contain. Data (DATA): The next LEN bytes contains the data. Checksum (CS): The last byte is used for communication error-detection. To tell the IMU to send acceleration and gyroscope data the following two messages will be sent to the IMU. 0xFA 0xFF 0xD2 0x04 0x00 0x00 0x0C 0x40 0x0B 0xFA 0xFF 0xD0 0x02 0x00 0x01 0x0E For more information about the message fields and what values they can have, see [2]. 3.1.4 Code The code will be written in Matlab and use the Instrument Control Toolbox to communicate over a serial port. 3.2 SICK LMS-511-20100 The SICK is a one-dimensional laser ranging sensor that provides a range profile along an arc. This data will be used in the security system, the estimation of the robots position (2D) and the mapping. 3.2.1 Technical Specifications Relevant specifications about the LMS that will be used. [3] Course name: Project group: Course code: Project: Control Project Laboratory MARCO TSRT10 MARCO E-mail: Document responsible: Author’s E-mail: Document name: [email protected] Emil Torp [email protected] DesignSpecificationV10.pdf MARCO 4 • field of view: 190◦ • resolution of the angular step width: 0.167/0.25/0.33/0.5/0.66/1◦ • rotation frequency: 25/35/50/75/100 Hz • scanning range: 0.7m to 65m 3.2.2 Communication There are two data interfaces available for the LMS. An Ethernet interface (TCP/IP) and a serial host interface (RS-232/RS-422). Both interfaces are able to change the parameters for the LMS, for example the angular resolution. It’s only possible to use the Ethernet interface to output measured values in real-time since the data transmission rate of the serial host interface is limited. Thus the Ethernet interface will be implemented. Both interfaces use the same messages for communication. A message sent to or received from the LMS over the interfaces will have the following structure. STX 1 byte TYPE 3 bytes CMD 3-14 bytes DATA ≥ 0 bytes ETX 1 byte Start of text (STX): The ASCII sign for start of text, i.e. 0x02. Type (TYPE): These bytes specify what type of command is being sent. Command (CMD): These bytes specify the command that is being sent. Data (DATA): These bytes contain the data being sent. Start of text (ETX): The ASCII sign for end of text, i.e. 0x03. To tell the LMS to start measuring the following message (hex string) will be sent to the LMS. 02 73 4D 4E 20 4C 4D 43 73 74 61 72 74 6D 65 61 73 03 For more information about the message fields and what values they can have, see [3]. 3.2.3 Code The code will be written in Matlab and use the Instrument Control Toolbox to communicate over Ethernet. 3.3 Odometers The robot is equipped with two odometers, one on each wheel. From these it is possible to estimate the total traveled distance from the start. These will be used in order to know when to perform a scan match. 3.3.1 Technical Specifications The robot’s wheels have a diameter of 48cm which translates to a circumference of c = 48π. The odometer has an accuracy of approximately 1 degree which corresponds to an error in distance of ± 48π 360 ≈ ±0.42cm. The slip that will occur will make the measurements less Course name: Project group: Course code: Project: Control Project Laboratory MARCO TSRT10 MARCO E-mail: Document responsible: Author’s E-mail: Document name: [email protected] Emil Torp [email protected] DesignSpecificationV10.pdf MARCO 5 and less accurate the further the robot travels. 4 Simultaneous Localization and Mapping To estimate the position and orientation of the robot and mapping the environment SLAM will be used. The estimation of position and heading will be done by combining filtering and scan matching. The reason to use scan match is to integrate the range laser in the pose estimation. The filtering will be used to estimate the position and heading until the robot has driven a specific distance. At this point a scan match will be done in order to improve the estimations and the EKF will be restarted. By iterating this the drift in the states will be smaller compared to the estimate achieved without the laser measurements. At the beginning of the algorithm the data from the IMU, odometer and LMS are collected. The robot’s pose is then estimated using the EKF. The next step will be to check whether to do a scan match or not. The range data is then translated to fit the global coordinate system. This depends on how far the robot has traveled and how much it has rotated since the last scan match was performed and whether or not a strong link is detected, see 4.3.1. If a scan match should not be done the procedure starts over. Otherwise a scan match is done and the position is corrected. It is here assumed that the scan match will estimate the pose good enough to just replace the EKF’s estimated pose. A work flow describing this is shown in Figure 3 below. Figure 3: Work flow of the pose estimation As the robot moves around in the environment the global coordinate system (x, y) and the robot’s coordinate system will not be the same. Figure 4 below shows how the global coordinate system and the robot’s coordinate system (xr , y r ) correlates. Course name: Project group: Course code: Project: Control Project Laboratory MARCO TSRT10 MARCO E-mail: Document responsible: Author’s E-mail: Document name: [email protected] Emil Torp [email protected] DesignSpecificationV10.pdf MARCO 6 Figure 4: Global coordinates and robot’s coordinates The robot’s position and orientation will be represented by the state X = (x, y, θ). The global coordinate system is chosen in such a way in which the robot will have the initial state values (x, y, θ) = (0, 0, 0), as shown by position 1 in Figure 4. The robot’s coordinate system is fixed to the robot, which means that as the robot moves around its coordinate system will also move around, as shown in position 2 in Figure 4. 4.1 Sensor Models The different sensor models are described in this subsection. 4.1.1 SICK LMS-511-20100 The LMS provides range measurements, ri , between the robot and obstacles, where i denotes the ith measurement. This can be described by equation 1. ri = r0i + eir (1) where r0i are the true ranges between the robot and the obstacle and eir are the measurement noises for each measurement which are assumed to be normally distributed around zero with variances that depend on the range to the obstacle, according to [3]. The angle is acquired by knowing the angular resolution and sample number. The first measurement will have the angle φ0 = 95◦ and if the angular resolution is 1◦ the next measurement will have the angle φ1 = 94◦ and so forth until φ190 = −95◦ . Using the angle, each range measurement can be converted to cartesian coordinates in the robot’s coordinate system according to equation 2. i i p xr r cos φi dxr = + (2) piyr ri sin φi dy r Course name: Project group: Course code: Project: Control Project Laboratory MARCO TSRT10 MARCO E-mail: Document responsible: Author’s E-mail: Document name: [email protected] Emil Torp [email protected] DesignSpecificationV10.pdf MARCO 7 where dxr and dyr are used to compensate if the LMS is not placed in the center of the robot. 4.1.2 Odometers During short periods of time it can be assumed that the robot turns according to a circle as described by Figure 5 below. Figure 5: The motion of the robot during a turn The blue line corresponds to the robot’s driven path and the dashed lines corresponds to the paths of each wheel, d is the track width according to section 2.1 and ∆sL and ∆sR corresponds to the distance the left and right wheel have driven. The robot’s traveled distance between two positions will be calculated by comparing the total travel distance at those positions. By doing this the slip that build up over time will not have the same effect as if the total travel distance would be used. The traveled distance for each wheel is calculated as: ∆si = (sik − sik−1 ) + ek where i is L for left and R for right wheel, sik and sik−1 are the measured traveled distance at those positions and ∆si is the traveled distance between the two positions for wheel i. The robot’s traveled distance will be used to determine when a scan match should be performed. This is calculated according to (3) below. st = st−1 + ∆sL + ∆sR 2 (3) Whenever the distance s is updated this distance will be checked to see if a scan match should be performed. If this is the case, the distance s will be reset to zero. 4.2 Extended Kalman Filter The filtering will be done using an Extended Kalman Filter (EKF) which were chosen because the orientation angle will make the dynamics non linear and the common Kalman Filter will not suffice. The time update and measurement update will be done according to algorithm 8.1 in [1] where the system will be linearized at each time step. Course name: Project group: Course code: Project: Control Project Laboratory MARCO TSRT10 MARCO E-mail: Document responsible: Author’s E-mail: Document name: [email protected] Emil Torp [email protected] DesignSpecificationV10.pdf MARCO 4.2.1 8 Motion Model In order to get a better estimate of the robot’s position using the IMU, a motion model will be used. Since the robot is assumed to navigate on a flat horizontal ground a two dimensional motion model will initially be used. The motion model that will be used has states for the xy-coordinates for position, velocity and acceleration. It will also have a state for the robot’s orientation. The states describing the position, velocities and accelerations are all expressed in the global coordinate system. This model is described by equation 4 below. I2 02x2 x(t + T ) = 02x2 01x2 T3 02x1 6 I2 T2 I 02x1 x(t) + 2 2 TI 02x1 2 1 01x2 T2 2 I2 T I2 T I2 I2 02x2 01x2 I2 01x2 02x1 02x1 w(t) 02x1 1 (4) where x(t) is the discrete state vector (px , py , vx , vy , ax ay , θ)T , T is the sampling time and w(t) is process noise and is assumed to be normally distributed according to: N ∼ (0, Q) This motion model was derived from the constant acceleration model in [1] page 344. 4.2.2 Measurements The measurements that will be used are taken from the IMU and represents acceleration in the robot’s x- and y-direction and the IMU’s estimated θ. U aIM x U y(t) = aIM y IM U θ This expressed in the states are: U aIM x = ax cos θ + ay sin θ U aIM y IM U = −ax sin θ + ay cos θ = θ θ To these measurements there will be measurement noise, vk , with covariance matrix R according to: σax R= 0 0 0 σay 0 0 0 σθ In reality the covariance matrix is not diagonal as described above. The initial matrix is simply chosen like this because it is much easier to tune a diagonal matrix rather then a full matrix. If this is not good enough the dependencies will be taken in to consideration. The fact that the motion model only estimates position, velocity and acceleration in two dimensions result in a high dependency of a flat ground. If the floor is not completely Course name: Project group: Course code: Project: Control Project Laboratory MARCO TSRT10 MARCO E-mail: Document responsible: Author’s E-mail: Document name: [email protected] Emil Torp [email protected] DesignSpecificationV10.pdf MARCO 9 flat the robot will wobble a bit which will result in bad estimates. If this is proven to be to big of an issue the motion model will be expanded to model the position, velocity and acceleration in three dimensions (according to [1] page 344). If this is done the position in z will be extremely constrained, or even completely fix, in order to avoid the z position drifting away since it is known that the robot moves in the horizontal plane. It is also necessary to estimate all three angles describing the roll, pitch and yaw. These are all estimated by the IMU and will therefore be used in the same way as θ is in the two dimensional case, both in the motion model and the measurement model. The measurement model will also be expanded and take the acceleration in all three directions from the IMU. As said before the IMU will estimate all angles and these will also be used in the measurement model. One alternative is to use the scan match pose estimations as measurements in the EKF. 4.3 Scan Matching Scan matching uses two different scans and tries to translate and rotate the latest scan in a way in which the two scans have the best alignment and then change the robot’s position and orientation accordingly. By doing this the estimated position and orientation will be improved. An example is shown in Figure 6. Course name: Project group: Course code: Project: Control Project Laboratory MARCO TSRT10 MARCO E-mail: Document responsible: Author’s E-mail: Document name: [email protected] Emil Torp [email protected] DesignSpecificationV10.pdf MARCO 10 (a) Robot at reference position in a room (b) Measurements obtained at the reference position (c) Robot with a new position and orientation (d) Measurements at the new position (e) Both measurements after alignment Figure 6: Scan Matching Course name: Project group: Course code: Project: Control Project Laboratory MARCO TSRT10 MARCO E-mail: Document responsible: Author’s E-mail: Document name: [email protected] Emil Torp [email protected] DesignSpecificationV10.pdf MARCO 4.3.1 11 Strong Links Take two set of range measurements, M1 and M2 , from a reference position X1 and a new measurement position X2 respectively. Define two sets, F1 and F2 , which describe the field of view of the robot in each position. Fi is defined as: Fi = {(px , py ) = (xi , yi ) + r(cos φ, sin φ) : rmin ≤ r ≤ rmax , −95◦ ≤ φ ≤ 95◦ } (5) rmin = min ||(xi , yi ) − (px , py )ki ||2 (6) rmax = max ||(xi , yi ) − (px , py )ki ||2 (7) where 0≤k≤N 0≤k≤N where i denotes scan number 1 or 2 and k the kth sample of the corresponding scan. The two intersections M1 ∩ F2 and M2 ∩ F1 can then be used to see if there is a good match between the two scans. This because the intersections describe how many points in the environment the sensor is able to see from both position X1 and position X2 . If the number of elements in both intersections is above a certain limit a scan match can be executed. 4.3.2 Closest Pair of Points When a strong link between two scans is detected the task is to align the set of measured points to the reference points and in that way get a good estimation of the measurement position. To obtain the rotation and translation needed for aligning the points in a good way an ICP (Iterative Closest Point) algorithm will be used. First the points in M1 ∩ F2 need to be paired with the points in M2 ∩ F1 , which is done by the nearest neighbor criteria. Then the transformation parameters are estimated using a mean square cost function. After the points are transformed with the transform parameters the process is iterated until a convergence criterion is satisfied. 4.3.3 Pose Estimation Before starting the ICP algorithm a pose estimation is made from the EKF. This gives an approximation of the measurement position X2 in relation to the reference position X1 . When ICP is done the transformation parameters applied to the robots local position should give a better approximation of the robots global position. This can then be used to calibrate the position to a more accurate value when traveling large distances. 4.4 Generation of Mapping Data The map of the environment will be built using the estimated position and measurements from the SICK range laser. Since the position of each measurement will be in correlation to the robot this must be translated to fit to the global coordinate system. This is done according to: px x cos θ − sin θ pxr = + (8) py y sin θ cos θ py r Course name: Project group: Course code: Project: Control Project Laboratory MARCO TSRT10 MARCO E-mail: Document responsible: Author’s E-mail: Document name: [email protected] Emil Torp [email protected] DesignSpecificationV10.pdf MARCO 12 where (px , py )T is the position of the measured point in the global coordinate system, (x, y)T is the robot’s position, θ is the robots heading and (pxr , pyr )T is the position of the measured point in the robot’s coordinate system. 4.5 Building Local Map The systems internal representation of the map will be as a matrix. By using a method similar to ”occupancy grid” [7], each element in the matrix represents a square area with a certain side length (control parameter). The mapping data is a vector with robot pose and coordinates, in the global coordinate system, for detected points. This is then translated into the matrix as ones for elements with a point in them, minus one for elements between the robot position element and detected points elements and zeros for all other points. This will give a snapshot view of the visible area, to be combined with earlier snapshots into a probability map of the whole area, see Section 4.6. As the robot discovers new areas the matrix will expand to cover the whole known area. Expanding an already large matrix is calculation intensive so the local map will expand in intervals, adding more that is needed every time a point is found outside the known area. This way the size of the matrix won’t have to be updated as often, but the robot may still have to pause if suddenly discovering new areas (e.g. turning around a corner). 4.5.1 Building Local Map - An Example Examples of building the local map, the global map and choosing a trajectory will follow in this and the next section. To make the algorithm easier to follow, the examples share the same basic appearance and mapping area. The different colors and letters are explained in Figure 7. Figure 7: Clarifications for following examples The robot’s position is in Figure 8 is given as the starting point. The orientation of the robot is given by the arrow from the starting point. The edges of the robots field of view (assumed 180 degrees) is given by the two lines perpendicular to the orientation. Every square here represents an element in the local matrix and the number in the square the value of set element. The resulting map is shown in Figure 8. Course name: Project group: Course code: Project: Control Project Laboratory MARCO TSRT10 MARCO E-mail: Document responsible: Author’s E-mail: Document name: [email protected] Emil Torp [email protected] DesignSpecificationV10.pdf MARCO 13 Figure 8: Generated local map 4.5.2 Starting Procedure Before the system is switched on the local map is totally empty. When started, the local map matrix will expand rapidly and the robot may have to pause to generate the first matrix. Starting procedure includes a 360 degree turn to give the trajectory planning as good information as possible and here as well the matrix may expand rapidly and cause the robot to pause. 4.6 Building Global Map The local map is added to a global map. This is a simple summation of the matrices and the elements in the global matrix will therefore increase or decrease by one or stay unchanged. Element values close to zero in the global map will be a representation of an element which has not been sufficiently explored, a large positive value will represent an obstacle or wall and a large negative value will represent that the space (element) is unoccupied. In short, this gives an occupancy estimation for each element with a probability to be correct that is correlated with the absolute value of the element. It might be desirable to lock elements that have reached as certain limit for further updates, if this will decrease the calculation intensiveness or increase the quality of the map. 4.6.1 An Example In Figure 9 the robot has turned 360 degrees and added the generated local matrices into a global matrix. The squares represent elements in the global matrix and the numbers in the squares represent the accumulated value of the elements from the local matrices. Occupied elements close to the robots position will have gathered more measured points and will therefore have accumulated a higher value in the global matrix. In a similar way, unoccupied elements close to the robots position will have accumulated a lower value in the global matrix. The absolute value of an element then represents the number of times the element has been measured and therefore its probability to be correct. For visual reasons, the numbers are very low in respect to what they should be after a 360 degree turn. Course name: Project group: Course code: Project: Control Project Laboratory MARCO TSRT10 MARCO E-mail: Document responsible: Author’s E-mail: Document name: [email protected] Emil Torp [email protected] DesignSpecificationV10.pdf MARCO 14 Figure 9: Generated global map after 360 degree turn 5 Trajectory Planning The system needs to be able to generate desired target positions based on the point map in order to explore uncharted areas. Trajectories for set target positions will then be computed using an optimization algorithm for lowest cost. 5.1 Acquire Target For the system to be able to choose a new trajectory it must first know the starting point and the end point. The starting point is given by the positioning function and the end point will have to be acquired using collected mapping information. To search the generated global map (large matrix) for uncharted, and therefore desired, locations the map will be divided into overlapping target sub-matrices. The level of chartedness is determined by a summation of the absolute values of all elements in a target sub-matrix, as the large matrix is built up by values related to how well an element is mapped. The target sub-matrices will be sorted in level of chartedness and a set number (control parameter) of target sub-matrices with the lowest sum will be chosen as possible targets. 5.1.1 An Example In Figure 10, the global map has been divided into overlapping target sub-matrices. The different colors for the sub-matrices are for visual reasons only. In the middle of each target sub-matrix is the sum of the absolute values of all elements in the set sub-matrix. For visual reasons, the individual elements values are one if occupied, minus one if unoccupied and zero if unknown. Course name: Project group: Course code: Project: Control Project Laboratory MARCO TSRT10 MARCO E-mail: Document responsible: Author’s E-mail: Document name: [email protected] Emil Torp [email protected] DesignSpecificationV10.pdf MARCO 15 Figure 10: Calculated level of chartedness In Figure 11, two targets have been chosen as they have the lowest sum (for more information on choosing few targets, see Section 5.6). Figure 11: Acquired targets 5.1.2 Target Sub-matrix Size The size of the target sub-matrices will be a control parameter and will influence the precision and the calculation intensiveness of the system. Small target sub-matrices will make the system less likely to neglect small uncharted areas and will therefore give a more precise final map. But dividing the global map into many sub-matrices means that more calculations will have to be done per cycle. 5.1.3 Alternative Fast Target Search The information from the SICK laser range sensor is collected as a vector with the measured distance in all available angles. A large gap in the measured distances between two neighboring angles φi and φj ∈ [−95◦ , 95◦ ] indicates a discontinuity. Equations (11) to Course name: Project group: Course code: Project: Control Project Laboratory MARCO TSRT10 MARCO E-mail: Document responsible: Author’s E-mail: Document name: [email protected] Emil Torp [email protected] DesignSpecificationV10.pdf MARCO 16 (13) describe the desired robot pose in the global coordinate system when the point is reached. r(φi ) − r(φj ) > J ⇒ rpoint = r(φi ) − r(φj ), φpoint = φi (9) r(φi ) − r(φj ) < −J ⇒ rpoint = r(φj ) − r(φi ), φpoint = φj (10) xtarget = x + rpoint cos(φpoint + θ) (11) ytarget = (12) θtarget = y + rpoint sin(φpoint + θ) θ + φpoint + π2 if ri > rj |j > i θ + φpoint − π2 if ri < rj |j > i (13) A discontinuity can indicate that an object is blocking the view from the robot, and the area behind is therefore interesting to explore. It can also be a door opening or a corner of a wall. By choosing a point between the two distances, at the angle with the larger distance and check for unexplored areas in the vicinity of the point it is possible to calculate if the point is desired or not. Sample robot−view Sample range−plot 60 80 70 50 60 50 30 range Distance [dm] 40 40 20 30 10 20 0 10 0 10 20 30 40 50 60 Distance [dm] 70 80 90 100 0 0 20 40 60 80 100 120 140 160 180 θ [°] Figure 12: Sample range-plot, r(φ) acquired from a given situation, shown in the left figure. Green dot represents a point of interest and the red dot is the robot. Each acquired interesting point will be stored in a list and the target point will be chosen from the list accordingly to the same principles as described in the sections to come. In Figure 12 an example is displayed. Here, a candidate is found at approximately 0◦ . The candidate will be compared to all the other interesting points already in the list. If the candidate is close to an existing point, a decision will be made to keep the most interesting of the two. This will be done comparing the neighboring points and see which has the most uncharted vicinity. This procedure makes it easy to choose the target point and one can be sure that it is reachable. This will save time and the need to generate several different trajectories will be eliminated. 5.2 Generate Cost Matrices For the selected target sub-matrices, with the lowest sum, the middle point is first defined as trajectory end point. Cost matrices will be generated from the end points, covering the whole global map. This cost matrix method will be derived from Dijkstras algorithm [8] and A* algorithm [9], but will be adapted for use with occupancy grid methodology. This Course name: Project group: Course code: Project: Control Project Laboratory MARCO TSRT10 MARCO E-mail: Document responsible: Author’s E-mail: Document name: [email protected] Emil Torp [email protected] DesignSpecificationV10.pdf MARCO 17 includes grouping together elements in small cost sub-matrices, as taking steps between single elements might be to calculation intensive. To start generating the cost matrix, from the end point, a step is taken in each direction (eight directions) adding the cost of the adjacent cost sub-matrix. From each new point, new steps are taken continuously adding the cost of the cost sub-matrices. There are several possible algorithms for this generation and to see which one is the least performance demanding one will have to be tested. These cost matrices are then stored attached to respective sub-matrix. 5.2.1 An Example To simplify, in this example no regard is put to the size of the robot. The cost sub-matrices will therefore be the size of an element. All cost sub-matrices also have the cost of one if unoccupied or unexplored and infinity if occupied. In Figure 13 costs have been generated for all cost sub-matrices and at every point in the cost matrix the lowest cost of traveling to the end point is given. This means that the cost matrix can be reused for any starting point, given that no new obstacles are found. Figure 13: Generated cost matrix 5.3 Generate Trajectories Given the cost matrices for the selected targets, the trajectory for each of the targets are then set as the lowest cost path from starting point to end point (center point of target sub-matrix). This can be done in many ways and the method which is the least demanding will have to be tested. If no trajectory can be generated this means that the selected cost sub-matrix is outside the enclosed area to be explored and that cost sub-matrix will be blocked for further trajectory generation. If a trajectory is generated, it too will be stored attached to respective sub-matrix. 5.3.1 An Example In Figure 14, a trajectory has been generated from the starting point to the end point. The cost of the trajectory is given as the cost of the cost sub-matrix linked with the starting point. Course name: Project group: Course code: Project: Control Project Laboratory MARCO TSRT10 MARCO E-mail: Document responsible: Author’s E-mail: Document name: [email protected] Emil Torp [email protected] DesignSpecificationV10.pdf MARCO 18 Figure 14: Trajectory generated through lowest cost path 5.3.2 Reduction of Calculation Intensiveness To generate cost matrices and calculate trajectories for all selected target sub-matrices in every cycle might require to much computation performance. Considering that the system will often choose the same target sub-matrices in sequential cycles, trajectories and cost matrices can be reused. Before generating a new cost matrix and trajectory for a target sub-matrix, a check can be done to see if the current position is on the previously stored trajectory. This will be the case if the current target sub-matrix was the chosen end point in the last cycle. The old trajectory can then be reused if no new obstacles (e.g. walls) have been detected in the path of the trajectory. If the current position is not on the old trajectory or if obstacles have been found on the path, the old cost matrix might still be used. By generating cost matrices from the end point instead of from the starting point, old cost matrices are still valid even if the robot position has changed. This way, a new trajectory can be calculated without having to generate a new cost matrix. A check has to be made here as well to ensure that no obstacles are on the new trajectory, since new obstacles are not considered in the old cost matrix. If the calculated trajectory can’t be used, a new cost matrix will have to be generated. Another way of decreasing the calculation intensity could be to only choosing sub-matrices to evaluate that at least have some negative values. This will give higher probability that a trajectory can be generated, because the system has indicated that there are known and unoccupied elements in the sub-matrix. Using this requirement for the sub-matrices no sub-matrices outside the closed area are going to be evaluated, which will hold down the intensiveness of the calculation when generating a target point. 5.3.3 Cost Sub-matrix Size As each element in the global map represents a small area, costs will have to be calculated for small sub-matrices. An effect of this is that sub-matrices close to walls but not ”in” the wall will have slightly higher cost then further out the wall and thus will be down Course name: Project group: Course code: Project: Control Project Laboratory MARCO TSRT10 MARCO E-mail: Document responsible: Author’s E-mail: Document name: [email protected] Emil Torp [email protected] DesignSpecificationV10.pdf MARCO 19 prioritized but not totally avoided. A suitable size for the cost sub-matrices might be the same as the robot width. With that comes the simplification that a cost sub-matrix is accessible for the robot without having to look at it’s neighbors. 5.3.4 Alternative Cost Calculation For a more optimal trajectory planning, diagonal steps in the map might be considered to have higher costs than vertical or horizontal steps. This would be a better representation of the reality than if all steps would count equally. 5.4 Choose Best Target When all selected target sub-matrices have been assigned a level of chartedness and a cost of trajectory, the best trajectory can be chosen. To choose the best trajectory, the system will have to compare the level of chartedness with the cost of the trajectory for each remaining target sub-matrix. This quota can not be strictly proportional as target sub-matrices may have the sum of zero if not at all charted and as the user will want to influence the importance of the cost in relation to the level of chartedness. This can be done by decide on the path with the lowest cost according to some given equation. An example of such an equation is given by (14). (matrix sum + p1 ) · costp2 (14) where p1 and p2 are control parameters. The equation with the lowest value gives the most desirable trajectory. 5.4.1 An Example In Figure 15, all target sub-matrices are shown together with the generated trajectories for the two possible targets from earlier examples. The trajectory to follow will be the one with the lowest cost in relation to the lowest level of chartedness. Figure 15: Set relation between cost and sub-matrix sum decides best trajectory Course name: Project group: Course code: Project: Control Project Laboratory MARCO TSRT10 MARCO E-mail: Document responsible: Author’s E-mail: Document name: [email protected] Emil Torp [email protected] DesignSpecificationV10.pdf MARCO 5.4.2 20 Alternative Decision Equation When decision making is based on sum and cost alone, certain situations might limit the systems performance. If the robot’s orientation and/or speed is considered in the equation some of these situations can be prevented. For example, if orientation and speed are considered, a trajectory that is slightly less desirable in respect to sum and cost can still be chosen as the best trajectory if it is on the robot’s current path and a non-negligible speed has been accumulated in that direction. An example of a criteria that takes this in to account is stated in (15). (matrix sum + p1 ) · costp2 · (|trajectory direction − orientation| · speed + p3 ) (15) where p1 to p3 are control parameters. The equation with the lowest value gives the most desirable trajectory. Course name: Project group: Course code: Project: Control Project Laboratory MARCO TSRT10 MARCO E-mail: Document responsible: Author’s E-mail: Document name: [email protected] Emil Torp [email protected] DesignSpecificationV10.pdf MARCO 5.5 21 Algorithm The algorithm is composed of several steps to ensure that a good trajectory is found. The algorithm includes re-usage of old data in order to reduce computation intensiveness. Figure 16: Algorithm of trajectory planning Course name: Project group: Course code: Project: Control Project Laboratory MARCO TSRT10 MARCO E-mail: Document responsible: Author’s E-mail: Document name: [email protected] Emil Torp [email protected] DesignSpecificationV10.pdf MARCO 5.6 22 Trajectory Update The trajectory will have to be updated as new information continuously becomes available. The frequency of trajectory update will have to be tested for optimal performance. The large main matrix and the high amount of smaller sub-matrices may cause the optimal trajectory generating functions to be calculation intensive and therefore high frequency update is to be avoided. If the number of target sub-matrices, to generate trajectories to, are low or the target sub-matrices sizes are small, a situation might arise where lots of target sub-matrices will have the sum of zero. The choice of which to evaluate will then become arbitrary. However, this will not cause a problem if the chosen target sub-matrix from the last cycle is always included in the following cycle. 5.7 Mapping Termination Exploration of the enclosed area is finished when all target sub-matrices have achieved a level of chartedness (sum of absolute values of elements) set by the user, or are blocked for being outside the enclosed area. The visual map can then be drawn from the accumulated global map, but if a smoother visual map is preferred it might want to go through a smoothening filter that removes occupied element with few occupied neighbors or elements with low level of chartedness. 6 Path Following A controller will be designed to guide the robot through the area along the given trajectory. The aim of the control system is to minimize the robot pose error compared to the trajectory, er = x(k) − xref (k). The robot speed v(k) and angular velocity ω(k) are the control signals and can be applied direct or indirect using the existing MATLAB interface. When designing the control system, it must be taken into account that both the velocity and the angular velocity are restricted by maximum values. If the velocity and angular velocity only can be set indirect in terms of maximum values, then there is need for an other control system. This control system will generate control signals, using the desired v and ω as reference signals. 6.1 PID Controller For this application a PID-controller may be enough to control the robot along the trajectory. A discrete time implementation can be seen in (16) where ∆Tk is the time since the last control signal calculation. Since the calculation won’t be evaluated with a specific sample time, it will be necessary to measure the elapsed time since the last evaluation. k X e − e 1 k k−1 ∆Tj ej + Td (16) uk = K ek + Ti j=0 ∆Tk The constants for the proportional part, K, the integral part, Ti , and the derivative part, Td , needs to be determined. These constants will be configured with manual tuning. Course name: Project group: Course code: Project: Control Project Laboratory MARCO TSRT10 MARCO E-mail: Document responsible: Author’s E-mail: Document name: [email protected] Emil Torp [email protected] DesignSpecificationV10.pdf MARCO 23 The PID controller will be implemented in a way to prevent integral windup according to [6]. Also, the velocity will not be regulated directly. It will instead be depending on how big the turn will be. A larger turn equals lower velocity. Figure 17: Block diagram of the robot control system. 6.1.1 Feed-forward The calculated trajectory will determine where we want to drive and combined with information about the speed and inertia of the robot a feed forward control will be created in addition to the PID. This feed forwarding will provide the major portion of the controller output and the PID will regulate the assumed position with the actual position. And since feed forwarding is not affected by the process feedback it will improve the system response and stability. The F block in Figure 17 calculates the trajectory reference turn, ωr , by looking ahead in the given trajectory. This equals using a horizon a bit further away from the current position and will give a smoother curve to drive on. 6.1.2 Potential Problems with PID If the position estimated by the SLAM-system is noisy, it might generate large changes in the controllers setpoint which can result in an unstable controller. The characteristics of the noise depends on how well the SLAM-system performs and is hard to know in advance. Simulations will be performed using MATLAB to analyze how noisy pose estimations will effect the PID performance. A PID-controller also has difficulties in non-linear systems. It can have problems reacting to changing process behaviour, e.g. it may need other control parameters after the system has been run for a while and the segway engine is getting warmed up. This needs to be investigated. 6.2 MPC Controller If the PID controller doesn’t obtain the level of control that is wanted, it will be replaced by an MPC-controller. This will be done using a method described in Kühne et al. [5]. The basic steps of the method is described in this section. A two dimensional motion model (17) can be stated assuming there is no slipping. x, y Course name: Project group: Course code: Project: Control Project Laboratory MARCO TSRT10 MARCO E-mail: Document responsible: Author’s E-mail: Document name: [email protected] Emil Torp [email protected] DesignSpecificationV10.pdf MARCO 24 and θ defines the robot pose. v and ω is the control signals. ẋ = v cos(θ) ẏ = v sin(θ) θ̇ = ω (17) A virtual reference car (18) is defined to act as a reference when designing the MPC controller. The specified reference car will travel along the given trajectory without errors. This model also gives reference values for the control signals v and ω. ẋr = vr cos(θr ) ẏr = vr sin(θr ) θ̇r = (18) ωr By linearizing the model using a Taylor expansion around (xr , ur ) and neglecting higher order terms and subtracting the reference car, one obtains the following errors with respect to the reference car. ẋ − ẋr 0 0 ẏ − ẏr = 0 0 0 0 θ̇ − θ̇r −vr sin θr x − xr cos θr vr cos θr y − yr + sin θr 0 θ − θr 0 e˙ = fX,r X e + fU,r U e X 0 v − vr 0 ω − ωr 1 (19) (20) A discrete-time error model can be obtained by using forward differences. This model is given by equation (21), where A(k) and B(k) is given by (22) and (23) respectively. T is the sample time. ˙ e e e (k) X(k + 1) = A(k)X(k) + B(k)U −vr (k) sin θr (k)T vr (k) cos θr (k)T 1 cos θr (k)T 0 B(k) = sin θr (k)T 0 0 T (21) 1 0 A(k) = 0 1 0 0 (22) (23) The control problem can then be stated as a quadratic programming problem that can be solved at each sample moment. The computational cost for the algorithm will be acceptable if the prediction horizon is kept at reasonable lengths. Using the MPC controller will be a good method if you want to implement constraints on the control signals. It’s rather straightforward to implement speed limitations from the collision system described in Section 7. Since the model is linearized around the reference trajectory there might be complications if the control error is large, i.e. if the robot is located far away from the trajectory. This problem is connected to the problem with uncertain position estimates and has to be analyzed if the MPC is to be used. Course name: Project group: Course code: Project: Control Project Laboratory MARCO TSRT10 MARCO E-mail: Document responsible: Author’s E-mail: Document name: [email protected] Emil Torp [email protected] DesignSpecificationV10.pdf MARCO 7 25 Collision System To avoid collisions with both moving and fixed objects, a security system will overlook the environment ahead of the robot. Using raw data from the SICK laser range sensor the subsystem will declare if it is safe to move with the current speed, vcurrent . If it is not safe the system will decrease the speed, v. Definition of the restricted area using polar coordinates: v vcurrent = r sin(θ) ymin 2 + r cos(θ) xmin 2 (24) Using an ellipse that depends on the velocity of the robot and letting the collision system reduce the velocity when an object is detected inside the ellipse, this will give the system a way to maintain the requirements of safety without creating problem with the mobility of the robot. Further, it gives a way to continuously control the velocity. The constants xmin and ymin are used to choose the desired minimal radius to any object before the collision system reacts. [meter] 1 1 0.8 0.8 0.6 0.6 0.4 0.4 0.2 0.2 0 −0.6 −0.4 −0.2 0 [meter] 0.2 0.4 0 0.6 Figure 18: Restricted area around the robot. Figure 18 displays how the velocity will be controlled with regards to the area in front of the robot, where blue represents current velocity and red is minimal, xmin = 0.6 and ymin = 1. When the system gets active and the speed should be decreased, the safe speed will be sent to the controller. If the trajectory or path following functions make the robot move as close to an obstacle so that the collision system stops movement for the robot all together, the system should clear collected data of the immediate surrounding and make a new sweep (rotate 360 degrees). This might happen if a new obstacle is introduced in the path of the robot in an already mapped area. Course name: Project group: Course code: Project: Control Project Laboratory MARCO TSRT10 MARCO E-mail: Document responsible: Author’s E-mail: Document name: [email protected] Emil Torp [email protected] DesignSpecificationV10.pdf MARCO 8 26 Code and Document Conventions Here are the conventions that will be used for this project listed. 8.1 Code Conventions The following conventions will be used for all code written in this project. • All naming will be done in English. • Comments will be in English. • Classes will be nouns in the singular form, e.g. Laser or the name of the module, e.g. NetworkModule. • Classes will use PascalCase, which means that the first letter in each word is in upper case. • Methods will use camelCase, e.g. stopSegway() or startCalculatingPosition() • Variables and data members will use camelCase, e.g. segwayCoordinate. • No underlines will be used when naming classes, variables or methods. 8.2 Document Conventions All external documents will be written in English, internal documents e.g. meeting protocols will written in Swedish. All headlines must be followed by a short descriptive text of the section in question. Course name: Project group: Course code: Project: Control Project Laboratory MARCO TSRT10 MARCO E-mail: Document responsible: Author’s E-mail: Document name: [email protected] Emil Torp [email protected] DesignSpecificationV10.pdf MARCO 27 References [1] Fredrik Gustafsson, Statistical Sensor Fusion. Studentlitteratur AB, Lund, Edition 2:1, 2012. [2] Xsens Technologies B.V., MTi-G User Manual and Technical Documentation. Xsens Technologies B.V., Revision G, 27 May 2009. [3] SICK AG, Laser Measurement Systems of the LMS500 Product Family. SICK AG, 27 September 2010. [4] T. Glad och L. Ljung, Reglerteori - Flervariabla och olinjära metoder. Studentlitteratur, Lund, 2003 [5] Felipe Kühne, Walter Fetter Lages, and João Manoel Gomes da Silva Jr. Mobile robot trajectory tracking using model predictive control. São Luı́s, 2005. [6] Reglerteknik, ISY, Industriell reglerteknik, Kurskompendium. Linköping, 2010. [7] S. Thrun, W. Burgard, D. Fox, Probabilistic Robotics. Massachusetts Institute of Technology, 2006. [8] J. Lundgren, M. Rönnqvist and P. Värbrand Optimeringslära. Studentlitteratur, Linköping, 2008. [9] S. Rabin Ai Game Programming Wisdom. Cengage Learning, 2002. Course name: Project group: Course code: Project: Control Project Laboratory MARCO TSRT10 MARCO E-mail: Document responsible: Author’s E-mail: Document name: [email protected] Emil Torp [email protected] DesignSpecificationV10.pdf