1
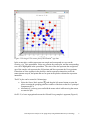
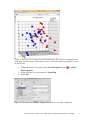
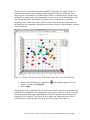
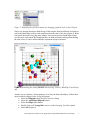
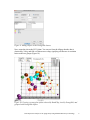
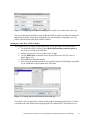
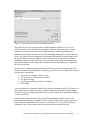
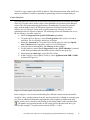
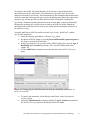
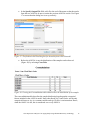
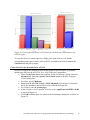
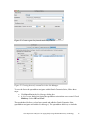
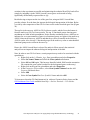
Figure 20: Viewing the Plot Sources of Variation for the multi-way (left) and one-way ANOVA (right) To view the source of variation plot for a single gene, right click on a row header corresponding to the gene in either of the ANOVA spreadsheets and select Sources of Variation from the pop-up menu. Create Gene List for the multi-factor ANOVA In order to compare the differences between the results of the two ANOVAs, generate another gene list from the ANCOVA-2way (ANOVAResults2) spreadsheet. Select Create Gene List in the workflow. In the List Manager dialog, select the Advanced tab. Select the Specify New Criteria button to open the Configure Criteria dialog box \ For Name, specify Multiway Ensure that the ANCOVA-2way (ANOVAResults2) Spreadsheet is selected as this is the spreadsheet that will be used to create the new gene list For Column, select 6. p-value(Age) In the Configure criteria portion, Include p-values significant with FDR of 0.001 as shown in Figure 21 Click OK to add the gene list criteria to the List Manager dialog box as shown in Figure 22 Gene Expression Analysis of an Aging Study Using Illumina Microarray Technology 18