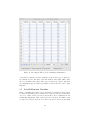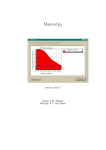
1
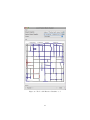
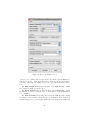
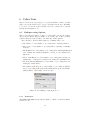
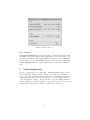
User Manual for GeoDaNet:
Spatial Analysis on Undirected Networks
Myung-Hwa Hwang and Andrew Winslow
Arizona State University
[email protected]
March 22, 2012
Contents
1 Overview
2
2 Toolbar and Menubar
3
3 Data Tools
3.1 Distance . . . . . . . . . . . . . . . . . . . . . . . . . . . . . . . .
3.2 Creating Distance Weights . . . . . . . . . . . . . . . . . . . . . .
3.3 Access . . . . . . . . . . . . . . . . . . . . . . . . . . . . . . . . .
4
4
6
8
4 Global Statistics Tools
10
4.1 K-Functions . . . . . . . . . . . . . . . . . . . . . . . . . . . . . . 10
4.2 K-Functions Visualizer . . . . . . . . . . . . . . . . . . . . . . . . 13
5 Local Statistics Tools
5.1 Kernel Density . . . . . . . . . . . . . .
5.2 Network Kernel Visualizer . . . . . . . .
5.3 Planar Kernel Visualizer . . . . . . . . .
5.4 Local K-Function . . . . . . . . . . . . .
5.5 Local K-Function Visualizer . . . . . . .
5.6 Local Indicators of Network-Constrained
5.7 LINCs Visualizer . . . . . . . . . . . . .
. . . . .
. . . . .
. . . . .
. . . . .
. . . . .
Clusters
. . . . .
.
.
.
.
.
.
.
.
.
.
.
.
.
.
.
.
.
.
.
.
.
.
.
.
.
.
.
.
.
.
.
.
.
.
.
.
.
.
.
.
.
.
.
.
.
.
.
.
.
.
.
.
.
.
.
.
.
.
.
.
.
.
.
15
15
17
18
19
22
23
28
6 Utility Tools
6.1 Multiprocessing Options . . . . . .
6.2 Maximally Connected Component
6.3 Dissolve/Split Network . . . . . . .
6.4 Count . . . . . . . . . . . . . . . .
.
.
.
.
.
.
.
.
.
.
.
.
.
.
.
.
.
.
.
.
.
.
.
.
.
.
.
.
.
.
.
.
.
.
.
.
.
.
.
.
31
31
32
32
34
7 Acknowledgments
.
.
.
.
.
.
.
.
.
.
.
.
.
.
.
.
.
.
.
.
.
.
.
.
.
.
.
.
35
1
1
Overview
GeoDaNet is a desktop software application for computing and visualizing spatial analysis measures on undirected networks. In particular, GeoDaNet can
compute the following measures:
• Network and Euclidean distances
• Network and Euclidean distance-based accessibility measures such as equity, potential entropy, travel cost, etc.
• Network and planar global K function
• Network and planar Kernel density surface
• Network local K function
• Local indicators of network-constrained clusters (LINCs)
The tools in GeoDaNet are divided into four types: data, analysis, visualization, and utility tools. Roughly, the first three types of tools form a workflow
with three stages: 1) generation of distances and descriptive measures in data
tools, 2) estimation of spatial statistics in analysis tools, and 3) display of the
results in visualization tools. The utility tools support additional cleaning and
processing of input network data and are often employed before the estimation
of a spatial statistic. These tools have been tested only for small networks and
point sets.
Currently, GeoDaNet runs on both Mac and Windows machines. The Mac
version supports multi-core processing, while the Windows version uses only one
CPU core. It may take some time to launch the Windows version since it is
decompressed into your TEMP directory.
The following sections explain the details of the various tools, such as their
inputs, outputs, parameters, and suggestions for use.
2
2
Toolbar and Menubar
When you run GeoDaNet, the toolbar (Figure 1) and the menubar (Figure 2)
are the first things you will see. The toolbar provides quick links to various
analysis tools. Tools that are accessible from the toolbar can also be launched
from text menus in the menubar. Tools on the toolbar are split into three
groups: distances and access measures, global statistics, and local statistics.
Figure 1: The Toolbar
The menubar provides menu-based access to the four types of tools in GeoDaNet. The File menu includes one submenu Quit. Data tools such as distances and access measures can be launched from the Data menu. Spatial estimation techniques such as global K-Function, Kernel density, local K-Function,
and LINCs are accessible from the Analysis menu. Tools for displaying results can be launched from the Visualization menu. Finally, the Utilities
menu provides links to the tools for configuring the number of CPU cores to
be used and for pre-processing network data. Tools for network pre-processing
include the extraction of the maximally connected component, the segmentation
of network edges, and the aggregation of points on network edges.
Figure 2: The Menubar
3
3
Data Tools
These tools generate distances and descriptive statistics. Data files containing
distances are important since they are used as inputs for other tools. In other
words, they serve as intermediate data. Intermediate data save time and computing resources by avoiding costly re-computation of values and by using the
data in multiple analysis methods.
3.1
Distance
This tool is used to compute distances between objects (points or polygons)
either on a 2D plane or a planar undirected network. The distance between two
objects on a 2D plane is identical to Euclidean distance. The distance between
two objects on a planar undirected network is the length of the shortest path
along the network that connects them. Source objects, destination objects, and
the input network must be in an identical projected coordinate system, i.e., not
in latitudes and longitudes. When network distances are computed, source and
destination objects are ’snapped’ to the nearest location on the input network.
In this manual, a planar undirected network is assumed to consist of nodes and
edges. The ’snapped’ objects are not part of the input network unless other
modifications are applied to the network. So, we distinguish ’snapped’ objects
from network nodes.
Figure 3: The Distance tool
4
3.1.1
Workflow
1. In the Source/Destination panel, select a shapefiles that contain source
and destination objects, respectively. For each file, select an ID variable.
2. (Optional) If you want to compute network distances, go to the Base Network panel. Select a shapefile that contains your input network. Then,
configure other related options such as Maximum Distance and Euclidean Distances. If you do not select any file in the Base Network,
the distance tool will compute Euclidean distance for all pairs of source
and destination objects.
3. In the Output panel, select a name of the output file that will record the
origin, destination, and distance between them.
4. If you would like to create a spatial weights file, you first have to compute
distances. Then select the Use source shapefile for destination option
under Source Shapefile and choose Create Weights. See the section
below on Creating Distance Weights for more information.
3.1.2
Source/Destination
In the Source Shapefile and Destination Shapefile fields you specify the
objects for which distances will be computed. Both fields accept point and
polygon files (polygons are converted to their centroids for the calculation).
These points are then ’snapped’ to the closest network location. Distances are
computed from each source point to each destination point.
The ID field specifies which column of the DBF file will be used to identify
the source and destination objects in the output file. The values of the selected
ID column should be unique. When there is no column with unique ID values,
you can click on the icon to the right of the ID field to generate a new data
column that contains unique integer IDs. The values of the selected ID column
will be used in the ’source id’ and ’destination id’ columns in the output file.
When source and destination objects are identical, you can check the Use
source shapefile for destination option after selecting a source shapefile.
Then the distance tool will automatically define the source and destination
shapefile and ID field as identical.
3.1.3
Base Network
The Network Shapefile field accepts a shapefile (*.shp, *.shx, *.dbf) of arcs
(i.e., polylines). To obtain valid network distances, you need to make sure that
the input file includes a connected network. The utility tool called Maximally
Connected Component allows you to extract one network that is connected
and includes the maximum number of network edges (e.g. this excludes network
islands).
The Edge Length option is not required. It specifies the field in the DBF
file that contains the length of network edges. When values are selected here,
5
the distance tool will start computing network distances without first computing
the length of network edges.
The Maximum Distance field specifies a cutoff for distances to be calculated. Only object pairs with a network distance less than the cutoff will be
recorded in the output file. The cut-off value should be set as small as possible
since the distance calculation is based on an expanding search method1 which
stops once all distances below the maximum distance are found. The find tool
to the right of the Maximum Distance field provides reference information
that can help you determine this value. The find tool randomly selects 10%
of network nodes, computes network distances between the selected nodes and
other nodes, and returns the minimum, mean, and maximum of the obtained
network distances.
The Euclidean Distances option specifies if Euclidean distances are to be
computed for object pairs whose network distances are found.
3.1.4
Output
The Output CSV File specifies the file to which the distances will be written.
The file is a comma-separated value (CSV) file of (Source ID, Destination ID,
Distance) or (Source ID, Destination ID, Network Distance, Euclidean Distance)
rows (Figure 4). Distances greater than the maximum distance field will not be
written to the output file.
(a) File of (Source ID, Destination ID, Network Distance, Euclidean Distance) Rows
(b) File of (Source ID, Destination ID, Network Distance, Euclidean Distance) Rows
Figure 4: Output CSV File of Distances
3.2
Creating Distance Weights
This tool generates spatial weights files by using distance values calculated with
the distance tool. It supports threshold-based and k-nearest neighbors distance
1 Dijkstra’s
algorithm
6
weights. By default, the tool creates binary weights (a point is or is not a
neighbor of another point), but when the Inverse option is selected, the tool
uses the inverse of distance as weights.2
Figure 5: The Distance Weights tool
3.2.1
Workflow
1. In the Input panel, select the name and type of an output weights file.
The other fields in the Input panel are automatically populated based on
the specifications of the previously used distance tool.
2. In the Distance Weights panel, specify the type of distance weights.
3. Click the Create button to generate your weights file.
3.2.2
Input
The Input File field specifies the source shapefile used in the distance tool. The
Distance File field specifies the output distance file generated by the distance
tool. The ID Variable field specifies which column of the input shapefile will
be used to identify each object in the output weights file. The values for Input
File, Distance File, and ID Variable are automatically specified when the
tool is launched.
2 Note that OpenGeoDa currently only processes binary distance weights even when inverse
distance weights are specified.
7
The Save output as field specifies the name and format of the spatial
weights file. At present, the following file formats are supported: ArcGIS DBF,
ArcGIS TXT, ArcGIS SWM, DAT, GAL, GeoBUGS TEXT, MatLab MAT,
MatrixMarket MTX, Lotus WK1, and STATA TXT.
3.2.3
Distance Weights
In this panel, you need to choose which type of distance weights to create.
The Threshold Distance field specifies the maximum distance within which
objects are considered to be neighbors. As you move the slider up, the value for
the Cut-off point will increase. The k-Nearest Neighbors field specifies the
number of nearest objects that will be considered to be neighbors. The Inverse
Distance field specifies whether the inverse of the calculated distance is used as
the final spatial weight. When this option is selected, the format of the output
weights file should not be GAL.
3.3
Access
This tool calculates a variety of measures related to the accessibility of points
such as amenities, goods and services.
Figure 6: The Accessibility tool
8
3.3.1
Workflow
1. (Assumption) Distances between sources (e.g., residential units of origin)
and destinations (e.g., amenities) were computed with the distance tool.
2. In the Statistics panel, select accessibility measures.
3. In the Output panel, specify the name of an output file.
3.3.2
Input
The Distances CSV File field accepts a CSV file with (Source ID, Destination
ID, Distance) rows. Accessibility statistics will be computed for each source
object using the set of distances found between it and destination objects in the
file.
3.3.3
Statistics
Four types of accessibility measure can be computed for each source object:
• Equity: the distance to its closest destination object
• Potential Entropy: the sum of entropy values for all destination objects.
The entropy value is determined by e−d where d is the distance between
the source object and a destination object.
• Potential Gravity: the sum of gravity values for all destination objects.
The gravity value is determined by 1/d2 where d is the distance between
the source object and a destination object.
• Travel Cost: the sum of distances to all destination objects
• Covering: the number of destination objects within a bandwidth from the
source object. The Coverage bandwidth field defines the bandwidth.
The find button to the right of this field provides summary statistics of
input distances to help find a bandwidth value.
3.3.4
Output
The output is written as a CSV file of (Source ID, Statistic 1, ...) rows. Columns
are only presented for the selected statistics.
Figure 7: Output CSV File of Accessibility Measures.
9
4
Global Statistics Tools
These tools estimate global statistics of spatial clustering by using distance data
generated with the distance tool.
4.1
K-Functions
This tool calculates the K-function for a given point set or pair of point sets on
a 2D plane or undirected network. It uses intermediate distance data computed
with the distance tool.
Figure 8: The K-Functions tool
4.1.1
Workflow
1. In the Input panel, specify or generate distance data for a point set or
pair of point sets using the distance tool.
10
2. In the Area/Network panel, specify a shapefile that includes the boundaries of your point dataset or the base network that the distances for you
point dataset are computed with.
3. In the K Function Type panel, select the type of K-function you want
to compute.
4. (Optional) If you want to obtain a simulation-based significance envelope
for your estimated K-function, choose the Compute Envelope option
and configure the related parameters.
5. In the Distance panel, specify the maximum distance, the minimum distance, and resolution (distance interval). Based on these parameters, a
set of search radii will be determined and used for K-function estimation.
You can use the Distance Stats as guidelines.
6. In the Output panel, specify output CSV files for your estimated Kfunction and its significance envelope.
7. (Optional) Once the computation is completed, select the Visualize button to examine the results of your K-function estimation.
4.1.2
Input
The Distances CSV File field accepts a CSV file containing (Source ID, Destination ID, Distance) rows as generated by the distance tool. If this file was
not pre-generated, the distance tool can be launched directly by selecting the
icon to the right of the Input panel. If the general K-function is estimated, this
file should contain distances between all the points in a single point set. If the
cross K-function is estimated, this file should contain distances between every
pair of points in a pair of point sets.
4.1.3
Area/Network
The Total Area or Network Length field is optional and accepts a number
that represents the total area of the boundary of a point set or the total length of
network where a point set is observed. If your input CSV file contains Euclidean
distances, then you need to enter the total area of a polygon boundary of your
point set. If your input CSV file contains network distances, you need to enter
the total length of your base network.
The Area or Network Shapefile field accepts a shapefile of polygons or
arcs (i.e., polylines). When this field is set, the value for the Total Area or
Network Length is automatically computed. The Area or Edge Length
field specifies the field in the DBF file that includes the area of each polygon
in the boundary file or the length of each edge in the network file. When this
field is specified, the K-function tool reads and sums the values in the specified
data field to determine the total area of the boundary or the total length of the
network.
11
4.1.4
K Function Type
The K-function tool can estimate the K-function for a single point set or for
a pair of two point sets. The latter is called “Cross K-Function.” If your
input CSV file contains distances for a single point set, you need to select
the “K-Function.” If your input CSV file contains distances for every pair of
points in two point sets, you need to select the “Cross K-Function” and specify
the shapefile containing your destination points for the Destination Points
Shapefile field.
4.1.5
Envelope
The K-function tool can calculate a statistical significance envelope for the estimated K-function. More information on planar and network K-function can
be found in Waller and Gotway [8] and Okabe et al. [5]. The Compute Envelope field specifies if the envelope will be computed. The Simulations field
specifies the number of simulations. The Envelope field specifies the range of
the envelope to be estimated. A caveat is that it may take a substantial amount
of time to compute a statistical significance envelope for larger datasets.
4.1.6
Distance
Given an input distance t, K-functions provide a value indicating the density of
points found within the distance t of each point. Minimum, Maximum and
Resolution specify how the values for t need to be computed. They should be
positive numbers with the minimum distance less than the maximum distance.
The Distance Stats tool at the top of the Distance panel computes summary
statistics (minimum, 1st quartile, median, 3rd quartile, and maximum) of distance values based on the input CSV file.
4.1.7
Output
The K or Cross K-Function field specifies the file to which the estimated
K-function values will be written. The file is a CSV file of (distance, K-function
value) rows (Figure 9).
Figure 9: Output CSV File of (distance, K-function value) rows
12
The Envelope field specifies the file to which the computed values for the
statistical envelope will be written. The file is a CSV file of (distance, K-function
value at lower envelope, K-function value at upper envelope) rows (Figure 10).
Figure 10: Output CSV File of (distance, K-function value at lower envelope,
K-function value at upper envelop) rows
4.2
K-Functions Visualizer
This tool (Figure 11) visualizes the estimated K-function and its statistical
significance envelope as a line chart. The X-axis of this chart represents the distances at which K-functions were estimated. The Y-axis of the chart represents
the observed and simulation-based estimates of the K-function. Three lines will
be drawn on the chart: a red line for the observed K-function and two blues
lines for upper and lower envelopes. This tool can be directly launched from the
K-functions tool (in this case the input fields for this tool will be automatically
set).
4.2.1
Workflow
1. In the Input panel, specify the CSV files for the estimated K-function
and its statistical envelope.
2. In the Actions panel, click the Plot button.
3. The plot will be drawn on the View panel.
4.2.2
Input
The Data CSV File field accepts a CSV file containing (distance, K-function
value) rows as generated by the K-Functions tool. The Reference CSV File
field accepts a CSV file containing (distance, K-function value at lower envelope,
K-function value at upper envelope) rows as generated by the K-Functions tool.
13
Figure 11: The K-Functions Visualizer tool
14
5
Local Statistics Tools
These tools estimate density surfaces of points or local statistics of spatial autocorrelation on a 2D plane or undirected network.
5.1
Kernel Density
This tool estimates planar or network Kernel density for a given point set. More
information on planar and network Kernel density estimation can be found in
Waller and Gotway [8] and Okabe et al. [4].
5.1.1
Workflow
1. In the Events Input panel, specify a shapefile that contains the locations
of events, i.e., points.
2. In the Network Kernel/Planar Kernel panel, choose a method for
Kernel density estimation by selecting one of the two tabs.
3. In the selected tab, specify parameters such as the input network, Kernel
function, bandwidth, and output file.
4. Click on the Compute button to start the density estimation.
5. (Optional) Once the computation is completed, click the Visualize button
to examine the results of the density estimation.
5.1.2
Events Input
The Event Shapefile field accepts a shapefile of events, i.e., points.
5.1.3
Network Kernel
The Input Network field accepts a shapefile of arcs (i.e., polylines). It is
assumed that edges in this input network are split into a set of small-length segments. The length of each segment is equivalent to the cell size in planar Kernel
density estimation. If the input network is not segmented, the Dissolve/Split
Network utility tool can be used to segment the network. This utility tool can
be launched directly by selecting the icon to the right of the Input Network
field. The Edge Length field specifies the field in the DBF file that will be
used for the length of network edges.
The Kernel Function field specifies the type of Kernel function. GeoDaNet
currently supports triangular, uniform, quadratic, quartic, and Gaussian Kernel
functions. For more information on these functions, refer to Waller and Gotway
[8].
The Bandwidth field specifies the size of the Kernel. Events within this
Kernel are used to estimate densities. The find tool to the right of this field
15
Figure 12: The Kernel Density tool: Network Kernel Density Estimation
applies Silverman’s solution [7] to find an optimal size of Kernel for a given
events set.
The Network Output field specifies an output shapefile for the new network with Kernel densities.
5.1.4
Planar Kernel
As in the case of the network Kernel, the Kernel Function field specifies the
type of Kernel function.
The Extent File field accepts a shapefile with an extent that corresponds
to the area where Kernel densities are estimated.
The Cell Size field specifies the interval of the grid that will be imposed on
the study area for density estimation. The default value for this field is obtained
by dividing the length of the shorter side of the bounding box of the extent file
by 150.
The Bandwidth field specifies the size of the Kernel. As in the case of the
network Kernel, the find tool to the right of this field specifies a default value
for the bandwidth using Silverman’s solution.
The Extent Buffer field is optional and can be set if you want to add an
offset to the extent.
The Planar Output field specifies an ASCII file to which a raster grid with
Kernel densities will be written. The file extension of this ASCII file is .asc.
16
Figure 13: The Kernel Density tool: Planar Kernel Density Estimation
5.2
Network Kernel Visualizer
This tool visualizes the results of network Kernel density estimation. It can be
directly launched from the Kernel Density tool (in this case its input field will
be automatically populated).
5.2.1
Workflow
1. In the Input panel, specify a shapefile containing the results of the network Kernel density estimation. Next, choose the field containing the
estimated densities.
2. In the Actions panel, click the Visualize button.
3. A network will be drawn in the View panel where the color of each edge
represents the estimated Kernel density.
5.2.2
Input
The Network Shapefile field accepts a shapefile that contains the results of the
network Kernel density estimation. This file should include arcs (i.e., polylines).
The Density Value field specifies the field of a DBF file that contains Kernel
densities. The default value for this field is VALUE.
17
Figure 14: The Network Kernel Density Visualizer tool
5.3
Planar Kernel Visualizer
This tool visualizes the results of the planar Kernel density estimation. It can
be directly launched from the Kernel Density tool (in this case its input field
will be automatically populated).
5.3.1
Workflow
1. In the Input panel, specify an ASCII file that contains the results of the
planar Kernel density estimation.
2. In the Actions panel, click the Visualize button.
3. The 2D density surface will be drawn in the View panel.
18
Figure 15: The Planar Kernel Density Visualizer tool
5.3.2
Input
The Planar Kernel Output field accepts an ASCII file generated by the
Kernel Density tool as input for the Planar Kernel Density Visualizer.
5.4
Local K-Function
This tool estimates local K-functions for a given point set. The network local
k-function developed by [9] is based on the planar local k-function developed by
[2] and the representative location approach utilized by [6] in their Geographical Analysis Machine (GAM) analyses. The statistic computes the number
of observations within a pre-specified network distance h of a reference point
and is considered a departure from its planar counterpart because it examines
clustering around reference points and not event locations [9].
As discussed in [9], a local K-function can be used to determine whether
19
points in a data set are clustered at a given location on the network. For the
convenience of computation and easy of interpretation of the results, GeoDaNet
estimates local K-functions at network nodes. It is thus recommended for you
to split the edges in the input network by a regular interval before estimating
local K-functions.
Figure 16: The Local K-Function tool
5.4.1
Workflow
1. In the Input panel, specify two Shapefiles: one for the input network and
another for events (points).
2. In the Cluster Scale panel, specify the minimum and maximum value
for the search radius, along with the distance interval (Resolution).
Given your specification, a set of search radii will be created, and local
K-functions are estimated for each radius.
3. In the Simulation panel, specify the number of simulations and the significance level.
20
4. In the Output panel, specify the name of a shapefile that will contain the
results of the local K-function estimation. This file will include a set of
points with the local K-function estimates.
5. Click on the Compute button to start the estimation.
6. (Optional) Once the computation is completed, click the Visualize button
to examine the results of the local K-function estimation.
5.4.2
Input
The Network Shapefile field accepts a shapefile that contains a network, a
set of arcs or polylines. In case the input network needs to be cleaned and split,
the Dissolve/Split Network utility tool can be launched directly by selecting
the icon to the right of the Network Shapefile field.
The Edge Length field specifies the field of the DBF file that contains the
pre-computed lengths of network edges.
The Event Shapefile field specifies a shapefile that contains a set of events.
5.4.3
Cluster Scale
The Stats tool computes a set of summary statistics of network distances between nodes and events to help users select values for the other fields in this
panel. 20% of nodes and events are randomly selected to compute these statistics.
The Minimum Distance and Maximum Distance fields accept a numeric value that represents the minimum and maximum search radius for local
K-function estimation, respectively.
The Resolution field accepts a numeric value where the search radius increases from the minimum to the maximum distance.
5.4.4
Simulation
The Simulations field accepts an integer that represents the number of simulations. The statistical significance of local K-functions is determined through
simulations. When the number of points in a given point set is smaller than the
number of network nodes, the latter is randomly selected during the simulations.
Otherwise, network-constrained random point patterns are simulated.
The Significance Level field specifies the level of statistical significance. A
caveat is that it may take a substantial amount of time to estimate p-values for
local K-function estimates through simulations.
5.4.5
Output
The Output Shapefile field accepts the name of a shapefile that will contain
a set of points for which local K-functions are estimated. Each point in the
output shapefile will have 2*h data fields where h is the number of search radii.
For each search radius r, the output file stores two attributes: the number of
21
Figure 17: The Output Table from Local K-Function Estimation
events that are within r from the estimation point and the type of cluster for
the estimation point. The name of the first attribute starts with “OBS”, while
the second attribute with “CLS”. Three types of clusters are defined: dispersion
(-1), insignificant (0), and cluster (1). Figure 17 shows the table of the output
shapefile.
5.5
Local K-Function Visualizer
This tool visualizes the results of the local K-function estimation. The locations
for which local K-functions are estimated are represented as circles with different colors. White circles represent locations where the local K-function was
statistically insignificant. Blue circles represent locations around which events
are dispersed along the network. Red circles represent locations around which
22
events are clustered along the network. This tool can be launched directly from
the Local K-Function tool (in this case the input fields for this tool will be
populated automatically).
5.5.1
Workflow
1. In the Input panel, specify two shapefiles: one for the input network and
another for the results of the local K-function estimation. Then, specify a
value for the Cluster field by selecting a field of the DBF file that records
the type of clusters at a given search radius.
2. In the Actions panel, click the Visualize button.
3. A map will be drawn in the View panel.
4. (Optional) Change the value for the Cluster and click the Visualize
button to examine the estimation results at different search radii.
5.5.2
Input
The Network Shapefile field accepts a shapefile that contains the input network.
The Analysis Output Shapefile field accepts a shapefile that contains the
results of the local K-function estimation.
The Cluster field specifies the field of the output shapefile that contains
the type of cluster at a given search radius. The value for this field should start
with “CLS”.
5.6
Local Indicators of Network-Constrained Clusters
This tool estimates local indicators of network-constrained clusters (LINCs)
such as network-based local Moran’s I and Getis-Ord’s G(*). As discussed in
[10], LINCs can be used to determine if an attribute measured at each network edge shows statistically significant spatial autocorrelation compared to
the neighboring edges.
The network version of the local Moran or Getis-Ord G is an extension of the
LINCS (local indicators of network-constrained clusters) framework developed
in [9].2 The computation of this statistic is much the same as for its planar
counterpart. However, an important difference is the incorporation of a networkbased weights matrix in the calculation of the statistic. This weights matrix,
in its simplest form, reflects the connectivity between two links or streets on
the network, where a 1 represents that two links (i and j) share a node [10]. A
more complex version of a network weights matrix might compute the network
distance between the midpoints of two links on a network [10], as designated by
the shortest path distance between the midpoints. Like its planar counterpart,
2 Please refer to [1] for a more thorough discussion of local indicators of spatial association
on a planar space.
23
Figure 18: The Local K-Function Visualizer tool
24
the network local Moran or Getis-Ord G uncovers local “pockets” of spatial
dependence where nearby network links tend to have more similar or dissimilar
attribute values than do distant network links [3].
Since the input network is the study area, the neighborhood of each edge is
defined in two ways: node-based and distance-based. In the node-based method,
two edges are neighbors if they share a node. In the distance-based method, two
edges are neighbors if their midpoints are within a threshold network distance.
The tool for estimating LINCs assumes all edges in the input network have
at least two numerical attributes: one for an event variable that contains the
number of events observed at each edge and another for a base variable that corresponds to population at risk or statistical support (e.g., edge length). Therefore, if you have a shapefile for a set of event points but need to count the
number of events on each network edge, it is recommended to first count the
number of events and assign them as an attribute of network edges. When you
have an attribute of network edges for which LINCs needs to be estimated, you
can use the LINCs tool without specifying a base variable.
5.6.1
Workflow
1. In the Input panel, specify a shapefile that contains the input network.
After loading the network shapefile, select an event variable and a base
variable.
2. In the Statistics panel, select a type of local statistic.
3. In the Spatial Weights panel, specify how spatial neighbors should be
defined.
4. In the Simulation panel, specify the method and the number of simulations. Statistical significance of LINCs is determined through simulations.
5. In the Output panel, specify the names for an output shapefile and an
output weights file.
6. Select the Compute button to start the estimation.
7. (Optional) Once the computation is completed, click the Visualize button
to examine the results of the LINCs estimation.
5.6.2
Input
The Network Shapefile field accepts a shapefile that contains a network, i.e.
a set of arcs or polylines. In the case where the edges in the input network
need to be split into smaller segments, the Dissolve/Split Network tool can
be launched directly by clicking the middle button on the right side of the
Network Shapefile field. In case the number of event points and base points
on each network edge need to be counted, launch the Count tool at the right end
of the Network Shapefile field. Since GeoDaNet internally reads all vertices
25
Figure 19: The Local K-Function tool
of an arc (or a polyline) and creates network edges from segments linking two
vertices, you need to ensure that all arcs in your input network only have two
endpoints. Otherwise, the linkage between an edge and its attributes will be
lost.
The Edge Length field specifies the field of the DBF file that contains
pre-computed lengths of network edges.
The Event Variable field specifies the field of the DBF file that contains
the number of events on network edges or an attribute for which LINCs need
to be estimated.
The Base Variable field specifies the field of the DBF file that contains
the number of base points on network edges or an attribute that can serve as
statistical support (e.g., edge length). This field can be skipped when the value
26
for the Event Variable field is not the number of events.
5.6.3
Statistics
In this panel, one of the three types of local statistics should be specified. Three
options are available: Moran’s I, Getis-Ord’s G, and Getis-Ord’s G*.
5.6.4
Spatial Weights
The Neighbor Definition field specifies the method for defining neighbors of
each network edge. The node-based method defines two edges as neighbors if
they share a node. The distance-based method defines two edges as neighbors if
the network distance between their midpoints is smaller than the value for the
Threshold Distance field. For Moran’s I, both methods are allowed, while
only the distance-based method is allowed for Getis-Ord’s G and G*.
The Threshold Distance field accepts a number that represents the range
within which edges are considered to be neighbors. The tool to the right of this
field can facilitate the choice of value for the field by showing summary statistics
of network distances between randomly selected nodes.
5.6.5
Simulation
The Simulation Method field specifies the simulation method used to determine statistical significance of the estimated LINCs. If a base variable is
unspecified, only conditional permutation is allowed. Otherwise, three more
options are available, such as multinomial, binomial, and poisson simulation.
The Simulation Number field specifies how many times the simulation
needs to be conducted.
5.6.6
Output
The Output Shapefile field accepts the name of a shapefile that will contain
a set of arcs or polylines for which local indicators of spatial autocorrelation are
estimated. Each arc (polyline) in the output shapefile will have six attributes:
ID, EVENT, BASE, MORAN (G or G STAR), CLUSTER (Z), and P SIM.
The ID attribute contains a set of integers unique to each arc. The EVENT
and BASE attributes record the data values for the event and base variables.
When the base variable was unspecified, the data value for the BASE attribute
is set to 1. The estimated local statistics are stored in the MORAN (G or
G STAR) column. The CLUSTER attribute records the cluster type if local
Moran’s Is are estimated: 1 for high-high, 2 for low-high, 3 for low-low, and
4 for high-low clusters. When Getis and Ord’s G or G* are estimated, the Z
attribute will be in place of the CLUSTER attribute. The Z attribute records
the standardized version of the raw G (G*) estimates. The P SIM attribute
stores pseudo p-values for the estimated local statistics.
The Output Weights File field accepts the name for an output weights
file.
27
5.7
LINCs Visualizer
This tool visualizes the results of the LINCs estimation. When the local statistic
is Moran’s I, the cluster type of statistically significant edges is represented by
different colors. Following the convention in OpenGeoDa, insignificant edges
are colored gray, high-high clusters red, low-high clusters cyan, low-low clusters
blue, and high-low clusters pink. When the local statistic is G or G*, edges
where the Z score is greater than 1.96 are viewed as statistically significant
clusters of high values and colored red. On the other hand, edges where the
Z score is lower than -1.96 are viewed as statistically significant clusters of low
values and colored blue. Edges where the Z score is between 1.96 and -1.96 are
statistically insignificant and colored gray. This visualizer tool can be launched
directly from the LINCs tool (in this case the input fields for this tool will be
populated automatically).
5.7.1
Workflow
1. In the Input panel, specify a shapefile that contains the results of the
LINCs estimation. Next, specify which type of LINC was estimated, the
name of the field that contains cluster types or Z scores, and the name
of the field that contains the statistical significance of the estimated local
statistics.
2. In the Significance Filter panel, choose a value for the Significance
Level field.
3. In the Actions panel, select the Visualize button.
4. A map will be drawn in the View panel.
5. (Optional) Change the value for the Significance Level and select the
Visualize button to examine the estimation results at different significance levels.
5.7.2
Input
The Network Shapefile field accepts a shapefile that contains the results of
the LINCs estimation.
The LISA Type field specifies the type of local statistic included in the
input network file. Three options are available: Moran’s I, G, and G*.
The LISA or Cluster field specifies the name of the field that records
cluster types or Z scores. The default value is CLUSTER for Moran’s I and Z
for G and G*.
The P-value field specifies the name of the field that contains pseudo pvalues. The default value is P SIM.
28
Figure 20: The LINCs Visualizer tool
29
5.7.3
Significance Filter
The Significance Level field specifies a value for the statistical significance
level. When P SIM is smaller than this field, network edges are considered
statistically significant.
30
6
Utility Tools
These tools are used for two purposes: to specify the number of CPU cores that
will be used by GeoDaNet and to pre-process input network data. All utility
tools can be accessed from the menubar, but some of them can be directly
launched from statistics tools.
6.1
Multiprocessing Options
This tool specifies the number of CPU cores that will be used by GeoDaNet.
At present, GeoDaNet supports multi-core processing only on Mac operating
systems. Thus, the setup for this tool is valid only on Mac systems.
The following tools in GeoDaNet make use of multiple CPU cores:
• The distance tool uses multi-core processing when computing distances.
• The access tool uses multi-core processing when computing accessibility
measures.
• The K-Functions tool uses multi-core processing when estimating K-Functions
and obtaining the statistical significance envelope for the estimated KFunctions.
• The Local K-Function tool uses multi-core processing when carrying out
simulations to obtain pseudo p-values for the estimated local K-Functions.
• The Kernel Density Estimation tools use multi-core processing when estimating the density surface.
• The Dissolve/Split Network tool uses multi-core processing at multiple
stages of processing such as dissolving, finding intersections, and summarizing statistics of the lengths of network edges.
Figure 21: The Multiprocessing Options tool.
6.1.1
Preferences
The CPU cores used field specifies the number of CPU cores that GeoDaNet
is allowed to use.
31
6.2
Maximally Connected Component
Network-constrained spatial statistics assume that the input network is connected. However, often input files do not contain clean, fully-connected networks. This tool allows you to extract the maximally connected network from
your input file.
Figure 22: The Maximally Connected Component tool.
6.2.1
Input
The Network Shapefile field accepts an Shapefile that contains your input
network.
6.2.2
Output
The Output Shapefile field accepts the name of a shapefile that will contain
one connected network. The output shapefile will lose all attributes in the input
network shapefile. However, it will contain the identification number and length
of edges in the output network.
6.3
Dissolve/Split Network
This tool helps to clean and split your input network. Arcs or polylines contained in a shapefile may represent overpasses but all statistics tools in GeoDaNet assume the input network is planar. In addition, network-constrained
local statistics often need an input network that contains edges of a small regular
length. To help users prepare an input network that satisfies these assumptions
of network-constrained spatial statistics, this tool provides multiple options for
network segmentation.
32
Figure 23: The Dissolve/Split Network tool.
6.3.1
Input
The Network Shapefile field accepts a shapefile that contains your input
network.
6.3.2
Dissolve
The Dissolve/Split Network tool divides each arc (polyline) into multiple
smaller ones. How an arc is defined in the original network affects the results of
network segmentation. If you want to make sure that each arc in the original
network represents a road with a common ID or name, you can enable the Dissolve option and select an attribute for which arcs are combined. For example,
in Figure 23 edges in the input network will first be dissolved by the values of
the “NAME” field and will then be divided.
33
6.3.3
Split
The Find intersections option specifies if edges that intersect each other must
be forced to be split at the intersection points. By specifying this option, you can
make sure that the output network is planar, i.e. does not contain overpasses.
Four options are available for network segmentation: No split, Split at
all vertices, Split into an equal number of segments, and Split into
equal-length segments.
• The No split option means arcs in the input network will not be divided
unless the Find intersections option is chosen.
• The Split at all vertices option means an arc will be split at all vertices
on the arc.
• The Split into an equal number of segements option means all arcs
will be split into n segments irrespective of their lengths. The number of
segments n can be specified in the # of Segments field.
• The Split into equal-length segments option means each arc will be
split into segments of an equal length. The length for segmentation can
be defined in the Length field. The Find tool at the end of this field
provides you with summary statistics of edge lengths to aid the choose of
a value for this field.
6.3.4
Output
The Output Shapefile field accepts the name of a shapefile to which the results
of network segmentation will be written. If the Dissolve option is chosen, the
edges in the output network will have two attributes: ID and the value of the
attribute used for the dissolve operation. Otherwise, the edges in the output
network will carry all attributes of their parent edges in the input network.
6.4
Count
This tool counts the number of points near network edges and assigns the resulting value as new attributes of the edges. For this processing, points in the
input files are snapped to nearby locations on the input network.
6.4.1
Input
The Network Shapefile field accepts a shapefile that contains your input
network.
The Event Points Shapefile field accepts a shapefile that contains a set
of event points.
The Base Points Shapefile field is optional and accepts a shapefile that
contains a set of base points.
34
Figure 24: The Count tool.
6.4.2
Output
The Output Shapefile field accepts the name of a shapefile that will contain
the results of the point counting. This file will include a new network where each
edge has four attributes: ID, length (LEN), the number of events (EVENT),
and the number of base points (BASE). When no value is specified for the Base
Points Shapefile field, the output shapefile will not contain the BASE data
field.
7
Acknowledgments
This project was supported by Award No. 2009-SQ-B9-K101 awarded by the
National Institute of Justice, Office of Justice Programs, U.S. Department of
Justice. The opinions, findings, and conclusions or recommendations expressed
in this publication are those of the author(s) and do not necessarily reflect those
of the Department of Justice. We are grateful to Serge Rey, Elizabeth Mack,
Charles Schmidt and Julia Koschinsky at the GeoDa Center for Geospatial
Analysis and Computation for valuable contributions to GeoDaNet.
35
References
[1] L. Anselin. Local indicators of spatial association-LISA. Geographical Analysis, 27(2):93–115, 1995.
[2] A. Getis and J. Franklin. Second-order neighborhood analysis of mapped
point patterns. Ecology, 68(3):473–477, 1987.
[3] A. Getis and J.K. Ord. The analysis of spatial association by use of distance
statistics. Perspectives on Spatial Data Analysis, pages 127–145, 2010.
[4] A. Okabe, T. Satoh, and K. Sugihara. A kernel density estimation method
for networks, its computational method and a GIS-based tool. International
Journal of Geographical Information Science, 23(1):7–32, 2009.
[5] A. Okabe and I. Yamada. The k-function method on a network and its
computational implementation in a GIS. Geographical Analysis, 33(3):271–
290, 2001.
[6] S. Openshaw, M. Charlton, C. Wymer, and A. Craft. A mark 1 geographical analysis machine for the automated analysis of point data sets.
International Journal of Geographical Information Science, 1(4):335–358,
1987.
[7] B. W. Silverman. Density estimation for statistics and data analysis.
Champman and Hall Ltd., New York, 1986.
[8] L. A. Waller and C. A. Gotway. Applied spatial statistics for public health
data. Wiley, Hoboken, New Jersey, 2004.
[9] I. Yamada and J.C. Thill. Local indicators of network-constrained clusters
in spatial point patterns. Geographical Analysis, 39(3):268–292, 2007.
[10] I. Yamada and J.C. Thill. Local indicators of network-constrained clusters
in spatial patterns represented by a link attribute. Annals of the Association
of American Geographers, 99999(1):1–1, 2010.
36