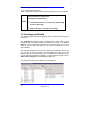
1
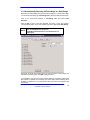
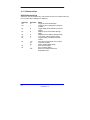
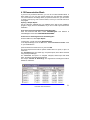
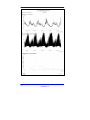
4.8.3 RR Histogram –is a ‘bar chart’ recording the number of RR intervals
within a range. The ‘width’ of each bar in the histogram is 50 milliseconds.
The histogram is drawn with a logarithmic vertical scale, as standard. This makes
it easier to see low and high values on the same axis. You can change to a linear
scale, by clicking the Log
button at the top right of the graph.
When you click on a ‘bar’ in the histogram, the ECG display shows you:
–
–
the longest RR interval in the ‘bar’ if you are to the right of the median
the shortest RR interval in the ‘bar’, if you are to the left of the median
The rightmost bar contains all intervals of 5 seconds or longer.
The interval range and the number of intervals in the ‘bar’, and the current
interval, are displayed at the top of the histogram.
button, or press the ^
To see the next longest interval, click the ‘Right Arrow’
up or > right keyboard arrow. To jump to the next bar, hold down the Control key
on the keyboard at the same time.
To see the next shortest RR, click the Left Arrow
button, or press the v down
or <-left keyboard arrow. To jump to the next bar, hold down the Control key on
the keyboard at the same time.
To go back to the last RR you viewed, click the Back
button or press Control
and Z on the keyboard.
By selecting a region of the histogram, you can restrict the analysis to a certain
day, by selecting Analyse from the pop-up menu. The graph results are restricted
to only the day you specify. You can subsequently return the selection to the
Entire Recording.
4.8.4 Adjusting the Graph Display
The standard display is a ‘split screen’, with ECG at the top, and a graph at the
bottom. You can switch between split screen and full screen ECG selecting Full
Screen ECG from the View option in the menu, or by clicking the Full Screen
ECG
button or the Split Screen ---0button on the toolbar.
34
18-0020 Rev. C