1
Land-Use and Transport
Integration in Scotland (LATIS)
TMfS:07 Developer’s Guide
Document for Transport Scotland
May 2011
Document Control
Project Title:
TMfS:07 Developer’s Guide
MVA Project Number:
C3491808
Document Type:
Report
Directory & File Name:
Document1
Document Approval
Primary Author:
Matthew Pollard
Other Author(s):
Reviewer(s):
Chris Robinson, Andrew Bagnall, Kevin Lumsden
Formatted by:
Matthew Pollard
Distribution
Issue
Date
Distribution
Comments
1
24/05/2011
A Bagnall
Internal Review
2
31/05/2011
K Lumsden
Final Review
3
31/05/2011
Transport Scotland
Release Version
This report, and information or advice which it contains, is provided by MVA Consultancy Ltd solely for internal use and reliance by its Client in performance of
MVA Consultancy Ltd’s duties and liabilities under its contract with the Client. Any advice, opinions, or recommendations within this report should be read and
relied upon only in the context of the report as a whole. The advice and opinions in this report are based upon the information made available to MVA
Consultancy Ltd at the date of this report and on current UK standards, codes, technology and construction practices as at the date of this report.
Following final delivery of this report to the Client, MVA Consultancy Ltd will have no further obligations or duty to advise the Client on any matters, including
development affecting the information or advice provided in this report. This report has been prepared by MVA Consultancy Ltd in their professional capacity
as Consultants. The contents of the report do not, in any way, purport to include any manner of legal advice or opinion. This report is prepared in accordance
with the terms and conditions of MVA Consultancy Ltd’s contract with the Client. Regard should be had to those terms and conditions when considering and/or
placing any reliance on this report. Should the Client wish to release this report to a Third Party for that party's reliance, MVA Consultancy Ltd may, at its
discretion, agree to such release provided that:
(a)
MVA Consultancy Ltd's written agreement is obtained prior to such release, and
(b)
by release of the report to the Third Party, that Third Party does not acquire any rights, contractual or otherwise, whatsoever against MVA
Consultancy Ltd and MVA Consultancy Ltd, accordingly, assume no duties, liabilities or obligations to that Third Party, and
(c)
MVA Consultancy Ltd accepts no responsibility for any loss or damage incurred by the Client or for any conflict of MVA Consultancy Ltd's interests
arising out of the Client's release of this report to the Third Party.
Contents
1
Introduction
1.1
2
Model Overview and Report Structure
2.1
2.1
Model Overview
2.1
2.2
Catalog Keys
2.2
2.3
Report Structure
2.2
3
Pre Run Set Up
3.1
4
Demand Model
4.1
4.1
Introduction
4.1
4.2
Mode and Destination Choice
4.1
4.3
HOV Modelling
4.3
4.4
P&R Site Choice
4.4
4.5
Creation of To-Home and Non-Home based trips (Reverse Factoring)
4.7
4.6
Creation of Assignment Matrices
4.10
5
Assignment Models
5.1
5.1
Highway Model
5.1
5.2
Public Transport Model
5.2
6
Generalised Costs and Convergence Stats
6.1
Generalised Costs
6.1
6.2
Convergence Stats
6.3
7
Post Run Analysis & Additional Modules
7.1
Introductions
7.1
7.2
Post Run Analysis – ENEVAL, ACCDNT and Network Stats
7.1
7.3
Additional Modules – Trip Frequency & Macro Time of Day
7.4
6.1
7.1
Figures
Figure 2.1 – Overall Model Layout ......................................................................... 2.2
Figure 3.1 – Pre Run Setup Layout 1...................................................................... 3.2
Figure 3.2 – Pre Run Setup Layout 2...................................................................... 3.2
Figure 3.3 – Average Generalised Cost Calculations ................................................. 3.3
Figure 4.1 – Demand Model Layout........................................................................ 4.1
Figure 4.10 – Non-Home Based Trip Creation Layout ..............................................4.11
Figure 4.11 – Creation of Assignment Matrices – Top Level......................................4.12
Figure 4.12 – Creation of Assignment Matrices – Level 2 .........................................4.12
TMfS:07 Developer’s Guide
1.1
1
Introduction
Figure 4.2 – Mode and Destination Choice Layout – Top Level................................... 4.3
Figure 4.3 – Mode and Destination Choice Layout .................................................... 4.3
Figure 4.4 – P&R Model – Top Level Layout............................................................. 4.7
Figure 4.5 – P&R Model – Level 2 Layout ................................................................ 4.7
Figure 4.6 – P&R Model – Site Choice Layout .......................................................... 4.8
Figure 4.7 – P&R Model – Create P&R Legs ............................................................. 4.8
Figure 4.8 Reverse Factoring Subgroup Layout.......................................................4.10
Figure 4.9 – To-Home Trip Creation Layout............................................................4.10
Figure 5.1 – Highway Model – Top Level................................................................. 5.1
Figure 5.2 – Highway Model – Period Level ............................................................. 5.2
Figure 5.3 – Public Transport Branch...................................................................... 5.3
Figure 5.4 – Run PT Model Subgroup ..................................................................... 5.3
Figure 5.5 – Prepare Factors File ........................................................................... 5.4
Figure 5.6 – Build PT Network from Highway Network .............................................. 5.4
Figure 5.7 – PT Model Assignment ......................................................................... 5.5
Figure 5.8 – Post Assignment Processing ................................................................ 5.5
Figure 6.1 – Calculate New Average Generalised Costs – Top Level............................ 6.2
Figure 6.2 – Calculate New Average Generalised Costs – Level 1 ............................... 6.2
Figure 6.3 – Calculate P&R Generalised Costs ......................................................... 6.3
Figure 6.4 – Convergence Statistics ....................................................................... 6.4
Figure 7.1 – Post Run Analysis – Top Level ............................................................. 7.1
Figure 7.2 – ENEVAL layout .................................................................................. 7.2
Figure 7.3 – Network Stats Layout......................................................................... 7.3
Figure 7.4 – ACCDNT Layout................................................................................. 7.4
Figure 7.5 – Trip Frequency .................................................................................. 7.5
Figure 7.6 – Trip Frequency Layout........................................................................ 7.5
Figure 7.7 – Macro Time of Day Branch Control ....................................................... 7.7
Figure 7.8 – Macro Time of Day Branch Layout........................................................ 7.8
Appendices
A - Cube Catalog Keys
TMfS:07 Developer’s Guide
1.2
1
Introduction
1.1
1.1.1
This Document
The purpose of this Developer’s User Manual is to familiarise a model developer with the
programming and structure of TMfS:07.
1.1.2
This document provides an overview of the TMfS:07 structure, key components and
highlights any unusual scripting or complex procedures.
This should assist further
development of the transport model in future. It is not intended to be a detailed description
of the TMfS:07 application, which is provided in the User Manual (MVA Consultancy,
May 2011).
1.1.3
It is assumed that the reader is familiar with both the principles and operation of the Cube
software suite and has a sound understanding of a Windows operating system.
It is also
expected that users have the requisite knowledge of transport and land-use modelling and,
in particular, transport model development using Cube and VOYAGER.
TMfS:07 Developer’s Guide
1.1
2
Model Overview and Report Structure
2.1
2.1.1
Model Overview
The Transport Model for Scotland (TMfS) is built in Cube Voyager software with a CUBE
Catalog to control the model application and allow multiple scenarios to be run and stored.
The main model consists of the following components
2.1.2
Pre Run Set-up;
Demand Model;
−
mode and destination choice;
−
high occupancy vehicle (HOV) modelling;
−
park and ride (P&R) site choice;
−
creation of To-Home and Non-Home based trips; and
−
creation of assignment matrices.
Highway Assignment;
Public Transport (PT) Assignment
Creation of Generalised Costs;
Trip Frequency Modelling;
Macro Time of Day Modelling (not fully operational);
Calculation and outputting of Convergence Stats;
Post-Run Analysis; and
File Deletion.
There are two loops in the model as follows:
The Inner Loop which iterates between Mode and Destination choice; and
The Outer Loop which iterates between the Demand Model (including mode and
destination choice, HOV modelling, P&R choice) and the Assignment Models (highway
and PT).
2.1.3
The Trip Frequency and Macro Time of Day models are optional extras and are run from the
Outer Loop only.
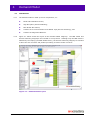
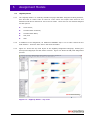
2.1.4
Figure 2.1 shows the overall structure of the model as described above and the outer loop –
represented by the red circle loop control and looping over the boxed subgroups.
TMfS:07 Developer’s Guide
2.1
2
Model Overview and Report Structure
Figure 2.1 – Overall Model Layout
2.2
2.2.1
Catalog Keys
As outlined above, TMfS:07 has been developed in CUBE Voyager software with a Cube
Catalog to control the application of the model. This includes the specification of a series of
keys that control the model files, parameters and variables.
Keys are divided into two
categories as follows:
Model Developer - keys that define the model parameters and typically, should not be
amended following model development; and
Model Applier - keys that control the application of the model and are available to
general users, examples include model run details, level of functionality, input files and
specification of outputs.
2.2.2
2.3
2.3.1
Appendix A lists the TMfS:07 catalog keys and provides a brief description of each.
Document Structure
The remainder of this document provides a description of each the model components listed
in the bullets above, giving details of the processes undertaken.
TMfS:07 Developer’s Guide
2.2
3
Model Preparation Procedures
3.1
3.1.1
Pre Run Set Up
Before the main model run is started there are a number of steps undertaken to prepare the
run. These are.
creation of output folders;
setting of no of processors and Cluster controls;
Setting of number of zones for stacked matrices (see Chapter 4 - Demand Model for
more info);
controls for GOTO points – depending on choice of catalog keys to allow “warm
starting” the model from key locations (PILOT programs located at the beginning of
each Warm Start point contain the code setting the location for the GOTO commands);
and
average generalised cost matrices for the demand model are created, including
calculating intrazonal values and adding parking charges.
3.1.2
TMfS:07 includes a custom-built program called “No of Processors” to determine the number
of cores available on the computer.
This determines how many processes can be run in
parallel using Citilabs Cluster software, up to a maximum of four.
There is a related
custom-built program called “Close Voyager” which closes the Cluster windows when the
model run is complete.
3.1.3
Figure 3.1 shows the PILOT steps which create the output folders and control the GOTO
points. The Cluster Set-up subgroup is shown in Figure 3.2 and contains the process that
determines the number of cores to use during the model run through the user program “No
of Processors”.
The contents of the remaining subgroup, titled Full Model, are shown in
Figure 2.1.
3.1.4
Figure 3.3 shows the process that calculates the average generalised costs for the demand
model.
TMfS:07 Developer’s Guide
3.1
3
Model Preparation Procedures
Figure 3.1 – Pre Run Setup Layout 1
Figure 3.2 – Pre Run Setup Layout 2
TMfS:07 Developer’s Guide
3.2
3
Model Preparation Procedures
Figure 3.3 – Average Generalised Cost Calculations
TMfS:07 Developer’s Guide
3.3
4
Demand Model
4.1
4.1.1
4.1.2
Introduction
The demand model is made up of five components, viz:
Mode and Destination Choice;
High Occupancy Vehicle Modelling;
Park & Ride Site Choice;
Creation of To-Home and Non-Home Based Trips (Reverse Factoring); and
Creation of Assignment Matrices.
Figure 4.1 below shows the layout of the Demand Model subgroup.
The P&R model and
Reverse Factoring subgroups are included in a loop control. Although only the P&R model is
affected by the looping (see P&R details below), the Reverse Factoring subgroup is included
to allow the use of Cluster and parallel processing to reduce model run-times.
Figure 4.1 – Demand Model Layout
TMfS:07 Developer’s Guide
4.1
4
Demand Model
4.2
Mode and Destination Choice
4.2.1
The Mode and Destination Choice model is run for the AM and IP time periods for three
purposes (work, employers business and other).
Within each purpose there are three
modes:
Car;
Public Transport (PT); and
Park & Ride (P&R).
and four car availability classes:
4.2.2
No Car Available (C0);
1 Car Available, 1 Adult Household (C11);
1 Car Available, 2+ Adult Household (C12); and
2+ Car Available (C2).
This results in 10 car availability and mode pairs (as Non-Car Available people are captive to
PT).
4.2.3
Each trip end file contains productions for each of these 10 classes, but only total attractions.
The destination choice model works by “stacking” the individual classes into one column of
productions and one of attractions.
It should be noted that the trip end model does not
explicitly include a P&R mode as P&R forecasts are not available in NTEM. It produces trip
end files for car and PT where P&R is included in PT. The demand model then derives P&R
trip ends for the initial loop using base year proportions that are held in the PRP files applied
to the PT trip ends.
4.2.4
For Home-based Work the FRATAR program is used to produce a doubly constrained matrix
by furnessing the trip ends to a cost-based deterrence function.
Home-based employers
business and other are singly constrained, so the trips are simply spread across the columns
using the deterrence function.
4.2.5
These matrices are then unstacked into the 10 user classes and used to calculate the
composite costs for the mode choice model.
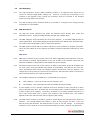
4.2.6
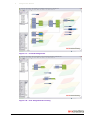
Figure 4.2 shows the layout of the Mode and Destination Choice top level subgroup showing
the AM and IP subgroups and the Cluster controls (red boxes).
Figure 4.3 shows the AM
demand model layout – which also shows the Inner Loop process.
TMfS:07 Developer’s Guide
4.2
4
Demand Model
Figure 4.2 – Mode and Destination Choice Layout – Top Level
Figure 4.3 – Mode and Destination Choice Layout
TMfS:07 Developer’s Guide
4.3
4
Demand Model
4.3
HOV Modelling
4.3.1
The High Occupancy Vehicle (HOV) Modelling module is an optional extra which can be
turned on using the appropriate catalog key.
However, currently the functionality is not
included in the Highway script, though the necessary steps are included in the demand
model and generalised cost modules.
4.3.2
Any HOV scripting will be described when it is included in a subgroup even though the full
functionality is not available.
4.4
4.4.1
P&R Site Choice
The P&R site choice subgroup sits within the demand model directly after mode and
destination choice. It splits the P&R demand amongst the available sites.
4.4.2
The P&R subgroup works separately for each travel purpose. It calculates P&R demand for
Home-Based Work, Home-Based Employers Business and Home-Based other simultaneously.
The model then outputs data by site for each travel purpose.
4.4.3
The P&R module outputs AM From-Home and PM To-Home matrices by purpose and mode.
These are then added in to the Highway and Public Transport assignment matrices for route
choice.
P&R Costs
4.4.4
P&R costs are based on the average cost via all sites weighted by the demand for each site.
This provides a detailed representation of the cost of P&R in the demand model and also
allows for feedback to the demand model if P&R site choice changes.
4.4.5
The basic premise of the site choice model is to apply a logit model across all available sites
for each ij pair using all available sites based on generalised costs derived for each site.
These generalised costs include the tangible aspects of P&R sites, such as capacity, user
charges and journey times by road and PT as well as an ‘attractiveness’ factor to account for
other elements that are not explicitly modelled.
4.4.6
4.4.7
The available capacity at each P&R site is represented by two figures
Near Capacity – this is the formal car park capacity; and
Far Capacity – this represents the limit of available off-street parking.
If a far capacity is set, a penalty is applied to the next iteration of ‘Att’ (see below) to deter
further demand at the site. It should only be used where there is observed data to on which
to base a value on far capacity. At present, such data is not readily available and hence no
site in the current base year or future year reference case scenarios has a far capacity
applied at this time which has the effect of ignoring the penalty.
4.4.8
The P&R model contains an iterative procedure which adjusts site attractiveness relative to
demand.
The concept behind this iteration is that as more people use P&R, a site may
become fuller and therefore the attractiveness of such a site will change.
A consequent
rebalance is then required in order to distribute demand to reflect expected user behaviour.
TMfS:07 Developer’s Guide
4.4
4
4.4.9
Demand Model
Pen is the penalty incurred for exceeding far capacity and is zero if this is not exceeded. If
far is coded as zero then no penalty can be incurred.
4.4.10
It should be noted that there is a damping mechanism in place within this equation where
the current Att is damped against the previous version. This is incorporated to encourage
stability in the iterative process in a similar way to the damping process within the overall
demand model.
4.4.11
The P&R process iterate until one of three conditions is met:
the maximum change in attractiveness factor Att at all sites falls below a limit on a set
number of consecutive iterations;
a maximum P&R loop is reached, which is currently set at 20 iterations of site choice;
or
4.4.12
the maximum change in demand at all sites falls below a threshold value.
These threshold values and maximum loop numbers are able to be set individually by the
user. Values have been calibrated which provide an appropriate balance of freedom and run
time to achieve an acceptable level of convergence and stable outputs.
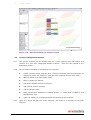
4.4.13
Figure 4.5 shows the top level of the P&R model subgroup. The MATRIX step in the top left
is used to calculate the number of sites in the input file. This is then used to control the loop
controls in the following steps.
4.4.14
Figure 4.6 shows the layout within a purpose specific subgroup, with the two subgroups
described in the following figures. Figure 4.7 shows the contents of the first subgroup which
calculates the site choice proportions.
Figure 4.8 shows the second subgroup where the
demand is split by site and converted to legs.
TMfS:07 Developer’s Guide
4.5
4
Demand Model
Figure 4.4 – P&R Model – Top Level Layout
Figure 4.5 – P&R Model – Level 2 Layout
TMfS:07 Developer’s Guide
4.6
4
Demand Model
Figure 4.6 – P&R Model – Site Choice Layout
Figure 4.7 – P&R Model – Create P&R Legs
TMfS:07 Developer’s Guide
4.7
4
Demand Model
4.5
Creation of To-Home and Non-Home based trips (Reverse Factoring)
4.5.1
The outputs from the Mode and Destination Choice model are From-Home matrices by period
(AM & IP) and purpose (work, employers business and other).
To-Home matrices are
created using a matrix of proportions of return journey times (i.e. a work trip in the AM peak
may have 5%, 15% and 80% chances of returning in the AM, IP and PM periods
respectively).
4.5.2
From-Home education trips are read in (these are not included in the full demand model)
and included in the To-Home process.
The To-Home matrices are then transposed to be
combined with the From-Home trips.
4.5.3
From-Home trips for the PM peak are created by factoring the IP matrices.
To-Home
matrices are then created in the same way as for the other periods.
4.5.4
Non-home based trips are created using the following process.
Trips ends are created from the From and To-Home matrices;
These are factored based on Non-Home based rates (in a similar process to the ToHome production); and
4.5.5
Furnessing of trip ends produces Non-Home based matrices.
If Macro Time of Day (MTOD) modelling is switched on then Pre-Peak matrices (MTOD allows
trips to move out of the AM peak to the pre-peak. See below for more details) are added to
the From-Home matrices so that To-Home and Non-Home based trips are created for this
demand.
4.5.6
IF HOV modelling is implemented then the Pre-Peak matrices are split using the AM peak
high occupancy proportions.
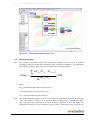
4.5.7
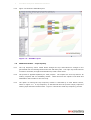
Figure 4.9 shows the layout of the Reverse Factoring subgroup. The To-Home calculations
are shown on the left-hand side, the process to create trip ends for the Non-Home based
demand is in the centre and the Non-Home Based calculations are shown on the right.
4.5.8
Figure 4.10 shows the layout of a To-Home subgroup. The programs on the left create the
To-Home trips.
The programs on the right calculate the Non-Home based trips ends
generated by the From and To-Home demand.
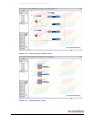
4.5.9
Figure 4.11 shows the layout of a Non-Home based subgroup. Here a deterrence function is
used to furness the input trip ends to produce Non-Home based demand.
TMfS:07 Developer’s Guide
4.8
4
Demand Model
Figure 4.8 - Reverse Factoring Subgroup Layout
Figure 4.9 – To-Home Trip Creation Layout
TMfS:07 Developer’s Guide
4.9
4
Demand Model
Figure 4.10 – Non-Home Based Trip Creation Layout
4.6
4.6.1
Creation of Assignment Matrices
This process combines all the demand from the reverse factoring and P&R models and
converts it to peak hour assignment demand matrices.
These are then passed to the
assignment models.
4.6.2
The processes undertaken in this subgroup are as follows.
Combine demand model purposes (work, employer’s business, other and education) to
assignment model user classes (in-work, non-work commute and non-work other);
P&R legs added to the appropriate matrix;
Factor to peak hour matrices;
Convert the highway demand to vehicles;
Add external-external demand;
Add long distance trips;
Apply Incremental Adjustment Factoring process (a combination of additive and
multiplicative); and
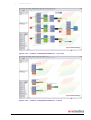
4.6.3
Apply trip damping by averaging between the last and current iterations.
Figure 4.12 shows the top level of this subgroup, with Figure 4.13 showing the AM peak
subgroup.
TMfS:07 Developer’s Guide
4.10
4
Demand Model
Figure 4.11 – Creation of Assignment Matrices – Top Level
Figure 4.12 – Creation of Assignment Matrices – Level 2
TMfS:07 Developer’s Guide
4.11
5
Assignment Models
5.1
5.1.1
Highway Model
The Highway Model is a relatively standard Voyager HIGHWAY assignment taking distance,
time and tolls to create costs of travel for route choice and output costs skims for the
demand model and a network for use in the PT model. There are five user classes assigned
for each period.
5.1.2
Car In-Work;
Car Non-Work Commute;
Car Non-Work Other;
LGV; and
HGV.
In addition to the assignment, an additional HIGHWAY step is run to skim costs from the
final iteration. These are then used in the Land Use Model.
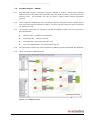
5.1.3
Figure 5.1 shows the top level layout of the Highway Assignment subgroup, showing the
three period subgroups and the Cluster controls. Figure 5.2 shows the AM peak assignment
process.
Figure 5.1 – Highway Model – Top Level
TMfS:07 Developer’s Guide
5.1
5
Assignment Models
Figure 5.2 – Highway Model – Period Level
5.2
5.2.1
Public Transport Model
When running the Public Transport Model there is the option to run it on every loop, or just
the first and last loops. If the PT assignment will not change much during the model run
then the assignment can be run only twice to save on run time. On the intermediate loops
the Generalised Costs are copied from the previous loop and renamed.
5.2.2
A Cube branch is used to control this process and is shown in Figure 5.3
5.2.3
Figure 5.4 shows the “Run PT Yes” subgroup. The PT model has four main processes
Prepare Factors file by adding VOT figures for current year;
Add PT links to output Highway network and calculate bus speeds form congested
highway speeds. Also create Non-Transit legs;
PT assignment – made up of five steps itself;
−
Route Enumeration (initial route choice and);
−
Route Evaluation (assignment)
−
Outputting of costs and calculating of intrazonals;
−
Combining of PT and Highway flow volumes in a single network; and
−
Output B&A data for rail nodes.
Post Assignment Processing – Combining period networks, outputting costs for the
Land Use Model and combining rail B&A data.
TMfS:07 Developer’s Guide
5.2
5
5.2.4
Assignment Models
Figures 5.5 to 5.8 show the layout of each of these steps.
Figure 5.3 – Public Transport Branch
Figure 5.4 – Run PT Model Subgroup
TMfS:07 Developer’s Guide
5.3
5
Assignment Models
Figure 5.5 – Prepare Factors File
Figure 5.6 – Build PT Network from Highway Network
TMfS:07 Developer’s Guide
5.4
5
Assignment Models
Figure 5.7 – PT Model Assignment
Figure 5.8 – Post Assignment Processing
TMfS:07 Developer’s Guide
5.5
6
Generalised Costs and Convergence Stats
6.1
6.1.1
Generalised Costs
This subgroup takes the generalised costs skims from the assignment matrices and converts
them into a format suitable for input to the next loop of the demand model. This is done in
three steps
Convert costs from user classes to purposes
−
In Work = Employers Business & Non-Home Based Employers Business;
−
Non-Work Commute = Work; and
−
Non-Work Other = Other & Non-Home Based Other.
Calculate Average Costs;
−
AM Average Costs = (AM + PMT) / 2 (parking charges added after calculating
P&R costs)
−
IP Average Costs = (IP + IPT) /2 + Parking Charges
Calculate P&R costs
−
Set all costs to 999999;
−
For each P&R site calculate the cost for each possible movement, based on the
origin and destination catchment areas.
This is made up of the highway cost
form the origin to the P&R site and the PT cost from the site to the destination;
−
Take the minimum of the current cost and the current minimum cost from the
previous loops; and
−
After looping over all sites parking charges are added to the AM car costs. Any
remaining 999999’s in the P&R costs are set to zero.
6.1.2
Figure 6.1 shows the top level layout. Figure 6.2 shows the conversion from user classes to
purposes. Figure 6.3 shows the P&R costs calculation layout.
TMfS:07 Developer’s Guide
6.1
6
Generalised Costs and Convergence Stats
Figure 6.1 – Calculate New Average Generalised Costs – Top Level
Figure 6.2 – Calculate New Average Generalised Costs – Level 1
TMfS:07 Developer’s Guide
6.2
6
Generalised Costs and Convergence Stats
Figure 6.3 – Calculate P&R Generalised Costs
6.2
6.2.1
Convergence Stats
The number of iterations required for convergence depends upon the level of demand
transferring between modes and is monitored using convergence statistics. The percentage
gap statistics produced after every outer loop using the following formula
∑ GC | Tr
=
∑ GC
nij
%Gapn
nij
− Tr( n −1)ij |
ij
nij Trnij
*100
ij
where
GCnij is the Generalised Costs from outer loop n;
Trnij is the Demand from outer loop n; and
Tr(n-1)ij is the Demand from outer loop n-1.
6.2.2
The current WebTAG guidance (Unit 3.10.4) is that the percentage gap should be less than
0.2%. The model is setup to run a pre-set number of loops set by a Catalog key, rather
than continuing until convergence has been achieved.
However, if once the model has
finished the desired level of convergence has not been reached then the model can be
TMfS:07 Developer’s Guide
6.3
6
Generalised Costs and Convergence Stats
started from the end of the last loop and run additional outer loops until convergence is
reached, by increasing the number of Outer Loops.
Figure 6.4 – Convergence Statistics
TMfS:07 Developer’s Guide
6.4
7
Post Run Analysis & Additional Modules
7.1
7.1.1
Introductions
This section gives details of additional/optional modules and post-run analysis modules
available. These are:
7.2
7.2.1
Post Run Analysis:
−
ENEVAL – environmental modelling;
−
Network Stats – vehicle kms and road travel times; and
−
ACCDNT – Accident analysis.
Additional Modules:
−
Trip Frequency; and
−
Macro Time of Day.
Post Run Analysis
Figure 7.1 shows the top level layout of the Post Run Analysis subgroup, showing the
ENEVAL, ACCDNT and Network Stats subgroups. The NETWORK step combines the output
networks from the three assignment periods to create one all period network for use in all
processes
Figure 7.1 – Post Run Analysis – Top Level Layout
TMfS:07 Developer’s Guide
7.1
7
Post Run Analysis & Additional Modules
7.3
Post Run Analysis – ENEVAL
7.3.1
Environmental analysis is undertaken using the ‘ENEVAL’ procedure. This process calculates
carbon emissions associated with road traffic (cars and goods vehicles) per link and at a local
authority level.
The procedure can also be used to output Carbon Dioxide Equivalent
(CO2(e)).
7.3.2
These outputs are displayed in tones (unless the ‘output in kilograms’ option is chosen by the
user) and reflect annual emissions of carbon. The user can also output the data in emissions
per kilometre format.
7.3.3
The following input files are required to operate the ENEVAL program and are all stored in
the Params folder:
Efficiency.dbf – car efficiency changes file;
EmissionsA.dbf – emission rates file;
Fleet Split.dbf – fleet composition file; and
Fuel ConsumptionA.dbf – fuel consumption rate file.
7.3.4
The information in these files reflects emissions modelling guidance associated with WebTAG.
7.3.5
Figure 7.2 shows the ENEVAL layout.
Figure 7.2 – ENEVAL layout
TMfS:07 Developer’s Guide
7.2
7
Post Run Analysis & Additional Modules
7.4
Post Run Analysis – Network Stats
7.4.1
This procedure calculates vehicle kilometres and road travel time for the five road user
classes, (In-Work, Non-Work Commute, Non-Work Other, LGV and HGV) by modelled link
and by local authority. This procedure is applied automatically following a demand or road
model run. It can also be run for a model already converged from the warm start menu.
7.4.2
Figure 7.3 shows the Network Stats layout.
Figure 7.3 – Network Stats Layout
7.5
7.5.1
Post Run Analysis – ACCDNT
The accident analysis procedure calculates the number and cost of road traffic casualties by
severity and road type. The procedure calculates accidents based on the number of vehicles
travelling on each link and the average accident rate associated with different types of road.
7.5.2
7.5.3
Casualty and accident rates associated with different road types are contained within:
“Casualty_Ratesv5.dbf”; and
“Accident_Ratesv8.dbf”.
These input files are located in the ‘Params’ folder.
The financial costs associated with
different severities of road accidents are located in the “Total_Costsv7.dbf” file, which is also
located in the ‘Params’ folder.
7.5.4
The model output files include accident statistics by link or by local authority for each time
period.
TMfS:07 Developer’s Guide
7.3
7
7.5.5
Post Run Analysis & Additional Modules
Figure 7.4 shows the ACCDNT layout.
Figure 7.4 – ACCDNT Layout
7.6
7.6.1
Additional Module – Trip Frequency
The Trip Frequency choice model allows changes the trip ends based on changes in the
generalised cost of travelling between the test and base years. The origin trip ends total can
increase or decrease, though the destination trip ends remain fixed.
7.6.2
The process is applied separately for each purpose. The outputs are new trip ends for all
modes, purposes and car availability classes. These then form the inputs to the Mode and
Destination choice model on the next loop.
7.6.3
The option of running the Trip Frequency module is controlled by a Cube branch control,
shown in Figure 7.5. If Trip Frequency is switched off then the process simply copies the
existing trips ends and renames them. Figure 7.6 shows the actual Trip Frequency process.
TMfS:07 Developer’s Guide
7.4
7
Post Run Analysis & Additional Modules
Figure 7.5 – Trip Frequency Branch Control
Figure 7.6 – Trip Frequency Layout
TMfS:07 Developer’s Guide
7.5
7
Post Run Analysis & Additional Modules
7.7
Additional Module – Macro Time of Day
7.7.1
Macro Time of Day (MTOD) choice relates to changing the time period of travel in response
to relative changes in the costs of travel between time periods.
Implementation
7.7.2
The implementation of MTOD has the following features:
it has been implemented before main mode choice in the model choice hierarchy,
which is consistent with guidance;
the logsum composite costs are used in the MTOD choice process. The implication of
this is that changes in relative road congestion between time periods will also influence
time period choice. The reason for this is that average tolls by time period cannot be
used alone for MTOD choice because it is possible that average toll paid per vehicle in
the inter peak could be larger than that for the morning peak even though the basic
toll rates are lower in the inter peak;
the scaling parameter will need to lie between 0.0 and 1.0 and preferably close to 1.0
in order to be consistent with guidance. The value initially input into the model is 0.8,
however, this may be refined when testing a live application;
it has been included in the demand model as an optional feature. It is recommended
that it is used only for model applications where there is the introduction of differential
charging for road use between time periods, which is also consistent with the
guidance;
it is implemented for the morning peak and the inter peak periods only since it applies
only to ‘From-Home’ trips, which are not modelled explicitly in the Evening Peak; and
the process generates a pre-peak matrix for the morning peak. The pre-peak matrix
creates ‘To-Home’ in the other time periods, using the Morning Peak reverse factors.
The process is done by journey purpose and at the person trip stage. The model is
applied separately for each row in the matrix.
7.7.3
The model is based on an incremental logit formulation. For the morning peak we have the
model formulae:
Ppre, Ppeak, Pinter are the base proportions in each time period. Note that we do not have Ppre
so an estimate is made and it is set to 0.2; and
P’pre, P’peak, P’inter are the forecast proportions in each time period.
TMfS:07 Developer’s Guide
7.6
7
Post Run Analysis & Additional Modules
Then the Macro Time of Day Choice is calculated as:
P' PEAK =
P' INTER =
(1 + A exp(β (U IP
1
− U PEAK ) + B exp( β (U PRE − U PEAK ))
(1 + A exp(β (U PEAK
1
− U INTER ) + B exp( β (U PRE − U INTER ))
P' PRE = 1 − PINTER − PPEAK
where : A = PIP / PPEAK , B = PPRE / PPEAK
and:
Pi’ are the new trip end productions for origin zone i by time period;
Pi are the original trip end productions for origin zone i by time period;
Ui are the composite logsum utilities for origin zone i by time period; and
β are the macro time of day choice parameters.
7.7.4
The base proportions of ‘From-Home’ trips in the Morning Peak and Inter-Peak were
calculated from model data at the ‘From-Home’ trip end level, along with the assumption
that Ppre=0.2.
7.7.5
Figures 7.7 and 7.8 show the Macro Time of Day layouts.
Figure 7.7 – Macro Time of Day Branch Control
TMfS:07 Developer’s Guide
7.7
7
Post Run Analysis & Additional Modules
Figure 7.8 – Macro Time of Day Branch Layout
TMfS:07 Developer’s Guide
7.8
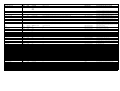
Appendix A – Cube Catalog Keys
Name of Key
Highway Link Types - Group 1
Highway Link Types - Group 2
Developer/
Applier
Developer
Developer
Type of Key
Edit Box
Edit Box
Allowed Values
List of integers
List of integers
Default Value
10-13,18,19,31,32,33
9,28
Relevant Section of Model
Highway Assignment
Highway Assignment
Public Transport Period
Applier
Radio Button
All
AM Only
IP Only
PM Only
All
Public Transport Assignment
Public Transport Matrix -AM
Applier
File Box
File Path and Name
{Catalog_Dir}\Runs\{Model Year}\{Run ID}\Output\{Growth}\PT\AM\PTAM_{Run ID}{Growth}{Model Year}{Demand Loop}.PTM
Public Transport Assignment
Public Transport Matrix -IP
Applier
File Box
File Path and Name
{Catalog_Dir}\Runs\{Model Year}\{Run ID}\Output\{Growth}\PT\IP\PTIP_{Run ID}{Growth}{Model Year}{Demand Loop}.PTM
Public Transport Assignment
Public Transport Matrix -PM
Applier
File Box
File Path and Name
{Catalog_Dir}\Runs\{Model Year}\{Run ID}\Output\{Growth}\PT\PM\PTPM_{Run ID}{Growth}{Model Year}{Demand Loop}.PTM
Public Transport Assignment
Lines File - Intra Urban Bus
Applier
File Box
File Path and Name
{Catalog_DIR}\Runs\{Model Year}\{Run ID}\Input\Lines\Intra_Urban_Bus_{Run ID}{Model Year}.LIN
Public Transport Assignment
Description
Used to exclude selected link classes from assignments
Used to exclude selected link classes from assignments
If "Public Transport Assignment Only" is selected in the "Model Choice" key
then this selects the time period(s) to run
Lines File - Inter Urban Bus
Applier
File Box
File Path and Name
{Catalog_DIR}\Runs\{Model Year}\{Run ID}\Input\Lines\Inter_Urban_Bus_{Run ID}{Model Year}.LIN
Public Transport Assignment
Lines File - Rail
Applier
File Box
File Path and Name
{Catalog_DIR}\Runs\{Model Year}\{Run ID}\Input\Lines\Rail_{Run ID}{Model Year}.LIN
Public Transport Assignment
Lines File - Ferry
Applier
File Box
File Path and Name
{Catalog_DIR}\Runs\{Model Year}\{Run ID}\Input\Lines\Ferry_{Run ID}{Model Year}.LIN
Public Transport Assignment
Lines File - Subway
Applier
File Box
File Path and Name
{Catalog_DIR}\Runs\{Model Year}\{Run ID}\Input\Lines\Subway_{Run ID}{Model Year}.LIN
Public Transport Assignment
Lines File - Tram
Applier
File Box
File Path and Name
{Catalog_Dir}\Runs\{Model Year}\{Run ID}\Input\Lines\Tram_{Run ID}{Model Year}.LIN
Public Transport Assignment
Run PT
Applier
Radio Button
First and Last Loops Only
Public Transport Assignment
Crowding
Developer
Radio Button
Yes
Public Transport Assignment
Switch to turn on/off the crowding model
Crowding Iterations
Bus_IVT_Factor
Developer
Edit Box
Edit Box
All Loops
First and Last Loops Only
Yes
No
Integer
Real
If running just a PT assignment this selects the AM matrix to use (if running
a full model run this key value is not used)
If running just a PT assignment this selects the IP matrix to use (if running a
full model run this key value is not used)
If running just a PT assignment this selects the PM matrix to use (if running
a full model run this key value is not used)
If running just a PT assignment this selects the Intra Urban Bus lines file to
use (if running a full model run this key value is not used)
If running just a PT assignment this selects the Inter Urban Bus lines file to
use (if running a full model run this key value is not used)
If running just a PT assignment this selects the Rail lines file to use (if
running a full model run this key value is not used)
If running just a PT assignment this selects the Ferry lines file to use (if
running a full model run this key value is not used)
If running just a PT assignment this selects the Subway lines file to use (if
running a full model run this key value is not used)
If running just a PT assignment this selects the Tram lines file to use (if
running a full model run this key value is not used)
Switch to select whether to run the PT model on every loop or on the first
and last loop only, saving time.
5
1.2
Public Transport Assignment
Public Transport Assignment
Delete Route Files
Applier
Radio Button
Yes
Public Transport Assignment
LAMBDAA
LAMBDAW
Sfactor
Developer
Developer
Developer
Edit Box
Edit Box
Edit Box
Yes
No
Real
Real
Real
Number of iterations in the crowding model
In-Vehicle time weight for buses
Option to delete PT route files - can be used for checking enumerated
routes after assignment, but can be large
0.2
0.2
1.25
Public Transport Assignment
Public Transport Assignment
Public Transport Assignment
Scaling factor for the Alternative Alighting model
Scaling factor for the Walk Choice model
Possible PT routes can be within 25% of the minimum cost route
Sconst
Developer
Edit Box
Real
5
Public Transport Assignment
Choicecut
M1_Ubus_IVT_Fac
M2_IUBus_IVT_Fac
Developer
Developer
Developer
Edit Box
Edit Box
Edit Box
Real
Real
Real
0.05
1.2
1.1
Public Transport Assignment
Public Transport Assignment
Public Transport Assignment
M1_Re_Fare_Fac
Developer
Edit Box
Real
0.85
Public Transport Assignment
M2_Re_Fare_Fac
Developer
Edit Box
Real
0.85
Public Transport Assignment
M3_Re_Fare_Fac
Board_Penalty
Wait Time Factor
Board_Penalty_IP
M1_Ubus_IVT_Fac_IP
M2_IUBus_IVT_Fac_IP
Perform PnR Only?
Developer
Developer
Developer
Developer
Developer
Developer
Developer
Edit Box
Edit Box
Edit Box
Edit Box
Edit Box
Edit Box
Radio Button
1
10
2
5
1.2
1
N
Public Transport Assignment
Public Transport Assignment
Public Transport Assignment
Public Transport Assignment
Public Transport Assignment
Public Transport Assignment
P&R Model
PnR Occupancy
PnR Lambda
Max Change in PnR Attraction Factor
Max Change in PnR Site Demand
Max PnR Loop
PnR Penalty
PnR_Grad
Applier
Developer
Applier
Applier
Applier
Applier
Developer
Edit Box
Edit Box
Edit Box
Edit Box
Edit Box
Edit Box
Edit Box
Real
Real
Real
Real
Real
Real
Y
N
Real
Real
Real
Real
Integer
Integer
Real
Possible PT routes can be within 5 minutes of the minimum cost route
Used to eliminate routes with low probabilities of use at Walk Choice or
Alternative Alighting points
In-Vehicle time weight for urban buses (mode 1)
In-Vehicle time weight for inter-urban buses (mode 2)
Urban Bus Fare Factor - used to reduce the cost of travel as a proxy for
fares in Route Enumeration
Inter Urban Bus Fare Factor - used to reduce the cost of travel as a proxy
for fares in Route Enumeration
Rail Fare Factor - used to reduce the cost of travel as a proxy for fares in
Route Enumeration
AM & PM Boarding Penalty
Factor applied to time spent waiting
IP Boarding Penalty
IP In-Vehicle time weight for urban buses (mode 1)
IP In-Vehicle time weight for inter-urban buses (mode 2)
1.2
0.04
1
1
20
30
0.15
P&R Model
P&R Model
P&R Model
P&R Model
P&R Model
P&R Model
P&R Model
PnR_Succ
Number of Link Types
Number of Local Authorities
Motorway DO factor
Urban DO Factor
Rural DO factor
Developer
Developer
Developer
Developer
Developer
Developer
Edit Box
Edit Box
Edit Box
Edit Box
Edit Box
Edit Box
Integer
Integer
Integer
Real
Real
Real
1
9
30
7.6
17.7
7.8
P&R Model
ACCDNT
ACCDNT, ENEVAL
ACCDNT
ACCDNT
ACCDNT
Zone Centroid Link Type
Exclude Local Authorities
Exclude Link Types
ENEVAL Annualisation Factor
Emissions Per KM
Emissions in KG (Default is Tonnes)
Developer
Applier
Applier
Developer
Applier
Applier
Edit Box
Edit Box
Edit Box
Edit Box
Check Box
Check Box
Integer
List of integers
List of integers
Real
Checked/Unchecked
Checked/Unchecked
22
99
22
8760
Unchecked (0)
Unchecked (0)
ACCDNT
ENEVAL
ENEVAL
ENEVAL
ENEVAL
ENEVAL
Delta_Number_of_Zones
DODELT_Flag
DODELT
Define New Sectoring for ENEVAL
Applier
Developer
Applier
Applier
Edit Box
File Box
File Box
Radio Button
Integer
File Path and Name
File Path and Name
Yes
No
6
C:\TMfS\TMfS07_V_2.0\Params\Test_DELTA_Flag.dbf
C:\TMfS\TMfS07_V_2.0\Params\Test_DELTA.dbf
No
ENEVAL
ENEVAL
ENEVAL
ENEVAL
P&R Occupancy value - used for all purposes
Sensitivity parameter for the logit curve in the P&R model
Threshold value for convergence in P&R looping procedure for Attr
Threshold value for convergence in P&R looping procedure for Demand
Maximum number of P&R loops on any demand loop
Penalty incurred should far capacity be exceeded
Gradient of attraction factor alteration
Number of successive converged loops required for P&R considered
completely converged.
Number of different links types in the network
Number of local authorities - used for outputting data by authority
Damage Only Accident Rates for Motorway Links
Damage Only Accident Rates for Urban Links
Damage Only Accident Rates for Rural Links
Link Type for zone centroids - used to exclude links from the ACCDNT
process
List of local authorities to exclude from the ENEVAL process
List of link types to exclude from the ENEVAL process
Annualisation figure used to calculate annual emissions totals
Emissions per km on links rather than total for the link
Emissions in kilograms rather than tonnes
Number of Sectors in output DELTA file (if Define New Sectoring for
ENEVAL = Yes)
Defines new sector for ENEVAL - currently in development
Create an output DELTA file
Is an output DELTA file required
MVA Consultancy provides advice on transport, to central, regional and local
government, agencies, developers, operators and financiers.
A diverse group of results-oriented people, we are part of a strong team of
professionals worldwide. Through client business planning, customer research
and strategy development we create solutions that work for real people in the
real world.
For more information visit www.mvaconsultancy.com
Abu Dhabi
Lyon
AS Business Centre, Suite 201, Al Ain Road, Umm al
11, rue de la République, 69001 Lyon, France
Nar, P.O. Box 129865, Abu Dhabi, UAE
T: +33 (0)4 72 10 29 29 F: +33 (0)4 72 10 29 28
T: +971 2 510 2402
F: +971 2 510 2403
Manchester
Birmingham
25th Floor, City Tower, Piccadilly Plaza
Second Floor, 37a Waterloo Street
Manchester M1 4BT United Kingdom
Birmingham B2 5TJ United Kingdom
T: +44 (0)161 236 0282 F: +44 (0)161 236 0095
T: +44 (0)121 233 7680 F: +44 (0)121 233 7681
Marseille
Dublin
76, rue de la République, 13002 Marseille, France
First Floor, 12/13 Exchange Place
T: +33 (0)4 91 37 35 15 F: +33 (0)4 91 91 90 14
Custom House Docks, IFSC, Dublin 1, Ireland
T: +353 (0)1 542 6000 F: +353 (0)1 542 6001
Paris
12-14, rue Jules César, 75012 Paris, France
Edinburgh
T: +33 (0)1 53 17 36 00 F: +33 (0)1 53 17 36 01
Second Floor, Prospect House, 5 Thistle Street,
Edinburgh EH2 1DF United Kingdom
Woking
T: +44 (0)131 220 6966 F: +44 (0)131 220 6087
Dukes Court, Duke Street, Woking
Surrey GU21 5BH United Kingdom
Glasgow
Seventh Floor, 78 St Vincent Street
Glasgow G2 5UB United Kingdom
T: +44 (0)141 225 4400 F: +44 (0)141 225 4401
London
Second Floor, 17 Hanover Square
London W1S 1HU United Kingdom
T: +44 (0)20 7529 6500 F: +44 (0)20 7529 6556
Email: [email protected]
Offices also in
Bangkok, Beijing, Hong Kong, Shenzhen and Singapore
T: +44 (0)1483 728051 F: +44 (0)1483 755207