1
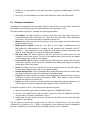
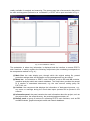
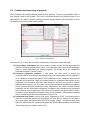
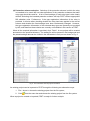
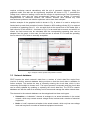
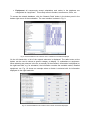
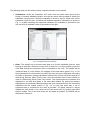
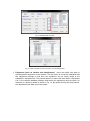
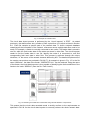
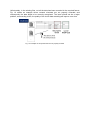
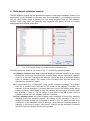
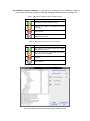
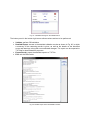
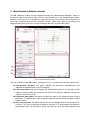
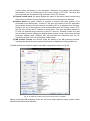
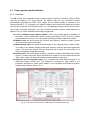
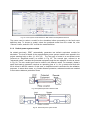
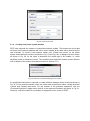
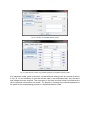
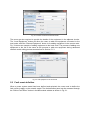
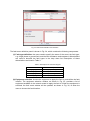
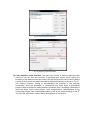
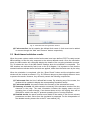
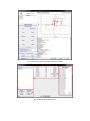
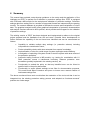
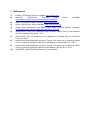
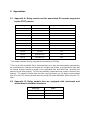
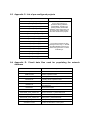
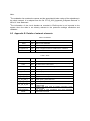
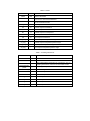
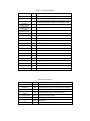
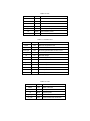
Power System Protection Smart Tool Prototype User Manual Qiteng Hong [email protected] Department of Electronic and Electrical Engineering University of Strathclyde Contents Glossary .................................................................................................................................. 2 1 Introduction ...................................................................................................................... 3 2 Overview .......................................................................................................................... 4 3 2.1 Structure of PPST ..................................................................................................... 4 2.2 System prerequisites ................................................................................................. 4 2.3 Software Installation .................................................................................................. 5 2.4 Running PPST .......................................................................................................... 6 2.5 Creation and importing of projects ............................................................................. 8 Auxiliary functions .......................................................................................................... 10 3.1 Parsing module ....................................................................................................... 10 3.2 Graphical analysis toolkit......................................................................................... 10 3.3 Network database ................................................................................................... 11 4 Rule-based validation module ........................................................................................ 17 5 Model-based validation module ...................................................................................... 20 5.1 Power system model definition ................................................................................ 22 5.1.1 Overview .......................................................................................................... 22 5.1.2 Default power system models .......................................................................... 23 5.1.3 Edit the existing power system models............................................................. 24 5.1.4 Creating new power system models ................................................................. 25 5.2 Fault event definition ............................................................................................... 27 5.3 Model-based validation results ................................................................................ 30 6 Summary........................................................................................................................ 32 7 References..................................................................................................................... 33 8 Appendixes .................................................................................................................... 34 8.1 Appendix A: Relay models and the associated file formats supported by the PPST parsers .............................................................................................................................. 34 8.2 Appendix B: Relay models that are equipped with rule-based and model-based validation functions ............................................................................................................ 34 8.3 Appendix C: List of pre-configured projects ............................................................. 35 8.4 Appendix D: Circuit data files used for populating the network database ................. 35 8.5 Appendix E: Details of network elements ................................................................ 36 Glossary API Application Programming Interface CSV Comma Separated Value DLL Dynamic Link Library GUI Graphical User Interface HV High Voltage IDE Integrated Development Environment IED Intelligent Electronic Device JAR Java ARchive JRE Java Runtime Environment LV Low Voltage MB Model-Based MV Medium Voltage N/A Not Applicable NG National Grid PF PowerFactory PPST Power system Protection Smart Tool pu Per-unit RB Rule-Based SGT Super Grid Transformer SVC Static Var Compensator SWIG Simplified Wrapper and Interface Generator TXT Text XRIO eXtended Relay Interface by OMICRON 1 Introduction Power system Protection Smart Tool (PPST) is an intelligent system for automatic protection settings validation. It has been developed under the NG sponsored project entitled “Design of a Smart Tool for Detecting Hidden Errors in Protection Setting Files” to cater for the challenges associated with the assessment of protection settings’ validity resulted from the large number and variety of settings in numeric IEDs and the increasing network complexity. PPST utilises Rule-based (RB) and Model-based (MB) reasoning techniques and is capable of performing a comprehensive analysis of protection settings while being highly automatic. This manual provides a step-by-step guidance on the setup and the application of the system to perform error detection in protection settings files. Section 2 provides an overview of PPST, which includes an introduction of the overall system structure, the installation prerequisites and the basic steps required to get started. Section 3 describes a number of auxiliary functions provided by PPST to assist the protection settings analysis, e.g. the parsing module, the network database and the graphical analysis toolkit. Section 4 and 5 provide detailed introduction to the RB and MB modules which are the main elements in PPST. The methodologies and theory behind the system will be discussed in a separate document (PhD thesis). Additionally, recommendations on the software packages to be used for maintenance or further development purposes will be given. PPST is a research prototype aiming at the investigation of methodologies suitable for the protection settings validation and demonstrating the concepts through a number of selected relay types and certain network structures. Further tests and refinements are required to fully embed the tool into NG’s practical process. 2 Overview 2.1 Structure of PPST PPST, as shown in Fig. 1, contains the following main components: network database, parsing module, graphical analysis toolkit, RB module and MB module. Fig. 1. Structure of PPST The circuit data and setting files can be automatically imported to PPST by network database and parsing module respectively. The RB module checks the correctness and suitability of protection settings using predefined rules extracted from NG’s setting policies and experts’ knowledge. The MB module uses power system models and relay models, and validates the protection settings by simulating various faults in the network model to test the protection relay response. The MB module provides a further means of settings validation, and thus, enhances the reliability of the validation results. The graphical analysis toolkit reconstructs the protection characteristics and provides an auxiliary way of analysing the protection settings. Comprehensive results are provided after the reasoning process which can be exported for documentation purposes. More details on these components in PPST will be discussed in Sections 3 to 5. 2.2 System prerequisites To run PPST, the following prerequisites must be satisfied: Operation system: Windows 7 DigSILENT PowerFactory (PF) 15.0 (32 bit). Java 1.7. Java can be downloaded at: https://java.com/en/download/index.jsp Adobe Reader or other PDF readers: required to access associated PDF files from PPST. For further development of PSST using the supplied source codes, the following tools and software packages are recommended: Eclipse IDE [1] (Kepler or newer versions): for further development of the overall system, i.e. the main program, including RB module, GUI, network database, etc. Microsoft Visual Studio 2010 (or newer versions) [2]: for the creation of DLL files used in MB module to interact with PF’s functions. SWIG [3] : for generation of the code required to interface the MB module and PF’s functions. Drools [4]: a rules management system with RB engine used in the RB module. 2.3 Software Installation The software is supplied with an executable JAR file “SmartTool.jar” and the folder “SmartTool” that contains the necessary files and dependencies for the application to run. The folder named “SmartTool” contains the following sub-folders: CircuitData: the folder contains a number of files that store circuit data, such as for transmission lines data, fault levels, etc. These files are copied from circuit data folder in LiveLink. The full list of the files is provided in Section 8.4. Material: this folder stores the files (mainly icons and images) that will used by the program during runtime. Model_based module: there are two files in this folder: ApiExample.dll and MB_Stage.pfd. ApiExample.dll is needed for the interface and interaction with PF functions. MB_Stage.pfd is a pre-configured PF file with necessary information and libraries for the program to run (such as relay model libraries). NG Rule Path: the folder contains a file that specifies the paths where the RB validation rule files are stored. The file can be updated when new rule files are added or the existing rules’ locations are changed. Parsing Rule Path: the folder contains the files that specify the paths of the rule files used by the parsers. These files can be updated when adding the support for parsing setting files of new relay types. Rules: the folder stores the rule files for the error checking rules (in the RB module) and the setting data parsing rules (in the parsing module). Sample Setting Files: a list of selected relays’ setting files that have been used to test the system and will be used in the examples across the manual. Projects: this folder contains a number of pre-configured projects that can be used as examples to explore the functions provided by PPST. More details on the provided projects can be found in Section 8.3. Others: the folder contains a file that specifies the supported protection schemes. It is also the place to store any additional files needed in future versions of PPST. To install the system on a PC, the following two steps are required: 1. Identify the directory where PF is installed (typically “C:\DIgSILENT\pf150”); 2. Copy the file “SmartTool.jar” and the folder “SmartTool” (with all subfolders and files) into the main PF directory (identified in step 1). 3. Additionally, for ease of tool execution a shortcut to SmartTool.jar file can be manually created on the desktop. The PF directory should now contain both the JAR file (“SmartTool.jar”) and the folder (“SmartTool”) as shown in Fig. 2. PSST is developed in Java, therefore there no installation process is needed, given the prerequisites as listed in Section 2.2 are satisfied. Fig. 2. The PF installation directory with the smart tool setup files 2.4 Running PPST PPST can be started by simply double clicking “SmartTool.jar”. A start window will be open for the user to determine whether or not to continue. This confirmation step is provided to avoid accidently starting the program and proceeding directly to the circuit data importing process, which involves large amounts of data loading. To continue, press “Start”. Otherwise, press “Cancel” to exit. Fig. 3. The starting user interface of PPST If the “Start” option is selected, PPST will automatically start a data import process in the background to retrieve the whole network’s data from a number of circuit data files as listed in Section 8.4. A network database will be built during runtime, allowing the circuit data to be readily available for analysis and reasoning. The process may last a few seconds, after which the main working panel (referred to as “workstation”) of PPST will be open as shown in Fig. 4. Fig. 4. The workstation of PPST The workstation is where key information is displayed and the interface to access PPST’s main functions. It mainly contains the following components (the numbering corresponds to the components marked on Fig. 4 ): (1) Main Port: the main display port, through which the original setting file, parsed protection settings data, and substation running arrangements can be viewed. (2) Menu bar: the shortcuts to PPST’s main functions, such as RB and MB modules, graphical analysis toolkit and network database. The Help button provides the access to a number of associated documents, e.g. the user manual, setting policy file PS(T) 010, etc. (3) Console: the component that displays the information of background process, e.g., any errors or warnings during the circuit data import process will be printed in the console. (4) Information panel: the panel contains the main information about the project, such as the project name, the saved directory, the protected equipment data, etc. (5) Button panel: a group of buttons for accessing PPST’s main functions, such as RB and MB modules, graphical analysis toolkit and network database. 2.5 Creation and importing of projects PPST manages the setting validation tasks through projects. To start a new validation task, a new project needs to be created. This can be achieved through the following steps in the workstation: File ˃ New > Project. A dialogue named “Project Wizard” will be invoked, in which the details of the project need to be specified. Fig. 5. Project wizard dialogue As shown in Fig. 5, there are four main components in the project wizard dialogue: (1) Project basic information: the users need to provide a name for the project and the directory where the project will be saved. The name has to be unique in the destination folder to avoid overwriting any existing projects. The setting file to be validated is selected through the “Import” button. (2) Protected equipment selection: in this panel, the user needs to specify the equipment that is protected by the targeted relay that is associated with the setting file to be validated. As stated previously, PPST imports the whole network’s data from the supplied circuit data files. When the import process is completed, theoretically all the equipment in the network and their data should be stored in the system’s network database and ready for use. The users can choose the targeted equipment through the search function using the equipment’s name. Alternatively, the users can firstly find the substation and the node where equipment is installed, and a smaller set of equipment will be filtered out and populated, from which the protected equipment can be found. In practice, some equipment information may not be available. More details regarding the circuit data import issue are discussed in Section 3.3. (3) Supported relay types: a list of relay types supported by PPST is provided and the users are required to choose the appropriate one from the list. Section 8.1 provides a list of relay types and file formats that PPST’s parsers support. A subset of these relay types, as selected by NG, has been equipped with RB and MB validation functionalities. These relay types are listed in Section 8.2. (4) Protection scheme selection: Selection of the protection scheme in which the relay is intended to be used. NG has clear definitions of the protection schemes that each relay type should be used for. A list of fixed settings of each relay type is also clearly defined. Selecting the intended protection scheme will help PPST choose appropriate RB validation rules. Furthermore, if the type registration information of the relay is provided, it will also allow checking whether the relay has been applied in the correct scheme and whether the fixed settings have been inadvertently changed. However, the type registration information of the selected relay types are presently not provided by NG, and therefore these checks are currently not available in this version of PPST. When all the required information is provided, click “Finish”. A new project will be created and saved to the specified directory. The setting file will be parsed in the background and the parsed settings data can be viewed in the workstation’s main port as shown in Fig. 6. Fig. 6. The workstation with the project information An existing project can be imported to PPST through the following two alternative ways: 1. File > Import > choose the existing project from the file system; 2. Click from the menu bar and choose the existing project from the file system. When a project is created or imported, PPST is ready for further analysis. 3 Auxiliary functions 3.1 Parsing module The parsing module contains a number of parsers that are capable of interpreting protection setting files and extracting the settings’ values further validation. The details of the relay types and file formats supported by PPST’s parsers are provided in Section 8.1. The parsing process is performed automatically during the creation or import of a project. No action is needed from the user. The detailed methodology used for the settings data parsing will be described in a separate document (PhD thesis). 3.2 Graphical analysis toolkit The graphical analysis toolkit provides graphical interpretation of protection characteristics and a number of analysis functions tailored to NG’s policies. The toolkit can be accessed from the “View Characteristic” button in the workstation. Fig. 7 shows an example of the characteristics of an Alstom P443 relay [5], where distance protection zones and the protected transmission line can be clearly viewed. Through the drop-down lists on the top-left corner, characteristics of other available protection elements can be displayed. Fig. 7. Analysis of Alstom P443 characteristics using the graphical toolkit The graphical interpretation of the protection functions provides an additional straightforward way of analysing the protection settings. In this shown example, it is clear that the forward zone reaches are too small: Zone 2 (in black) and Zone 3 (in yellow) reaches are set below the line’s impedance and Zone 1 (in blue) reach is clearly smaller than 80% of the line impedance. The toolkit also provides functions dedicated for NG applications. For example, during the setting of resistive reaches of distance protection zones with quadrilateral characteristic, it is important to make sure the settings have provided maximum resistive fault coverage while avoiding load encroachment. Normally, the checking of the resistive reaches requires multi-step manual calculations with the aid of geometric diagrams. Using the graphical toolkit, this task can be significantly simplified. As shown in Fig. 7, provided the voltage level, maximum loading current and the margin at required angle, arcs representing the maximum load and the load encroachment margin can be plotted. It becomes straightforward to determine whether the resistive reaches have caused any load encroachment problems and whether optimised values have been adopted. Another example of the graphical toolkit is shown in Fig. 8, where it is used to analyse the feeder back-up earth fault protection function. Based on NG’s setting policies [6], it is required to achieve an operating time of 1 s for an earth fault at the remote end of the feeder with a fault infeed of 63 kA at 400 kV. As shown in Fig. 8, for an earth fault at remote end with 63 kA infeed, the fault current can be calculated and the corresponding operating time can be adopted from the graph. In this case, the fault current is around 21.1 kA and the operating time is around 1.02 s, which is normally acceptable. Fig. 8. Analysis of back-up earth fault protection function 3.3 Network database PPST imports the whole network’s data from a number of circuit data files copied from LiveLink to build a network database during runtime so that the circuit data is available for further analysis. This avoids the step of manually entering the circuit data, which is time consuming and subject to human error. The import process is automatic and the circuit data can be easily updated by updating or replacing the circuit data files. The PPST’s network database can also be used as an auxiliary tool to access and manage the whole network data. The elements in the network database can be categorised into three main types: Substation: a “substation” element is analogue to an actual substation in the actual network, which may contain several voltage levels, busbars and a number of electrical equipment. Node: a “node” represents a busbar in the actual network, which only has one voltage level and may have a number of electrical equipment connected. Equipment: all components except substations and nodes in the database are categorised as “equipment”. This mainly refers to feeders, transformers, SVCs, etc. To access the network database, click the “Network Data” button in the button panel in the bottom-right corner of the workstation. The user interface is shown in Fig. 9. Fig. 9. Network database user interface with a substation’s information displayed On the left hand side, a list of the network elements is displayed. The radio button at the bottom can be used to choose a specific category to display, i.e. substations or equipment. When selecting any element in the list, a summary of the element’s information is displayed on the right hand side, e.g. for substation, the information contains the available nodes, installed equipment, etc. Fig. 10 shows an example where a feeder is selected with its information displayed on the right hand side. Fig. 10. Network database user interface with a feeder information displayed The following steps can be used to access a specific element in the network: Substations: select the “Substation List” option from the radio button group at the bottom of network database window, and use the search field provided to search the substation using its name. When the substation is found on the list, double click on the substation name will open a window with detailed substation information as shown in Fig. 11. A table containing the equipment installed in the substation is provided on the left, and a list of available nodes is presented on the right. Fig. 11. Substation data user interface Node: The easiest way to access node data is to find the substation that the node belongs to and then choose the node from its node list. It is also possible to get the node data through the equipment that is connected to the node. The details will be introduced later on in this section. An example of the node data is given in Fig. 12. On the left hand side, the fault levels from NG’s fault level survey are displayed. According to DH08, for protection settings calculation transient fault current should be used as for determining Summer Minim Fault Levels, while sub-transient fault current should be used for determining Winter Peak Fault Levels. The required data are extracted and displayed on the fault level panel in the node data window. By clicking the buttons highlighted in red, detailed information about the fault contributions from the connected equipment can be viewed (shown in Fig. 13). On the right hand side, a list of equipment that is connected to the node is provided. The panel marked in orange displays the fault levels in use, which are the fault levels used for building equivalent system models. The in-use fault levels can be edited as needed. The details will be discussed in Section 5. Fig. 12. Detailed data of a node Fig. 13. Fault contributions from the node’s connected equipment Equipment (such as feeders and transformers): there are mainly two ways to access specific equipment in the network. The first option is to find the substation that the equipment belongs to and then the equipment can be easily found in the substation’s equipment list. The second option is to select the radio button “Equipment List” in the network database dialogue and search the equipment using its name. An example of a feeder’s details is shown in Fig. 14. By double clicking the node names, the associated node data can be accessed. Fig. 14. Example of a feeder’s data The circuit data import process is performed by the “circuit importer” in PPST. As stated previously, the data sources are a number of files copied from in LiveLink as listed in Section 8.4. Each file contains a specific part of the network data. To build a network database containing all the information of the network, references across multiple data files need to be made. For example, a feeder is normally connected to two nodes. The feeder data is stored in one file, while the fault levels data of the nodes are stored in other files. The circuit importer needs to find the feeder data in one file, identify the nodes it is connected to, and find corresponding fault level data in other files. This process is achieved through the unique identifiers, i.e. the name, of the network elements defined by NG. The detailed requirements of the naming conventions are provided in DH 28 [7]. An example is given in Fig. 15. In the file name “Branches”, the data of the feeder “GREN4-STAY4-1” can be retrieved. Using the name of the feeder, the circuit data importer is thus capable of identifying the fault contribution of the feeder to the node “GREN41” (from the file “Fault Levels”). Fig. 15. Retrieving circuit data from various files using network elements’ unique names This means that the circuit data recorded needs to strictly conform to the requirements as specified in DH 28 for the circuit data importer to correctly retrieve the whole network data. Unfortunately, in the existing files, not all the data has been recorded in the required format. Fig. 16 shows an example where network elements are not properly recorded, and consequently the data failed to be correctly recognised. The issue should not be a major problem, as according to NG, the quality of the circuit data recording will improve over time. Fig. 16. Examples of components that are not properly recorded 4 Rule-based validation module The RB validation module can be accessed through the “Rule-based Validation” button in the button panel (or the RB button on the menu bar) in the workstation. It is important to note that only the relay models listed in Section 8.2 have been supported with the RB validation function. Other relay types are presently only supported with paring function to interpret settings data from original setting files. Fig. 17. RB validation module user interface before the validation process The RB module user interface, as shown in Fig. 17, contains the following panels: (1) Validation results in tree view: this panel displays a table that contains all the setting parameters in the relay that have been checked along with the associated validation results in a tree view. Indicators with different colours are used to represent different types of validation results. The details of the indicators used and the results they represent are provided in Table 1 (2) A function block (e.g. “Configuration”), may contain a number of settings. The indicator used for a function block depends on the results of the settings it contains. For example, if all the settings in a function block are correct, the function block will be marked as correct. More details on how the indictors are assigned to a function block are provided in Table 2. Fig. 18 shows a screenshot of the RB module with the validation results when the validation process is finished. (3) Error message panel: this panel displays short messages of errors and warnings identified during the validation process. By clicking on any message on the list, a detailed message window will be opened as shown in Fig. 19, which provides more information on the identified errors or warnings, along with the recommendations on changes. In the future a useful “View Policy” function can be developed to directly access the relevant policies that the setting violates. (4) Validation results summary: in this panel, a summary of the validation results is given, such as the total number of settings validated, identified errors, warnings, etc. Table 1. Indicators to represent various validation results. Indicators Results Correct. The setting conforms to rules. Warning. The setting is acceptable but may be optimised. Error. The setting contains error(s) and actions must be taken. Not validated. The setting has not been validated by any rules. Table 2. Assignment of indicators to function blocks. Indicators Results The settings in the function block (the children settings) are all correct. There is at least one child setting with warning status but no error identified. At least one error identified in the children settings. Not validated. Fig. 18. RB validation module user interface with the validation results Fig. 19. A detailed message on the identified error The button panel in the bottom-right corner allows various actions to be performed: Validate: perform RB validation Detailed Report: access to the detailed validation results as shown in Fig. 20, in which a summary of the reasoning results is given, as well as the details on the identified errors and warnings, along with recommended changes. The report can be exported to TXT files for documentation purposes. Export Result: export the detailed report to a TXT file. Exit: exit the RB module. Fig. 20. Detailed report of the RB validation results 5 Model-based validation module The MB validation module can be accessed through the “Model-based Validation” button in the button panel at the bottom-right corner of the workstation or the “Model-based module” button in the menu bar. It is important to note that only the relay models listed in Section 8.2 have been supported with the MB validation function. Other relay types are presently only supported with paring function to interpret settings data from original setting files. Fig. 21. MB module user interface The user interface of the MB module, as shown in Fig. 21, contains the following components: (1) Characteristic diagram: this panel displays the protection characteristics and indicates the applied faults in the R-X diagram. (2) Fault event panel: this panel displays the defined fault events to test the relay model response and provides the access to the fault event definition dialogue through the “Define Fault Event” button. (3) Equipment data panel: this panel provides the data of the equipment that is being protected. A detailed view of the equipment data can be accessed through the “More Details” button. (4) User account panel: this panel requires the account details used for accessing the PF functions. The user should have created an account in PF and supplied the details in appropriate fields. It is important to make sure the input user name and password are correct before proceeding to the simulation. Otherwise, the program will terminate immediately. This is a shortcoming of the current version of PF’s API. The issue has been reported and is expected to be resolved in future PF versions. (5) System model panel: the panel displays the name of the power system model being used for the simulation and provides the access to the model definition dialogue. (6) Button panel: the panel contains a number of buttons that allow actions to be performed on the MB module. “Invoke PF” will open an instance of the PF application which allows access to all the functions provided by PF in its standard user interface. However, the use of this function is not recommended, since the existing version of PF API will fail to invoke the PF interface in some cases. This issue has been reported to PF and it is expected to be resolved in future PF versions. “Simulate” button is to start the simulation process utilising the defined power system model, fault events and the protection settings data. “Release API” will terminate the interaction with the PF calculation engine. “Exit” will terminate the MB module. (7) MB module console: the console prints the details of the MB reasoning process, including the details of power system model setup, initialisation of relay models, etc. The MB module user interface with the simulation completed is shown in Fig. 22. Fig. 22. The MB user interface with the reasoning process completed Before performing MB reasoning, there are two main steps required: power system model definition and fault events definition. 5.1 Power system model definition 5.1.1 Overview The MB module uses equivalent power system models to perform simulation. Relay models used are provided by PF relay libraries. By default, there are two equivalent models automatically generated by PPST. More details on the default models is included in the following Section 5.1.2. Changes to the default models can be made and customised models can also be created for some specific needs, e.g. investigating protection behaviour at various fault levels or network topologies. The user interface for power system model definition is shown in Fig. 23, which contains the following components: (1) List of available power system models: a list of the models that are available for simulation, which includes the default models generated by PPST and the models newly added by the users. The user needs to select one listed model for simulation. (2) Model in use: the user can use the “Choose” and “Remove” buttons to select a model and remove the previous selection. (3) Model details panel: the panel provides details on the selected power system model. The nodes in the default models contain both summer minimum and winter peak fault levels. The users can choose from the drop-down list to select the fault levels to be used for building the equivalent models. (4) Button panel: the button panel contains a number of buttons associated with various actions: “Create new model” button will lead to the creation of a new customised model. “Edit model” button will make the selected model editable to the users. (5) Adjacent circuit equipment panel: Fig. 24 shows the model definition page in an advanced network model view. The equipment connected to both nodes of the protection equipment is listed. More details on the simplified and advanced system models are provided in Section 5.1.2. Fig. 23. Power system model definition in MB module with simplified model view Fig. 24. Power system model definition in MB module with simplified model view The users need to select a model for the simulation before proceeding to the fault event definition step. To choose a model, select the preferred model from the model list, click “Choose” button, and click “OK” to finish the model definition. 5.1.2 Default power system models As stated previously, PPST automatically generates two default equivalent models for simulation. The level of detail of the representative power system models were agreed in the project meeting held on Nov 21, 2011 [8] . The first type of model is a two-ended circuit (referred as “simplified model”) as shown in Fig. 25. The second type, referred to as “advanced model”, includes the protected equipment and the two adjacent circuits as shown in Fig. 26. The two model types can be used to suit different needs. For example, feeder’s earth fault back-up protection requires an operating time of 1 s for a remote end fault with 63 kA infeed in 400 kV network. In this case, a simplified model is sufficient for the validation purposes. In some other cases, e.g. feeder distance protection, advanced models are needed to test various distance protection zones. Fig. 25 Simplified equivalent network model Fig. 26. Advanced power system model 5.1.3 Edit the existing power system models To edit the existing models, select the model to be edited on the model list and press “Edit model” button on the power system model definition window (as shown in Fig. 23 and Fig. 24), after which the power system model panel will become editable. The users can change the data of the existing model in appropriate fields. For advanced network models, the users can also choose to add or remove equipment from the adjacent circuit equipment list. Fig. 27 shows the interface to create a new feeder, where the users need to supply the feeder details such as length, positive sequence resistance, etc. The new equipment is either connected to the local node or the remote node of the protected equipment. Therefore, one of their nodes has been confirmed, i.e. either the local node or the remote node of the protected equipment, and the other node need to be defined by the users. Click the “add” button and an interface for the node creation will be invoked as shown in Fig. 28. In addition to the name of the node, the users also need to provide the voltage level, 1-phase and 3-phase fault levels. When finishing editing the model, press the “Edit model” toggle button. The users will be asked whether to save the edited model. If “Yes” option is chosen, the edited model will be saved to the model list as a new network model. Otherwise, the network is not saved and all the changes are permanently lost. Fig. 27. Create a new feeder Fig. 28. Create a new node 5.1.4 Creating new power system models PPST also supports the creation of customised network models. This means the circuit data as stored in the network database will not be used. Instead, all the data will be entered by the user manually. To create a new network model, click “Create new model” on the power system model definition window (as shown in Fig. 23 and Fig. 24). A dialogue will be invoked, as shown in Fig. 29, for the users to determine the model type to be created, i.e. either simplified model or advanced model. The simplified and advanced models contain different level of details of the network as explained earlier in Section 5.1.2 Fig. 29. Selection of network model type to be created If a simplified model option is selected, a model definition dialogue will be invoked as shown in Fig. 30. For the local and remote nodes, the users need to specify the name, voltage level and 1-phase and 3-phase fault levels. For the creation of the protected equipment, click the “Protected Equipment” toggle button and fill in the required information as shown in Fig. 31. Presently, only the creation of new feeders is supported in this version of PPST. Fig. 30. Creation of simplified network model Fig. 31. Input data for creation of protected equipment in simplified network model If an advanced model option is selected, a model definition dialogue will be invoked as shown in Fig. 32. For the definition of local and remote node in the advanced model, only the name and voltage levels are required. This is because in this case the fault infeed is provided by the other equipment connected to the nodes. The process of creating the protected equipment is the same as the corresponding process in a simplified network model. Fig. 32. Creation of advanced network model The users are also required to provide the details of the equipment in the adjacent circuits. The “Local Equipment” button will allow the users to add new equipment connected to the local node, while the “Remote Equipment” button is for adding equipment in the remote node. Fig. 33 shows an example of adding equipment to the local node. The process of adding new equipment to the list is the same as the process to add new equipment during advanced network model editing process as described in Section 5.1.3. Fig. 33. Add equipment to the local node 5.2 Fault event definition When a power system model has been defined and selected, the users need to define the fault events to apply on the network model. The fault definition panel can be accessed through the “Define Fault Event” button in the MB module window as shown in Fig. 21. Fig. 34. Fault events definition user interface The fault event definition panel is shown in Fig. 34, which contains the following components: (1) Fault type definition: the users need to specify the name of the event, the fault type, e.g. single phase to ground fault, and the fault resistance and reactance. Abbreviations are used to describe the fault types in the drop down list. Description of these abbreviations are listed in Table 3. Table 3. Descriptions of various fault types Abbreviation Description Single_Ph_GND Single phase to ground Two_Ph_SC 2-phase short circuit Two_Ph_Gnd 2-phase to ground Three_Ph_SC 3-phase short circuit (2) Equipment selection: choose the equipment to apply the fault to, and define the fault location. The equipment selection window, as shown in Fig. 35, provides a list of equipment available in the network model to apply the fault to. When the equipment is selected, the fault event window will be updated, as shown in Fig. 36, to allow the users to choose the fault location. Fig. 35. Faulty equipment selection Fig. 36. Selection of the fault location (3) Fault definition mode selection: the users can choose to define customised fault events or use the auto test functions to generate fault events. When testing the boundary of the distance protection zones, the auto test function can be used to define a series of fault events around the boundaries with specified steps as shown in Fig. 37. The existing functions, aiming at demonstrating the potential of the auto-test functionality, allow the generation of transmission line faults within a pre-defined position range and steps for testing distance protection Zone 1 boundary. Although not within the scope of the current project, more comprehensive implementation of the auto-testing function was considered desirable by NG at the project meeting on the 4 th July 2014 [9], and can be a part of future development of the system. Fig. 37. Automatic fault event generation function (4) Fault event list: the list contains the defined fault events. A fault event can be added or remove through the “Add” and “Remove” buttons respectively. 5.3 Model-based validation results When the power system model and the fault events have been defined, PPST is ready to start MB simulation to test the relay response to the various defined events. Once the simulation starts, the MB console will continually display the details of the on-going simulation process. Fig. 38 shows the view of the MB module interface when the simulation is completed. The fault locations are indicated by fault icons on the R-X diagram. It is important to note that the marked locations indicate where the faults are applied, rather than the faults seen by the relay. When the simulation is completed, click the “Show Result” button and the simulation result window will be invoked as shown in Fig. 39. Different relays may have slightly different views to present the results. However, they all mainly contain the following components: (1) Fault events list: the list of defined fault events. By selecting any of the events, the window will be updated to display the corresponding simulation results. (2) Fault event details: the panel contains the summary of the selected fault event. (3) Summary of results: the table contains a summary of the simulation results of the key elements in the relay. The main information includes the tripping status and the operating time of each element. If an element does not trip, the tripping time will be 9999.999 s, which is the way PF presents operating time in non-trip situations. (4) Detailed results: the panel contains more details of the results. A list of more relevant parameters and their values from the simulation is presented. For the interpretation of the detailed results, please refer to the PF user manual [10]. Fig. 38. MB module with the reasoning process completed Fig. 39. MB results for Alstom P443 6 Summary This manual has provided a step-by-step guidance on the setup and the application of the intelligent tool PPST to perform error detection in protection settings files. PPST is equipped with a RB and a MB module for the analysis and validation of protection settings. Protection settings data from setting files in a number of supported formats are interpreted by the parsing module. The network database is provided to facilitate the access and manipulation of circuit data. The graphical analysis toolkit offers graphical interpretation of protection characteristics and analysis functions tailored to NG’s policies, which provide useful support for the validation of protection settings. The existing version of PPST has been designed and implemented to adhere to the original project proposal and the feedbacks from the end users. Potential future developments to further enhance the capability of the tool have been identified and can be summarised as follows: Capability to validate multiple relay settings (i.e. protection scheme) including comprehensive coordination check; Further plausibility checks with rules extracted from experts’ knowledge; Implementation of rules for a wide range of system topologies and conditions; Investigation of exploiting full system model to test the system wide area effects of the protection operation; Automatic testing functions in MB module, e.g. testing for coordination with LV DNO protection across a transformer boundary, distance protection zone boundaries (partially implanted in the existing version), etc. Functionality to embed the policy so that any identified error can be linked to specific items in the policy documents, Functionality to export parsed settings to text files for documentation purposes. This would avoid labour intensive and prone to human error manual creation of text-based settings files. The above mentioned future work would allow the maturation of the tool such that it can be integrated into the existing protection setting process and adopted as “business-as-usual” practice at a further stage. 7 References [1] Eclipse, (25/10/2014), Eclipse. Available: http://eclipse.org/ [2] Microsoft, (25/10/2014), Microsoft Visual http://msdn.microsoft.com/en-us/vstudio/aa718325.aspx [3] SWIG, (25/10/2014), SWIG. Available: http://www.swig.org/ [4] Drools, (25/10/2014), Drools. Available: http://www.drools.org/ [5] Alstom Grid, (26/10/2014), MiCOMho P443, P445 Technical Manual. Available: ftp://ftp.alstom.com/Alstom_Manuals/P44y_EN_M_C21.pdf [6] National Grid, "PS(T) 010: Application and Protection Setting Policy for the National Grid UK Transmission System ", 2011. [7] National Grid, "DH 28: Guidance on the Application of System Data for Protection Purposes," 2013. [8] National Grid and Strathclyde University, "Design of a smart tool for detecting hidden errors in protection setting files Minutes of the Meeting, 21 November 2011," 2011. [9] National Grid and Strathclyde University, "Design of a smart tool for detecting hidden errors in protection setting files Minutes of the Meeting, 4th July 2014," 2014. [10] DIgSILENT, "DIgSILENT PowerFactory 15 User Manual." Studio. Available: 8 Appendixes 8.1 Appendix A: Relay models and the associated file formats supported by the PPST parsers Model Supported Setting File Formats ABB RED670 RED670A31-X00 CSV ABB REL670 REL670-B32X00 XRIO Alstom P142 P142316D5M0200G XRIO Alstom P143 P143?16E5?0200G CSV Alstom P443 P443?18F3?0330J TXT, CSV Alstom P545 P545?16A5?020?G TXT, CSV Alstom P643 P643?2AE6?0020K XRIO Alstom P842 P842?16A1?0040B XRIO Alstom MCGG22 - TXT GE B30 GE D60 GE L90 1 1 Relay Type B30-C00-HCH-F8C-H6NL4L-N6N D60-G00-HCH-F8F-H6UM6R-P6U-W76 L90-G00-HCH-F8F-H6UL6R-N6U-W76 2 CSV CSV CSV The model numbers are only required for the parsing of CSV files. 2 The use of CSV and XRIO files is recommended, since they are automatically generated by the manufacturers’ software and contain the complete set of data. It is important to note that no manual changes should be made to the generated CSV and XRIO files, otherwise the parser may not work properly. TXT files are manually created and only contain a subset of the settings. The content of these files may also vary significantly, so it is highly recommended that not to use TXT files as the data sources (except for Alstom MCGG22, which only has TXT files). 8.2 Appendix B: Relay models that are equipped with rule-based and model-based validation functions Relay Type Model Alstom P443 P443?18F3?0330J Alstom P545 P545?16A5?020?G Alstom MCGG22 - 8.3 Appendix C: List of pre-configured projects Project Name Description Alstom_P443_No_Error.ppst Alstom_P443_With_Errors.ppst Alstom_P545_No_Error.ppst Alstom_P545_With_Error.ppst Alstom_MCGG22E_No_Error.ppst For the demonstration of protection setting validation functionalities, including the parsing of data, RB and MB validation. More information can be found in the guidance file in the same folder of the projects. Alstom_MCGG22E_With_Error.ppst ABB_RED670_Parsing.ppst ABB_REL670_Parsing.ppst Alstom_P142_Parsing.ppst Alstom_P143_Parsing.ppst Alstom_P643_Parsing.ppst Alstom_P842_Parsing.ppst For the demonstration of data parsing function only, i.e. the RB and MB validation functions for these relay types have not been available yet. GE_B30_Parsing.ppst GE_D60_Parsing.ppst GE_L90_Parsing.ppst 8.4 Appendix D: Circuit data files used for populating the network database File Name ElmSym.xls ElmBranch.xls Description Generator units data Feeders’ impedance data Elm2WTr.xls 2-winding transformers’ impedance data Elm3WTr.xls 3-winding SGTs’ impedance data ElmLoad.xls Data of the loads connected to busbars ElmShnt.xls Shunt compensation equipment data (reactors and capacitors) ElmSind.xls Series reactors’ data ElmSVC.xls SVCs’ data SummerMin_2015_1Phase.xls Summer minimum: 1-phase fault levels SummerMin_2015_3Phase.xls Summer minimum: 3-phase fault levels Winter Peak_2014_1Phase.xls Winter peak: 1-phase fault levels Winter Peak_2014_3Phase.xls Winter peak: 3-phase fault levels Substation List.xls A full list of substations in the system 1,2 Note: 1 The substation list contains the names and the associated 4-letter codes of the substations in the whole network. It is adopted from the file “ETYS_2012_Appendix_B-System Data.xls” in NG’s 10 Year Statement. 2 The information of the circuit breaker as recorded in ElmCoup.xls is not imported to the system since the data is not directly relevant to the protection settings calculation and validation. 8.5 Appendix E: Details of network elements Table 4. Substation Parameter Unit Details Name N/A Name of the substation Code N/A A 4-letter unique identifier for the substation Equipment list N/A A list of equipment that are installed in the substation Node list N/A A list of nodes that are available in the substation Table 5. Node Parameter Unit Details Name N/A Name of the node Code N/A A unique identifier for the node, e.g. GREN41. Normally it is the same as the node’s name Substation N/A The substation the node belongs to Voltage kV The voltage level of the node Equipment list N/A A list of equipment that are connected to the node FL_sum_min_1 kA Summer minimum 1-phase fault level FL_sum_min_3 kA Summer minimum 3-phase fault level FL_win_peak_1 kA Winter peak 1-phase fault level FL_win_peak_3 kA Winter peak 3-phase fault level FL_1ph_in_use kA FL_3ph_in_use kA Fault contribution details N/A 1-phase fault level used for building equivalent power system model 3-phase fault level used for building equivalent power system model The details of fault contribution from each equipment connected to the node Table 6. Feeder Parameter Unit Details Name N/A Substation N/A Node N/A Length km The length of the feeder R1 Ω Positive sequence resistance X1 Ω Positive sequence reactance B1 S Positive sequence susceptance R0 Ω Zero sequence resistance X0 Ω Zero sequence reactance Z1_mag Ω Positive sequence impedance magnitude Z1_ang ° Positive sequence impedance phasor angle Z0_mag Ω Zero sequence impedance magnitude Z0_ang ° Zero sequence impedance phasor angle Name of the feeder The substations the feeder is connected to. For a feeder, there are two associated substations. The nodes the feeder is connected to. For a feeder, there are two associated nodes Table 7. 2-winding transformer Parameter Unit Details Name N/A Name of the transformer Substation N/A The substation where the transformer is installed Node N/A The nodes that the transformer is connected to. For a 2winding transformer, there are two associated nodes. Rated apparent power MVA Rated apparent power of the transformer HV rated voltage kV Rated voltage on the HV side R1 Ω Positive sequence resistance X1 Ω Positive sequence reactance HV_R0 Ω Zero sequence resistance on HV side HV_X0 Ω Zero sequence reactance on HV side LV_R0 Ω Zero sequence resistance on LV side LV_X0 Ω Zero sequence reactance on LV side Table 8. 3-winding transformer Parameter Unit Name N/A Name of the transformer Substation N/A The substation where the transformer is installed. Node N/A The nodes that the transformer is connected to. For a 3-winding transformer, there are 3 associated nodes MVA Rated apparent power on HV side MVA Rated apparent power on MV side MVA Rated apparent power on LV side HV rated apparent power MV rated apparent power LV rated apparent power Details HV rated voltage kV Rated voltage on the HV side MV rated voltage kV Rated voltage on the MV side LV rated voltage kV Rated voltage on the LV side HV_R1 Ω Positive sequence resistance on the HV side HV_X1 Ω Positive sequence reactance on the HV side MV_R1 Ω Positive sequence resistance on the MV side MV_X1 Ω Positive sequence reactance on the MV side LV_R1 Ω Positive sequence resistance on the LV side LV_X1 Ω Positive sequence reactance on the LV side HV_R0 Ω Zero sequence resistance on the HV side HV_X0 Ω Zero sequence reactance on the HV side MV_R0 Ω Zero sequence resistance on the MV side MV_X0 Ω Zero sequence reactance on the MV side LV_R0 Ω Zero sequence resistance on the LV side LV_X0 Ω Zero sequence reactance on the LV side Table 9. Series reactor Parameter Unit Details Name N/A Name of the series reactor Substation N/A The substation where the series reactor is installed. Rated voltage kV Rated voltage Rated apparent power MVA Rated apparent power of the series reactor Pre_Fault_Rating MVA Pre-fault continuous rating Post_Fault_Rating MVA Pre-fault continuous rating R pu in % Resistance X pu in % Reactance Table 10. SVC Parameter Unit Details Name N/A Name of the SVC Substation N/A The substation where the SVC is installed. Controlled node N/A - Qr_limit MVar Rated reactive power limit Qc_limit MVar Rated capacitive power limit Qr MVar Rated reactive power Droop % - Table 11. Generator unit Parameter Unit Details Name N/A Name of the generator unit Substation N/A The substation that the unit is connected to. Bus type N/A The bus type with value of “PQ” or “PV” H s Vn kV S MVA Nominal apparent power pf N/A Power factor R1_subtr pu in % Positive sequence sub-transient resistance X1_subtr pu in % Positive sequence sub-transient reactance Xds pu in % Positive sequence transient reactance R0 pu in % Zero sequence resistance X0 pu in % Zero sequence reactance Inertia time constant Nominal voltage Table 12. Load Parameter Unit Details Name N/A Name of the load P MW Active power Q MVar Reactive power FC_sub_tran MVA Total sub-transient fault contribution FC_tran MVA Total transient fault contribution