1
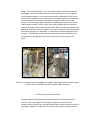
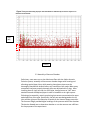
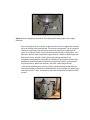
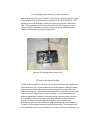
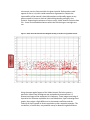
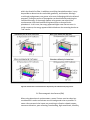
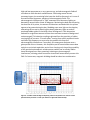
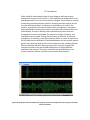
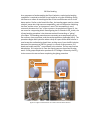
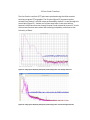
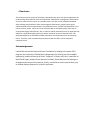
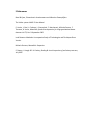
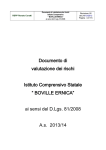
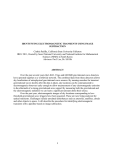
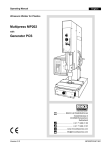
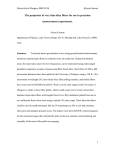
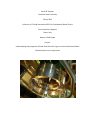
Aaron D. Spooner
Louisiana State University
26 July 2011
University of Florida International REU for Gravitational-Wave Physics
Host Institution: Sapienza
Rome, Italy
Mentor: Paola Puppo
Project:
Understanding the properties of fused silica fibers for Virgo's current Gravitational Wave
interferometer mirror suspensions
Abstract
The purpose of this project is to understand the intrinsic properties of the fused
silica fibers are installed in Virgo's current interferometric detector, Virgo
experiment. These fibers will provide suspension for the Virgo interferometer
mirrors. Significantly reducing thermal noise emissions, these fused silica fibers
are highly implemented. Currently, the properties of the silica fiber are under
further investigation. Utilizing various techniques to monitor the fiber's
properties, investigational results will be analyzed and recorded prior to the
fiber's installation. Additionally, realizing bonding methods for the fiber-mirror
connection is another behavioral priority.
1 Introduction
1.1 Gravitational Waves
Introduced in 1916 and emerging from Einstein's general theory of relativity,
gravitational waves are disturbances or perturbations in space-time. These
propagations occur from accelerating non-symmetric mass distributors such as
orbiting pulsars and black holes. However, these ripples in space-time are
practically infinitesimal in length. Although indirectly verified as a result of
discrepancies in pulsar 1916+13 predicted period, gravitational waves have not
been detected as of date. Unlike, electromagnetic waves, gravitational waves
propagate throughout the universe seamlessly. These waves do not interact with
matter. From an experimental view point, such a detection may seem impossible
or too improbable for accurate findings. On the contrary, several sites have been
established to detect these perturbations in space-time. Using a MichelsonMorley Interferometer design, such sites known as LIGO, GEO600, and VIRGO
have been constructed in order to accomplish this task. A shared concern for
these detectors is the existence of external noises that inhibit instrument
sensitivity and accurate detection. The subject of this report is based on a
particular gravitational wave interferometer located in Cascina, Italy known as
VIRGO. The Virgo interferometer houses a monolithic suspension design that
encompasses a fused silica fiber as a means of reducing thermal noise activity.
1.2 Silica Fiber
As metallic wires produce thermal noise due to internal friction, the monolithic
suspension design proved to be highly favorable. In more concrete detail, a low
dissipation material such as fused silica fibers are implemented in the Virgo
gravitational wave detector as a more appropriate solution. In conjunction with
the lack of thermal noise production, the material's breaking strength is highly
trustworthy. In the early stages of the fiber's development, several designs were
tested. The design of these fibers are constructed with extreme care and
accuracy. Virgo in collaboration with McIntosh from the GEO600 group at
Glasgow constructed the required machine for the production of such fibers.
Mechanically and deliberately, the fiber is pulled from a previously synthetically
fused silica rod. The fiber is heated from pure oxygen and hydrogen gas. Fibers
constructed in this way have been "geometrically characterized" with a
computerized microscope. However, this mechanical design for producing fibers
has been modified in order to produce current fused silica fibers for testing.
After producing the fused silica fiber, certain tests must be run in order to
understand the behavior of the fiber. For instance, due to the sensitivity of the
fiber's surface, any significant scratch can dramatically reduce the breaking
strength of the fiber. In fact, the slightest contact with the fiber can break the
fiber. These fibers must be handled with extreme care. This sensitivity was held
in mind throughout the entire fused silica fiber installation process performed
during this project. Another important aspect of these fibers' behavior is the
events that lead up to a complete break in the material. Although having high
degree of durability, it is important to understand the imperfections that
accompany this system of suspension. In correlation to the fibers breaking point,
understanding the effectiveness of the silica bond with current Virgo
interferometer mirrors must also be taken into consideration.
2 Experimental Methods
2.1 Experiment set up
The apparatus and layout of the entire experiment has been confined to a
vacuum chamber monitored via PC utilizing Vallen Acoustic Emission systems
and programs. A specially designed mounting unit has been established to run
preliminary tests on a 79.38 cm long Aluminum fiber. Attached above the
mounting bracket and in direct contact with the given fiber, there rests an
accelerometer with a denoted channel number. Likewise, another accelerometer
with a different denoted channel number is attached to the top of a 5.6 kg test
load. The designation of weight for the given test load was a direct result of
proportionality to the interferometer's mirror weight in conjunction with its
mounting system. The weight has been slightly adjusted to test the fiber at a
greater strain. As testing practices improved and installation procedures
mastered, the silica fiber was analyzed under this mounting mechanism. The
purpose of this design is welcomed as it is required to simulate the expected
"hang" length of the silica fiber as well as support its distinct vacuum chamber
design. The chamber design or "hat" has incorporated a metal with properties
that appear to be closely related to most aluminum alloys as it is not magnetic.
The mechanism stands at 1.1 m and has a base with a diameter of .60 m which
supports the framework of the mechanism's mounting bracket. The circular base
has inscribed within its surface a secondary ring that is required for O-ring
insertion. This secondary ring is required for establishing a vacuum once the Oring has been inserted. If the O-ring is not properly aligned with this inscribed
ring then a proper vacuum cannot be achieved. After lowering the chamber, the
apparatus is contained and the inside is only visible through a single viewing port
.68 m above the ground. Fortunately, it is possible to see everything within the
chamber. Unfortunately, a light source is required for better illumination and
construction of this lighting system will be discussed at a later point in this
report.
Figure 1: mounting mechanism designed to support fiber (left) and the chamber (right)
used to create a suitable vacuum to simulate Virgo conditions
2.2 Early test with Aluminum fiber
To begin, understanding how to monitor the fused silica fiber was the main
concern in the early stages of this project. Testing the sensitivity of the
accelerometers and deriving a method of disturbance isolation served as the first
challenge. In addition to the sensitivity of the accelerometer, initiating a direct,
even contact served as another task. Second, isolating the minute deformations
within the wire proved to be extremely troublesome. Lastly, establishing a
consistently stable platform as well as environment for the detectors provided
an unwanted challenge that, nevertheless, had to be dealt with on a constant
basis.
Initially using metallic clamps to keep the accelerometers in place, the surface
contact of the accelerometers were appropriate and extra noise was nonexistent
at that moment in time.
Realistically, the test load mounting design prevents the implementation of any
externally attached mechanism such as a clamp. Additionally, the added weight
would produce an unbalanced system for the test load. However, for that
particular moment in time, the configuration was suitable for preliminary test
runs. These tests allowed for further insight into the sensitivity of the
accelerometer.
To pause for a moment, it is important to comprehend the mechanics of the
accelerometers used in this experiment. An accelerometer measures the
respective or proper acceleration. For the purpose of this experiment,
piezoelectric accelerometers are implemented in order to study dynamic
mechanical changes. Piezoelectric accelerometers are well known transducers
for their remarkable ability to measure the exact vibrations of a given system. In
this experiment, vibration within the given fiber can be detected with these
piezoelectric instruments. An accelerometer also senses the surrounding seismic
activity. Through electronic integration and computer interfacing, these
piezoelectric devices can provide information pertaining to the velocity as well as
displacement of any disturbance. With no external power supply or movable
components, these instruments are incredibly compact and durable.
As spherical wave propagation registers at different moments in time between
the two separately placed accelerometers, the detectors will record these
distinct moments in time. With this statement in mind, the preliminary
experiments consisted of hitting or tapping the test load in an effort to calculate
the velocity of sound through the given metal. At this stage in the experiment,
channel 2 was assigned to set a top the mounting bracket and channel 1 was
placed on the test load hanging directly below. The Vallen Acquisition system
was set to record as a metallic pressure vessel with the standard factory default
settings. With the distance set at 13.5 centimeter which proved quite
acceptable as it was chosen to be well within the diameter of the test load,
vibrations were induced in five distinct, isolated hits. The hits or taps were
oriented at certain corners of the surfaces in order to understand how the
accelerometer would register the hits. As predicted, hits closer to the
accelerometer appeared first with a greater amplitude and energy. In similar
fashion, hits farther away produced shorter amplitudes and weaker energies.
Using this information, the preset distance was divided by the difference in time
of the two channels in order to produce the rate of propagation or speed. After
reviewing the results, apparently the sensitivity of the Vallen Visual AE system is
insufficient. The problem emerges as the difference in time between channel 1
and channel 2 cannot be measured for values less than 100 micro seconds.
Additionally, the zoom feature breaks down at a certain point and displays
inaccurate scales. As the scale approaches set intervals of 100 micro seconds, the
linear spacing of the chart fails to produce proportionality.
After understanding the vallen acquisition system, the next step involved
establishing a suitable contact without the use of metallic clamps. As the
provided magnetic clamping mechanism did not provide for a balanced system
nor a suitable contact as a result of the material's weak magnetic attraction, wax
was the appropriate and non invasive option. The applied wax must be uniformly
distributed between the accelerometer and the surface on which it is being
applied. Failure to establish a smooth, even contact results in extra noise in the
Vallen Visual Acoustic Emission diagrams. Even though in most cases this noise
was confined to a certain amplitude range, the interference inhibited proper
analysis. In order to detect isolated incidences within and around the fiber, the
system must maintain silence at all times. In reference to figure 2, the noise was
confined to amplitudes ranging from 40 to 43.5 dB. This confinement allowed for
proper background noise extraction. Knowing the set range of interference, it
was possible to properly adjust the accelerometer. Eventually, with practice and
small, evenly spaced coatings of wax, the system achieved an adequate silence
level. As it was extremely difficult to eliminate all forms of background noise at
this stage in testing, the elimination of interference induced by an uneven
contact was a considerable achievement.
Figure 2. Image of 5.6 kg test load with channel piezoelectric accelerometer attached and designated
as channel 1 or "green" sensor
Figure 3: Diagram illustrating improper wax distribution as indicated by an uneven surface or un
balanced accelerometer.
Amp
[dB]
Time [s]
2.3 Assembly of Vacuum Chamber
Preliminary tests were run on the Aluminum fiber with the Vallen Acoustic
Emission system, assembly of the vacuum chamber began with locating and
allocating special pipes. Next, while wearing latex gloves pipes must be
thoroughly cleaned with alcohol before any connections are made. When every
component has been properly cleaned, pipes are adjoined with O rings. After
inserting these O rings into the rim of the pipe, clamps known as "ties" were
attached around the adjoined pipes in order to establish an air tight system.
Following pipe assembly, certain monitoring instruments were attached to open
ended portions of the pipe. Specifically, the left port was designated as the air
inlet and the right port functioned as a conduit to the Vacuum Gauge controller.
The Vacuum Gauge provided digital readings of the pressure within the chamber.
This device allowed one to determine whether or not the vacuum was sufficient
for the purposes of the experiment.
Figure 4: Picture of pipe set up with air inlet (left) and Vacuum gauge sensor (right)
attached.
Prior to configuration as an effort to optimize the vacuum and eliminate all leaks,
the Leak Detector was implemented. This process incorporates 4He as a method
of determining if there are any porous areas that could serve as potential air
inlets. As a result of Helium's low mass and low percentage in atmosphere, this
element is used in order to bombard a given area as a means of detecting a leak.
Referred to as the "outside-inside" helium leak testing technique, the
component being tested is connected to the detector and vacuum sealed. After
establishing a vacuum within the attached component, Helium is sprayed over
the entire surface. Within the detector, there lies a mass spectrometer.
If the Helium penetrates any portion of the component being tested then the
mass spectrometer will detect the leaked Helium. As this system can detect leak
rates up to 1.8x10⁻⁵ mbar, the detector was most favorable for the desired 1x10⁻⁴
vacuum.
Figure 5: Image of leak detector.
2.4 LED lighting system design for proper illumination
After assembling the vacuum chamber, it soon became apparent that the inside
of the chamber was extremely dark. In response to this lack of visibility, a LED
lighting system was designed in order to monitor the preliminary Aluminum
fiber. The components of this system were quite simple. Using only a basic
resistor, switch, 9 volt battery and LED; a light source was established and
attached underneath the top mounting bracket.
Figure 6. LED lighting system control box
2.5 Tests for the fused silica fiber
On July 4, 2011 installation day occurred. The fused silica wire was installed and
setup tests were run in order to calibrate the accelerometers. With the surface
under the attached accelerometer partially missing due to a gap within silica
fiber's mounting ring, a poor contact was established. Despite the lack of surface
area in contact, background noise did not appear as the accelerometer was
properly aligned with a smooth, even wax coating. Several test were run after
this installation. Also, at the end of most days, the Vallen Acoustic Emission
system remained running throughout the night in order to detect any
disturbances within or around the fiber. After compiling data for two weeks in
this way, certain diagrams registered several disturbances. These disturbances
were predicted to be micro crack detections. A micro crack can be defined as any
microscopic crack or fracture within the given material. Deformations could
appear as slits or a rip with a wide assortment of geometries. Despite the
impeccability of the material, these deformations could readily appear at any
given moment in time as a result of a diminishing bonding strength in the
material. Supporting the existence of micro cracks, Vallen Acoustic Emission data
file... shows six isolated disturbances within the fiber during an overnight test
run.
Amplitude (dB)
Figure 7: Vallen Visual Acoustic Emission diagram showing six incidences of possible internal
disturbance.
Using the wave applet feature of the Vallen Acoustic Emission system, a
particular Vallen Visual AE diagram was analyzed and converted into a 3
dimensional image of the respective hit's frequency. These images consisting of
4 peculiar hits illustrates a possible micro crack detection. Upon reviewing these
graphs, there exists a slight difference in the wavelet coefficient and the
intensity of the 3D graphs in direct correlation to their respective energies. This
correlation, in future tests, may establish a way for determining deformations
within the fused silica fiber. In addition to verifying these deformations, it may
be possible to determine the crack width, geometry, and location. Although
crack length and geometry may prove to be most challenging within the allotted
programs, finding the source of propagation can be achieved by analyzing the
recorded hit energy. If the energy appears to be greater near a particular
accelerometer then the disturbance originated close to that particular
piezoelectric. In this case, the energy appeared higher near the test mass. In
similar response, the energy appeared diminished near the mounting bracket or
"red" sensor.
Figure 8: Possible micro crack detection as depicted by this 3 dimensional progression.
2.6 Electromagnetic interference (EMI)
When using piezoelectric accelerometers, several factors must be taken into
consideration in order to eliminate as much background noise as possible. To
name a few extracurricular inputs not pertaining to vibration related outputs,
transverse vibrations, poor mounting, base bending, high sound levels, humidity,
high and low temperatures, x-rays, gamma rays, and electromagnetic fields all
contribute to false vibration measurements. Eliminating several known
erroneous inputs, the remaining false input that shall be discussed, as it is one of
few verified false signatures, pertains to electromagnetic fields. This
electromagnetic interference or "EMI" emanates from laboratory lighting as
denoted by several Vallen Visual AE diagrams. Reviewing the data and comparing
the densities of hit points, the amount of vibrations recorded within the system
appear to be greater during the day. Shedding even more light on the situation,
alternating the current by switching the above laboratory lights on and off
produced sudden spikes in the Vallen Visual AE diagrams. If this alternation
endured for a significant amount of time then consistent streams of background
noise emerged. This inductive coupling originated from the proximity of cables
carrying high AC currents. "Current spikes" coming from quickly switched circuits
and other high frequency currents may also produce this source of
electromagnetic interference. Fortunately, this emergence dissipates over a
given period of time. However, this dissipation period constricted accurate data
analysis to a minimal acquisition period. As a cleaning tool, the pulsing capability
of this particular piezoelectric accelerometer enables one to actively reduce
these false signatures. After proactively inducing an electromagnetic
interference, initiating pulses from either channel will automatically counter this
EMI. For future tests, magnetic shielding should be taken into consideration.
40-71 (dB)
Amplitude (dB)
11 hr optimal silence period
Time (s)
Figure 9. A Vallen Visual AE diagram depicting a 20 hour acquisition run with an 11 hour
optimal silence period as a result of an absence in light and human activity.
2.7 Pulse Method
Vallen Visual AE data showed echoes in most diagrams while pulses were
emitted from channel 1 and channel 2. If the acquisition recorded pulses for an
extended period of time then several echoes emerged. These echoes or receiver
counterparts proved to be quite useful for analyzing particular aspects of how
the pulse effected the fiber. In reference to the existence of cracks in the
material, these pulses led to further deformation investigations. Using these
pulses established a method that could be controlled and monitored. With this
Pulse Method, in order to identify external disturbances pulses were sent
through both channels and studied. The echoes hit energy, time delay, and
amplitudes were recorded. Pulsing also illustrates the direction of the wave
propagation. In reference to the figure(indicate) below, if pulses are input from
the test load then the difference in amplitude between the two sensors appears
greater than pulses emitted from the sensor attached to the mounting bracket.
(Record amplitude diff) Also, during this particular run (refer to graph) the
reception of pulses at the top showed displayed hits of slightly different
amplitudes and energies. The pulses received at the base followed a more
linearly consistent pattern. (record amp and at what time duration)
Figure 10. Image of a Vallen Visual TR Viewer graph of a pulse sent through channel 2 (top) and recieved by
channel 1 (bottom)
40-95 (dB)
Amplitude (dB)
Figure 11. Vallen Visual AE diagram showing " hit" depicting echoes from both channel 2 and channel 1
counterparts respectively
Echo's produced with channel 2 as
source or pulse producer
Echo's produced with channel 1 as
source or pulse producer
0-750s
Time (s)
Figure 12. Vallen Visual AE display of a "hit" chart indicating the amplitude, count, energy, and
time.
2.8 Silica Bonding
As a component of understanding the fiber's behavior, exploring the bonding
capabilities is required as the fiber is too fragile for any type of welding. Gluing
the fibers as a means of attaching the fiber to the interferometer mirror is the
better option. Similar to the fused silica fiber, the bonding agent must be a clean
solution, posses ultra high vacuum compatibility, and non dissipative. Adjoining
the fiber and the mirror, an intercessor is used. This intermediary is more
commonly known as the "ear" of the construct. As seen below in figure 11, the
ear serves as a supporting block. Reconfiguring the Si-O bonds in SiO2 chains, the
silicate bonding procedure is the alternate method for attaching or "gluing"
silica fibers. This bonding procedure uses extremely pure components such as
flat surfaces, ultra-pure water, and the catalyst potassium hydroxide (KOH). The
procedure begins with hydration where a drop of a pure diluter KOH solution is
used to wet the surface being glued. Next, etching occurs from the KOH solution
because of the presence of the OH- groups. As a result of this presence, Si-O
bonds are broken and SiO32- are produced in the solution. The last step involves
dehydration. OH- strips the H+ from the silanol group on the surface forming
water. Si-OH groups dehydration produces Si-O-Si bridges. Ultimately, the SiO32chains connect the two surfaces completing the gluing procedure.
fused silica fibers
Ear
Figure 13. Images of interferometer mirror with fused silica fibers attached.
3 Experimental Results
3.1 Speed of sound
Using the Vallen Visual AE diagram, time measurements were made during
preliminary tests. Pulses were sent through the given fiber. As pulses were
received from the non pulsating piezoelectric accelerometer, reception times
were recorded. These differences in time were displayed on the Vallen Visual AE
value chart. The measured Steel wire length was .7938 m. Using the equation for
velocity and with this given length and a time delay of (number), the resultant
velocity for the speed of wire within the Steel wire was (number).
The expected value as calculated by using the young's modulus and fused silica
density.
v=
=
Likewise, this method of measurement was applied to the fused silica fiber. The
fiber length, average time delay, resultant velocity were the following: .8m,
.00029s, 2758 m/s.
Id
DSET CHAN A
R
[dB] [µs]
D CNTS E(TE) RMS THR
[µs]
PA0
FLAG HHMMSS
MSEC
NSEC
[eu] [µV] [dB] [mV] MRSFXCTAEDN [hhmmss] [ms.µs ] [ms.µs ]
La Label 1: '12.58 Resume'
DT giovedì 9 giugno 2011. Host Time: 12.58
La Label 2: '12.59 Pulsing channel: 1'
Ht
Ht
Ht
Ht
Ht
Ht
71
72
75
77
80
81
1 67.4 9.8 34.4 5 345E01 2.8 40.0 0.000 C 00.00.51 376.0556 376.055600
2 49.0 78.8 1088.0 70 752E00 8.9 40.0 0.000 c 00.00.51 376.3215 376.321500
1 67.4 9.8 34.4 5 346E01 2.7 40.0 0.313 C 00.00.52 376.4628 376.462800
2 49.0 55.6 1078.4 72 754E00 8.9 40.0 0.313 R c 00.00.52 376.7518 376.751800
1 67.4 9.8 34.4 5 345E01 2.8 40.0 0.000 C 00.00.53 376.8700 376.870000
2 49.0 75.8 1109.2 71 770E00 8.9 40.0 0.000 c 00.00.53 377.1390 377.139000
Figure 14. Vallen Visual Acoustic Emission (AE) hit information display chart. As indicated above,
these hits are a result of pulsating the accelerometer by pulsing channel 1.
3.2 Fast Fourier Transform
Two fast Fourier transform (FFT) plots were produced using the Vallen acoustic
emissions program FFT avg applet. The first plot (figure 13) represents pulses
emitted from channel 2 and the output as denoted by channel 1 is seen through the
second plot (figure 13). Another set of plots were taken in the same fashion,
however; the pulses were sent through channel 1 and received by channel 2. A ratio
of these two scenarios were taken and are being analyzed by researchers at the
University of Rome.
Figure 15. Image of FFT depicting waveform produced by pulses sent through channel 2
Figure 16. Image of FFT depicting waveform produced by pulses received through channel 1
4 Conclusion
The acoustic emission analysis of silica fibers described in this report has several applications for
understanding the properties of the fused silica fiber. With further investigations, deformations
as well as events that occur prior to a possible break in the fiber can be isolated and studied.
After shielding the piezoelectric from electromagnetic disturbances, properly securing the
cables attached to these accelerometers, and establish an even, smooth wax distribution or the
contact surface; proper silent runs can be achieved. With an insulated system, fibers can be
analyzed thoroughly and efficiently. Also, in order to reduce mechanical noise, an apparatus that
allows for a dually decoupled system may reduce virtually all sources of external noise. This
dually decoupled set up would detach both piezoelectric accelerometers from the mounting
frame. Therefore, with a decoubled system future fused silica fibers can be analyzed in
complete silence.
Acknowledgements
I would like to thank the National Science Foundation for funding this summer IREU
program, the University of Florida Physics Department for offering me this incredible
opportunity, and the University of Rome, "Sapienza" in Rome, Italy. Also, I would like to
thank Paola Puppo, Andrea Conte, Maurizio Perciballi, Ettore Majorana for helping me
throughout the course of this summer. Finally, I would like to send a special thank you
to Andrew Dwayne Spooner for scientific inspiration.
5 References
Bruel & Kjaer, Piezoelectric Accelerometers and Vibration Preamplifiers
The Vallen system AMSY-5 User Manual
P. Amico, L. Bosi, L. Carbone, L. Gammaitoni, F. Marchesoni, Michele Punturo, F.
Travasso, H. Vocca, Monolithic fused silica suspension for Virgo gravitational waves
detector Vol 73, No. 9 September 2002
Leak Detector Methods: A comparative Study of Technologies and Techniques Short
Version
Michele Punturo, Monolithic Suspension
S. Rowan, J. Hough & C.A. Cantley, Bonding & visual inspection of preliminary test ears,
July 2005