1
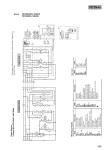
GEARRAYANALYZER
Version 1.2.31
Release date, February 16, 2002
Copyright 2002 SuperArray Inc. All right reserved. GEArray is a tradmark of
SuperArray, Inc. All other products, including but not limited toMicrosoft Windows,
Excel, Adobe Photoshop and ScanAlyze, are the tradmarks of their respective holders.
1
GEArrayAnalyzer User Manual
Table of contents
1 GETTING STARTED .......................................................................................................... 3
1.1
INTRODUCTION ................................................................................................................................ 3
1.2
SYSTEM REQUIREMENT ................................................................................................................... 3
1.3
INSTALLATION ................................................................................................................................. 3
1.4
BACKGROUND INFORMATION FOR USING THE SOFTWARE ................................................................ 4
1.4.1
Overview of data analysis....................................................................................................... 4
1.4.2
Recording your array image................................................................................................... 4
1.4.3
Converting the image file into the raw data file ..................................................................... 4
1.4.3
The Format of the Raw Data File ............................................................................................. 7
FOR USING RAW DATA TABLES IN GEARRAYANALYZER, PLEASE REFER TO
INSTRUCTION IN SECTION 2.2.4, INPUT DATA FILES.................................................................... 8
2 USING GEARRAYANALYZER .................................................................................. 9
2.1
DATA PROCESSING OPTIONS ............................................................................................................ 9
2.1.1
Background subtraction.......................................................................................................... 9
2.1.2
Normalize to Positive Controls or to the median value of the experiment.............................. 9
2.1.3
Normalizing All Experiments to Specific Experiments ......................................................... 10
2.2
STEP-WISE GUIDE FOR DATA ANALYSIS ......................................................................................... 10
2.2.1
Opening window ................................................................................................................... 10
2.2.2
Import Gene List ................................................................................................................... 10
2.2.3
Saved analysis....................................................................................................................... 11
2.2.4
New analysis ......................................................................................................................... 11
2.2.5
Data Analysis Window.......................................................................................................... 13
3 GEARRAY DATA ANALYSIS FREQUENTLY ASKED
QUESTIONS...................................................................................................................................... 16
2
1
GETTING STARTED
1.1
INTRODUCTION
Welcome to GEArrayAnalyzer™, SuperArray’s software for analyzing GEArray™ Q
series product. Starting with a raw data file, GEArrayAnalyzer can compare gene
expression profiles and generate detailed reports in a straightforward, intuitive manner.
GEArrayAnalyzer includes a carefully chosen set of options for customizing analyses and
reports that provides both versatility and simplicity.
The features include:
•
Accept any tabulated data in ASCII format and MS Excel file format.
•
Prepares reports for screen, file, or print output.
•
Displays feature identifiers, integrated intensities, population distributions, and
standard deviations.
•
Process data such as background subtraction, normalization according to gene list
or user defined criteria.
•
Allow user to define filter functions to fine tune the display of the graphics.
•
Saves full data source and preparation/normalization method for later
reconstruction of analysis
•
Reports are saved in a tab-delimited text format, which is compatible with
spreadsheet programs like Excel.
•
GEArrayAnalyzer 1.0 runs under Windows 95&98, NT4.0 and Windows 2000.
•
GEArrayAnalyzer 1.0 is free for SupperArray Customers.
1.2
SYSTEM REQUIREMENT
•
1.3
IBM PC compatible, 486 66Hz or higher (Pentium 133Hz Recommended)
•
16 MB of RAM (32 MB recommended)
•
4 MB of hard disk space (10 MB recommended for data expansion)
•
14 VGA (17 SVGA recommended) 640 X 480 Resolution
•
Windows 9x, Windows NT and Windows 2000
INSTALLATION
To install GEArrayAnalyzer software into your computer, insert CD into the computer
CD-ROM drive. Run setup.exe file under GEArrayAnalyzer directory. Follow the
screen instruction.
3
If you down-loaded the software from SuperArray’s web site (www.superarray.com).
You have to first unzip the package before you run the setup.exe file as described above.
1.4
BACKGROUND INFORMATION FOR USING THE SOFTWARE
1.4.1
Overview of data analysis
There are a number of steps user has to go through to analyze data of gene array
experiments. They generally consists of
1. Recording the array image;
2. Analyzing the array image and Converting the image file into a raw data file;
3. Analyzing the raw data file and generating tabulated or graphic results.
GEArrayAnalyzer is designed to analyze the raw data files generated by GEArray Q
series products (step 3). GEArrayAnalyzer reads the raw data file(s) provided by the user
and matches the raw data file with corresponding gene list. Therefore, to use
GEArrayAnalyzer software, user has to first convert the array image into a raw data file
that in text format or in Excel spreadsheet file format. GEArrayAnalyzer software also
provides carefully chosen options for data processing and charting. In this manual we
will discus the details of each step of data analysis.
1.4.2
Recording your array image
There are many ways you can record your GEArray image. If no other special equipment
is available, x-ray film can be used to record radioactive or non-radioactive
(chemiluminescent) labeled array. For radioactive labeled arrays, a phosporscreen can
also be used to record your array image. For chemiluminescent labeled arrays, the
alternative recording method is to utilize a CCD camera based image station to record the
array image.
1.4.3
Converting the image file into the raw data file
Once the array image is recorded in a media, the next step is to convert the array image
into a raw data file where the signal of each gene spot is converted into a number that is
corresponding to the density of the original spot. For the entire array, a grid is laid over
original image and each cell of the grid covers one spot of the original array. The density
information of each gene spot is extracted from the array image following the dimension
and the sequence defined by the grid (as shown in the following figure)
For x-ray film recorded array image, an additional step is needed to achieve this
extraction. That is to first scan the image using an image scanner to convert the
autoradiogram into an image file such as a TIFF file. Then using an image- analysis
4
software (such as ImageQuant from Molecular Dynamics or FluoChem from Alpha
Innotech Corp. or softwares of densitometers) to complete the raw data file extraction
described above.
If you are using a Digital imaging system such as a phosphorimager or a CCD camera to
record the image, you can use the software that come with imaging system to convert the
image file into digital data. For most GEArray Q series image, a grid of 8 columns x 14
rows is drawn and superimposed onto the raw image. The raw data from each cell of the
grid corresponds to one tetra-spot on the GEArrayTM Q series. The raw data table is
saved for further analysis using the GEArrayAnalyzer software.
Reverse side has printed bar
code on right side edge
Array side faces the detector
Figrue 1: Data
extraction sequence for
GEArray Q series
•
When detecting an image, make sure the array side faces detector, and the
barcode appears on the right edge of reverse side.
•
To extract the image into a raw data table, you should covert each tetraspot image into digital data starting from the upper left corner, going from
left to right to the end of the row 1, followed by the same sequence for
row 2 to row 14 as shown in figure 1.
When the data is extracted in this manner, the result table will match the gene list
provided by SuperArray. You can save the extracted raw data file in the tabulated ASCII
text file or an Excel spread sheet file format.
5
If you are using a Digital imaging system such as a phosphorimager or a CCD camera to
record the image, you can use the software that comes with the imaging system to
transform the image file into digital data. For most GEArray Q series image, a grid of 8
columns x 14 rows is drawn and superimposed onto the raw image. The raw data from
each cell of the grid corresponds to one tetra-spot on the GEArrayTM Q series. The raw
data table is saved for further analysis using the GEArrayAnalyzer software.
To convert x-ray film recorded array images into raw data files, the autoradiograms need
to be transformed into image files such as TIFF files using an image scanner, followed by
a data extraction step using an image- analysis software. Here we will describe how to
use a scanner and free software to accomplish this task.
Besides using commercial software to process image and extract data, you download
freeware or shareware from Internet. We recommend ScanAlyze developed by Michael
Eisen at Lawrence Berkeley National Lab.
Scanlyze can be downloaded at
http://www.microarrays.org/software.html. The software (executables and source code)
is free for academic and other non-profit researchers, who have to register for access.
The following is a step-wise instruction for extracting raw data files from X-ray film that
recorded the GEArray images using a scanner and the Scanlyze software.
1. Scan the image. You can use an image/document scanner to convert the
image into TIFF format. Use 200 dpi or high resolution to obtain a high
quality image file that will make the data analysis easier and more reliable.
2. Invert the image. Since the image you recorded on an X-ray film is a
negative image (the background is white, the signal is black), it has to be
inverted (the background is black, the signal is white) before data
extraction. The reason for image inversion is: for a negative image, the
white background has the maximum value (256 for a 8-bit image) and the
black signal has the value of 0. An image inversion will make the
background to be black (value 0) and signal to be white (maximum value).
The data extracted from such file will reflect the experimental results.
Some image processing software can invert the image for you. For
example, you can use Adobe Photoshop to open you image file; press
“Ctrl + I” key (or select under the menu bar: Image/Adjust/Invert) to
invert the image. The inverted image file can be then analyzed with
Scanlyze program. You can still work with the image using Scanlyze
even if you do not have access to commercial image processing software,
but keep in mind that the raw data extracted from a negative image has to
be inverted before data analysis. To invert the data in the raw data file,
you have to open the raw data file in a spreadsheet, and do the following
subtraction: Inverted data value = 256 – CH1I (channel 1 intensity) for 8
bits grayscale image or Inverted data value = 65536 – CH1I for 16 bits
grayscale image.
3. Analyze the image with Scanlyze. This program is designed for data
analysis of fluorescence image obtained from microarray experiments.
Therefore it expects two super-imposable images (channel 1 and 2)
6
reflecting 2 fluorescence images of the same microarray slide. For
analyzing GEArray images that only have one color, you can load the
same image into both channels. If the signal is too weak to see, you have
to adjust the "gain" parameter on the ‘image control’ window to make it
visible. After you obtain a satisfactory image, the next step is to draw a
grid to overlay onto your array image. You can create a new grid with 8
column and 14 rows, 20 pixels for both spot height and width (for a 200
dpi image, if the image has different resolution, you may have to change
the size of the spot). Adjust the size, location and the individual spot to fit
your array image. Then click "Save data" on Grid control panel and your
data will be extracted into a tab-delimited text file. The data column
“CH1I” (channel 1 intensity) contains the data that can be further analyzed
in other software (such as GEArrayAnalyzer).
1.4.3
The Format of the Raw Data File
The raw data files generated from different image analysis software varies greatly in
format. Therefore before using them in GEArrayAnalyzer, view and edit the raw data
file in a spreadsheet program to make sure that the raw data files conform the standards
described below and save the raw data as a tab delimited file or as a sheet in a excel file.
•
•
The data file should have one row of column heading.
The data file should contain the right number rows of data (equals to number of
genes on the GEArray products).
• There is no blank row(s) between heading row and data rows.
• The raw data file can be saved as a tab-delimited text file. In this case multiple
data sets are saved as multiple text files.
• Alternatively, multiple data sets can be saved as multiple data sheets in a
Microsoft Excel 4.0 or 5.0 workbook.
(Keep in mind that GEArrayAnalyzer can take either multiple text data file or one
Excel file that contains multiple sheets as the data source. The program cannot read
both text file and Excel file at the same time.)
Different image analysis progem will generate different kinds of data tables with different
columns, titles and etc. But as long as you know which column contains raw data in your
data table and process the table according to the described rules, you can use those tables
in GEArrayAnalyzer program. The following is an example raw data tables generated by
FluoChem and ScanAlyze programs (other program will generate different data table
with different columns):
7
FluoChem data table:
#
1n
2n
3n
4n
…
112n
IDV
14472911
4057614
4516602
5157221
…
8678544
Title row
%*
1.8
0.5
0.6
0.7
…
1.1
AREA
529
506
529
529
…
552
AVG
27359
8019
8538
9749
…
15722
The number of
Data rows should
equal to 56 for
GEArray product,
112 for Q series
GEArray
products
0
0
0
0
…
0
Rows to be removed
ScanAnalyze data table:
HEADER SPOT
BACK
TOP LEFT BOT RIGHT ROW COL CH1I
GRID
CH1B
CH1AB
……
REMARK SOFTWARE ScanAlyze
……
REMARK SOFTVERS
……
2.44
REMARK CH1 IMAGE 24_3R
……
REMARK CH2 IMAGE 24_3R
……
REMARK GRID FILE
……
REMARK DATE
1/8/2002
……
REMARK TIME
########
……
SPOT
1
1
87
135
107
155
1
1 15043 13312 13352
……
SPOT
2
1
87
161
107
181
1
2 13062 13056 13178
……
SPOT
3
1
87
187
107
207
1
3 13086 13312 13397
……
SPOT
4
1
87
213
107
233
1
4 15069 14592 14647
……
SPOT
5
1
87
239
107
259
1
5 19667 16128 16078
……
SPOT
6
1
87
265
107
285
1
6 19083 18688 18823
……
SPOT
7
1
87
291
107
311
1
7 28027 24576 24743
……
SPOT
8
1
87
317
107
337
1
8 35248 30208 30125
……
……
SPOT
……
112
…… …… …… ……
1 139
161
159
……
……
2 16025 18432 19497
……
…… …… ……
181
3
……
……
For using raw data tables in GEArrayAnalyzer, please refer to instruction in section 2.2.4,
Input data files.
8
2
USING GEArrayAnalyzer
Now that all the image files are converted into raw data files. It is time to use the
GEArrayAnalyzer software. In this section we will first discuss the definition of data
processing options used in this software, and then we will walk you step by step through
the program operation.
2.1 DATA PROCESSING OPTIONS
There are three data processing options available in GEArrayAnalyzer:
• Background subtraction
• Normalize to Positive Controls for an Experiment
• Normalize all Experiments to a Single Experiment
You can follow the directions in any or all of these section, as appropriate, to normalize
your data
2.1.1
Background subtraction
If you have any genes designated as negative controls on your array (usually, you can
designate the plasmid DNA (PUC18) negative controls), you can normalize the data
using this information. This manipulation removes the background from the experimental
readings by giving you a general idea of the lowest amount of exposure possible for
signals taken from a particular array and then subtracting this amount from your raw
experimental results. The following equation is used:
(the signal strength of gene A in experiment X)
- ( the average of the negative controls in experiment X)
2.1.2
Normalize to Positive Controls or to the median value of the experiment
This normalization method is intended to remove the differences in amount of exposure
between experiments, providing you with a baseline so different experiments are
comparable to one another. Positive controls give you a general idea of how well the
array responded to exposure. Normalizing to positive controls will factor in this
information with the experimental results you analyze. You can normalize your data with
this method if you have genes designated as positive controls on your array. Or
alternatively, you can use normalize against the median value of the experiment.
the signal strength of gene A in experiment X
the average signal of the positive controls in experiment X
9
or
the signal strength of gene A in experiment X
the median signal of the experiment X
2.1.3
Normalizing All Experiments to Specific Experiments
This normalization option is intended to remove differing intensity scales from the
experimental readings by comparing all of the experiments to one or more specific
experiments. The equation for this is:
the signal strength of gene A in experiment X
the signal strength of gene A in the control experiments
2.2
STEP-WISE GUIDE FOR DATA ANALYSIS
Launch the GEArrayAnalyzer program by clicking start botton on lower-left corner of
the window, the GEArrayAnalyzer program should be listed under programs category.
Or alternatively, if you have a shortcut on the desktop, double click the
GEArrayAnalyzer icon.
2.2.1
Opening window
You are prompted with three types of operations at the opening window.
1. New Analysis Click New Analysis button to begin a new analysis.
2. Saved Analysis Click Saved Analysis button to open a saved result file. You
can modify the parameters and perform new analysis.
3. Import New Gene List File Click Import New Gene List File button to import a
gene list. The gene information will be sorted and stored in a gene file
repository. The provided gene list can be re-called according to species and
product.
2.2.2
Import Gene List
This operation allows you to import new gene list from SuperArray when a new GEArray
product become available. The program will read the new gene list and incorporated into
10
the program. Once you have done that, you can use the program to analyze the data from
new GEArray product.
1. Select the gene list file you wish to import from the dialog box.
2. The program will automatically read the file and add the list to the collection of
gene lists for the future use.
3. Click OK button to allow the gene list to be deposit into the gene list repository.
2.2.3
Saved analysis
This operation allows you to re-open saved analysis. Once a new analysis is completed.
You have the option to print out graphic charts the program generated or save the whole
analysis for later viewing.
2.2.4
New analysis
After array image is analyzed by a image-analysis software, the raw data extracted from
the image can be saved in text file or a Microsoft Excel file. The raw data files for
different array images can be saved in different text files or can be saved in one Excel
file. The GEArrayAnalyzer can import either text file or Excel file for analysis.
Input Data Files
The 1st step of the data analysis process is to input raw data files that extracts from your
GEArray images. As a general rule, the GEArrayAnalyzer takes either one Excel
(Version 5.0/95) file or multiple tab-delimited text files as data files. You cannot use
both Excel file and text files in one analysis.
If you use one Excel workbook as the raw data table source that contains all the raw
data tables, the Excel file should contain at least two worksheets (you can have more than
two data sheet if your experiment use more than 2 membranes), each worksheet contain a
raw data table from one array. You should know the name of the column that contains
the data to be analyzed. If the data column has a name other than “IDV”, you have to
specify it in the program.
If you use tab-delimited text file as the raw data table source, you should have at least
two (or more) text files to be analyzed. All text files should have the same table format.
If the data column has a name other than “IDV”, you have to specify it in the program.
1. Choose a directory where the data files are located. A default path is provided by
the environment setup.
2. Select a data files by clicking the file name. Use select (-->) deselect (<--)
buttons, or double click for quick selection, use shift, ctrl key for multi-selection.
11
3. Select data columns: The default column name is “IDV” (stands for Integrated
Density Value) that is used by some image analyzing software as the data column
heading (the default column name can be changed by changing program setting in
GearrayAnalyzer.ini file under Windows directory). You can also specify the
data column manually by clicking manual column selection button (for detail see
Column Selection).
4. Select control group: One of the experiment data set is chosen as the control
group (to be subtract from or divided by) during the data analysis. The default
control group is the 1st data set imported. You specify it manually by selecting
from the dropdown list.
5. Click OK button proceed, or Cancel to quit
Note: You have to input more than 2 data files before you proceed with the data analysis.
Column Selection
Since most raw data tables (files) contain multiple data columns, GEArrayAnalyzer needs
to know which column is the data column. The default column name is “IDV” (stands
for Integrated Density Value) that is used by some image analyzing software as the data
column heading. If your raw data files contain data column that is named differently, you
have to specify the data column manually by:
1. Click Manual Column Selection button in Data Input Dialogue Window.
2. You will be prompted with Column Setup Window. Use menu to add or delete a
data sheet.
3. Use cut/paste to modify large portion of data between each data sheet.
4. Double click or choose from menu selection to select a data column.
For example if you are using a FluoChem generated data table you can either select
“IDV” column (integrated density value) or “AVG” (average density) as the data
column to be analyzed.
Select either one
of those columns
for analysis
1n
2n
3n
4n
…
112n
IDV
14472911
4057614
4516602
5157221
…
8678544
%*
1.8
0.5
0.6
0.7
…
1.1
AREA
529
506
529
529
…
552
AVG
27359
8019
8538
9749
…
15722
BACK
0
0
0
0
…
0
12
PARAMETER SETUP WINDOW
Please also see section 2.1 for the description of the parameters
1. Background subtraction:
There are three option for background subtraction:
•
Select Gene List to subtract background by a value of specified gene chosen
from the gene list, chose a gene by using the dropdown list;
•
Select Minimum Value for subtraction by the minimum value of the data set;
•
Select None for no background subtraction.
2. Normalization Options:
•
Select Gene List for normalization by a gene list, then select an item from the
combo box;
•
Select Median Value for normalization by the median value of the data set;
•
Select None for no normalization.
When you finished your parameter set up, click OK button to proceed to the next
window.
2.2.5
Data Analysis Window
The data analysis window is a collection of multiple sheets representing the multiple
steps during the Data processing. After user has specified the raw data files, the gene list
file and other data processing options, the program will perform a series processing steps
to get the final result. All those steps are displayed as a series of data sheets in data
analysis window as the following:
1. Raw Data: contains data imported from the data files and gene information
obtained from the gene list file user specified.
2. Consolidation: duplicate data are consolidated into an average value and aligned
with the gene list file.
3. Subtraction: background subtraction operation according to the option in
Parameter. (see also section 2.1 for the description)
4. Normalization: normalization operation according to the option in Parameter.
(see also section 2.1 for the description)
13
5. Report: The report sheet contains both gene annotation information and you
experimental data. The data portion of this sheet features:
•
Processed data sets (background subtracted, normalized): The data sets are
labeled as “Exp.1, Exp.2 … Exp.X” according to the sequence by which the text
files are imported into GEArrayAnalyzer. If the data file is an Excel file, the data
sets are labeled as the original order in the Excel file.
•
Data set comparison that includes
o Difference (subtraction) between the experiment sets and the control data
set.
o Ratio between the experiment data set and the control data sets
o Average of processed data sets (designed for repeating experiments).
o The standard deviation of the average.
You can double or right click on any applicable cell to apply filter function to the
column. The result will only affect the charts that use these columns.
6. Chart: Visual representation of the analytic results. The software provides
different chart options to visualize the processed data sets.
•
Differential Bar Chart, the bar chart to display the difference between the
experiment data set and control data set. The y axis is the difference, the x axis is
the category axis of data series. If in the analysis there are more than one
comparison between the data sets, different color bars are used. The legend is
listed below the chart.
•
Ratio Bar Chart, the bar chart to display the ratio between the experiment data set
and control data set. The y axis is the ratio, the x axis is the category axis of data
series. If in the analysis there are multiple comparisons between the data sets,
different color bars are used. The legend is listed below the chart.
•
Population Graph, all processed data are displayed in this scatter chart. Different
data sets are shown in different color.
•
Population Plot, similar to population graph where bars are used to display the
value instead of symbols.
•
Gray Scale Density Plot, the raw data are displayed in the original array format.
The data value is shown in a gray scale where black represent the largest data
value, white is the minimal value, different grade of grays represent the
intermediate values.
•
Pseudo Color Comparison Plot, similar to the gray scale density plot in format,
instead of showing the individual values of particular data set, pseudo color plot
14
using a color gradient to represent the comparison value between the data set
(difference or ratio).
You can use the small arrow buttons at the lower left corner of the window to navigate
through different sheets. You can also navigate by clicking the tab below the sheets. The
sheets you will use most are the report sheet and chart sheet.
Filter function:
Under the chart buttons on the chart sheet there are two or more buttons that are used to
apply filter onto the data set comparisons. A filter is a process with which certain criteria
is applied to the data comparison value set, only those values that satisfy the filter criteria
will be displayed in the report (sheet) or charts. For example, if you would like to look at
the genes where there is 2 fold change of expression level between experiment 2 and
experiment 1 (the control data set), you will have to use a filter like the following:
For any given gene if
Exp. 2
Exp. 2
2 Or
0.5
Exp. 1
Exp. 1
The resulting sub-data set will include those genes with 2-fold expression change
between experiment 1 and experiment 2. In GEArrayAnalyzer program, you can achieve
this by first clicking the Exp2/Exp1 button on chart sheet, then filling the values and
choose “or” button then clicking OK. You can also call the same filter function in the
report sheet. In report sheet, you can navigate to the column where the values of data
comparison is located, double click the column or double click the shaded cell on the
bottom of the column, that will bring up the same filter function window.
Other buttons in data analysis window
There are a row of function buttons on the bottom of the data analysis window:
•
OK button, to quit and exit the program
•
Save button, to save current data analysis as .saz file that you can open in the
future.
•
Export data button, to export all sheets in data analysis window to a Microsoft
Excel file.
•
Print button, to print out the current sheet in data analysis window.
•
Cancel button, to go back to previous window (parameter set up). In
GEArrayAnalyzer program Cancel button can be used in all windows to navigate
back to the previous window.
Please send write your comment/suggestion to [email protected]. Thank you for
using GEArrayAnalyzer.
15
3
GEARRAY DATA ANALYSIS FREQUENTLY ASKED QUESTIONS
How do I analyze my GEArray data without any special equipment?
Please refer to the user’s manual for GEArray analyzer for the discussion and the
step-wise instruction. Briefly, the GEArray image can be recorded with x-ray film, the
image can be scanned with a desktop scanner, and then the digital image is processed by
using a free image analysis program such as ScanAlyze (can be down-loaded from
http://www.microarrays.org/software.html) to produce a raw data file. The raw data file
is analyzed by GEArrayAnalyzer program (free down-load from our web site).
What kind of parameters should I set when I scan my X-ray film image?
When you scan your X-ray film image, try to use high resolution to scan the
image (200 pixels/inch or higher) and scan the image into a grayscale (8 bits or 16 bits)
TIFF file.
What software I can use to analyze my array image and where I can obtain those
software programs?
Since GEArray is not a high-density array, you have a number of options. One
way is to use software that comes with image station such as phosphoimager or CCD
camera based imaging system (ImageQuant by Molecular Dynamics, FluorChem by
AlphaInnoTech.). Alternatively, you can down load a free image analysis program
ScanAlyze developed by Michael Eisen at http://www.microarrays.org/software.html for
this purpose.
Why Scanalyze program cannot load my scanned image? Or when I loaded the
image into ScanAlyze, it did not look like the original image any more.
One possible reason for that is your image is not a gray scale image. Scanalyze cannot
read color images. ScanAlyze will load grayscale 8 or 16 bit TIFF file as the source
image file. For other technical problems please refer to the user manual of ScanAlyze.
How can load my data into GEArrayAnalyzer? Or what is the requirement for data
files used by GEArrayAnalyzer?
Before you load your data file into GEArrayAnalyzer, you have to make sure the
data file does not contain any extra-row besides title row and data raws. That is to say,
your data file should only contain one title row on the top and data rows (57 rows total
for GEArray, 113 rows for Q series). You can clean your raw data table using a
spreadsheet program such as Excel.
GEArrayAnalyzer reads two kinds of data files, one is tab-delimited text file; the
other kind is the Microsoft Excel 95 (version 5) workbook. If you use text files as your
data files, each text file should only contain one set of data (dataset from one array
image). The GEArrayAnalyzer program requires at least 2 text files to proceed. If you
use Excel option, first you have to make sure your file is in Excel 95 version, secondly
you have put all your data sets into different worksheets within one Excel file. In
summary, your have to either use multiple ( 2) sets of tab-delimited text files or a single
16
Excel file that contains multiple sheets as you data source for GEArrayAnalyzer. The
program cannot handle both text file and Excel file at the same time.
How can I analyze my data if the gene list for the GEArray product I am using is
not listed in GEArrayAnalyzer?
You have to either download the latest release of the GEArrayAnalyzer or
download the new genelist and import it into the program by yourself.
After I downloaded and installed GEArrayAnalyzer program, when I tried to
launch it, I got a error message of “Runtime error 75:The specific path/file name
cannot be accessed …”. What should I do?
This message arises when the program installed a different directory other than
the default directory. Remove the installed program and re-install it using default
directory provided by the program.
17