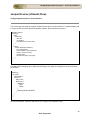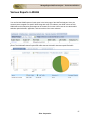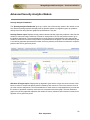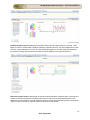
1
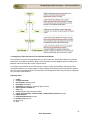
ManageEngine NetFlow Analyzer – Professional Edition
holding the mouse down, drag it to the point(time period), you wish to further drill down to. For example :
Having chosen a Last week report you could choose to study two specific days by selecting them. You
could further drill down on until the time period you have chosen is more than 1 minute. Click on "reset
graph" link to take you to a time period depending on the time difference between the From time and the
system time.
Illustration
If you choose Last Hour Report at 18:15 hours, then a graph with a plot of data from 17:15 to 18:15 is
shown. If you choose the time period 17: 25 to 17:50 then a corresponding graph with 1 Minute Average
is shown. When you click on the "reset graph" link the screen changes to the Last Hour report. ( as the
time difference between the From Time 17:25 and system time 18:20 is less than 1 hour)
Thus depending on the time difference you are either taken to the Last Hour or Last Day or Last Week or
Last Month or Last Quarter graph
WAN RTT Monitor
The WAN RTT monitor that is configured using IP group management can be viewed here. The graph
shows the average round trip time graph of the IP group created. The dial is also a representation of the
average RTT. The detailed statistics of the monitor can be viewed using WAN RTT monitor module.
72
Zoho Corporation