1
Full Service Partnership (FSP)
Data Collection & Reporting (DCR)
Data Analysis Training
Training Slides and Presenter’s Notes for
Analyzing Data and Creating Reports from DCR
Data Extracts
The following document was funded by the Mental Health Services Oversight and
Accountability Commission.
4/20/2012
----------------------------------------------- FSP DCR Data Analysis Training -----------------------------------------------
Table of Contents (click to hyperlink to section)
Acknowledgements
Definitions and Abbreviations
Introduction
FSP Data Analysis Training Slides
Training Overview
Reference Materials
Downloading FSP Data from DCR
Section Overview
Downloading Files
File Types
Importing CSV Files into PLD Templates
Section Overview
PLD Templates Overview
Encryption
Importing New Data
Generating Standard Reports in PLD Templates
Section Overview
Browse Partner Data Template
Run Partner Report Template
Application Notes to Create New Reports in PLD Templates
Section Overview
Application Notes Overview
Before Creating a New Report
Working in Microsoft Access
Steps to Create Application Note #1
Using Microsoft Excel to Analyze FSP Data
User Resources
Page 1 of 128
2
3
4
5
6
7
11
12
14
16
18
19
20
26
27
37
38
39
58
71
72
73
77
87
88
120
127
----------------------------------------------- FSP DCR Data Analysis Training -----------------------------------------------
Acknowledgements
We would like to acknowledge the input and materials from various people and organizations.
Many documents created by the California Department of Mental Health (DMH) were used as
sources and resources for the production of this training.
Due to the Governor’s Proposed Budget for FY 2012-13 to eliminate the Department of Mental
Health (DMH), MHSA programs and functions will be transferred to other departments. It is
proposed that the DCR system will be administered by another department. Since this
document was developed at the time DMH maintained the DCR system, DMH is named in the
references and links throughout this document. Because the new state entity is not known,
whenever “DMH” is used in this document it is intended to also include the new state entity
that will take on DMH’s responsibilities.
Page 2 of 128
----------------------------------------------- FSP DCR Data Analysis Training -----------------------------------------------
Definitions and Abbreviations
Term
3M
ADL
Adult
BPD
CA-RW
Child/Youth
CSI
CSV
DCR
DMH
FSP
FY
HIPAA
IADL
IIF
ITWS
KET
MH
MHSA
MHP
Older Adult
PAF
PHI
PLD
Partner
RO
RPR
RW
SB
SQL
SSA
TAY
TOC
Meaning
Quarterly Assessment
Activities of Daily Living
Adults of Ages 26 - 59
Browse Partner Data
County Administrator, Read/Write
Children of Ages 0 - 15
Client Services Information
Comma-Separated Values
Data Collection and Reporting
California Department of Mental Health
Full Service Partnership
Fiscal Year
Health Insurance Portability and Accountability Act
Instrumental Activities of Daily Living
Immediate If Function
Information Technology Web Services
Key Event Tracking
Mental Health
Mental Health Services Act
Mental Health Plan
Older Adults of Ages 60+
Partnership Assessment Form
Protected Health Information
Partner-Level Data
A Client of the Full Service Partnership
Read Only
Run Partner Report
Read/Write
Security Breach
Structured Query Language
State System Administrator
Transitional Age Youth (Ages 16 – 25)
Table of Contents
Page 3 of 128
----------------------------------------------- FSP DCR Data Analysis Training -----------------------------------------------
Introduction
This training curriculum is designed to be used as a tool for training staff to use the DCR data
extract files to evaluate and analyze FSP data. Trainers can use the PowerPoint presentations
available together with this document’s presenter’s notes to perform employee trainings.
Alternatively, employees can follow this manual’s slide handouts with text narrative for guided
self-instruction to perform the analyses.
This training curriculum covers aspects related to extracting data from the DCR, importing data
into Microsoft Access or Microsoft Excel, and building analyses and reports. A separate training
curriculum addresses using the features of the FSP DCR to submit FSP data.
This training curriculum is intended for any person who utilizes the FSP DCR data extracts. This
training requires users to download the Partner Level Data (PLD) Templates from the
Information Technology Web Services (ITWS) website and is best suited for analysts who have
general knowledge of Microsoft Excel, Microsoft Access and the formulas used by these
applications. An outline of the training curriculum appears below.
FSP Data Analysis Training Curriculum Outline:
o Downloading FSP DCR Data
Data Extraction
Overview of DCR Data Extract Files
o Utilizing the Partner-Level Report Templates
Importing New Data
Utilizing the Browse Partner Template
Utilizing the Run Partner Report Template
o Developing the Analytical Report in Access from Application Note #1
Creating Supporting Queries
Basic Statistical Analysis Formulas
Presenting Data in a Report
o Developing the Analytical Report in Excel from Application Note #1
Creating New Fields
Generating a Pivot Table
Statistical Measures by Partner
Statistical Measures for All
Page 4 of 128
----------------------------------------------- FSP DCR Data Analysis Training -----------------------------------------------
Page 5 of 128
----------------------------------------------- FSP DCR Data Analysis Training -----------------------------------------------
This training covers these main areas of the FSP DCR User Manual (completed 1/17/2012) , the Partner‐Level Data (PLD) Templates User Manual (completed 1/19/2012) and the Application Notes (completed 4/5/2012).
Page 6 of 128
----------------------------------------------- FSP DCR Data Analysis Training -----------------------------------------------
An updated version of the FSP DCR Data Dictionary was completed on 9/15/2011, and it can be accessed on ITWS through the MHSA Information menu, by selecting the Technical Information submenu and then clicking to download the FSP DCR Data Dictionary. Page 7 of 128
----------------------------------------------- FSP DCR Data Analysis Training -----------------------------------------------
A FSP DCR User Manual was created on 1/17/2012, and it can be accessed on ITWS through the MHSA Information menu, by selecting the User Manuals and Instructions submenu and then clicking to download the DCR User Manual.
Page 8 of 128
----------------------------------------------- FSP DCR Data Analysis Training -----------------------------------------------
Partner Level Data Templates were created on 1/19/2012, and the Access Database and User Manual can be accessed on ITWS through the MHSA Information menu, by selecting the User Manuals and Instructions submenu and then clicking to download the DCR Client‐Level Report Template.
Page 9 of 128
----------------------------------------------- FSP DCR Data Analysis Training -----------------------------------------------
An Application Notes document with instruction for using Microsoft Excel and Microsoft Access to create reports from FSP data downloads was created on 4/5/2012, and the document can be accessed on ITWS through the MHSA Information menu, by selecting the User Manuals and Instructions submenu. (Note: The document had not been posted at the time of this publication.)
Page 10 of 128
----------------------------------------------- FSP DCR Data Analysis Training -----------------------------------------------
Page 11 of 128
----------------------------------------------- FSP DCR Data Analysis Training -----------------------------------------------
This section covers downloading CSV and XML file types.
Page 12 of 128
----------------------------------------------- FSP DCR Data Analysis Training -----------------------------------------------
The FSP DCR offers a function for users with the CA‐RW role to download all of the partner data to which they have access through their group. The data can be downloaded as XML or CSV files. The XML data downloads into three files (a PAF, a KET and a 3M file). The CSV data downloads into four files (a PAF Non‐Residential with all domains EXCEPT Residential, a PAF Residential with residential domain information only, a KET and a 3M file). The XML or CSV files can then be used to perform data analysis and data reporting in other applications such as MS Excel, MS Access, SPSS or SAS. Page 13 of 128
----------------------------------------------- FSP DCR Data Analysis Training -----------------------------------------------
As seen in this slide, navigate to the Admin menu and Download FSP Data Files submenu, and select the New Download button.
Refer to the FSP DCR User Manual (completed 1/17/2012) at Chapter 12 “Data Extraction” beginning on page 155 for step‐by‐step instructions.
Page 14 of 128
----------------------------------------------- FSP DCR Data Analysis Training -----------------------------------------------
As seen in this slide as step 3, select the “CSV Flat File” or “XML” file type from the Download Format drop‐down box. Make a selection in the Form Type drop‐down box to select one of the available forms to include in the download. As seen in this slide as step 4, enter a date range for data to be returned. The date range for the PAF restricts records based on Partnership Date. The date range for the KET and 3M records restricts based on the date the form was completed (Date Completed field). If a date range is not entered, all data will be returned. As seen in this slide as step 5, select the Run button to return the file. You will notice that the web browser will indicate the request is running. It may take several minutes for the data file to download. Currently, the FSP DCR will only support downloads of files of approximately < 40 MB. Larger files may cause the FSP DCR to produce an error after several minutes. Reduce the size of the file by restricting to a smaller date range, and retry the download.
Save the file, and return to the menu to download the other data files. For XML file type, download 3 files including the PAF, KET and 3M. For CSV file type, download 4 files
including the PAF‐Residential, PAF‐Non‐Residential, KET and 3M.
Refer to the FSP DCR User Manual (completed 1/17/2012) at Chapter 12 “Data Extraction” beginning on page 155 for step‐by‐step instructions.
Page 15 of 128
----------------------------------------------- FSP DCR Data Analysis Training -----------------------------------------------
This slide displays an example of the CSV file contents opened in the Notepad application.
Page 16 of 128
----------------------------------------------- FSP DCR Data Analysis Training -----------------------------------------------
This slide displays an example of the SML file contents opened in the Notepad application.
Page 17 of 128
----------------------------------------------- FSP DCR Data Analysis Training -----------------------------------------------
Page 18 of 128
----------------------------------------------- FSP DCR Data Analysis Training -----------------------------------------------
This section covers an overview, encryption and data importing for the PLD Templates.
Page 19 of 128
----------------------------------------------- FSP DCR Data Analysis Training -----------------------------------------------
The Partner‐Level Data (PLD) Templates act as a data extract warehouse and provide fully defined tables to which the DCR CSV files can be easily imported. The PLD Templates also provide tools and instructions to facilitate the import of the DCR CSV files into Microsoft Access. The PLD Templates contain pre‐defined tables which incorporate the coding values for the fields within the CSV files, according to the DCR FSP Data Dictionary. The PLD Templates also include dimension tables which can be used to translate the coding values within the FSP data fields into useful terms and categories. All of these tables are defined already for users utilizing the PLD Templates. The PLD Templates also provide an automated process for clearing and updating data for new DCR CSV downloads. The PLD Templates are designed to provide a comprehensive summary of a partner’s Full Service Partnership (FSP) Data Collection and Reporting System (DCR) partnership data for the purposes of data quality. The PLD Templates display and organize domain data for the partnership’s current status and history in the last 12 months before joining the FSP. (Information on the time prior to the last 12 months before joining the FSP is not included in these templates.) All administrative changes, such as program or coordinator changes, are also displayed within PLD Templates. The Application Notes covered later in this training will exemplify how the PLD Templates provide an environment for creating new reports from the FSP data files.
Page 20 of 128
----------------------------------------------- FSP DCR Data Analysis Training -----------------------------------------------
When the PLD Templates file is first opened, a front page is displayed. From the front page, there are two main templates which can be accessed through the PLD Templates. There is also a section for clearing the old data extract and importing a new data extract.
The two templates available in the PLD Templates are:
1. Browse Partner Data (BPD) Template 2. Run Partner Report (RPR) Template Page 21 of 128
----------------------------------------------- FSP DCR Data Analysis Training -----------------------------------------------
The BPD template allows users to browse through the data of all of the partnerships. As seen in this slide, the BPD template displays an overview of the partnership information and a tab for each domain. By selecting each tab, users can review all of the FSP data reported for a partnership. Alternatively, users can select one tab of domain information, such as the D5: Legal domain for example, and then scroll through each partnership to browse just the data reported for that domain (e.g., legal) for each partnership. Page 22 of 128
----------------------------------------------- FSP DCR Data Analysis Training -----------------------------------------------
There are four buttons on the front page to access the BPD Template, which will help filter the number of partnerships displayed in the template. The Four Ways to Access the BPD Template: 1. Browse All Partners displays all partnerships downloaded from the FSP DCR. 2. Find All Partners’ Data for a Coordinator displays all partnerships for a coordinator based on entering any part of the coordinator ID. 3. Find a Partner’s Data – Search by ID displays the partnership data for a partner by CSI number or by FSP DCR Global ID. 4. Find a Partner’s Data – Search by Name displays the partnership data for a partner based on entering any part of a partner’s name. Page 23 of 128
----------------------------------------------- FSP DCR Data Analysis Training -----------------------------------------------
The RPR template produces a printable report of one partnership’s data. As seen in this slide, the RPR template displays an overview of the partnership information in a multi‐page report which is separated into sections by domain. Page 24 of 128
----------------------------------------------- FSP DCR Data Analysis Training -----------------------------------------------
Users can choose to view the partnership report online, print the report or save a PDF of the report on their secure drive/network. A user must have available either the CSI number or the Global ID of a partnership in order to access this template. There are two buttons to launch the RPR template. The Two Ways to Access the RPR Template: 1. View Partner Report – Search by ID: Displays a printable partnership data report for a partnership by CSI number or by FSP DCR Global ID. 2. Export PDF Report – Search by ID: Saves a partnership data report as a PDF at a chosen location on the user’s drive/network. Page 25 of 128
----------------------------------------------- FSP DCR Data Analysis Training -----------------------------------------------
The PLD templates come empty of data and equipped with an encrypted password, which will be provided to each Mental Health Director. The encrypted password can be changed. It is most efficient to decrypt and re‐encrypt the PLD templates when they are clear of data. Refer to the PLD Templates User Manual (completed 1/19/2012) at Chapter 1 “Changing the Encrypted Password” beginning on page 10 for step‐by‐step instructions.
Page 26 of 128
----------------------------------------------- FSP DCR Data Analysis Training -----------------------------------------------
As mentioned previously, the PLD Templates come empty of data. It is recommended that users store an empty copy of the PLD Templates as a backup in the event that Microsoft Access file corruption issues arise while utilizing the PLD Templates. The PLD Templates are designed for use with the DCR CSV files, which can be downloaded from the online FSP DCR. Users must use the downloaded data files from the online FSP DCR application. The PLD Templates are designed to work with one entire set of the four downloaded FSP DCR CSV files (PAF Residence, PAF Non‐Residence, KET and 3M) at a time. Therefore, when a new updated set of files is downloaded for use with the templates, the old data must be cleared from the database. With the PLD Template open in Microsoft Access, as seen in this slide, select the Instructions button from the front page.
Page 27 of 128
----------------------------------------------- FSP DCR Data Analysis Training -----------------------------------------------
After opening the instructions for importing new data, perform Step 1 from the instructions to clear the data from the database. By selecting the [>> Clear Data <<] button, a macro will run to clear all of the existing data in the database. If no data exists in the database, performing this step will not harm the PLD Templates. As seen in this slide, a pop‐up message will alert you when the process is complete.
Note: Existing data must be cleared before using the PLD Templates with new data downloads. If it is desired to use the PLD Templates with both the historic and current sets of downloaded DCR CSV files, then a copy of the PLD Templates file can be made before clearing the historic data such that one file will contain the historic data and the other will be cleared and used to import the current data. Page 28 of 128
----------------------------------------------- FSP DCR Data Analysis Training -----------------------------------------------
Perform Step 2 to compact and repair the empty PLD Templates. Microsoft Access may close the Instructions tab during the compact and repair process. Simply re‐open the tab by selecting the Instructions button on the front page and continue the data import process. Page 29 of 128
----------------------------------------------- FSP DCR Data Analysis Training -----------------------------------------------
Perform Step 3 to import the current data files of FSP DCR data. Select from the menu External Data and then Text File in the Import & Link section. Page 30 of 128
----------------------------------------------- FSP DCR Data Analysis Training -----------------------------------------------
As seen in this slide, select Browse to locate the PAF‐Residential file you downloaded from ITWS to your drive/network. Select to append the data to the existing [DCR_PAFRes] table from the drop‐down menu. Select OK.
Page 31 of 128
----------------------------------------------- FSP DCR Data Analysis Training -----------------------------------------------
As seen in this slide, select the Delimited toggle in the following screen. Select Next.
Page 32 of 128
----------------------------------------------- FSP DCR Data Analysis Training -----------------------------------------------
As seen in this slide, select the Comma radio button, check the First Row Contains Field Names box, and set the Text Qualifier to the quotes symbol. Select Finish.
Page 33 of 128
----------------------------------------------- FSP DCR Data Analysis Training -----------------------------------------------
As seen in this slide, after each file is imported, a pop‐up screen will alert you that the process is complete. The pop‐up screen will also alert you if any errors were present in the import. Any errors from the data import will be saved in a table noted on the pop‐up screen. (It is not necessary to save import steps.)
Note: The “CreatedDate” from the 3M CSV file may be corrupt in the FSP DCR data downloaded file. Although all of the other fields will import correctly, the “CreatedDate” field may not import with each 3M record. This is okay and it will not affect the use of the PLD Templates. If this occurs, the pop‐up screen will alert you that there were errors on import, and the table of errors can be reviewed. A review of the table of errors will show that the only field with error was the “CreatedDate” field because of a “Type Conversion Failure”. Errors that occur during data import can be reviewed in the Microsoft Access table generated from the import process. Refer to the PLD Templates User Manual (completed 1/19/2012) at Chapter 2 at the section “Reviewing Data Import Errors” beginning on page 19 for step‐by‐step instructions.
Page 34 of 128
----------------------------------------------- FSP DCR Data Analysis Training -----------------------------------------------
Step 3 will be repeated until all four CSV files have been uploaded into the appropriate tables in the PLD Templates: • Import the PAF Residential File into the [DCR_PAFRes] table • Import the PAF Non‐residential file into the [DCR_PAFnonRes] table • Import the KET file into the [DCR_KETs] table • Import the 3M file into the [DCR_3M] table Page 35 of 128
----------------------------------------------- FSP DCR Data Analysis Training -----------------------------------------------
Perform Step 4 by selecting the [>> Run Update <<] button. This will run a macro which will make the data available to the templates. When prompted, enter the date the data was downloaded from the DCR or the date to which the data represents current information for the partner and select OK.
Note: The new data will not be available for viewing through the PLD Templates until the [>> Run Update <<] macro is run. The macro generates the necessary temporary tables based on a series of Microsoft Access queries. Page 36 of 128
----------------------------------------------- FSP DCR Data Analysis Training -----------------------------------------------
Page 37 of 128
----------------------------------------------- FSP DCR Data Analysis Training -----------------------------------------------
This section covers the utility and features of the Browse Partner Data and the Run Partner
Report Templates.
Page 38 of 128
----------------------------------------------- FSP DCR Data Analysis Training -----------------------------------------------
The BPD template includes several options to browse partners’ data, which can be accessed through the four buttons in the “Browse Partner Data” section of the front page as seen in this slide. You can browse through all partners’ partnership data or search by partner ID, partner name or coordinator ID. Selecting any of the four buttons and entering appropriate criteria when required will display the BPD template. The Browse All Partners’ Data requires no criteria and will display every partner. Page 39 of 128
----------------------------------------------- FSP DCR Data Analysis Training -----------------------------------------------
After opening the BPD template, notice that in Microsoft Access 2010, by default, the template opens as another tab in the application. At the top of the BPD template, the “Data Displayed Through:” date signifies the last time the data in the PLD templates was updated from FSP DCR data file downloads. This is the date which was entered when selecting the Run Update button from the import page. It is also the date to which the number of active days in partnership is calculated for partnerships which are still active. Under the subheading of “Partner Information”, the first partnership’s partner information will be displayed.
In this slide, the example partnership was still active and had existed for 117 days at the time of data download on 1/15/2012. There may be many partnerships available to browse. The total amount of partnerships and the current order of the partnership being viewed are displayed at the bottom left‐hand corner of the report in the Record navigation box. As seen in this slide, the first of 157 total partnerships is displayed in this example. You can navigate to the next or previous partnership by clicking on the arrows to the left and right of the Record navigation box. Additionally, you can locate a partnership in a specific order by clicking on the Record navigation box and manually typing in a number within the range of the available partnership count and pressing Enter. The form will jump to the partnership associated with that order number. This may be useful when the partnerships are sorted in the form by a specific order. By default, the partnerships are Page 40 of 128
----------------------------------------------- FSP DCR Data Analysis Training -----------------------------------------------
sorted by partnership status and partnership date, such that the active partnerships with the most recent partnership dates appear first. However, the partnerships can be sorted by other fields in the template. Refer to the PLD Templates User Manual (completed 1/19/2012) at Chapter 3 “The Browse Partner Data (BPD) Template” beginning on page 22 for step‐by‐step instructions of scrolling through partners in the BPD Template.
Page 41 of 128
----------------------------------------------- FSP DCR Data Analysis Training -----------------------------------------------
As mentioned, the partnerships are sorted by partnership status and partnership date by default, such that the active partnerships with the most recent partnership dates appear first. However, the partnerships can be sorted by other fields in the template. To sort the order of the partnerships in a different order, place your cursor in the field in the “Partner Information” section of the BPD template which you would like to use to sort the partnerships (e.g., Age Group). As seen in this slide, select the Home menu and select either the Ascending or Descending button to sort the partnerships by the selected field. Page 42 of 128
----------------------------------------------- FSP DCR Data Analysis Training -----------------------------------------------
To find a particular partner, place your cursor in the field in the “Partner Information” section of the BPD template which you would like to use to find a partnership (e.g., Partner Name). As seen in this slide, select the Home menu and then select the Find button. As seen in this slide, enter the criteria for the search. In this example, we are searching the partner name field to find a specific partner by name. The Find box will remain open, and you can select the Find Next button to jump to the next partnership with matching search criteria.
Note: Selecting to search information under the “Domain Data For” sections in the lower half of the BPD template will only search for data within the partnership which is currently being displayed. The search will not bring up other partnership’s matching data. Page 43 of 128
----------------------------------------------- FSP DCR Data Analysis Training -----------------------------------------------
Under the “Domain Data For” subheading, there are tabs for the partnership’s information such as their legal, financial and employment data. All domain options are displayed in this slide. Data associated with a tab will be displayed by clicking on the tab. A vertical scroll bar will appear if necessary to allow scrolling within the table embedded in the tab.
In this example, the partner had five 3Ms due, and all five 3Ms were completed. Page 44 of 128
----------------------------------------------- FSP DCR Data Analysis Training -----------------------------------------------
The Admin. Changes tab displays a list of all administrative changes reported for the partnership, including assessment date and dates of change. In this example, the partnership began on 2/20/2008 and changed coordinators from Joe to Bob to Herald. The partnership was discontinued on 8/18/2010 for having met goals.
Page 45 of 128
----------------------------------------------- FSP DCR Data Analysis Training -----------------------------------------------
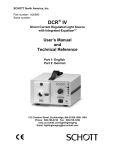
The D1: Residential tab displays the past 12 months of residential information and a list of all residential status changes during the program. In this example, the partner spent 218 days and 120 days in emergency shelter and homeless, respectively, in the 12 months before the partnership. During the partnership, the partner spent 11 days homeless, 91 days in residential treatment, 36 days in an emergency shelter, and spent the final 482 days in an apartment alone.
Page 46 of 128
----------------------------------------------- FSP DCR Data Analysis Training -----------------------------------------------
The D2: Education tab displays the past 12 months of education information and a list of all education KET and 3M assessments during the program. In this example, the partner entered the FSP in 8th grade with very good grades. The partner had average grades during the previous year. The partner was suspended after 71 days in the partnership as reported on a KET, and the partner’s grades were below average at the first 3M assessment at day 80 of the partnership. The next 3M assessment submitted was at 279 days into the partnership, and the partner’s grades were good.
Page 47 of 128
----------------------------------------------- FSP DCR Data Analysis Training -----------------------------------------------
The D3: Employment tab displays the past 12 months of employment information and a list of all employment KET assessments during the program. In this example, the partner was unemployed for 45 of 52 weeks in the past 12 months and spent 7 weeks in non‐paid employment for 18 hours per week. On day 26 in the FSP, a KET assessment reported that the partner began work at 25 hours a week for $7.00 per hour.
Page 48 of 128
----------------------------------------------- FSP DCR Data Analysis Training -----------------------------------------------
The D4: Financial tab displays the past 12 months of financial support information and a list of all financial support 3M assessments during the program. In this example, the partner had financial support in the form of spouse, general and food stamps in the 12 months before the FSP. At the start of the FSP, the partner was receiving financial support from spouse and food stamps. At the second 3M assessment, the partner reported financial support from wages and SSI.
Page 49 of 128
----------------------------------------------- FSP DCR Data Analysis Training -----------------------------------------------
The D5: Legal tab displays the past 12 months of legal issues and a list of all KET and 3M assessment legal issues during the program. In this example, the partner was arrested one time in the 12 months before partnership and was on probation upon entering the FSP. No changes were reported on the first two 3M assessments. On day 197 in the FSP, a KET assessment reported that the partner went off probation.
Page 50 of 128
----------------------------------------------- FSP DCR Data Analysis Training -----------------------------------------------
The D6: Emergency tab displays the past 12 months of emergency interventions and a list of all emergency intervention KET assessments during the program. In this example, the partner reported one mental/substance related emergency in the 12 months before the partnership. During the partnership, the partner had a mental/substance related emergency at 144 days in the partnership, and the partner had physical health emergencies on days 166 and 170 in the partnership.
Page 51 of 128
----------------------------------------------- FSP DCR Data Analysis Training -----------------------------------------------
The D7‐D8: Health Substance tab displays the past 12 months of health and substance abuse history and a list of all health and substance abuse 3M assessments during the program. In this example, the partner did not have a physician and had a substance abuse problem in the 12 months before and at the start of the FSP. The partner was not receiving substance abuse services at the start of the FSP. At the first 3M assessment on day 83, the partner reported having a physician. At the second 3M assessment on day 169, the partner reported receiving substance abuse services.
Page 52 of 128
----------------------------------------------- FSP DCR Data Analysis Training -----------------------------------------------
The D9: ADL tab displays the ADL 3M assessments for older adults during the program. In this example, the partner had three 3M assessments during the program, and the ADL status were captured on days 270, 355 and 445 in the program.
Page 53 of 128
----------------------------------------------- FSP DCR Data Analysis Training -----------------------------------------------
The D10: IADL tab displays the IADL 3M assessments for older adults during the program. In this example, the partner had three 3M assessments during the program, and the IADL status was captured on days 270 and 355. The IADL information was not completed for the 3M assessment on day 445 in the program.
Page 54 of 128
----------------------------------------------- FSP DCR Data Analysis Training -----------------------------------------------
The Find All Partner’s Data for a Coordinator will apply a filter to the BPD template based on matching the criteria entered with a coordinator ID. As seen in this slide, selecting this button will bring up the “Enter Parameter Value” pop‐up window. Typing in any portion of a coordinator ID in the box will apply the filter to the BPD template. The BPD template will then display only those partnerships with associated coordinator IDs containing the entered text as any consecutive part of the coordinator ID. For example, entering “Smith” in the “Enter Parameter Value” pop‐up window will display partnerships for all coordinator IDs with any portion of “Smith” as part of the ID. As seen in this slide, the BPD template will open in a new tab titled “Partner_Info_SearchbyCoor” with partnership records that are exclusive to the coordinator ID search performed. The number of partnerships available can be seen in the Record box in the lower left‐hand corner of the screen. Page 55 of 128
----------------------------------------------- FSP DCR Data Analysis Training -----------------------------------------------
The Find a Partner’s Data – Search by ID button will apply a filter to the BPD template based on matching the criteria entered with a partner ID. There are two options for entering partner IDs. You can enter a CSI number in the first pop‐up window or enter a Global ID in the second window. To search for a specific partnership by partner ID number, click on the Find a Partner’s Data – Search ID button under the “Browse Partner Data” heading. As seen in this slide, the first pop‐up window that appears will allow you to enter search criteria of CSI number. If known, enter the CSI number and press OK. If you would prefer to search by Global ID, enter nothing in this first window and click OK to skip the search by CSI number. As seen in this slide, the second pop‐up window that appears will allow you to enter search criteria of Global ID. If a CSI Number was already entered in the previous pop‐up window, then click OK to skip the search by Global ID. If the CSI Number was not entered, then enter a Global ID for a partnership and press OK to continue. As seen in this slide, the BPD template will open in a new tab titled “Partner_Info_SearchbyID” with the partnership information for the partnership matching the partner ID entered into the search box. The number of partnerships for partners with matching IDs is displayed in the Record box in the lower left‐hand corner of the screen.
Page 56 of 128
----------------------------------------------- FSP DCR Data Analysis Training -----------------------------------------------
The Find a Partner’s Data – Search by Name will apply a filter to the BPD template based on matching the criteria entered with a partner’s name. As seen in this slide, selecting this button will bring up the “Enter Parameter Value” pop‐up window. Typing in any portion of a partner’s name in the box will apply the filter to the BPD template. The BPD template will then display only those partnerships which contain the entered text as any consecutive part of the partner name. For example, entering “Martin” in the “Enter Parameter Value” pop‐up window will display partnership data for all partnerships with any portion of “Martin” as either their first or last name. The standard FSP DCR format for the name field is “Last, First”. Therefore, you can conduct a search for a partnership using the full name with that format. As seen in this slide, for example John Doe would be found using “Doe, John”. As seen in this slide, the BPD template will open in a new tab titled “Partner_Info_SearchbyName” with partnerships matching the search criteria displayed. The number of partnerships matching the search can be seen in the Record box in the lower left‐hand corner of the screen.
Page 57 of 128
----------------------------------------------- FSP DCR Data Analysis Training -----------------------------------------------
The RPR template includes two options to generate a partnership report, which can be accessed through the two buttons in the “Run Partner Report” section of the front page as seen in this slide. The RPR Template can be viewed in Microsoft Access as an Access report or it can be exported as a PDF file. The View Partner Report – Search by ID button will display a report within Microsoft Access, which can be viewed electronically or printed from Microsoft Access. A report for a partnership is displayed based on matching the criteria entered for a partner ID. There are two options for entering partner IDs. You can enter a CSI number in the first pop‐up window or enter a Global ID in the second pop‐up window. To display a report for a specific partnership, click on the View Partner Report – Search by ID button under the “Run Partner Report” heading. As seen in this slide, the first pop‐up window which appears will allow you to enter search criteria of CSI number. If known, enter the CSI number and press OK. If you would prefer to search by Global ID, click OK to skip the search by CSI number. Note: You can use CTRL + V to paste search criteria into the “Enter Parameter Value” pop‐
up windows. Page 58 of 128
----------------------------------------------- FSP DCR Data Analysis Training -----------------------------------------------
As seen in this slide, the report will open in print preview mode. As seen in this slide, the Page selector in the lower left‐hand corner will allow you to scroll or jump to any page in the report. As seen in this slide, a zoom slide‐bar in the lower right‐hand corner allows you to quickly enlarge or shrink the view of the report on the screen. Page 59 of 128
----------------------------------------------- FSP DCR Data Analysis Training -----------------------------------------------
As seen in this slide, The Print Preview ribbon heading has print options. Clicking Print will print the partnership report. You can also zoom in or out and view the report by more than one page in the “Zoom” section of the ribbon. The Close Print Preview option will exit the partner level report and return you to the front page. Note: The margins of the partner report are set for printing on standard printers. Adjusting the margins may affect the quality of the report. However, if the report prints extra blank pages on your printer, then slightly adjusting the margins may solve the issue. Page 60 of 128
----------------------------------------------- FSP DCR Data Analysis Training -----------------------------------------------
The first page of a nine page example report is displayed in this slide. At the top of the RPR template, the “Data Displayed Through:” date signifies the last time the data in the PLD templates was updated from FSP DCR data file downloads. The bottom right‐hand corner of the report will display the page number. Page 61 of 128
----------------------------------------------- FSP DCR Data Analysis Training -----------------------------------------------
This slide displays the 3M Assessments and Administrative Changes page of the report.
Page 62 of 128
----------------------------------------------- FSP DCR Data Analysis Training -----------------------------------------------
This slide displays the Residential Settings Domain page of the report.
Page 63 of 128
----------------------------------------------- FSP DCR Data Analysis Training -----------------------------------------------
This slide displays the Education Domain page of the report.
Page 64 of 128
----------------------------------------------- FSP DCR Data Analysis Training -----------------------------------------------
This slide displays the Employment Domain page of the report.
Page 65 of 128
----------------------------------------------- FSP DCR Data Analysis Training -----------------------------------------------
This slide displays the Financial Domain page of the report.
Page 66 of 128
----------------------------------------------- FSP DCR Data Analysis Training -----------------------------------------------
This slide displays the Legal Domain page of the report.
Page 67 of 128
----------------------------------------------- FSP DCR Data Analysis Training -----------------------------------------------
This slide displays the Emergency Intervention Domain page of the report.
Page 68 of 128
----------------------------------------------- FSP DCR Data Analysis Training -----------------------------------------------
This slide displays the Health and Substance Abuse Domains page of the report.
Page 69 of 128
----------------------------------------------- FSP DCR Data Analysis Training -----------------------------------------------
The Export PDF Report – Search by ID button will export a PDF file of a partnership report to a desired location on your network. There are two options for identifying the partnership for the report. You can enter a CSI number in the first pop‐up window or enter a Global ID in the second pop‐up window. To export a report for a specific partnership, click on the Export PDF Report – Search by ID button under the “Run Partner Report” heading. As seen in this slide, an “Output To” window will appear which is used to designate a location and file name for the report. The default name of the report, “Partner_Level_Report”, can be changed. Use the navigation pane on the left‐hand side of the window to select a folder to which the PDF report will be saved. Select the Autostart
checkbox if you would like the report to be opened automatically when the export and save process is complete. Then click OK. Selecting Cancel will return you to the front page without exporting the report. After the partner ID search criteria are entered, the PDF file will be generated and the file will be saved in the selected location. If the Autostart checkbox was marked, a copy of the report will open in a PDF viewing application. Page 70 of 128
----------------------------------------------- FSP DCR Data Analysis Training -----------------------------------------------
Page 71 of 128
----------------------------------------------- FSP DCR Data Analysis Training -----------------------------------------------
This section provides an overview of the Application Notes document and appendices, and it covers the detailed steps to create the Application Note #1 report in Microsoft Access.
Page 72 of 128
----------------------------------------------- FSP DCR Data Analysis Training -----------------------------------------------
The Application Notes provide instruction for using Microsoft Access and/or Microsoft Excel applications to analyze the Full Service Partnership (FSP) DCR CSV data downloads. These instructions provide two examples for analyzing the DCR CSV files to create reports for partners’ length of service by provider. In the first Application Note, instructions are provided for creating a report which identifies the average length of service for partners by program and provider. This report also identifies the percent of quarterly (3M) assessments which were completed for the partners. The second Application Note provides instruction to create a report for the average length of service for partners based on reason of discontinuation from partnership. In January 2012, County Data Quality Reports were provided for each county/region based on the data reported to the FSP DCR. The purpose of the County Data Quality Report was to describe all of each county’s data and to identify inconsistent or outlying data points. Counties participated in a survey rating the utility of the section of the reports. The Application Notes are constructed for the report sections which received the highest score based on the results of the survey and provide instruction to reproduce two of the sub‐
reports from the Data Quality Reports by utilizing the county’s downloaded FSP DCR data files at any point in time. Page 73 of 128
----------------------------------------------- FSP DCR Data Analysis Training -----------------------------------------------
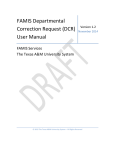
Application Note #1 explains how to create the report "Average Length of Enrollment and 3Ms Completed for Partnerships Ever Served by Program / Provider" (similar to Section 2.2 in the Data Quality Reports). An example of this report can be seen in this slide. The report summarizes the number of continuous or discontinuous partners, the average length of partnerships and percent of 3Ms completed by provider and by program. Page 74 of 128
----------------------------------------------- FSP DCR Data Analysis Training -----------------------------------------------
Application Note #2 explains how to make two related reports: the "Number of Partnerships by Discontinued Reason for Each Program / Provider" (similar to Section 2.7 in the Data Quality Reports) and the “Average Length (Days) in Partnership by Program / Provider and Discontinued Reason" (similar to Section 2.8 in the Data Quality Reports). An example of these reports can be seen in this slide and the next slide. The first report summarizes the number of partnerships by discontinue reason for each provider and program. Page 75 of 128
----------------------------------------------- FSP DCR Data Analysis Training -----------------------------------------------
The second report summarizes the average length of partnership by discontinue reason for each provider and program. Page 76 of 128
----------------------------------------------- FSP DCR Data Analysis Training -----------------------------------------------
It is often desired to separate data into length timeframes or into date ranges when creating reports. One way to quickly define partnership timeframes (e.g., number of quarters a partnership has completed) or date ranges (e.g., fiscal years) is to create a table with definitions of the several combinations of groupings which may be required depending on the purpose of the report. Reference: Kimball, Ralph; Ross, Margy. (2002). The Data Warehouse Toolkit: The Complete Guide to Dimensional Modeling, Second Edition. New York: Wiley Computer Publishing. Before starting, load the four DCR CSV files into the PLD Templates. Import the tables from Appendix A (required) and Appendix B (optional) of the Application Notes document into the database and name them as noted in this slide. As seen in this slide, the data tables can be accessed by selecting the paperclip icon in the PDF Application Notes document and double clicking on the file.
Page 77 of 128
----------------------------------------------- FSP DCR Data Analysis Training -----------------------------------------------
Appendix D contains a helpful worksheet to use while tracking and validating the number of records in each query while creating the reports. Page 78 of 128
----------------------------------------------- FSP DCR Data Analysis Training -----------------------------------------------
The Microsoft Excel file displayed in this slide defines the following groupings of partnership length timeframes based on the number of days in partnership service. Import this file as a new table in a Microsoft Access database to assist in aggregating and summarizing data based on the length of service for a partnership. Timeframes Defined based on Days in Service 1. Months – Exact Fraction Completed 2. Months – Rounded to Total Completed 3. Quarters – Exact Fraction Completed 4. Quarters – Rounded to Total Completed 5. Years – Exact Fraction Completed 6. Years – Rounded to Total Completed 7. Timeframe – Three‐Month Labels (e.g, “3Months”, “6Months”, etc.) 8. Timeframe Categories – Simple grouping example based on Timeframe field 9. 3Ms Due – The number of 3Ms which would be due based on the number of days in service Page 79 of 128
----------------------------------------------- FSP DCR Data Analysis Training -----------------------------------------------
The Microsoft Excel file displayed in this slide defines the following groupings of dates. Import this file as a new table in a Microsoft Access database to assist in aggregating and summarizing data based on any date field in the FSP DCR data. Date Groupings Defined 1. Month Number – Month Number in Year (1 to 12) 2. Month Name – Name of Month (Jan – Dec) 3. Day of Month – (1 to 31) 4. Year Number – Four digit year (1984 to 2024) 5. Month and Day – Formatted as Month/Day (1/1 to 12/31) 6. Day of Week – Weekday Number Starting on Sunday (1 to 7) 7. Weekend or Weekday – Flag for Weekend or Weekday (Weekend, Weekday) 8. Fiscal Year (FY) – Fiscal Year Formatted as Year/Year (1984/1985 to 2024/2025) 9. Calendar Year (CY) Quarter (QRT) – (1 to 4) 10. FY Qrt – (1 to 4) 11. CY and QRT – Formatted as Year_Q# (1985_Q1 to 2024_Q4) 12. FY and QRT – Formatted as FY_Q# (1984/1985_Q3 to 2024/2025_Q2) Page 80 of 128
----------------------------------------------- FSP DCR Data Analysis Training -----------------------------------------------
After saving the Timeframe and Date Dimension tables to a location on your network, open the PLD Templates and select the External Data menu item and then the Excel button to begin the import process.
Page 81 of 128
----------------------------------------------- FSP DCR Data Analysis Training -----------------------------------------------
Select Browse to locate the Excel file. Select to Import the source data into a new table in the current database. Select OK.
Page 82 of 128
----------------------------------------------- FSP DCR Data Analysis Training -----------------------------------------------
Select the worksheet, and select Next.
Page 83 of 128
----------------------------------------------- FSP DCR Data Analysis Training -----------------------------------------------
Check the First Row Contains Column Headings, and select Next. Select Next again on the next screen.
Page 84 of 128
----------------------------------------------- FSP DCR Data Analysis Training -----------------------------------------------
Select to Choose my own primary key and select the field DAYS_IN_SERVICE from the drop‐down menu. Select Next.
Page 85 of 128
----------------------------------------------- FSP DCR Data Analysis Training -----------------------------------------------
In the Import to Table box, type the table name: CODES_TIMEFRAME or CODES_DATES for the appropriate file. Select Finish. The table is now imported into the PLD templates.
Page 86 of 128
----------------------------------------------- FSP DCR Data Analysis Training -----------------------------------------------
The step‐by‐step instructions in these Application Notes are designed as a simplified modular approach to utilizing Microsoft Access for beginning users.
The step‐by‐step instructions for the Application Notes assume the users have some basic knowledge of Microsoft Access. These topics will be covered during the process of creating the reports in this presentation. Refer to the Application Notes (completed 4/5/2012) at Chapter 1 and section “Working in Microsoft Access” on page 8 as a concise reference for these topics.
Page 87 of 128
----------------------------------------------- FSP DCR Data Analysis Training -----------------------------------------------
Once the Microsoft Access database contains the building blocks described previously in this section, the report can be constructed through the six steps listed in this slide. Page 88 of 128
----------------------------------------------- FSP DCR Data Analysis Training -----------------------------------------------
Appendix C from the Application Notes document provides the Microsoft Access SQL code for all of the queries created in the Application Notes. The SQL code assumes the user is utilizing the PLD Templates database offered by the MHSOAC. This code also assumes the user has imported the CODES_TIMEFRAME (from Appendix A) and the CODES_DATES (from Appendix B) tables into the PLD Templates.
Copying and pasting this code into the SQL view of an empty Microsoft Access query within the PLD Templates will quickly recreate the queries designed in these Application Notes. This code is provided for user convenience in testing and troubleshooting or recreating the design of the queries. Page 89 of 128
----------------------------------------------- FSP DCR Data Analysis Training -----------------------------------------------
The first step for this report is to create a list of all of the partners who were discontinued and reestablished for the same partnership. These partners will be counted as “No” in the Continuously Enrolled? column of the report. Partners not included in this list will be counted as “Yes” for that column. 1. With the PLD Templates open in Microsoft Access, select Create > Query Design. 2. In the Show Tables pop‐up window, select and add the following two tables to the query: DCR_KETs, Codes_KetStatus. Then select the Close button. 3. As seen in this slide, select the [KETStatus] field within the DCR_KETs table, and drag and drop the field onto the [Code] field of the Codes_KetStatus table to create an inner join between the tables. 4. As seen in this slide, add the DCR_KETS.[GlobalID], DCR_KETS.[KETStatus], Codes_KetStatus.[Description] fields to the query definition spreadsheet. 5. As seen in this slide, create a fourth variable by typing the following into a blank column of the query design: Continuous: “No”. This will create a variable in the query named [Continuous] and assign the value “No” to all records. 6. As seen in this slide, add the criteria of “1” to the [KETStatus] field of the query. This will limit the criteria to pull back only those records in which a partnership was reestablished. Page 90 of 128
----------------------------------------------- FSP DCR Data Analysis Training -----------------------------------------------
Running the query now will bring back all KET records for a reestablishment activity. A partnership may have been discontinued and reestablished multiple times. However, we only want a list of unique partnership identifiers for partnerships with any reestablishment activity, regardless of how many times it occurred. Therefore, to remove duplicates, we will choose to select distinct records. As seen in this slide, move to the SQL View and insert the word DISTINCT after the word SELECT. This will remove any duplicate rows from our query, resulting in one record per [GlobalID] with a [KETStatus] equal to “1”. Page 91 of 128
----------------------------------------------- FSP DCR Data Analysis Training -----------------------------------------------
As seen in this slide, move to the datasheet view to inspect the results of the query. Write down the number of records (i.e., partnerships ever discontinued and reestablished) on the worksheet from Appendix D of the Application Notes document as reference. Save the query as AP1_S01_001_Discontinuous.
Page 92 of 128
----------------------------------------------- FSP DCR Data Analysis Training -----------------------------------------------
Step 2 involves calculating the number of 3Ms ever submitted for each partner. If a partner has never had a 3M submitted, then the partner will not exist in the results of this query. This query will show the number of 3Ms submitted for all partners with at least one 3M. 1. With the PLD Templates open in Microsoft Access, select Create > Query Design.
2. In the Show Tables pop‐up window, select and add the following table to the query:
DCR_3M table. Then select the Close button.
3. Right click in the query definition datasheet in the bottom half of the window and choose to add a Total row to the query definition.
4. As seen in this slide, add the [GlobalID] and choose Group By from the drop‐down selections in the Total row.
5. As seen in this slide, add the [AssessmentDate] field to the query. Select the Count
operator from the Total row drop‐down box. Rename the field by typing 3Ms_Completed: in front of the original field name.
Page 93 of 128
----------------------------------------------- FSP DCR Data Analysis Training -----------------------------------------------
As seen in this slide, move to the datasheet view to inspect the results of the query. Write down the number of records (i.e., partnerships with at least one or more 3Ms) on the worksheet from Appendix D of the Application Notes document as reference. Save the query as AP1_S02_001_3MsCompleted. Page 94 of 128
----------------------------------------------- FSP DCR Data Analysis Training -----------------------------------------------
Step 3 involves calculating the number of days a partnership existed. Some partnerships may have been discontinued, and some may still be active. Therefore, for active partnerships, you will need to identify an end date for the calculation. The end date is usually determined as the end date defined when the CSV files was extracted from the FSP DCR.. The extraction is a static snapshot of all of the partnerships up to the date of extraction. 1. With the PLD Templates open in Microsoft Access, select Create > Query Design. 2. In the Show Tables pop‐up window, select and add the following tables to the query: DCR_PAFnonRes and the DateDataDownload table. Then select the Close button. Do not join the tables. 3. As seen in this slide, select and add the following fields to add to the query: DCR_PAFnonRes.[GlobalID], DCR_PAFnonRes.[ProgramDesc], DCR_PAFnonRes.[ProviderSiteID], DCR_PAFnonRes.[PartnershipDate]. 4. If the DCR_PAFnonRes.[PartnershipStatus] = 0, then the partnership is currently discontinued, and the date the partnership was discontinued is stored in the DCR_PAFnonRes.[DatePartnershipStatusChange] field. Otherwise, the partnership is active, and the end date defined when the CSV files was extracted should be used to calculate the length of partnership. As seen in this slide, select an empty column of the query definition datasheet, and enter the following formula to identify the correct end date Page 95 of 128
----------------------------------------------- FSP DCR Data Analysis Training -----------------------------------------------
to use when calculating the length of partnership. End_Date: IIf([PartnershipStatus]=0, [DatePartnershipStatusChange], [DateDataDownload].[DateDownload]) 5. Now, calculate the length the partnership was in service by counting the number of days between the partnership start date and the end date. As seen in this slide, select an empty column of the query definition datasheet, and enter the following formula to calculate the number of days the partnership existed. DaysInService: DateDiff("d",[PartnershipDate],[End_Date]) Note: DateDiff is a MS Access function which helps calculate the difference between two dates. The function takes three parameters. The first parameter, “d”, defines the calculation should return the number of days. The second parameter is the start date for the calculation, and the third parameter is the end date for the calculation. Page 96 of 128
----------------------------------------------- FSP DCR Data Analysis Training -----------------------------------------------
Move to the datasheet view to inspect the results of the query. Write down the number of records (i.e., total number of partnerships) on the worksheet from Appendix D of the Application Notes document as reference. Save the query as AP1_S03_001_DaysInService. Page 97 of 128
----------------------------------------------- FSP DCR Data Analysis Training -----------------------------------------------
Step 4 involves joining information from all of the previously created queries. This query will result in one record per partner. 1. With the PLD Templates open in Microsoft Access, select Create > Query Design. 2. In the Show Tables pop‐up window, select and add the following two tables from the Tables tab: CODES_TIMEFRAME, CODES_DATES. Select the Queries tab and add the following three queries: AP1_S03_001_DaysInService, AP1_S02_001_3MsCompleted, AP1_S01_001_Discontinuous. Then select the Close button. 3. As seen in this slide, create the following joins between the five tables/queries: • Inner join between AP1_S03_001_DaysInService.[PartnershipDate] and
CODES_DATE.[DATE_VALUE] • Inner join between AP1_S03_001_DaysInService. [DaysInService] and CODES_TIMEFRAME.[DAYS_IN_SERVICE] • Outer join from AP1_S03_001_DaysInService.[GlobalID] to AP1_S02_001_3MsCompleted.[GlobalID] • Outer join from AP1_S03_001_DaysInService.[GlobalID] to AP1_S01_001_Discontinuous.[GlobalID] After you have created a join on two fields, right click on the line indicating the join and change it to an outer join (as indicated by a directional arrow) as needed.
Page 98 of 128
----------------------------------------------- FSP DCR Data Analysis Training -----------------------------------------------
4. Add all of the fields from the AP1_S03_001_DaysInService to the query definition. 5. Add the CODES_TIMEFRAME.[3MS_DUE] field. Note: Optionally, add any other fields from the CODES_DATE table, such as [FY_AND_QRT] (i.e., fiscal year and quarter) by which you may later want to aggregate the data. 6. Identify the partners who were not continuously enrolled, and set the remaining partners to “Yes” for the [Continuous] field. Select an empty column of the query definition datasheet, and enter the following formula to identify continuous or discontinuous partnerships. Continuous_Enrolled: IIf([Continuous] Is Not Null,[Continuous],"Yes") 7. Now, you will need to select the number of 3Ms completed, which was previously calculated for partnerships with at least one 3M completed. However, some partners may not have had a 3M completed, and a formula will need to set the value for this variable to zero for these partnerships. Select an empty column of the query definition datasheet, and enter the following formula to set the number of 3Ms completed for all partnerships. 3Ms_Complete: IIf([3Ms_Completed] Is Not Null,[3Ms_Completed],0) Page 99 of 128
----------------------------------------------- FSP DCR Data Analysis Training -----------------------------------------------
Move to the datasheet view to inspect the results of the query. Write down the number of records (i.e., total number of partnerships) on the worksheet from Appendix D of the Application Notes document as reference. The number of records in this query should match the number of records in the AP1_S03_001_DaysInService query. Save the query as AP1_S04_001_Variables_ByPartner. Page 100 of 128
----------------------------------------------- FSP DCR Data Analysis Training -----------------------------------------------
Step 5 involves aggregating the data from step 4 into summaries by provider, program and the entire system (i.e., county). 1. With the PLD Templates open in Microsoft Access, select Create > Query Design. 2. In the Show Tables pop‐up window, select the Queries tab and then select and add the query from previous step: AP1_S04_001_Variables_ByPartner. Then select the Close button. 3. Right click in the query definition spreadsheet, and add the Total row to the query definition. 4. As seen in this slide, add the following variables, and select the following operator in the Total row. [ProgramDesc] Group By [ProviderSiteID] Group By
[Continuous_Enrolled] Group By
[GlobalID] Count
[DaysInService] Avg
[3Ms_Due] Sum
[3Ms_Complete] Sum
Page 101 of 128
----------------------------------------------- FSP DCR Data Analysis Training -----------------------------------------------
5. Now calculate the percent of 3Ms completed for all partnerships aggregated by each combination of program, provider and continuously enrolled status. Select an empty column of the query definition datasheet, and enter the following formula. In order to avoid dividing by zero when no 3Ms are due for an aggregated group, this formula uses an IIF statement in the formula to insert null values in the results for those cases.
3Ms_PctnComp_ByProvider: IIf(Sum(AP1_S04_001_Variables_ByPartner.[3MS_DUE])=0, Null, Round(100*(Sum(AP1_S04_001_Variables_ByPartner.[3Ms_Complete])/ Sum(AP1_S04_001_Variables_ByPartner.[3MS_DUE])),1)) Select the Expression option in the drop‐down box of the Total row. 6. As seen in this slide, move to the datasheet view to inspect the results of the query. The query should display one record for each combination of provider, program and continuous or discontinuous partnership. Write down the number of records in the query. 7. Save the query as AP1_S05_001_Total_ByProvider. Page 102 of 128
----------------------------------------------- FSP DCR Data Analysis Training -----------------------------------------------
8. Copy and paste the query just created, and name the new query AP1_S05_002_Total_ByProgram. 9. Open the new query in Design View. 10. Now aggregate the data in this new query by all providers for each program. As seen in this slide, replace the [ProviderSiteId] field in the second column of the query definition with the following constant. ProviderSiteID: “zz~ ALL PROVIDERS ~zz” The z’s in the constant will help sort this summary row to the bottom of all other provider values. Alternatively, a space before the term will sort the row to the top of all providers, if there are no null provider values in your dataset. Page 103 of 128
----------------------------------------------- FSP DCR Data Analysis Training -----------------------------------------------
11. As seen in this slide, move to the datasheet view to inspect the results of the query. The query should display one record for each combination of program and discontinuous or continuous partnership. Write down the number of records in the query as reference. Save and close the query. Page 104 of 128
----------------------------------------------- FSP DCR Data Analysis Training -----------------------------------------------
12. Copy and paste the query just created, and name the new query AP1_S05_003_Total_System. 13. Open the new query in Design View. 14. Now aggregate the data in this new query by the entire system of data. Replace the [ProgramDesc] field in the first column of the query definition with the following constant. ProgramDesc: “zz~ ALL PROGRAMS ~zz” Page 105 of 128
----------------------------------------------- FSP DCR Data Analysis Training -----------------------------------------------
15. As seen in this slide, move to the datasheet view to inspect the results of the query. This query will display one record for all continuous partnerships and one record for all discontinuous partnerships in the entire system of data. Write down the number of records in the query as reference. Save and close the query. Page 106 of 128
----------------------------------------------- FSP DCR Data Analysis Training -----------------------------------------------
16. Create one last query to combine the rows of the previous three queries in this step. Select Create > Query Design. Select the Close button in the Show Tables pop‐up, and do not add any tables to the query. Select the View > SQL or the Union option for the query. Either of these options will redirect you to the SQL View. Type or paste the following SQL code to combine the rows in the previous three queries with a union. SELECT * FROM AP1_S05_001_Total_ByProvider; UNION SELECT * FROM AP1_S05_002_Total_ByProgram; UNION SELECT * FROM AP1_S05_003_Total_System; Page 107 of 128
----------------------------------------------- FSP DCR Data Analysis Training -----------------------------------------------
17. Move to the datasheet view to inspect the results of the query. The number of records should equal the sum of records from the previous three queries created in this step. 18. Save the query as AP1_S05_004_Total_ALL. Page 108 of 128
----------------------------------------------- FSP DCR Data Analysis Training -----------------------------------------------
The last step in this process is to design the report. The final query, AP1_S05_004_Total_ALL, holds all of the data for the final table. This query can be exported into Microsoft Excel for formatting or into Microsoft Access to create a report template. Page 109 of 128
----------------------------------------------- FSP DCR Data Analysis Training -----------------------------------------------
1. With the PLD Templates open in Microsoft Access, right mouse click on the AP1_S05_004_Total_ALL and choose Export > Excel, as seen in this slide.
2. Provide a file name and browse to a location to save the Excel file. 3. Select Export data with formatting and layout and select Open the destination file after the export operation is complete. Click OK. 4. Your data is now in Microsoft Excel, and can be formatted for inclusion in a Microsoft Word report. Page 110 of 128
----------------------------------------------- FSP DCR Data Analysis Training -----------------------------------------------
Alternatively, a report template can be created in Microsoft Access.
1. With the PLD Templates open in Microsoft Access, click once on the AP1_S05_004_Total_ALL query to highlight the query. Choose Create > Report Wizard in the report section of the menus. As seen in this slide, the selected query should show in the wizard. If the desired query is not showing in the drop‐down box, then select the drop‐
down and locate the correct query. 2. As seen in this slide, select the >> button to move the entire set of fields into the Selected Fields box. Click Next. Page 111 of 128
----------------------------------------------- FSP DCR Data Analysis Training -----------------------------------------------
3. As seen in this slide, select the [ProgramDesc] and then select the > button to group the report sections by program. Select Next. Page 112 of 128
----------------------------------------------- FSP DCR Data Analysis Training -----------------------------------------------
4. As seen in this slide, select to sort by [ProviderSiteID] and then [Continuous_Enrolled] fields from the drop‐down boxes. Click Next. Page 113 of 128
----------------------------------------------- FSP DCR Data Analysis Training -----------------------------------------------
5. As seen in this slide, select the Block layout and select the Landscape orientation. Click Next. Page 114 of 128
----------------------------------------------- FSP DCR Data Analysis Training -----------------------------------------------
6. As seen in this slide, name the report AP1_S05_004_Total_ALL_Rpt. Click Finish. Page 115 of 128
----------------------------------------------- FSP DCR Data Analysis Training -----------------------------------------------
7. As seen in this slide, move to the Design View to change the design of the report. After the wizard creates the report, the report format can be optimized by rearranging the location of the fields. Page 116 of 128
----------------------------------------------- FSP DCR Data Analysis Training -----------------------------------------------
8. As seen in this slide you can resize, rename and relocate the fields and labels to match the following design or another format as desired. The following steps provide a quick overview of the steps required to change the report from the layout in the previous slide to this slide. • Click in the label in the Report Header section and rename the report title. • Click on each of the labels in the Page Header section and rename each label to match the new label titles in this slide. • Hold the Shift key to simultaneously select all labels in the Page Header section, and move the labels down in the section to make room for the report title label. Click and drag to arrange each label in the Page Header section to match the layout in this slide.
• Drag and drop the report title from the Report Header section to the Page Header section. • Minimize the size of the Report Header section by clicking and dragging upward on the lower section separator bar. • Lengthen the ProgramDesc Header section by clicking and dragging downward on the lower section separator bar. • Drag the [ProgramDesc] field from the Detail section to the ProgramDesc Header section. • Select on the ProgramDesc Header bar and right‐click and select Properties to display the properties window on the right side of the screen. In the Format tab, select the Back Color to be gray. Set the Alternate Back Color to be No Color. • Select on the Detail bar, and in the Format tab of the Properties window, select the Page 117 of 128
----------------------------------------------- FSP DCR Data Analysis Training -----------------------------------------------
Alternate Back Color to be No Color. • Select the [ProgramDesc] field and in the Properties window, set the Width to 4” and set the Back Style to Transparent. • Select each field in the Detail section and click and drag the left edges to resize the fields to resemble this slide.
• Align the fields in the Detail section underneath the corresponding label from the Page Header section. Page 118 of 128
----------------------------------------------- FSP DCR Data Analysis Training -----------------------------------------------
9. View the report in print preview. If formatted following the directions listed previously, the report will resemble the example displayed in this slide. Adjust the orientation and margins for printing as desired. Page 119 of 128
----------------------------------------------- FSP DCR Data Analysis Training -----------------------------------------------
Page 120 of 128
----------------------------------------------- FSP DCR Data Analysis Training -----------------------------------------------
A limited amount of analysis can be performed in Microsoft Excel alone. A single CSV file can be imported, and Microsoft Excel’s pivot table can aggregate and summarize the information. While Microsoft Excel does not have the functionality to create report templates from the information in multiple CSV files, Microsoft Excel can calculate the length in program, number of 3Ms due and completed, and percent of 3Ms complete for all partners in a file. However, since the following analysis is from the 3M CSV file, a partner must have had at least one 3M completed to exist in the file and be included in this analysis. Partners without 3Ms would need to be identified separately from the PAF file. Page 121 of 128
----------------------------------------------- FSP DCR Data Analysis Training -----------------------------------------------
1. Open the DCR 3M CSV file in Microsoft Excel. 2. As seen in this slide, select the first empty column of the spreadsheet (e.g., BY) and create a new heading called DaysInService. In the cell below the heading, type in a formula to calculate the number of days in service to the end date. Since Microsoft Excel uses cell locations and not field names to perform calculations, the formula appears below with field definitions and then as an actual example formula used in Microsoft Excel. The formula first identifies if the partnership status is 0, signifying the partnership has ended, and in this case calculates the days in service by subtracting the partnership date from the date the partnership ended. Then in the cases in which the partnership has not ended, the days in service are calculated by subtracting partnership date from the end date defined when the CSV file was downloaded from the DCR. Formula Definition: =IF([PartnershipStatus]=0, [DatePartnershipStatusChange]‐
[PartnershipDate], “Date of Download”‐ [PartnershipDate]) Formula Example: =IF(U2=0,T2‐G2,"10/6/2011"‐G2)
3. As seen in this slide, copy and paste the formula down all of the rows of data. 4. As seen in this slide, select the next empty column of the spreadsheet (e.g., BZ) and create a new heading called 3Ms Due. In the cell below the heading, type the formula below to calculate the approximate amount of 3Ms due. The following formula divides the Page 122 of 128
----------------------------------------------- FSP DCR Data Analysis Training -----------------------------------------------
number of days in service by the number of days in a quarter (365.25/4 = the number of days in a quarter) and returns the integer (INT) of completed quarters in service.
Formula Definition: =INT([DaysInService]/(365.25/4)) Formula Example: =INT(BY2/(365.25/4)) Page 123 of 128
----------------------------------------------- FSP DCR Data Analysis Training -----------------------------------------------
5. Select anywhere within the data in the spreadsheet and choose to insert a pivot table into a new worksheet by selecting Insert > Pivot Table from the menus. The data selection will expand to the entire table of data within the spreadsheet. 6. This step will summarize the number of 3Ms completed and 3Ms due for each partner. Add the field [Age_Group] to the Report Filter box. Add the field [GlobalID] to the Row Labels box. Add the [DaysInService] to the Values box and change the Value Field setting to Average. Add the [3MsDue] to the Values box and change the Value Field setting to Average. Add the [AssessmentDate] to the Values box and change the Value Field setting to Count. Page 124 of 128
----------------------------------------------- FSP DCR Data Analysis Training -----------------------------------------------
7. To calculate the individual percent of 3Ms completed by partner, divide the value in column D by the value in column C for each partner, multiply by 100 and take the integer. As seen in this slide, select cell E4 and type the following formula: =INT(100*D4/C4). Select Enter to exit the cell, and then copy the formula down column E to the end of the dataset.
Page 125 of 128
----------------------------------------------- FSP DCR Data Analysis Training -----------------------------------------------
8. To calculate the total percent of 3Ms completed for all partners, sum all of the values in column D and divide by the sum of values in column C. As seen in this slide, the end of the data in column C, type the formula =sum(C4:C#), where # is the row number for the last partner in the pivot table. At the end of the data in column D, type the formula =sum(D4:D#), where # is the row number for the last partner in the pivot table. In the same row at column E, type in the formula =int(100*D#/C#), where # where the previous formulas were entered.
Page 126 of 128
----------------------------------------------- FSP DCR Data Analysis Training -----------------------------------------------
This FSP DCR Data Analysis Training Curriculum covered the data extraction instructions in the FSP DCR User Manual (completed 1/17/2012), and the training provided instruction for utilizing the FSP DCR PLD Templates and User Manual (completed 1/19/2012) to view a summary of a partner’s data. The training also reviewed the FSP DCR Application Notes (completed 4/5/2012) which provide instruction for creating specific reports from the DCR CSV data extraction files. There are additional resources covering aspects of extracting and analyzing the FSP DCR data. The FSP DCR Administrator and User Training Curriculum provides an overview of the FSP DCR Forms, FSP DCR Data Dictionary (completed 9/15/2011) and FSP DCR User Manual (completed 1/17/2012) . The FSP DCR Administrator and User Training Curriculum is available for download as a PowerPoint presentation and a handout with presenter’s notes. Trainers can use this curriculum to provide training internally to new staff using the FSP DCR.
Page 127 of 128
----------------------------------------------- FSP DCR Data Analysis Training -----------------------------------------------
Page 128 of 128