1
Test Automation Tool for
POLQA® and PESQ® Speech
Quality Tests
Application Note
Products:
|
R&S UPV
|
R&S UPV-K63
|
R&S UPV66
|
R&S UPL-Z1
|
R&S UPV-K1
|
R&S CMU200
|
R&S UPV-K61
|
R&S CMW500
Thomas Lechner, 1GPP
06.2013-2e
Application Note
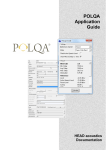
This application note provides an
application program for level alignment,
test automation and reporting with
PESQ , POLQA and delay
measurements on the Audio Analyzer
R&S UPV or R&S UPV66. An
introductory section explains theoretical
background, gives application hints and
defines requirements for test signals.
Table of Contents
Table of Contents
2e
1
POLQA® and PESQ® Measurements..................................... 4
1.1
Objective Perceptual Speech Test Methods..............................................4
1.2
Bandwidth and Listening Situation ............................................................4
1.3
Reference Signals ........................................................................................5
1.4
POLQA and PESQ on the R&S Audio Analyzer UPV...........................6
1.5
POLQA vs. PESQ ......................................................................................6
1.6
Signal Levels.................................................................................................7
2
Using the Application Program............................................. 9
2.1
Installation.....................................................................................................9
2.2
User Interface................................................................................................9
2.3
Choosing a signal Path..............................................................................10
2.3.1
Uplink...........................................................................................................11
2.3.2
Downlink......................................................................................................12
2.3.3
Loopback on the Network Side.................................................................13
2.3.4
Loopback on the Mobile Side....................................................................14
2.3.5
Connection Cable between UPV and CMU Speech Connector .............15
2.3.6
Connection Cable between UPV and UE Headset Connector ...............15
2.4
Calibration Functions ................................................................................16
2.4.1
Decoder Calibration ...................................................................................16
2.4.2
Encoder Calibration ...................................................................................17
2.4.3
Mobile Input Calibration ............................................................................17
2.4.3.1
Mobile Input Cal..........................................................................................18
2.4.3.2
M. I. Speech Cal. .........................................................................................18
2.4.4
Mobile Output Calibration .........................................................................18
2.4.5
In / Out Calibration .....................................................................................19
2.4.6
Loading Calibration Values from File.......................................................19
2.5
Loading a Setup and Starting a Measurement in Manual Mode............20
2.5.1
Configuring the Test Signal ......................................................................20
2.5.2
Choosing an equalizer filter ......................................................................21
2.5.3
Options to be Carried out after Loading the Setup.................................21
2.5.4
Loading a Setup..........................................................................................21
2.6
Using the Monitor function........................................................................22
®
®
®
®
®
Rohde & Schwarz 1GA62 2
Table of Contents
2e
®
®
2.7
Running POLQA or PESQ Tests Automatically...................................22
2.7.1
User Interface of the Test Automation Tab..............................................22
2.7.2
Compiling a List of Test Signals...............................................................23
2.7.3
Test and Averaging Options .....................................................................24
2.7.4
Starting a Test Sequence ..........................................................................25
2.8
POLQA and PESQ Test Results ............................................................26
2.8.1
Viewing Results in the Data Grid ..............................................................27
2.8.2
Entering Auxiliary Data..............................................................................28
2.8.3
Previewing a Report ...................................................................................29
2.8.4
Printing a Report ........................................................................................29
2.8.5
Export of Result Data to an ASCII file ......................................................29
2.9
Delay Measurements..................................................................................30
2.10
Delay Results ..............................................................................................31
3
Literature............................................................................... 32
4
Ordering Information ........................................................... 33
®
®
Rohde & Schwarz 1GA62 3
POLQA® and PESQ® Measurements
1 POLQA® and PESQ® Measurements
1.1 Objective Perceptual Speech Test Methods
®
®
POLQA and PESQ are objective perceptual speech test methods.
A speech test method rates the quality of a speech signal as opposed to a
conversational rating where impairments like round-trip delay are judged for their
impact on a conversation.
A perceptual test method delivers results which assess degradations the same way as
human beings would do. Non-perceptual test methods usually determine physical
entities like voltage level.
A possible implementation of a perceptual test is a subjective listening test, e.g.
according to ITU-T P.800. In a subjective test, speech signals are presented to
subjects under standardized listening conditions (level, playback equipment) with a
well-defined judgement task or question. Such a task could be to categorize the quality
of a presented speech signal according to the question “how good does the voice
sample sound?” into one of five steps between 5 = “Excellent” and 1 = “Bad”. The
answers from many subjects are averaged to obtain a so-called “MOS” (Mean Opinion
Score).
An objective perceptual speech test method implements a complex algorithm which
predicts results expected from subjective tests by applying psychoacoustic and
perceptive models to the test signals. The algorithm is verified by comparing the results
to MOS scores obtained in subjective listening tests. A mapping function may be
applied for better matching between the objective and subjective MOS scores.
®
®
PESQ and POLQA are so-called full-reference test methods. They analyze the
original (“Reference”) speech signal and the degraded signal and compare attributes
extracted from both for obtaining an assessment of the degradation.
1.2 Bandwidth and Listening Situation
In telephony different bandwidths are defined:
C
C
C
C
Narrowband (300 Hz ~ 3400 Hz)
Wideband (100 Hz ~ 7 kHz)
Superwideband (50 Hz ~ 14 kHz)
Fullband (20 Hz ~ 20 kHz).
®
PESQ provides a narrowband and a wideband mode. In both cases listening tests for
the verification of the algorithm were performed monaural using a so-called IRS type
®
receiver. The same applies to the POLQA narrowband mode.
®
In POLQA superwideband mode the subjective tests are performed with high-quality
®
stereo headphones. POLQA does not provide a wideband mode.
2e
Rohde & Schwarz 1GA62 4
POLQA® and PESQ® Measurements
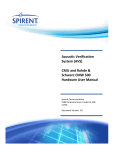
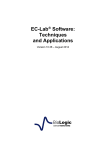
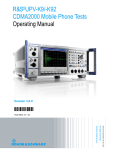
Figure 1: Modes of POLQA® and their application (from ITU-T P.863)
®
POLQA superwideband mode can be applied to narrowband, wideband and
superwideband signals. The MOS scores will also reflect the degradation caused by
the respective bandwidth limitation.
®
POLQA narrowband mode is provided for compatibility with assessment of
narrowband telephony and backward compatibility with P.862.1 (PESQ with mapping
of PESQ scores to a MOS scale). In all other application cases the superwideband
®
mode of POLQA should be used.
1.3 Reference Signals
Clean speech “reference” signals should preferably have the following properties:
C at least three seconds of active speech
C at least one second of silence between active speech periods
C no more than 6 seconds of active speech
C total length of test sample including silence should be no more than 12 seconds
C active speech level of -26 dBov
C 16-bit linear PCM encoded
C noise floor < -80dBov (A)
C speech pauses should not be digital zero but contain noise signal < -80dBov(A)
The level in the speech reference files is specified in “dBov” (“dB overload”) which is
the level referenced to a full-scale square wave signal. A full-scale sinewave signal has
a rms level of -3 dBov.
Usually one reference signal file contains a pair of sentences separated by a short
silence.
®
Reference signals for POLQA superwideband should be sampled at a rate of 48 kHz
and bandwidth-limited to 50 Hz ~ 14 kHz.
®
Reference signals for POLQA narrowband should be bandwidth-limited to 50 Hz ~
3.8 kHz and sampled at a rate of 8 kHz.
®
For PESQ narrowband tests according to P.862 and P.862.1 the file must have a
®
sample rate of 8 or 16 kHz. For PESQ wideband according to P.826.2 the file must
have a sample rate of 16 kHz. The specified wave file should contain speech signal
with approximately 8-10 seconds length.
The reference signals should have a leading and a trailing silence at least as long as
the expected end-to-end delay in the transmission path under test. This allows
2e
Rohde & Schwarz 1GA62 5
POLQA® and PESQ® Measurements
temporal alignment of the degraded signal with the reference signal without loosing
portions of the speech.
®
®
Codecs and other signal processing algorithms as well as the POLQA and PESQ
algorithms may react differently to different voices. Therefore it is recommended to
conduct tests with two female and two male voices and average the results.
Speech samples “English female 1” and “English male 2” of ITU-T recommendation B®
ITU-T P.501 fulfill the requirements for POLQA reference files. They should
additionally be filtered to the SWB or NB frequency range, respectively. These filtered
files are included with the installer of this application note.
1.4 POLQA® and PESQ® on the R&S® Audio Analyzer
UPV
®
The PESQ algorithm according to ITU-T P.862 is available on the R&S® Audio
®
analyzer UPV, called herein below “UPV”, as keycode option UPV-K61. POLQA
according to ITU-T P.863 is provided with option UPV-K63. A description of all
parameters and results is given in the current manual of the UPV and in the on-screen
context help. Detailed application guides are available in application notes 1GA49 and
1MA202.
1.5 POLQA® vs. PESQ®
®
POLQA was developed to enhance the range of test factors, coding technologies and
®
applications compared to PESQ .
®
®
Comparison PESQ - POLQA
Test Factors
Test Factor
PESQ®
Speech input levels to a codec
2e
POLQA®
X
Transmission channel errors
X
X
Packet loss and packet loss concealment
X
X
Bit rates if a codec has more than one bit-rate mode
X
X
Transcodings
X
X
Acoustic noise in sending environment
X
Effect of varying delay in listening only tests
X
Short-term time warping of audio signal
X
Long-term time warping of audio signal
X
Listening levels between 53 and 78 dB(A) SPL in superwideband mode
X
Packet loss and packet loss concealment with PCM type codecs
X
X
Temporal and amplitude clipping of speech
X
X
Rohde & Schwarz 1GA62 6
POLQA® and PESQ® Measurements
®
®
Comparison PESQ - POLQA
Test Factors
PESQ®
Test Factor
POLQA®
Linear distortions, including bandwidth limitations and spectral shaping ('non-flat
frequency responses')
X
Frequency response
X
Effect of delay in conversational tests
Talker echo
Sidetone
Acoustic noise in receiving environment
The last four test factors are addressed by neither of both methods.
®
®
Comparison PESQ - POLQA
Applications
Application
Codec evaluation
PESQ®
POLQA®
X
X
Terminal testing, influence of the acoustical path and the transducer in sending
and receiving direction.
(NOTE – Acoustical path in receiving direction only for SWB mode.)
X
Bandwidth extensions
X
Live network testing using digital or analogue connection to the network
X
X
Testing of emulated and prototype networks
X
X
UMTS, CDMA, GSM, TETRA, WB-DECT ,VoIP, POTS, PSTN, Video Telephony,
Bluetooth
X
X
Voice Activity Detection (VAD), Automatic Gain Control (AGC)
X
Voice Enhancement Devices (VED), Noise Reduction (NR)
X
Discontinuous Transmission (DTX), Comfort Noise Insertion
X
Non-intrusive measurements
Two-way communications performance
The last two applications are supported by neither of both methods.
1.6 Signal Levels
®
Due to an inherent level alignment, the PESQ algorithm itself is rather insensitive to
absolute levels. Despite this fact, the signal level on the transmission path under test
®
may heavily influence the PESQ result. Overdriving the transmissions path causes
degradation by clipping. A low level on the transmission path may cause degradation
by noise. In particular in cases where speech codecs, noise suppression and other
non-linear signal processing is involved, a reproducible signal level on the transmission
®
path may be prerequisite for reproducible PESQ results.
2e
Rohde & Schwarz 1GA62 7
POLQA® and PESQ® Measurements
®
The POLQA algorithm in superwideband mode as defined in ITU-T P.863 rates the
absolute listening level. For obtaining a correct rating, a “gain” factor has to be
specified, calculated from several gain factors like artificial ear sensitivity and a factor
depending on the analyzer input range. If there is not sufficient information for
calculating this gain factor, or for the narrowband mode, the level of the degraded
®
signal should be normalized for the POLQA algorithm. From UPV firmware 3.3.1, the
analyzer function “POLQA” offers an “Auto Gain” parameter which can be activated for
this purpose.
This application note provides an application program which runs on the Audio
Analyzer R&S UPV or R&S UPV66 and can be used to calibrate signal levels for the
®
®
®
PESQ and POLQA measurements. For the R&S Universal Radio Communication
Tester CMU200, called herein below “CMU”, calibration routines are provided which
make use of the “Decoder Cal” and “Encoder Cal” functions. “Decoder Cal” outputs a
full-scale sinewave signal with a frequency of 1 kHz. “Encoder Cal” loops back the
digital samples from the A/D converter output to the D/A converter input.
For loopback measurements and equipment other than the CMU, a so-called “In / Out
– Calibration” is provided which determines approximate full-scale input and output
levels of the transmission path from the saturation point of the input-output curve.
For Voice over LTE (VoLTE) tests with a VoIP client installed on a PC or on the UPV
itself, the “Decoder Cal” and “Encoder Cal” functionality can be realized by auxiliary
programs or by appropriate settings in an audio editor.
The application program allows to specify a test signal and the test signal level relative
to full-scale of the input of the transmission path. Furthermore it allows to load a
prepared setup and enter the generator reference value and analyzer range according
to the determined full-scale values.
To achieve a correct spectrum of the speech signal in the sound pressure at the socalled “Mouth Reference Point” (MRP), an equalization of the electric input signal is
required. A coarse equalization can be done with an appropriate filter loaded in the
Generator function panel of the UPV. The described application program provides
means for loading such a filter automatically. A filter file for equalizing the typical
average frequency response of the Bruel & Kjaer Head-and-Torso simulator 4128 is
included with the files provided.
The microphone in the artificial ear delivers an electric signal which is proportional to
the sound pressure at its membrane (“Eardrum Reference Point”, DRP). To obtain a
flat frequency response related to a virtual “Ear Reference Point” (ERP) or related to
the sound pressure in a diffuse sound field or free field, respectively, appropriate
corrections have to be applied which can be automatically loaded as an analyzer filter
by the application program. Filters for DRP-ERP correction, free field correction and
diffuse field correction of the type 3.3 artificial ear of the head-and-torso simulator are
included with the files provided.
2e
Rohde & Schwarz 1GA62 8
Using the Application Program
2 Using the Application Program
2.1 Installation
Copy the installer “1GA62.msi” to the UPV hard disk, e.g. to “D:\R&S Software”, and
start the installer. Follow the instructions on the screen.
The installer creates the program directory “C:\Program Files\Rohde&Schwarz\1GA62”
with all required files. Furthermore the installation creates shortcuts on the desktop and
in subfolder “R&S UPV Applications” in the program menu.
Upon the first start of the program, a subdirectory “1GA62” will be created in “D:\UPV”
which contains all related user data like UPV setups, program settings and files with
calibration data.
2.2 User Interface
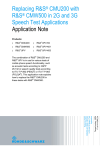
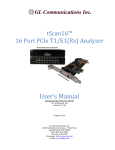
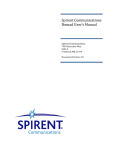
Figure 2: User interface of the application program
The main window of the application program provides nine tabs. The first four tabs are
labeled according to the four transmission types “uplink”, “downlink”, “Loopback on
Network Side” and “Loopback on Mobile Side”. Each tab provides the appropriate
calibration functions for the respective transmission type. In addition there is one tab
each for monitor, test control and results, delay measurement and delay results.
2e
Rohde & Schwarz 1GA62 9
Using the Application Program
Two help buttons on each of the first four tabs give instructions in schematic and in text
how to set up the connections. Connection types can be circuit switched with CMU200
and Voice over LTE with CMW500 and external VoLTE client (“Media Server”).
The next section of the user interface provides a row for each required calibration
value. The value, if available, is shown on the respective right end. The buttons on the
left end start the appropriate calibration routines. In the center a textbox shows the
name of the file which stores the current calibration value. Stored values can be loaded
using the “Browse” buttons.
Another section follows which allows to specify a wave file to be used as test signal
file, and the full-scale value of the wave file relative to the determined full-scale value
of the signal path input.
The last section in each tab handles the setup to be used for the test. The text box in
the center shows the file name. With the “Load Setup” button, the setup is loaded to
the UPV, the generator reference value, signal file name and voltage value are entered
and the analyzer range is set appropriately. To load a setup from a file different from
the one shown in the text box, use the “Browse and Load Setup” button. For the uplink
direction it is possible to load a filter file for speaker equalization. In the downlink tab a
filter file for ear correction can be loaded.
The checkboxes below the tabs allow to automatically minimize the window of the
application program after the setup has been loaded, and/or to start a (single)
measurement immediately afterwards. Two more checkboxes allow to configure to
change to the test control tab after a setup has been loaded and to change to the
results tab as soon as a test sequence starts.
The user interface of the last six tabs is described with monitor, test automation and
reporting functionality further below.
The program memorizes all settings and calibration values in a special file from where
they are loaded when the program starts. The button “Clear all Values” can be used to
clear the settings and calibration values in all tabs.
2.3 Choosing a signal Path
Besides the traditional transmission directions “uplink” (also called “sending”, seen
from the mobile phone’s point of view) and “downlink” (also called “receiving”), the
application program also handles setups with loopback of the signal. The loopback
may be established on the network side (CMU) or on the mobile side.
In the following section, electrical connections and settings are described for use of
the CMU as network interface. Each transmission direction requires an RF connection
between CMU and mobile phone.
In other situations other equipment may be connected in a similar matter. Particularly
for POLQA in superwideband mode, the electric connections may be replaced by a
head-and-torso simulator in case the acoustic performance of the UE should be part of
the path to be evaluated, or if no electric connection is possible.
2e
Rohde & Schwarz 1GA62 10
Using the Application Program
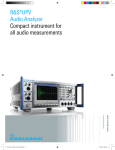
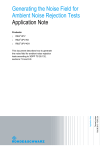
2.3.1 Uplink
UPV
External Audio In
(Headset or
Handsfree Car Kit)
CMU
RF Connection
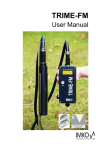
Figure 3: Circuit switched uplink signal path
For circuit switched speech connect:
C UPV generator output 1 to mobile input (headset or handsfree car kit connector)
C CMU speech output to UPV analyzer input 2, using link handler cable
1117.4082.00
Use adapter 1117.4124.00 for link handler 2 if required.
Establish call from the CMU to the mobile.
®
®
For the PESQ , POLQA and delay measurements set the CMU speech codec to
"Handset Low".
For the calibration functions follow the instructions on the screen.
CMW
UPV
Figure 4: VoLTE uplink signal path
For voice over LTE connect:
C
C
UPV generator output 1 to mobile input (headset or handsfree carkit connector)
Output 1 of the USB sound card to UPV analyzer input 2.
®
®
For the PESQ , POLQA and delay measurements establish a VoLTE call between
media server and mobile.
For the calibration functions follow the instructions on the screen.
2e
Rohde & Schwarz 1GA62 11
Using the Application Program
2.3.2 Downlink
UPV
External Audio Out
(Headset or
Handsfree Car Kit)
CMU
RF Connection
Figure 5: Circuit switched downlink signal path
For circuit switched speech connect:
C UPV generator output 2 to CMU speech input, using link handler cable
1117.4082.00
Use adapter 1117.4124.00 for link handler 2 if required.
C mobile output (headset or handsfree car kit connector) to UPV analyzer input 1
Establish call from the CMU to the mobile.
®
®
For the PESQ , POLQA and delay measurements set the speech coder to "Handset
Low".
For the calibration functions follow the instructions on the screen.
CMW
UPV
Figure 6: VoLTE downlink signal path
For voice over LTE connect:
C
C
UPV generator output 2 to inputs 1 and 2 of the USB sound card.
mobile output (headset or handsfree carkit connector) to UPV analyzer input 1
®
®
For the PESQ , POLQA and delay measurements establish a VoLTE call between
media server and mobile.
For the calibration functions follow the instructions on the screen.
2e
Rohde & Schwarz 1GA62 12
Using the Application Program
2.3.3 Loopback on the Network Side
UPV
External Audio
(Headset or
Handsfree Car Kit)
CMU
RF Connection
“Loopback”
Figure 7: Signal path for circuit switched loopback on the network side
For circuit switched speech connect:
C UPV generator output 1 to mobile input (headset or handsfree car kit connector)
C mobile output (headset or handsfree car kit connector) to UPV analyzer input 1
Establish call from the CMU to the mobile.
®
®
For the PESQ , POLQA and delay measurements set the speech coder to
"Loopback".
For the calibration functions follow the instructions on the screen.
CMW
UPV
Figure 8: Signal path for loopback on the network side in VoLTE
For voice over LTE connect:
C
C
UPV generator output 1 to mobile input (headset or handsfree carkit connector)
mobile output (headset or handsfree carkit connector) to UPV analyzer input 1
®
®
For the PESQ , POLQA and delay measurements establish a VoLTE call in loopback
mode.
Make sure that the sidetone on the mobile is disabled.
For the calibration functions follow the instructions on the screen.
2e
Rohde & Schwarz 1GA62 13
Using the Application Program
2.3.4 Loopback on the Mobile Side
UPV
CMU
Figure 9: Signal path for loopback on the mobile side in a circuit switched connection
For circuit switched speech connect:
C UPV generator output 2 to CMU speech input, using link handler cable
1117.4082.00
C CMU speech output to UPV analyzer input 2, using link handler cable
1117.4082.00
Use adapter 1117.4124.00 for link handler 2 if required.
Establish call from the CMU to the mobile.
®
®
For the PESQ , POLQA and delay measurements set the speech coder to "Codec
Cal".
For the calibration functions follow the instructions on the screen.
CMW
UPV
Figure 10: Signal path for loopback on the mobile side in VoLTE
For voice over LTE connect:
C
C
UPV generator output 2 to input 1 and 2 of the USB sound card.
Output of the USB sound card to UPV analyzer input 2.
®
®
For the PESQ , POLQA and delay measurements establish a VoLTE call between
media server and mobile.
and establish a loopback in the mobile.
For the calibration functions follow the instructions on the screen.
2e
Rohde & Schwarz 1GA62 14
Using the Application Program
2.3.5 Connection Cable between UPV and CMU Speech Connector
A cable with male (analyzer) and female (generator) XLR connector is required for
connection of the UPV to the "Speech" connector of the Digital Radio Communication
Tester CMU. The schematic is as shown below:
UPL
5
Analyzer
Generator
1
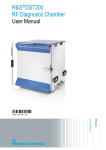
Figure 11: Cable for CMU200 speech connector
Instead of XLR connectors, BNC connectors can be used in connection with UPL-Z1
XLR-to-BNC adapters.
The cable as shown is configured for connection to link handler #1 in the CMU.
Depending on the CMU hardware, link handler #2 in the CMU can also be used for
GSM; in this case, pin 5 of the DB9 connector has to be connected to the UPV
generator instead of pin 2, and pin 6 of the dB connector has to be connected to the
UPV analyzer instead of pin 3.
The described cable (part no. 1117.4082.00) and an adapter for link handler #2 (part
no. 1117.4124.00) is enclosed in option UPV-K9 (Base SW for mobile phone tests).
2.3.6 Connection Cable between UPV and UE Headset Connector
Cables for connection between UPV and the headset connector of the UE under test
are available as option UP-Z9 (part no. 1411.3106.02). The accessory set comprises
two cable assemblies: one with ground on the sleeve of the 4-pole 3.5 mm jack plug
and one with ground on the second ring of the 4-pole 3.5 mm jack plug.
2e
Rohde & Schwarz 1GA62 15
Using the Application Program
2.4 Calibration Functions
Figure 12: Calibration functions for uplink signal path
For each signal path, the appropriate calibration functions are displayed.
2.4.1 Decoder Calibration
This calibration value is required for uplink measurements, for the encoder calibration
and mobile input calibration routines and for measurements with loopback on the
mobile side.
For decoder calibration, the application program measures the peak full-scale output of
the speech decoder circuit on the network side (CMU), which is connected to UPV
analyzer input 2. For a circuit switched connection the CMU must be set to “Decoder
Cal” (in GSM “Traffic Mode” on the “Network” tab, in WCDMA “Voice Settings
Voice
Source” in the “BS Signal” tab, in CDMA2000 “Primary Service Class
Speech
Service
Service Option 3
Voice Coder” in the “Service Cfg.” Tab). This operation
mode requires an active call to the mobile under test. In other setups, the analog
output on the network side must be configured to output a full-scale 1 kHz sinewave
signal. In a VoLTE setup with external media server, auxiliary program
“CsSinWav.exe” must be started while the media server software is idle or closed.
When the “Decoder Cal” button in the application program is clicked, the measurement
routine starts. In case of an instable measurement result, a warning message is output,
and the routine is aborted without storing the result. If a stable result is obtained, a file
selector allows to choose an appropriate location and file name. The working directory
“D:\UPV\1GA62” should be the preferred location for these files.
The decoder calibration value is alternatively obtained with the “In / Out Calibration”
routines of uplink or loopback on the mobile side. The In/Out calibration requires an
end-to-end connection of the type chosen with the respective tab.
In a circuit switched connection, a new decoder calibration is only necessary if the
CMU or the link handler in the CMU is changed. In a VoLTE connection with external
media server, the decoder calibration has to be re-run if the external soundcard is
exchanged or if any hardware or software control settings for the sound car are
changed.
2e
Rohde & Schwarz 1GA62 16
Using the Application Program
2.4.2 Encoder Calibration
This calibration value is required for downlink measurements and for measurements
with loopback on the mobile side. A valid decoder calibration value is prerequisite for
the calibration routine.
For encoder calibration, the application program adjusts the voltage at output 2 of the
UPV generator to the encoder circuit on the network side (CMU) such that the fullscale decoder output voltage is measured at UPV analyzer input 2. For a circuit
switched connection, the CMU must be set to “Encoder Cal” (in GSM “Traffic Mode” on
the “Network” tab, in WCDMA “Voice Settings
Voice Source” in the “BS Signal” tab,
in CDMA2000 “Primary Service Class
Speech Service
Service Option 3
Voice
Coder” in the “Service Cfg.” Tab). This operation mode requires an active call to the
mobile under test. In other setups, the analog output on the network side must be
configured to loop back the signal from the input to the output with a gain of 1. For a
VoLTE setup with external media server, auxiliary program “CsWavRec” must be
started while the media server software is idle or closed.
When the “Encoder Cal” button in the application program is clicked, the measurement
routine starts and tries to adjust the generator output voltage such that the full-scale
decoder output voltage obtained in 2.4.1 is achieved. If the full-scale decoder output
voltage cannot be adjusted, a warning message is output, and the routine is aborted
without storing the result. If a stable result is obtained, the routine additionally
measures the full-scale output voltage from the electric interface of the mobile. File
selectors allow to choose appropriate location and file names for both result values.
The working directory “D:\UPV\1GA62” should be the preferred location for these files.
The encoder calibration value is alternatively obtained with the “In / Out Calibration”
routines of downlink or loopback on the mobile side. The In/Out calibration requires an
end-to-end connection of the type chosen with the respective tab.
In a circuit switched connection, a new encoder calibration is only necessary if the
CMU or the link handler in the CMU is changed. In a VoLTE connection with external
media server, the encoder calibration has to be re-run if the external soundcard is
exchanged or if any hardware or software control settings for the sound car are
changed.
2.4.3 Mobile Input Calibration
This calibration value is required for uplink measurements and for measurements with
loopback on the network side. A valid decoder calibration value is prerequisite for the
calibration routine. Prerequisite for the mobile input calibration is an active end-to-end
speech connection.
For mobile input calibration, the application program adjusts the voltage at UPV
generator output 1 to the mobile under test such that a certain decoder output voltage
is measured at UPV analyzer input 2. The CMU must be set to “Handset Low” in GSM
(“Traffic Mode” on the “Network” tab), to “Speechcodec Low” in WCDMA (“Voice
Settings
Voice Source” in the “BS Signal” tab) and to “8k Enhanced (Low)” in
CDMA2000 (“Primary Service Class
Speech Service
Service Option 3
Voice
Coder” in the “Service Cfg.” Tab), respectively. This operation mode requires an active
call to the mobile under test. In other setups, the analog output on the network side
must be configured to provide a signal connection from the mobile under test to the
network output.
2e
Rohde & Schwarz 1GA62 17
Using the Application Program
The RMS level sent from UPV generator output 1 to the mobile input is adjusted such
that the CMU decoder output connected to UPV analyzer input 2 corresponds to the
dBm0 level selected in the “Calibration Level” field. The standard speech level is -16
dBm0. However, some mobiles with low sending sensitivity or with dynamic
compression algorithms do not allow to reach this level. In this case the calibration
level of -26 dBm0 can be used. This level is expected to be within the linear operating
range of the uplink path.
The mobile input calibration has to be done for each individual mobile, if codec settings
are changed or if settings in a mobile affecting the uplink signal path are changed.
2.4.3.1
Mobile Input Cal.
When the “Mobile Input Cal” button in the application program is clicked, the
measurement routine for mobile input level calibration with a sine burst signal starts. If
the decoder output voltage corresponding to the selected calibration level cannot be
adjusted, a warning message is output, and the routine is aborted without storing the
result. If a stable result is obtained, a file selector allows to choose an appropriate
location and file name for the result value. The working directory “D:\UPV\1GA62”
should be the preferred location for these files.
Mobile input calibration with sine burst signal is only applicable if the end-to-end delay
is between 50 ms and 260 ms. As a default, “mobile input speech calibration” should
be used, see 2.4.3.2.
The mobile input calibration value is alternatively obtained with the “In / Out
Calibration” routines of downlink or loopback on the mobile side.
2.4.3.2
M. I. Speech Cal.
For codecs which do not transmit a sinewave signal with sufficient fidelity, and for endto-end delays below 50 ms and above 260 ms, this button provides a calibration
method using natural speech.
2.4.4 Mobile Output Calibration
This calibration value is required for downlink measurements and for measurements
with loopback on the network side. A valid encoder calibration value is prerequisite for
the calibration routine. Another prerequisite for the mobile output calibration is an
active end-to-end speech connection.
When the “Mobile Output Cal” button in the application program is clicked, the UPV
generator sends a speech signal and measures the peak output voltage of the mobile.
This value can later be used to set the fix analyzer range for the measurements.
The mobile output calibration has to be run for each individual mobile, if codec settings
are changed, the user volume control is changed or if any other settings in the mobile
affecting the downlink signal path are changed.
2e
Rohde & Schwarz 1GA62 18
Using the Application Program
2.4.5 In / Out Calibration
For each transmission direction, an “In / Out Calibration” routine is offered for the case
that the network interface is not accessible (loopback on the network side), or does not
provide the “Encoder Cal” and “Decoder Cal” routines.
In the case of uplink or loopback on the network side, the input of the transmission
path in the electric input of the mobile under test, connected to UPV generator output
1. In case of downlink and loopback on the mobile side, the input of the transmission
path is the speech coder input on the network side (CMU), connected to UPV
generator output 2.
In case of uplink or loopback on the mobile side, the output of the transmission path is
the speech decoder output on the network side (CMU), connected to UPV analyzer
input 2. In case of downlink or loopback on the network side, the output of the
transmission path is the electric output of the mobile under test, connected to UPV
analyzer input 1.
The “In / Out Cal.” Button starts the calibration routine. A pulsed 1 kHz tone is swept in
amplitude, starting from a high voltage which is gradually decreased. In an ideal case,
the curve of output level (logarithmic scale of the output voltage) over input level
exhibits an almost horizontal branch at high levels due to the saturation of the
transmission path an a diagonally rising branch at medium levels. Full-scale input and
output voltage can be determined from the intersection point of the asymptotes of both
branches.
Caution: Make sure that the input of the transmission path (e.g. mobile headset
input or loudspeaker with power amplifier) is not damaged by the maximum UPV
generator output voltage of 10dBV rms with sine burst and 10 V peak with
speech signal. Do not use this function if you are not sure that the device is
robust enough.
If the calibration routine is successful, file selectors allow to choose appropriate
location and file names for both result values. The working directory “D:\UPV\1GA62”
should be the preferred location for these files.
Also the In / Out calibration is provided in two versions: with pulsed sinewave and with
natural speech as test signal.
2.4.6 Loading Calibration Values from File
The “Browse” button in each calibration line allows to load previously stored calibration
values for each calibration type. The file name of the loaded value is entered in the text
box in the center of the line. If the application program is ended, all calibration values
and file names are stored in a file and reloaded at the next start of the application
program.
2e
Rohde & Schwarz 1GA62 19
Using the Application Program
2.5 Loading a Setup and Starting a Measurement in
Manual Mode
2.5.1 Configuring the Test Signal
The application program allows to specify an appropriate wave (*.wav) file as test
®
®
signal for the PESQ or POLQA test. For requirements on the test signals, see
section 1.3.
The test signal file can be selected after clicking the “browse” button in the respective
line. The name of the selected file is entered in the text box in the center of the line. If
no file name is specified (empty string in the text box), no wave file is loaded to the
UPV setup which means that the wave file specified in the loaded setup will be used.
The textbox can be cleared using the “Clear” button on the right end of the line.
The full-scale level of the test signal relative to the full-scale level at the input of the
transmission path under test is specified in the numeric up/down control in the next line
of the user interface. If the full-scale value is not reached in the wave file, the specified
full-scale value will not be reached at the UPV generator output. The signal from the
wave file can be maximized in the UPV generator after loading by activating the
checkbox “Scale Pk to FS”. As different files usually have different crest factor, “Scale
Pk to FS” does not mean that the rms level or active speech level at the generator
output is normalized.
The level in the speech reference files is specified in “dBov” (“dB overload”) which is
the level referenced to a full-scale square wave signal. A full-scale sinewave signal has
a rms level of -3 dBov. The level at the speech encoder is either specified in dBFS
(referenced to the rms level of a full-scale sinewave) or in digital “dBm0” with
0 dBm0 = -3.14 dBFS.
It is recommended to use speech files which have an internal active speech level of
-26dBov = -23 dBFS. To reach the nominal level of -16 dBm0 = -19.14 dBFS in the
encoder, the full-scale level of these test signals relative to full-scale of the encoder
input or mobile input, respectively, should be set to 4 dB with “Scale Peak to FS”
deactivated.
If the test signal has a high crest factor, a full-scale generator output voltage higher
than the full-scale input voltage of the transmission path under test (i.e. positive level
®
difference in the numeric up/down control) may be required for optimal PESQ or
®
POLQA result. In this case the positive effect of the higher average level has more
influence than the potentially detrimental effect of temporal clipping at the signal peaks.
In the “Play” group box, the play mode for the test signal can be switched between
“Single” and “Continuous”. Continuous playback of the test signal keeps the speech
path in an activated state. When a test is started, the UPV generator is reset and starts
with the beginning of the file. When a significant speech delay is present, the end of
the truncated speech can appear at the start of the degraded signal. To avoid this
effect, switch the “Play” mode to “Single”.
2e
Rohde & Schwarz 1GA62 20
Using the Application Program
2.5.2 Choosing an equalizer filter
For uplink and for loopback on the network side a filter can be loaded to the generator
for approximate equalization of a speaker response, e.g. in case an artificial mouth is
used to send the signal to the microphone of the mobile under test. Note that the
mobile input (speech) calibration has to be re-run when the downlink setting has been
changed.
For downlink and for loopback on the network side another filter can be loaded to the
analyzer for DRP-ERP correction of an artificial ear or for diffuse field or free field
equalization of a head-and-torso simulator (HATS).
Click the associated “Browse” button to specify the desired filter file, which will
automatically be loaded after a setup has been loaded. In folder “D:\UPV\1GA62”
some equalization filters are provided for the HATS. “4128C.npz” provides an
equalization for the average mouth frequency response of HATS type 4128C.
“33_DIFF.npz” and “33_ERP.npz” provide the standard diffuse field equalization and
DRP to ERP correction for the type 3.3 artificial ear.
Note that the mobile output calibration has to be re-run when the downlink setting has
been changed.
2.5.3 Options to be Carried out after Loading the Setup
The application program can be configured to minimize the window of its user interface
after loading a setup (“Minimize After Loading Setup”). This allows to control and watch
the UPV window with the result displays.
If preferred, a single measurement can be started immediately after loading a setup
(“Start Measurement After Loading Setup”).
Alternatively the tab control in the user interface can change to the “Test Control” tab
after loading a setup.
2.5.4 Loading a Setup
The button “Browse and Load Setup” in the tab area opens a file selector which allows
to specify a UPV setup for the respective signal path. For each of the four types,
various example setups are present in subfolder “D:\UPV\ 1GA62”.
After selecting an appropriate file, the name is entered in the text box in the center of
the line and the setup is loaded to the UPV. Thereafter, the relevant calibration value of
the respective input of the transmission path is entered as generator reference voltage,
the specified wave file is loaded to the “Play” function of the generator and the
specified relative peak voltage is set in “dBr” units. The analyzer range is set to
accommodate the maximum output voltage of the transmission path under test as
specified in the relevant calibration value.
Attention: After changes in the calibration values, in the specification of the test signal
and/or in the selection of a filter to be applied, the UPV setup specified in the text box
has to be re-loaded using the “Load Setup” button.
2e
Rohde & Schwarz 1GA62 21
Using the Application Program
2.6 Using the Monitor function
The “Monitor” tab can be used to listen to the speech signal in the current connection,
using the built-in loudspeaker of the UPV or a headset connected to the headset jack
on the front panel.
Before the monitor is switched on, an appropriate setup with appropriate signal file has
to be loaded, using one of the first four tabs.
Figure 13: Controls in the Monitor tab
When the headphone output is enabled and the volume setting is higher than -20 dB,
the volume is automatically reduced to -20 dB to protect the listener’s ears. The
volume can subsequently be re-adjusted also to higher values. When another tab in
the tab control is selected, the monitor output is disabled unless the “Keep Monitor on
when Leaving this Tab” checkbox is checked. In the latter case the speaker remains
active even if a new setup is loaded or automatic tests are started. The controls in the
“Monitor” tab are disabled while automated tests are running.
2.7 Running POLQA® or PESQ® Tests Automatically
2.7.1 User Interface of the Test Automation Tab
®
The “Test Control” tab provides all controls necessary to set up and run POLQA and
®
PESQ test sequences.
2e
Rohde & Schwarz 1GA62 22
Using the Application Program
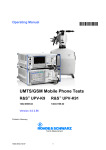
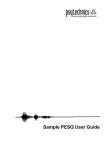
Figure 14: User interface of the “Test Control” tab
2.7.2 Compiling a List of Test Signals
The data grid in the center of the tab shows the compilation of test signals with which
the tests are to be run.
Figure 15:List of test signals
The context menu of the test signal list provides the following entries:
2e
Rohde & Schwarz 1GA62 23
Using the Application Program
Figure 16:Context menu of test signal list
The list can be edited using the buttons below the left half of the grid or with the
respective entries in the context menu. The “Add” and “Edit” buttons open an entry
window where the source file and the relative level can be set:
Figure 17: Entry window for editing test signals or adding test signals to the list
To add a signal to the list, click the “Add” button in the Test Control tab, click the
“Browse File” button in the signal window and browse to the desired speech signal file.
The relative signal level is preset with the value from the first four tabs of the main
window. It can be adjusted individually for each signal.
Figure 18: Buttons for modifying the signal list
With the buttons “Edit”, “Remv.”, Up and Down, entries in the signal list and their order
in the list can be modified.
A subset of the signal files in the list can be selected for use with the checkboxes in the
“Sel.” Column.
Test signal lists can be saved, loaded and appended using the respective entries in the
context menu of the test signal list.
2.7.3 Test and Averaging Options
Figure 19: Test repetitions group box in the test control tab
Each signal can be applied multiple times as specified in the “Test Repetitions” group
box. Erroneously extreme results can be excluded from averaging. However, all results
will appear in the detailed results list and taken into account for the minimum and
maximum result values in the overview.
Figure 20: POLQA® normalization group box in the test control tab
2e
Rohde & Schwarz 1GA62 24
Using the Application Program
®
As POLQA as standardized in ITU-T P.863 does not apply automatic level
normalization of the degraded signal, additional normalization should be applied unless
a meaningful “Gain” value calculated from all involved external gains is available and
can be entered in the Analyzer function panel. Normalization can be done once per
test signal keeping the “Gain” value determined in the first test run for the subsequent
tests with the same signal. Another option is to repeat the normalization for each test
run which may increase test time. From UPV firmware 3.3.1, analyzer function
“POLQA” offers an “Auto Gain” feature which does the level normalization for each test
run in the analyzer. This way, a repetition of the test with changed gain value is not
necessary.
Figure 21: Weighting group box in the test control tab
The results from all test runs on the same signal are averaged with the possible
exclusions specified in the “Test Repetitions” field. For each sequence run, a total
average is calculated from the averaged per-test-signal results. This averaging over all
applied test signals can be done with equal weight or weighted according to the
respective length of the test signal files. These options can be chosen in the “Test
Signal MOS Weighting” group box.
Figure 22: Folder for degraded signals in the test control tab
Degraded test signals can be collected in a specified folder for subsequent analysis of
degradation. The folder is specified in the “Store Degraded Signals” group box. The
wav file names are automatically generated from the test file name and a number
extension. Each degraded file name will appear in the detailed results list to
unambiguously assign the degraded signal file to each result.
Figure 23: Minimum degraded level groupbox in the test control tab
The “Minimum Degraded Level” group box allows to set a threshold for the degraded
level. If the associated checkbox is activated, a running test sequence is aborted when
this limit is violated. This allows to automatically react to a lost speech connection.
2.7.4 Starting a Test Sequence
Figure 24: Direction group box in the test control tab
Before starting a test sequence, the desired test direction(s) should be selected in the
group box below the start buttons. Thus it is possible to run e.g. uplink and downlink
tests in one sequence.
2e
Rohde & Schwarz 1GA62 25
Using the Application Program
If no direction is selected before the start of a test sequence, it is assumed that all tests
are to be run with a setup that has been loaded to the UPV firmware either manually or
using the functionality of the first four tabs in this program. A confirmation for this is
prompted before the sequence starts.
For each selected direction, the setup specified in the respective tab of the user
interface is automatically loaded. However, test signals and levels are set according to
the test signal list in the “Test Control” tab.
2.8 POLQA® and PESQ® Test Results
The last tab in the user interface is dedicated to viewing, reporting, exporting and
managing results.
Figure 25: Results tab
Figure 26: Context menu of the results datagrid
The context menu can be used for reporting and deleting results, and for saving and
loading result lists.
2e
Rohde & Schwarz 1GA62 26
Using the Application Program
2.8.1 Viewing Results in the Data Grid
Initially the data grid shows the averages for each test signal per sequence run.
Figure 27: Overview over averaged results in the results data grid
Clicking on one of the small “+” signs in the row headers opens a new row with a link to
another table showing the detailed results from which the respective row was
averaged:
Figure 28: Link to detailed results in the results data grid
Clicking on the link displays the detailed data:
Figure 29: Detailed results table in the results data grid
The white back arrow “
“ in the caption is the link for closing the detailed table and
returning to the statistic overview table.
In the details view, the entry “Play Degraded Signal of Marked Result” is enabled in the
context menu of the results data grid if the degraded signal is available in a wav file.
When this functionality is chosen, a window for controlling the playback of the
degraded signal opens:
2e
Rohde & Schwarz 1GA62 27
Using the Application Program
Figure 30: Control window for playback of degraded signals
The window allows to choose the output and set the volume. The file is played once.
Then the playback can be restarted using the “Play again” button.
2.8.2 Entering Auxiliary Data
In the “Report” group box, data to be included into the printed report can be
administered:
Figure 31: Report group box in the results tab
The “Details” checkbox decides whether tables with the detailed results are included
into the printed report. In this case the statistic results will be separated row by row,
each with the associated detailed results table below.
If the “Commt.” Checkbox is activated, a comment will be included into the report. An
entry window will pop up when the report is started.
The “Operator” checkbox specifies whether an operator’s name is to be included into
the printed report. For entering a name, click the “Edit” button next to the checkbox.
The “DUT” checkbox allows to add information about the device under test. For
entering name, type, manufacturer and serial number, click the “Edit” button next to it.
2e
Rohde & Schwarz 1GA62 28
Using the Application Program
2.8.3 Previewing a Report
For previewing a report in the Windows print preview, activate the “Preview” checkbox
before clicking “Rep. Sel.” Or “Rep. All”. The latter button starts preview of all results in
the data grid. The “Rep. Sel.” Button starts exclusive preview of results checked in the
“S” column of the table. Finally the Windows print preview opens with a preview of the
report as configured:
Figure 32: Report preview
2.8.4 Printing a Report
A report can be printed on any printer installed in the Windows operating system,
including XPS document writer or pdf distiller.
The printing can either be started from the preview window by clicking the printer icon
top left or by clicking one of the “Re. Sel.” or “Rep. All” buttons without the “Preview”
checkbox activated.
The printer can only be selected if the latter way of starting the printout is chosen.
2.8.5 Export of Result Data to an ASCII file
The “Export results” button saves all available results to a tab-separated txt file or a
comma-separated csv file which can easily be imported to a spreadsheet.
Figure 33: Test results imported to a spreadsheet (excerpt)
2e
Rohde & Schwarz 1GA62 29
Using the Application Program
2.9 Delay Measurements
The “Delay Measurements” tab provides controls for measuring the end-to-end delay
of a speech connection.
Figure 34: Controls of the delay measurement tab
Delay Measurements are performed on a pseudo-random multisine signal by cross
correlation. The test signal further comprises a leading voiced part to activate the
speech coder. The length of the pseudorandom part determines the maximum
measureable end-to-end delay. With a 32k samples pseudorandom noise, a maximum
delay of 0.6 seconds can be measured. With the 46k samples pseudorandom noise,
the maximum delay which can be measured is 1.2 seconds. The delay measurement
works with an end-to-end delay > 10 ms.
To speed up the cross correlation calculation, the number of samples can be reduced
by the “speed factor” by undersampling the test signal before cross correlation. This of
course is a tradeoff against time resolution and noise immunity. For the two available
test signals, separate speed factors are stored by the program.
In the “Subtract Delay” groupbox it is possible to specify for each of the four signal
paths delay values of the system simulator to be subtracted from the end-to-end delay.
Note that any processing delay occurring in the UPV itself is inherently subtracted from
the results before they are displayed.
The buttons in the “Single Measurement” groupbox start delay measurements for each
of the four signal paths and display the result in the textbox below. The S/N factor
displayed is the amplitude ratio between the highest cross correlation peak and the
second highest cross correlation peak. If this ratio is less than 2, the result is deemed
to be invalid. In this case you can reduce the speed factor to improve the noise
immunity of the delay measurement.
In the “Test Automation” groupbox it is possible to start multiple delay measurements
for each of the selected signal paths and do a statistical evaluation as specified in the
“Test Repetitions” groupbox. It is possible to store the cross correlation result as curve
in an ASCII file to a specified folder.
2e
Rohde & Schwarz 1GA62 30
Using the Application Program
2.10 Delay Results
Reporting and handling of delay results is similar to that of the speech quality test
results. Please refer to sections 2.8.1. to 2.8.5.
Figure 35: Controls of the delay results tab
2e
Rohde & Schwarz 1GA62 31
Literature
3 Literature
C
®
R&S UPV Operating Manual
http://www2.rohde-schwarz.com/en/service_and_support/downloads/download_search/
C
Application Note 1GA47, “Calibrating Measuring Microphones and Sound Sources
®
for Acoustic Measurements with Audio Analyzer R&S UPV”
http://www2.rohde-schwarz.com/en/service_and_support/Downloads/Application_Notes/
C
Application Note 1GA49, “Psychoacoustic Audio Quality Measurements Using
®
R&S UPV Audio Analyzer”
http://www2.rohde-schwarz.com/en/service_and_support/Downloads/Application_Notes/
C
®
Application Note 1GA50, “Calibration Tool for PESQ Speech Quality Tests”
http://www2.rohde-schwarz.com/en/service_and_support/Downloads/Application_Notes/
C
Application Note 1MA202, “Next-Generation (3G/4G) Voice Quality Testing with
®
POLQA ”
http://www2.rohde-schwarz.com/file/1MA202_1e.pdf
C
ITU-T P.862 (2001), “Perceptual evaluation of speech quality (PESQ): An objective
method for end-to-end speech quality assessment of narrow-band telephone
networks and speech codecs”, http://www.itu.int
C
ITU-T P.862.1 (2003), “Mapping function for transforming P.862 raw result scores
to MOS-LQO”, http://www.itu.int
C
ITU-T P.862.2 (2005), “Wideband extension to Recommendation P.862 for the
assessment of wideband telephone networks and speech codecs”,
http://www.itu.int
C
ITU-T P.862.3 (2005), “Application guide for objective quality measurement based
on Recommendations P.862, P.862.1 and P.862.2”, http://www.itu.int
C
ITU-T P.863 (2011), “Methods for objective and subjective assessment of speech
quality - Perceptual objective listening quality assessment”, http://www.itu.int
C
User Manual, POLQA OEM Library, Opticom GmbH
C
Application Note “Voice Quality with ITU-T P.863 ‘POLQA’”, Swissqual
http://www.swissqual.com/index.php/pages/downloader/Application_Note__Voice_Quality_with_ITU_P.863_POLQA.pdf
C
2e
ITU-T Application Guide for P.863 (unpublished draft)
Rohde & Schwarz 1GA62 32
Ordering Information
4 Ordering Information
Ordering Information
Type of instrument
Description
Instrument type
Audio Analyzer
Ordering number
®
1146.2003.02
®
1146.2003.66
®
R&S UPV or
R&S UPV66
XLR/BNC Adapter Set
R&S UP-Z1MF
1411.3306.02
Headset Cable Set for UPV
R&S®UP-Z9
1411.3106.02
®
Universal Sequence Controller
R&S UPV-K1
1401.7009.02
SW for PESQ Measurements
R&S®UPV-K61
1401.7309.02
®
Listening quality analysis
POLQA, to ITU-T rec. P.863
R&S UPV-K63
1402.1156.02
Universal Radio Communication
Tester
R&S®CMU200
1100.0008.02
Wideband Radio Communication
Tester
R&S®CMW500
1201.0002K50
®
®
®
For R&S CMU and R&S CMW options, see the brochures and the R&S
web site.
2e
Rohde & Schwarz 1GA62 33
About Rohde & Schwarz
Rohde & Schwarz is an independent group
of companies specializing in electronics. It is
a leading supplier of solutions in the fields of
test and measurement, broadcasting,
radiomonitoring and radiolocation, as well as
secure communications. Established 75
years ago, Rohde & Schwarz has a global
presence and a dedicated service network
in over 70 countries. Company headquarters
are in Munich, Germany.
Regional contact
Europe, Africa, Middle East
+49 1805 12 42 42* or +49 89 4129 137 74
[email protected]
North America
1-888-TEST-RSA (1-888-837-8772)
[email protected]
Latin America
+1-410-910-7988
[email protected]
Asia/Pacific
+65 65 13 04 88
[email protected]
This application note and the supplied
programs may only be used subject to the
conditions of use set forth in the download
area of the Rohde & Schwarz website.
Rohde & Schwarz GmbH & Co. KG
Mühldorfstraße 15 | D - 81671 München
Phone + 49 89 4129 - 0 | Fax + 49 89 4129 – 13777
www.rohde-schwarz.com