1
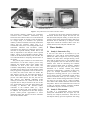
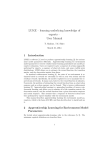
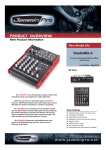
(a) Jammin” Draw (study 1).
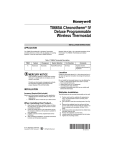
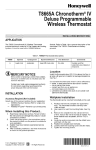
(b) The Honeywell Chronotherm III
thermostat (study 2).
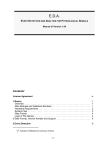
(c) The Philips combined TV-video
recorder (study 3)
Figure 1. The products that were tested in the three studies
and assessing usability problems are completely
consistent across evaluators’. Furthermore, they
believe that the evaluator effect can not be dismissed
as a chance incident, an artefact of the peculiarities
of a single study, or a weakness of a particular
usability evaluation method. Their study made them
realise that the evaluator effect will, to a
considerable extent, have to be managed rather than
eliminated. Hertzum and Jacobsen's (2001)
conclusions were based on comparing set-ups and
outcomes of reported usability studies. Due to the
lack of explicitness in the analyses of the reported
studies, causes of the individual evaluator effects
could not be determined directly from the data, but
were inferred based on comparing characteristics of
the studies.
The present paper examines in more detail how
characteristics of the data analysis process may
influence the evaluator effect. Three studies were
conducted. In each of the three studies, two
evaluators independently analysed the same video
recorded user test data. In one of the studies, a data
analysis approach comparable to that of Jacobsen et
al. (1998) was used. In the other two studies, the
data analysis process was prescribed and done in
much detail and decisions in the data analysis
process were made explicit. For this, the user test
data analysis tool DEVAN (DEtailed Video
ANalysis; Vermeeren et al., 2002) was used. It was
expected that an analysis based on the use of this
tool would suffer less from the shortcomings that
according to Hertzum and Jacobsen (2001)
contribute to the evaluator effect (i.e., vague
evaluation procedures and vague problem criteria).
In addition, the explicitness of the data analysis
process would provide opportunities to better
understand what data analysis activities contribute
most to the evaluator effect.
In section two, the set-ups of the three studies are
described. Section three reports how the user test
data have been analysed. Finally, in section four, the
results in terms of the measured evaluator effects are
described. This is followed by an analysis of what
might have caused the evaluator effect in the two
studies that have been analysed with DEVAN.
2 Three Studies
2.1
Study 1: Interactive Toy
A user test was done on an interactive toy for
children of 5 years and up, named Jammin” Draw
(Mattel Inc. 2003, see figure 1a). It is a toy whereby
children can make music through drawing colour
plates that are placed on the toy. Ten children (age 6
to 8) participated in the test. Data from two of the
children were used for measuring the evaluator
effect. Sessions lasted about 30 minutes. Children
were allowed to first play with the product for a
maximum of 5 minutes without any further
instruction. Subsequently, a number of tasks were
given. For example (translated from Dutch): “I
brought this colouring plate for you. I would like
you to colour it for me. I would like to hear various
musical instruments while you are colouring”, and
“Please choose another background music and tell
me when you are ready with it”. Video recordings
were made of the children and their interaction with
the product. The test was conducted in the context of
a study on assessing usability evaluation methods
with children subjects (van Kesteren, 2003).
2.2
Study 2: Thermostat
In study 2, a programmable home thermostat
(Honeywell Chronotherm III, see figure 1b) was
tested by five subjects (Vermeeren, 1999). None of
the subjects had any previous experience with using