1
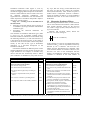
breakdowns in the interface. This means that for
small groups of evaluators, the detection rate
becomes overly high. The second measure, Cohen’s
Kappa,
(Cohen, 1960) presupposes a similar
assumption. It assumes that the total number of
breakdowns is known (or that it can reliably be
estimated). For small numbers of evaluators this
typically is not the case. Therefore, Hertzum and
Jacobsen (2001) suggest using the any-two
agreement measure in such cases.
The any-two agreement measure is defined as the
average of
Pi ∩ Pj
Pi ∪ Pj
(over all ½n(n-1) pairs of evaluators).
In this equation, Pi and Pj are the sets of problems
detected by evaluator i and evaluator j, and n is the
number of evaluators. For the studies reported here,
the any-two agreement measure is used.
As one of the units of comparison, the number of
breakdowns is used. In section 3.1 it was explained
how evaluators can use DEVAN to create lists of
occurrences of breakdowns in interactions. In
studies two and three, DEVAN was used to its full
extent; in study one, evaluators only used DEVAN’s
checklist of breakdown indication types (which is
somewhat comparable to Jacobsen et al.’s (1998) list
of usability criteria), as well as a specified format for
reporting the breakdowns (comparable to that of
Jacobsen et al. (1998)).
In Jacobsen et al.’s (1998) study, Unique
Problem Tokens (UPTs) were chosen as units of
comparison. In their study, each evaluator's problem
report (problem reports are comparable to
breakdown descriptions in DEVAN) was examined
as to whether it was unique or duplicated. Thus, a
final list of UPTs was created. To be able to
compare the present studies’ evaluator effects to the
evaluator effect Jacobsen et al. (1998) found,
duplicate breakdowns were filtered out. Breakdowns
had to be similar in much detail (in content as well
as in level of abstraction) for being considered
duplicates. For example, the breakdown “user is
puzzled about how to get a still image” is considered
different from (the more concrete, but similar
breakdown) “user tries <stop> to get a still image”.
Also, in its detailed content, the breakdown: “user
uses <cursor down> instead of <cursor right>
while trying to set a menu-item” is different from
“user uses <cursor down> instead of <cursor left>
while trying to set a menu-item”. Thus these are
regarded as unique breakdowns.
4 Results
Table 2 shows the evaluator effects that were found
in the three studies, as well as the evaluator effect
found by Jacobsen et al. (1998). The evaluator
effects were measured in terms of occurrences of
breakdowns as well as in terms of UPTs. Of the
three studies reported in this paper, the data analysis
process of study one (the Jammin” Draw study)
compares best to that of Jacobsen et al. The study
seems to yield somewhat higher agreements than
Occurrences of Breakdowns
detected
Any-two
detected
in total
agreement
by both
evaluators
Study 1: Jammin" draw user A (n=2)
Jammin" draw user B (n=2)
Study 2: Thermostat (n=2)
Study 3: TV video user A (n=2)
TV video user B (n=2)
Jacobsen et al. (1998):
Multimedia authoring software (n=4)
8
9
30
43
66
15
15
49
54
110
53%
60%
61%
80%
60%
Unique Problem Tokens (UPTs)
detected
Any-two
detected
in total
agreement
by both
evaluators
8
9
21
26
42
15
14
33
32
61
27*)
39**)
93***)
53%
64%
64%
81%
69%
42%
Table 2. Overview of measured evaluator effects. As a measure for the evaluator effect the ‘Any-two agreement’ as
proposed by Hertzum and Jacobsen (2001) is used. Its value ranges from 0% in case of no agreement to 100% in case of
full agreement; n signifies the number of evaluators.
*)
Average number of UPTs found by two evaluators based on data from one user. This figure compares best to the figures
of study 1, 2 and 3.
**)
Average number of UPTs found by two evaluators based on data from four users.
***)
Number of UPTs found by four evaluators based on data from four users.