1
High-Speed Rail IDEA Program
Handheld Wheel Flaw Detection Device
Final Report for High-Speed Rail IDEA Project 39
Prepared by:
Zack Mian
International Electronic Machines
July 2004
INNOVATIONS DESERVING EXPLORATORY ANALYSIS (IDEA) PROGRAMS MANAGED
BY THE TRANSPORTATION RESEARCH BOARD
This investigation was performed as part of the High-Speed Rail IDEA program supports innovative
methods and technology in support of the Federal Railroad Administration’s (FRA) next-generation highspeed rail technology development program.
The High-Speed Rail IDEA program is one of four IDEA programs managed by TRB. The other IDEA
programs are listed below.
•
•
•
NCHRP Highway IDEA focuses on advances in the design, construction, safety, and maintenance of
highway systems, is part of the National Cooperative Highway Research Program.
Transit IDEA focuses on development and testing of innovative concepts and methods for improving
transit practice. The Transit IDEA Program is part of the Transit Cooperative Research Program, a
cooperative effort of the Federal Transit Administration (FTA), the Transportation Research Board
(TRB) and the Transit Development Corporation, a nonprofit educational and research organization of
the American Public Transportation Association. The program is funded by the FTA and is managed
by TRB.
Safety IDEA focuses on innovative approaches to improving motor carrier, railroad, and highway
safety. The program is supported by the Federal Motor Carrier Safety Administration and the FRA.
Management of the four IDEA programs is integrated to promote the development and testing of
nontraditional and innovative concepts, methods, and technologies for surface transportation.
For information on the IDEA programs, contact the IDEA programs office by telephone (202-334-3310);
by fax (202-334-3471); or on the Internet at http://www.trb.org/idea
IDEA Programs
Transportation Research Board
500 Fifth Street, NW
Washington, DC 20001
The project that is the subject of this contractor-authored report was a part of the Innovations Deserving
Exploratory Analysis (IDEA) Programs, which are managed by the Transportation Research Board (TRB) with
the approval of the Governing Board of the National Research Council. The members of the oversight
committee that monitored the project and reviewed the report were chosen for their special competencies and
with regard for appropriate balance. The views expressed in this report are those of the contractor who
conducted the investigation documented in this report and do not necessarily reflect those of the Transportation
Research Board, the National Research Council, or the sponsors of the IDEA Programs. This document has not
been edited by TRB.
The Transportation Research Board of the National Academies, the National Research Council, and the
organizations that sponsor the IDEA Programs do not endorse products or manufacturers. Trade or
manufacturers' names appear herein solely because they are considered essential to the object of the
investigation.
ii
Handheld Wheel Flaw Detection Device
IDEA Program Final Report
for the Period August 2002 through March 2004
Contract Number HSR-39
Prepared for
the IDEA Program
Transportation Research Board
National Research Council
Zack Mian
International Electronic Machines
July 7, 2004
iii
Table of Contents
TABLE OF CONTENTS ........................................................................................................................... IV
ACKNOWLEDGEMENTS ......................................................................................................................... 1
ABSTRACT .................................................................................................................................................. 2
KEYWORDS ................................................................................................................................................ 2
EXECUTIVE SUMMARY .......................................................................................................................... 3
THE NEED FOR A PORTABLE WHEEL FLAW DETECTION DEVICE ......................................... 4
IMPORTANCE OF INSPECTIONS .................................................................................................................... 4
QUICK PRIMER ON WHEELS AND FLAWS .................................................................................................... 4
WHEEL ACCIDENTS ARE EXPENSIVE .......................................................................................................... 5
PROBLEMS ASSOCIATED WITH CURRENT PRACTICE ................................................................ 5
USER-UNFRIENDLY SYSTEMS ..................................................................................................................... 5
LINE-POWERED SENSORS ........................................................................................................................... 5
WAVEFORM RESTRICTION .......................................................................................................................... 6
ESSENTIAL TECHNOLOGY LIMITATIONS ..................................................................................................... 6
SOLUTION: PORTABLE EMAT-BASED WHEEL FLAW DETECTION.......................................... 6
IEM’S APPROACH ...................................................................................................................................... 7
RESULTS OF WORK ............................................................................................................................... 10
OVERVIEW................................................................................................................................................ 10
EXPERT REVIEW PANEL ........................................................................................................................... 10
SPECIFICATIONS ....................................................................................................................................... 11
HARDWARE DESIGN AND TESTING ........................................................................................................... 11
ALGORITHM/SOFTWARE DESIGN AND TESTING........................................................................................ 18
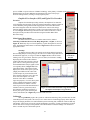
GRAPHICAL USER INTERFACE (GUI) AND TYPICAL USE PROCEDURE ...................................................... 21
USABILITY ISSUES .................................................................................................................................... 23
PROTOTYPE FIELD TESTING...................................................................................................................... 24
CONCLUSIONS......................................................................................................................................... 27
NEEDED REFINEMENT FOR COMMERCIALIZATION .................................................................................... 29
FINAL REMARKS AND LAST-MINUTE RESULTS ........................................................................................ 30
iv
Acknowledgements
Many people contributed to the work described in this report. IEM would like to thank them all,
including:
Chuck Taylor for the TRB
Greg Garcia, Bob Floram, and Paul McMahan for the TTC
Pat Ameem and Larry Benedict for the AAR
Ken Staltz and Bob Blank for the Norfolk Southern
Jerry Manager for Union Pacific
Dr. Greg Martin for CSX
Glen Brandimart for Olympic Railway Services
John Popovich for Griffin
And all of IEM, including Zack Mian, Bill Peabody, Robert MacAllister, and Ryk E. Spoor
1
Abstract
The inability to accurately and reliably determine the condition of a railway wheel leads to a
number of negative consequences, ranging from time and effort wasted servicing wheels that do not need it
(either because they were actually good, or because they are too flawed to return to service) to accidents
caused by flawed wheels. Current ultrasonic inspection technologies have a number of key flaws mostly
due to their need for a liquid or gel couplant and for fixed-location power sources. International Electronic
Machines Corp. (IEM), having produced a promising conceptual demonstration, developed a prototype for
an EMAT (electromagnetic acoustic transduction) based Portable Wheel Flaw Detection Gauge.
The resulting prototype demonstrated the ability to reliably, repeatably, and accurately determine
the condition of a railway wheel’s tread or flange with a portable, rugged device, with the potential to do
the same to other wheel components. During this project IEM created designs for signal pulsers,
preamplifiers, power supplies, sensor heads, and many other necessary components, as well as
incorporating multiple signal analysis algorithms, an expert system to identify types of flaws, and a graphic
user interface.
Keywords
EMAT, noncontact, flaw detection, railroad wheels, digital signal processing
2
Executive Summary
International Electronic Machines Corp. (IEM) developed a portable Wheel Flaw Detection Gauge
based on EMAT (ElectroMagnetic Acoustic Transduction) technology. The prototype developed in this
project provided reliable and accurate detection of flaws on and through wheel tread. IEM demonstrated
that with a different sensor head – which could be designed for simple exchange – flaws on the flange
could be located equally quickly and reliably; preliminary experiments also demonstrated that the same
technology and approach would be able to find flaws in all other parts of the wheel, such as the rim and
plate. This technology is of importance to:
•
•
Improve the safety of railroads by detecting flaws in wheels before the flaws can cause
breakage; broken wheels account for many millions of dollars in accident costs every year
(see FRA data at safetydata.fra.dot.gov), and undetected flaws in wheels are a significant
cause of wheel breakage. Breakages can lead to derailments, and such derailments are of
increasing concern due to increasing axle loads, especially on lines used by high-speed
passenger trains.
Reduce operating costs by ensuring that only wheels that have repairable flaws or conditions
are serviced, while those with condemnable flaws are eliminated from service, and that no
good wheels are subjected to unnecessary turning and servicing.
In preliminary work on this project, IEM demonstrated that such equipment could be made
portable and that it was possible to detect tread flaws in railroad wheels utilizing this technology. Current
technology uses piezoelectric acoustic transducers, which require a liquid or gel couplant to transmit the
signal to the wheel, giving rise to many difficulties with this technology – refraction of the signal at the
boundary, variable couplant performance dependent on temperature, and sensitivity to dirt and surface
conditions. EMAT technology eliminates these problems as the electric and magnetic fields interact in such
a way as to permit an electric field to generate pulses of ultrasonic waves directly into a metallic object
(such as a railway wheel) without requiring any physical contact or medium to transfer the pulses back and
forth. Thus an EMAT-based device can send and receive signals at any temperature, in any weather, and
even through surface coatings, grease, paint, and surface flaws such as spalling and shelling.
While a pre-prototype demonstrated the basic feasibility of the concept, it required a complete
reworking to become a functional, practical prototype. This involved the design and development of unique
sensor heads, EMAT pulsers, controllers, digital signal processor-based boards, coil designs, power
supplies, signal filters, and other ancillary hardware, as well as the creation of robust, innovative, and
proprietary software for noise filtering, signal reception and enhancement, feature detection and analysis,
including expert system design, fuzzy logic coding, and the design of an effective user interface. In
addition, IEM designed the Wheel Flaw Detection Gauge to withstand the rigors of field use, as
instruments for use in train yards will inevitably be subjected to considerable impact, stress, and wildly
varying temperature, humidity, and precipitation conditions.
IEM produced a prototype of the Wheel Flaw Detection Gauge and tested it in laboratory and field
settings on different wheel sets with conditions ranging from brand new to condemnable flaws. The Wheel
Flaw Detection Gauge demonstrated accurate, reliable performance, recognizing and localizing multiple
types of flaws, not being fooled by minor surface conditions, passing all good wheels, and producing the
same results on each wheel in multiple readings, thereby demonstrating that its readings are consistent,
reliable, and accurate.
Further development is needed to finalize the commercial design of the Wheel Flaw Detection
Gauge. This includes the design of sensor heads for rim and plate inspection, the creation of a mechanism
to allow the easy exchange of these sensor heads in the field, a finalized casing and component design that
will minimize size and weight, custom lithium-based battery packs for longer battery life in a smaller unit,
ergonomic/usability testing, and extensive field testing of the unit with railway personnel to provide
feedback for refinements in convenience and responsiveness.
3
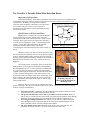
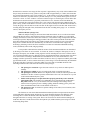
The Need For A Portable Wheel Flaw Detection Device
Importance of Inspections
In the railroad industry, wheel defects and failures caused by time and wear are a significant cause
of derailments. Detection of defects and wear-related flaws before such accidents occur, therefore, is an
important issue. In addition, it is important to be able to
accurately detect and identify wheel flaws of various kinds to
CL
prevent unnecessary time, money, effort, and wear on
Hub
expensive truing equipment on a wheel that should be simply
removed from service.
Plate
Quick Primer on Wheels and Flaws
Figure 1 shows a compressed cross-section through a
typical railway wheel on a rail. Starting at the center and
working outward, the wheel consists of a hub, a “plate” section
(analogous to the spokes of a bicycle wheel, but a solid piece
of metal), the rim (which has a “field”, or outward edge, and a
“gauge”, or inner edge), the tread (which is the part that
contacts the rail itself), and the flange, which is the
overhanging part of the wheel that keeps the wheel securely on
the rail.
Rim
(field side)
While these wheels are made of extremely hard steel, they
are also subjected to tremendous stresses and can develop a number
of flaws, including thermal cracks (fractures caused by localized
heating), gouges, spalling and shelling, and other wear-related flaws
and features such as hollow tread. A few of these are shown in
Figure 2.
The current practice of inspecting wheels is based on the
AAR guidelines as they appear in the Manual of Standards and
Recommended Practices, G-18. These guidelines recommend the
use of two piezoelectric ultrasonic sensors with an appropriate
couplant to interrogate the tread surface from the side of the wheel
as well as from the running surface of the wheel. However, the
present practices do not evaluate cracks in the wheel flange, wheel
plate, or cracks in the wheel tread along the cross-section of the
wheel. Unfortunately, these three defect types account for many
wheel-related failures.
Tread surface
Rim
(gauge side)
Flange
Rail
Figure 1: Railway wheel features
(A)
(B)
(C)
(D)
Figure 2: Wheel flaws/wear:
(A) shelling, (B) gouge, (C)
hollow tread, (D) machined cut
simulating crack
Moreover, there are several current trends that have been
and are continuing to increase the overall stress and wear on wheels, and that thus will lead to increasing
numbers of fatigue-related failures:
1.
2.
3.
4.
Increasing car loads. A continually growing proportion of the rail fleet consists of 125-ton
and greater cars; it is possible that this trend will increase.
The growth of double-stack service with as-yet unknown stresses on wheels. While it is
still too early to evaluate the effect of this traffic, the simple physical geometry shows that this
method of rail shipping changes the force distribution on the wheels in significant ways.
Increasing use of flange lubrication. This reduces wear on wheels as well as on the rails,
thus reducing the perceived need for replacement of the wheels and increasing the overall
chances that older wheels will suffer a fatigue-related failure.
The use of harder steels in rails. While the harder steels reduce wear on the rails, they
potentially increase the effective wear on the wheels that run on these rails.
4
Clearly, therefore, it is of great importance that a device and method be developed to detect the
various forms of wheel flaws that can lead to failure. To ensure both acceptance and use within the
industry, any device to perform this task must be accurate, reliable, inexpensive and, most importantly,
both fast and easy to use. Unfortunately, no such device currently exists. Extant devices fulfill virtually
none of these requirements, and are also limited in the areas of wheel to which they can apply. From IEM’s
communications with the TTCI, important areas for the detection of flaws in freight wheels are the tread,
flange, and rim. No current-art systems can interrogate any portion of the wheel other than the tread. One
such system, for example, will indicate certain flange conditions, such as “high flange”, but will do so
based solely on tread condition (i.e., a flat spot on the tread indicates a strong likelihood that the flange is
high at that point), and must make assumptions (such as a perfectly circular flange) in order to do so. In
addition, as described below, current-art ability to detect flaws even in the tread is significantly limited.
Wheel Accidents are Expensive
As mentioned previously, wheel accidents are considerably more expensive per incident than the
average equipment failure incident. All told, in the five year period from 1998 through 2003, wheel failures
accounted for a loss of over $73,000,000, many such failures due to undetected flaws in flange, tread, and
rim (based on the FRA’s data at http://safetydata.fra.dot.gov/OfficeofSafety ). If any significant fraction of
these accidents could be prevented by proper inspection, the savings to the industry would be substantial.
This savings would very likely rise over time, since – as detailed previously – there are a number of
industry trends that are virtually certain to cause an increase in the number of fatigue-related wheel failures.
These savings figures do not include the considerable amount to be accrued through ensuring that
maintenance is done only on known-good wheels rather than on wheels that are discovered to be flawed
only after some work has been expended on them.
Problems Associated With Current Practice
While current wheel inspection techniques and statistics are considerably superior to those of
several decades ago, there are still a number of avoidable failures of wheels every year. Several factors in
the current technology contribute to this problem.
User-Unfriendly Systems
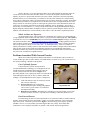
Current inspection systems, mostly based on
conventional ultrasonic technology, are not designed to be userfriendly and require considerable interpretation. Often, the
current systems (such as the one shown in Figure 3) are
physically difficult to use, requiring the wheel to be removed and
rotated through an entire turn, or more, in order to obtain full
readings. User-unfriendliness has three negative consequences:
1.
2.
3.
Cost. The end-users must be extensively trained;
this costs time and money.
Figure 3: Ultrasonic Wheel
Increase in Errors. Any complicated
Inspection Probe
measurement that requires training and judgment
carries with it a greater chance of a confused or
misunderstood reading.
Reluctance in Acceptance. Introducing new technology to any field is likely to meet with
resistance from the work force, especially if the technology is inherently difficult to use.
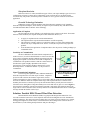
Line-Powered Sensors
In a field setting, the most convenient instruments to use will be those that are smallest and most
portable, while retaining all of the functionality of other, less portable instruments. Current ultrasonic
inspection systems, such as the system shown in Figure 3, are tied to large power supplies, generally
standard 110V-AC or a semi-portable system that supplies this same voltage. This renders them
cumbersome, if not completely unsuitable, for portable “walk-around” inspection applications.
5
Waveform Restriction
Different sections of a wheel, and different types of flaws, can require multiple types of waves or
configurations of sensors to detect them. Unfortunately, most current-art devices are limited in the
waveforms they will produce, and cannot produce a number of wave types that would be useful in this
application.
Essential Technology Limitations
Perhaps the greatest current-art problem stems from ultrasonic technology itself. Standard
ultrasonic inspection techniques, while certainly far superior to prior methods, carry with them certain
inevitable drawbacks that are intrinsic to the technology.
Application of Couplant
The first and most obvious difficulty is the application of the couplant to the wheel. Even under
otherwise ideal conditions, the couplant itself places extra demands on the user, as:
•
•
•
•
A supply of couplant must be carried and maintained.
The couplant must be kept beneath the transducer in sufficient quantity.
The couplant is generally sensitive to temperature changes. As train yards (and thus their
wheels) can vary in temperature from -40ºF to +120ºF, this can present a major practical
problem.
Even automated, the application of couplant tends to slow the process of taking readings by a
considerable factor.
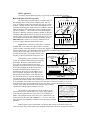
Sensitivity to Contamination
The above difficulties all assume that the couplant itself is
usable. However, in real life railroad wheels are often covered in dirt,
grime, and oil, with other materials randomly appearing in the mix.
Applying the couplant to such wheels carries with it a high risk of
contamination. The problem with this is that the control and use of
the ultrasonic signals is highly dependent on the acoustic
characteristics of the couplant, and these characteristics can be
drastically altered – in unknown fashions – by the presence of
contaminants.
Ultrasonic
Transducer
Couplant
Fluid
Refraction at
boundary
Target being
Inspected
Figure 4: Refraction of sound
beam at couplant/target
Even leaving these problems aside, traditional methods of
interface
ultrasonic inspection have one other major weakness. Couplant is
present in order to deliver the ultrasonic signal to the wheel in
sufficient strength to be clearly readable; however, this requires that the signal traverse the boundary
between two different media: the couplant and the target. This requirement causes refraction at the
boundary between the two media, in precisely the same manner and for precisely the same reasons as
refraction occurs with light traversing the boundary between air and water or glass. As seen in Figure 4,
the piezoelectric transducer generates an ultrasonic beam that is noticeably refracted upon entering the
target. The net effect is that it becomes extremely difficult for a traditional ultrasonic device to interrogate
the target beneath the shallow surface layer.
Signal Transmission Limitations
Solution: Portable EMAT-based Wheel Flaw Detection
International Electronic Machines (IEM) Corp proposed the design and construction of an
electronic method of non-invasive wheel inspection based on Electro-Magnetic Acoustic Transduction
(EMAT) technology. This proposed system would be low-cost, battery-powered, simple to use, reliable,
and rugged enough for use in the field; it would eliminate the shortcomings of the current art devices
described above, while offering both performance and price advantages.
6
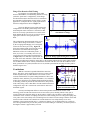
IEM’s Approach
To properly describe IEM’s approach, it is necessary to understand EMAT technology.
Magnetic Bias Field
Hdc
Basic Principles of EMAT Operation
The functioning of an EMAT device is based on the fact
that changing electric fields generate magnetic fields, and vice
versa, in conductive media, that such fields can exert force on the
medium – and that, therefore, movement of the medium can and
will induce electromagnetic fields/currents in a conductor under the
right circumstances. The combination of these principles makes
possible a transducer – a device that can convert electromagnetic
impulses to vibrations in the target medium, and that can then take
vibrations of that medium and convert them into electromagnetic
impulses again. A more accurate and detailed description is given
below, based on the introduction to EMAT technology given in
PB81-109514, Development of a Prototype EMAT System for
Inspection of Rails (Rockwell International, 1980).
Pulsed wire
Jac
Iac
F
Hac
Hdc
Ferromagnetic
conducting
sample
Figure 5 shows a pulsed wire that induces a magnetic
Figure 5: Basic EMAT principle
field Hac that, in turn, induces an eddy current Jac in the near
surface of nearby conducting sample. If a separate bias magnetic field Hdc is imposed over the same region
with the right geometry, the combination of the bias magnetic field and the eddy current produces a
sideways force on the eddy current. This force is then
Angle of beam can be changed
transferred to the lattice of the sample with the same
by changing frequency
frequency as the original pulsed current in the wire.
Short tone burst to
generate eddy currents in
sample
P
Vs
= arcsin ------------If the geometry of the transducer coil and its
F*P
MAGNET
current are repeated with alternating signs under the
Transducer coil
bias magnet, the pattern of instantaneous lattice
+ - + - + forces that are produced within the test object
propagates as an ultrasonic beam. This is illustrated
Stress pattern generated by
magnet and eddy currents
more clearly in Figure 6. The directions of the
propagation and polarization of this beam are
Sample being inspected
determined by the geometry of the EMAT coil, or
more specifically, the pattern of the eddy currents
that are induced in the surface of the test object by
Figure 6: Propagation of ultrasonic beam
the coil, and the direction of the bias magnetic field
from EMAT
vector at the surface of the part. This mechanism of
generating the ultrasonic beam within a surface layer of the test object itself, rather than in the transducer,
is why an EMAT does not have to be in physical contact with a conductor to generate or receive an
ultrasonic beam. However, the EMAT coil must be close to the part since the magnitude of the eddy
currents, hence, that of the ultrasonic beam, decreases approximately
(A)
exponentially with the separation distance (lift-off).
(B)
The periodicity of the EMAT coil, P, the frequency of the
electrical tone burst, F, and the shear wave velocity in the sample, Vs,
control the propagation direction of the shear wave produced by an
EMAT. The propagation angle of the shear wave is determined by the
relation shown at the upper right in Figure 6: 2 = arc sin (Vs/FP). This
figure illustrates the mechanism of ultrasonic beam forming by an EMAT
transducer.
(C)
Figure 7: Pulser/Receiver
transducer configurations
Radio frequency pulses in the EMAT coil generate eddy currents in the wheel surface. The
interaction of the eddy currents and the static magnetic field generates ultrasonic energy that is beamed
7
within the wheel, and produces echo signals from cracks and other irregularities in the wheel. The returning
echoes interact with the magnetic field at the wheel surface, creating an echo pulse in the EMAT coil that
can be used to determine the presence and magnitude of defects encountered by the beam. These signals
can be sent and received in different configurations, as shown in Figure 7. Figure 7A depicts a transducer
being used for both send and receive – a method called the “pulse-echo” or monostatic approach, while 7B
and 7C both have different transducers in the send and receive roles – the so-called “pitch-catch” or bistatic
approach. The latter approach lends itself well to differing angles of interrogation, as shown.
This, combined with the ability to control the propagation angle via frequency as depicted in
Figure 6, graphically illustrates how beam scanning can be performed electronically, merely by changing
the driving frequency rather than mechanically tilting the scanning head, which can be useful and more
convenient for some applications, such as changing the interrogation angle and depth into a wheel.
Advantages of EMAT Approach
EMAT has three significant advantages over ultrasonic testing equipment using piezoelectric
transducers. These are that it requires no liquid couplant, it can see “through” spalling/shelling and surface
fractures, and it is not distorted by standard acoustic signal refraction problems.
No Liquid Couplant
Since they do not require a couplant to transmit the ultrasonic signals, EMAT based systems:
1.
Have the potential for operating at greater speeds in areas where the wheel has been treated
with lubrication grease, as there is no requirement to clean the wheel in order to ensure a
proper coupling as may be necessary when using classic ultrasonic sensors.
2.
According to Oscar Orringer (Rail Testing: Strategies for Safe and Economical Rail Quality
Assurance, Transportation Research Record, 1174, pp 28-42) “EMAT transducers subject the
rail to a DC magnetic field together with a pulsed RF Signal. These two electromagnetic
components combine to generate ultrasound and receive return signals directly in the railhead;
thus the refraction problem is avoided. Electromagnetic transduction between the rail and the
probe also suggest that EMAT systems will tolerate heavy lubrication interference better than
conventional systems.” For purposes of wheel flaw detection, this is significant, as it shows
that the absence of the couplant eliminates the refraction effect that is deleterious to
conventional ultrasound interrogation of wheels.
3.
Maxfield, Kuramoto, & Hulbert (Evaluating EMAT Designs for Selected Applications Mater.
Eval., 45, 1166-1183 (1987)) add, "It is sometimes possible to work with liftoff distances
(separation between sensor and rail) of 3 mm (0.125") or more." While this is more useful for
moving applications, a large potential liftoff distance permits the EMAT to operate through
significant layers of burned-on grease, paint, and other contaminants.
See Beneath Head Checks, Shelling, and Surface Fractures
Work performed by North American Rockwell has shown that its 90 degree shear wave system
EMAT is able to "skim along just under the surface and reflect strongly from transverse flaws that lay close
to the surface even though the rail surface may be covered with small cracks or checks that reflect the Shear
Vertical (SV) waves used by conventional transducers". Again, this demonstrates one of the major
advantages of EMAT technology, in that it shows that surface flaws that can severely interfere with
conventional ultrasonic interrogation of metallic structures are no impediment to an EMAT-based
approach. IEM has verified that this applies to the common wheel condition of shelling.
Not Distorted by Acoustic Coupling Refraction
Some of the waveform modes such as a true SH0 mode are only achievable through using an
EMAT sensor. The angle of attack of standard piezoelectrically induced ultrasonic beams can be distorted
by minor changes in the position of the sensor relative to the rail. EMATs are less susceptible to this
distortion.
8
Challenges Presented by EMAT Approach
Prior IEM work summarizes the significant disadvantages of EMAT systems as follows:
Lift-off Sensitivity
With any acoustic or electromagnetic signal, the strength of the signal varies roughly with the
square of the distance between the source and the receiver. With EMAT, however, there is a complication
introduced due to the fact that the actual signal interrogating the wheel is being generated by the interaction
of another signal with the wheel, and that the signal being processed in the main system is generated by the
interaction of the interrogated wheel with the receiving EMAT field. In effect, there is more than one
inverse-square factor involved – the emission from the EMAT pulser to the wheel surface, then the transit
of the resulting ultrasonic waves through the wheel, and then the emission of electromagnetic waves from
the wheel to the receiving EMAT transducer. This means that any increase in distance from the wheel
surface can have a drastic effect on the strength of the signal sent into the wheel and returning therefrom.
Still, as mentioned earlier, lift-off is a relatively minor concern in this application and more than sufficient
lift-off has been demonstrated for purposes of this application.
Inefficiency
EMATs are relatively inefficient at generating ultrasonic energy when compared with
piezoelectric transducers, which are used in standard ultrasonic inspection. This, in turn, results in
relatively poor signal-to-noise ratios (S/N). The S/N ratio, however, can be improved upon using a number
of signal processing techniques.
Return
"Bang"
pulse signal
EMAT
from flaw
Detecting Wheel Flaws with EMAT
The detection of a wheel flaw through EMAT functions very
similarly to that of any acoustic-based detection technique. Figure 8
shows a simplified version of the way in which such detections are
accomplished.
Hidden
Flaw
A pulse is sent out from the EMAT unit. This pulse proceeds
to travel around the circumference of the wheel in both directions. As
the speed of sound in various materials, including steel, is well-known, the time from the initial “bang” to
the sound of the returning original signal can be precisely calculated. If a flaw exists in the wheel at any
point between the traveling signal and its return to the sensing
Figure 8: Detection of a flaw
location, a portion of the energy of the pulse will be reflected back.
inside a wheel
This “return” signal will inevitably reach the EMAT sensor before the
original signal finishes its traverse of the circumference of the wheel. Thus, to detect the flaw involves
“listening” for signals that occur between the initial “bang” and the successive returns of that original
signal to the EMAT location. The only exception is if a flaw exists at the point precisely opposite the
EMAT, where both waves cross paths; a return from such a flaw will, of necessity, arrive at the same time
as the original signals and will therefore be lost in the noise of the returning main signal. Therefore, to
eliminate this possibility, it is almost always necessary to take two separate readings, at slightly different
locations on the wheel, so as to be able to detect flaws in this small “dead zone”.
In actuality, of course, the process is more elaborate, as the signals can be reflected from the
internal surfaces, spread out and decay over time, and so on, necessitating multiple samples, signal filtering
and enhancement, and other techniques to obtain clear and unambiguous results, but the basic principle
remains as illustrated above. Detailed discussion of the various signal processing techniques used in the
Portable Wheel Flaw Detection Gauge will be found in the discussion of “Algorithm/ Software Design and
Testing” under the Results section.
IEM’s Criteria for an EMAT-Based Portable Wheel Flaw Detection Gauge
IEM’s Portable Wheel Flaw Detection Gauge must offer more performance than any current-art
device while overcoming their shortcomings. Therefore, it should:
•
Be entirely portable. IEM’s device should be something a user can carry around and use
9
•
•
•
•
•
•
without need for any outside support.
Require no couplant. This is in fact an inherent advantage to the selected EMAT approach.
Interrogate the entire wheel with one or two swift applications.
Be unaffected by the presence of dirt or contaminants.
Be unaffected by surface conditions such as rust, paint, burned-on grease, and so on.
Provide a user-friendly interface.
Be highly reliable.
IEM demonstrated, prior to the commencement of this project, that such a device was theoretically
possible. Our pre-prototype unit was able to send an interrogation pulse around the entire circumference of
a railroad wheel and determine the location of a pre-known fault along that circumference, with a single
application of the pre-prototype on one point of the wheel. As detailed in our Patent #6523411, IEM also
has designed and tested a static, in-ground version of this technology. The pre-prototype’s components
were, unfortunately, quite incapable of providing the performance needed in signal generation, detection,
analysis, and so on; it sufficed only to demonstrate that a Portable Wheel Flaw Detection gauge was
POSSIBLE. In order to accomplish these goals, this proposed gauge should include the following elements:
1.
2.
3.
4.
5.
Multiple EMATs each having a transmit coil to propagate an ultrasonic wave into a wheel
and a receiving coil to receive an ultrasonic surface wave from the wheel.
A portable battery operated EMAT pulser (presently not commercially available) for
exciting the EMAT and producing an ultrasonic wave in the wheel.
A computer control unit connected to and communicating with the pulser (radio
frequency generator) and the EMAT.
A data acquisition unit connected to and in communication with the computer control unit
and the EMAT assembly for determining defects in the wheel.
A digital signal processing (DSP) system to interpret the ultrasonic waveform data so that
flaw data can be shown in easy to understand reports. The DSP will also provide superior data
analysis not available by present techniques.
Results of Work
Overview
The development of a new instrumentation product such as the Wheel Flaw Detection Gauge is a
complex process. The process use in this project was as follows:
•
•
•
•
Specifications development – the creation of a clear description of all major aspects of the
proposed device’s performance and physical requirements; this also includes meetings with
interested parties
Hardware selection/design, assembly, and testing – the selection of appropriate
components to create a device capable of meeting the specifications, or, if required
components do not exist, the design and manufacture of these unique components, and
subsequent testing on the hardware to determine that it can and does perform as expected
Software design and testing – the creation of applications/programs that will perform all of
the functions detailed in the specifications, and testing these applications to ensure they
perform as required
Prototyping, refinement, and field testing – the creation of a fully-functional version of the
device, testing and elimination of any last-minute difficulties, and analysis of the test data to
determine how well the prototype met the specifications.
Expert Review Panel
A panel of experts from railroads, TTCI, AAR, and wheel manufacturers was established to
provide guidance for the project. Panel input included useful information from TTCI on the areas of
interest for the AAR wayside crack detection system, which helped verify IEM’s technical direction in this
project. As tread and flange flaws were of interest and IEM’s wayside work had already begun to target
those areas, it was decided that the Portable Wheel Flaw Detection Gauge would also begin with a focus on
10
those areas, and expand to cover the rest of the wheel after the basic design and development had been
completed. It appeared likely that the majority of the work to be done on the other wheel areas would be
the design of other sensor heads, rather than any other major theoretical work.
Specifications
Starting from our prior work in the EMAT NDE field, our pre-prototype results, and our
knowledge of the railroad industry, IEM developed a set of preliminary specifications. Following this, IEM
then met with or contacted a number of interested parties to refine and update these specifications. The
result of this effort was a comprehensive practical specification for the Wheel Flaw Detection Gauge,
reflecting both the performance and physical requirements to make the device useful and acceptable in the
industry. These specifications, along with how well IEM’s final prototype met them, are shown in full in
Conclusions (Table 2).
LED
Display
Backlight
Inv
+5v Control
ISA Bus
Key Pad
Encoder
Key
Pad
Touch
Controller
PS2 Mouse Port
CPU
Parallel Port
+12v ISO
GND
+12v ISO
Pulser
LV supply
A/D
+5v
GND
GND
+12v
Envelope
Detector
+5V DC-DC
+12V
DC-DC
GND
+12v
GND
GND
SW1
Power
Control
Main
Switch
SW1
S1
+12v
FUSE
SW SPDT
+400V
GND
HV Supply
HV Switch
T1
Toroid
GND
Battery
J1 A
1A
2A
Charge Jack
3
2
1
1
C1
CAP
2
F1
+12v
2
To Gauge Head
Figure 9: Block Diagram of Portable Wheel Flaw Detection Gauge design
Hardware Design and Testing
Figure 9 is a block diagram of the design of the Portable Wheel Flaw Detection Gauge.
The hardware design for the portable Wheel Flaw Detection Gauge consists of a total of five major
components:
1.
2.
3.
Sensor or gauge head. This is the actual working “contact” section of the gauge, in which the
EMAT units are situated and perform the send/receive function on the wheel.
Pulser unit. The pulser generates the signal that is used by the transmitting EMAT; thus it is
the pulser that determines the power and frequency of the “bang” sent into the wheel for
detection purposes.
Preamplifier unit. The preamplifier takes in the received EMAT signals and prepares them
for amplification; by specific processing approaches the preamplifier can very significantly
reduce noise.
11
4.
5.
Power Supply. Various components within the system will require different voltages and
currents; a properly designed power supply distributes the power from the batteries
efficiently.
Controller unit. The controller is the user interface and associated electronics that permit the
user and the gauge to effectively interact, with the gauge providing readings and the user
adjusting the parameters and storing/retrieving data as needed.
Sensor Head
The sensor head is the “eye” of the system; it actually induces the signals into the wheel and
receives the return signal. It is also the most likely component to be damaged, as it must be applied to the
wheels and removed from them, resulting in a high probability of being dropped on rails, banged against
wheels or other train components, and so on. The nature
Receiving Coil
of the EMAT process, moreover, requires powerful
Transmit Coil
magnets that require considerable force to remove from
Coil Assembly
wheels. The sensor head, therefore, consists of two
removable holder
mutually dependent subsystems: the EMAT components,
Magnet holder
which perform the actual sensor work, and the
assembly
mechanical support components, which both protect the
electronics and are designed to facilitate the use of the
Magnet
sensor head; due to the facilitation role, these are
Plungers to remove
discussed in the later “Usability Issues” subsection.
head from wheel
Lever handles to
Figure 10 shows an exploded view of the sensor head
operate plungers
and all components.
EMAT Components
Connector for
data cable
There are three components of the actual
EMAT system present in the sensor head. The first is the
magnet, which is required as described earlier to permit
the induced eddy currents in the sample to generate
acoustic signals. This is an extremely powerful
Figure 10: Sensor head showing all
permanent rare-earth magnet that provides an excellent
components
bias field for EMAT operation. Despite its small size –
roughly1x1x2 inches – the magnet is powerful enough to make it extremely difficult to remove the sensor
head from the wheel. This necessitates particular design features, detailed in Usability Considerations, to
facilitate the removal of the sensor head from the wheel once readings have been obtained.
The other two components are the coils – one to transmit the signals,
the other to receive the return pulses. As described in the “Basic Principles of
EMAT” section, the same coil designs can be used to receive the return signals
as to transmit the initial signals. These coils, shown in Figure 11, are IEM
custom-designed EMAT transducer coils encased in a protective plastic casing.
Without the plastic casing, the coils would be easily damaged during the process
of taking readings. While the basic coil circuits are a sandwich, with Kapton®
plastic on either side, they are not particularly resistant to wear. IEM added a
layer of PEEK (poly-ether-ether-ketone) plastic. IEM has tested this design in
hundreds of wheel readings, and while wear does occur, the wear process is
extremely slow and IEM estimates that many thousands of wheels could be read
with any given set of coils before there would be any probability of wearthrough, as long as very basic precautions were taken with the readings (see
Usability Considerations).
Figure 11: Custom
IEM EMAT coil
Pulser
As noted in our Background section, IEM has had experience in creating EMAT systems
previously. The demands of this particular application, however, were unique and imposed rigorous
restrictions on the design of the EMAT unit, especially with respect to the pulser design, as there was not,
at the time, any portable pulser unit that would meet the power or size requirements.
12
Pulser Operation and Requirements
The heart of the system, the pulser, as its name implies, generates pulses of electrical signals that
are sent through the coil to create the EMAT signal. A pulser must generate signals at high frequency in
order to create high-frequency sound waves in the target object. The frequency, as mentioned earlier,
determines the interrogation angle of the sound beam and determines the minimum size of flaw/feature that
can be detected by the system. Given the speed of sound in steel, this demands a high-frequency pulse of
500,000 Hz or even more to resolve flaws that are on a centimeter scale.
The physics of EMAT operation also place another demand on the signal generation source. All
electromagnetic phenomena obey the inverse-square law of intensity; in the case of EMAT, this works
against the technology because the induction of the signal must be done across some distance X from the
actual surface, and then the return signal must be sensed across the same distance X from the surface. To
counter the inefficiency, it is therefore desirable to generate the pulses at very high power, increasing the
return signal and making the signal easier to sense and analyze.
Finally, even with relatively high-power pulses, the return signals tend to be very low power and
thus can be adversely affected by noise present during reception. This is one of those technical problems
that often presents an apparent paradox; one needs high-frequency, high-power pulse generation, but that
generates noise that can overwhelm the signal in the sensitive receivers… and so one tries to increase the
power to get more signal, which creates more noise in the detection electronics, and so on. These
challenges had to be confronted in the development of IEM’s portable EMAT technology.
IEM’s Original Pulser Design
At the time of initiating this project, IEM had a pulser design that had demonstrated some promise
in a related project for the New York State Energy Research and Development Authority (NYSERDA).
However, for purposes of the Portable Wheel Flaw Detection system, it became clear that it had a number
of flaws that made it unacceptable for this application:
1.
2.
3.
Insufficient power. The previous pulser unit could develop power of approximately 800
watts. IEM’s calculations showed the portable unit would require at least 2500 watts to
guarantee a clear signal.
Excessive size. The previous pulser unit, while considerably smaller than other commercial
units (see the RITEC pulser discussed below), nonetheless was nearly as large as IEM
considered acceptable for the entire controller unit, which was to incorporate the pulser,
preamplifier, power supply, and user interface.
Fixed mount power supply. The then-current pulser unit was dependent on standard A/C
power to run it.
In addition, as the prior unit was intended for use at a fixed location with fixed power supplies, its
electronics were not designed to be as robust and tolerant of electrical variations, shorts, and so on as
should be the case for a portable unit meant for long-term hard use.
RITEC Pulser
While working on EMAT designs for the Rail Flaw Cart (mentioned previously), IEM researched
a number of sources for new pulser technology. The culmination of this search was the choice to work with
RITEC (a company with considerable experience in this area) and obtained RITEC’s OEM package,
allowing us to assemble the components in a configuration that was most appropriate for our purposes. The
RITEC pulser unit resulting from this possessed several positive traits when compared to the prior unit – a
peak power of 5KW and a wide range of operational frequencies up to 20MHz. Despite these advantages,
the RITEC pulser unit had one major practical disadvantage: size. Assembled, with all ancillary equipment,
the RITEC unit was large enough to take up an entire drop-in payload bay, such as those for mobile units
like IEM’s Rail Flaw Inspection Cart. In addition, the RITEC pulser required a standard AC power source.
Accordingly, IEM began to explore the possibility of designing our own miniaturized custom pulser for the
EMAT units.
13
IEM’s Custom Mini-Pulser
IEM believed it was possible to design a pulser unit that was far smaller and would still develop
the same level of power with no more distortion. Further research into the design of pulsers led us to
believe that a design based around MOSFET technology would prove effective.
Results of Mini-Pulser Design
IEM’s custom mini-pulser, whose main PCB is shown in
Figure 12, is a twin-channel design capable of developing over
2500 watts per channel, with an integral bridging capability that
permits a combined pulse of over 5kw, equal to that of the RITEC
pulser. It is frequency agile and usable with many different
EMAT designs. Despite this tremendous performance, the pulser
and requisite power supply connections now fits into a space
barely the size of two fists, considerably smaller even than IEM’s
prior custom design, and uses considerably less energy. In
addition, the electronics of this pulser are extremely robust
against incident electrical signals.
Figure 12: IEM's Mini-Pulser
main circuit board
Preamplifier
Preamp Design
One source of noise can come from the actual transmitting electronics; the other major source
comes from the received signal – both the signal itself and the electronics used to capture it. IEM designed
its own custom preamplifier and receiver to minimize noise. Earlier COTS-based designs for the
preamplifier were bulkier and noisy. By making a custom state of the art preamplifier, IEM significantly
reduced the noise from the signal. IEM’s new preamplifier subsystem incorporated the following features:
•
•
•
•
Lower noise floor: achieved by better circuit design layout and faster/lower noise op-amp
devices; IEM also took into account the power supply design (see later) for its noise effects,
something often neglected in other designs.
Faster recovery times: Done through the gating of the signal; this permits the system to
focus on only specific parts of the received pulse train.
Integral active filters: for bandpass and other forms of noise elimination. In particular, IEM
incorporated specialized hardware bandpass filters to eliminate specific sources of noise in the
associated hardware.
Signal delay gating: to simplify the analysis of the signals over time.
Results of New Preamplifier
As IEM expected, signals retrieved by the new preamplifier
were noticeably “cleaner” and had spurious or irrelevant parts of the
signal eliminated to a great extent. To further improve the preamp’s S/N
ratio, IEM redesigned it to incorporate a surface mount chip and
embedded ground planes; this permitted much potential noise to be
shunted off through the ground plane. This redesigned preamplifier was
Figure 13: IEM's custom
extremely small – measuring 1.3”x2.9” (see Figure 13). With these
designed preamp/receiver
ultra-miniaturized units, IEM was able to design EMAT units that
subsystem
contained both transmit and receive circuitry, allowing them to operate
in either mode as needed, without increasing their size; in fact, IEM’s EMAT units are considerably smaller
than those from our other suppliers.
Power Supplies
The challenges presented by the power supply have been mentioned previously. In fact, there were
two power supply systems to be dealt with – a low-voltage system for the logic, preamplifier, and driver
sections, and a high-voltage supply for the pulser output section; in addition, these required that a power
source be selected or designed to run the supply systems that would permit the entire device to be portable.
The resultant power supply systems are unique, fully custom designs. No such systems existed before this
14
design, as no prior EMAT systems designed were envisioned to run simultaneously at such high power and
be completely portable. The design and testing of these devices involved some of the most careful design
work of the entire project.
Power Supply Design
A Problem of Noise
The low-voltage supply must run the preamplifier, internal logic system, and the driver section of
the EMAT. In short, it supplies the power to time the signal generation, trigger the “bang” (main pulser
signal), gather the return signals, perform basic filtering and preprocessing, and send this information to the
controller for analysis. The problems with this power supply stem from the fact that they are, of necessity,
connected to and associated with the high-voltage supply, and the sections of the EMAT unit which the
low-power supply supports are extremely sensitive to noise of all sorts. Any noticeable variation in the
power supplied can produce noise. For ordinary signals this level of noise is not significant, but as noted
earlier the return signals for an EMAT device are extremely weak, even with high-power pulser electronics
to provide a powerful initial signal. Because of this, the power supply for the preamplifier and associated
electronics must be extremely stable and low-noise, and no other sources of noise should be present,
especially if they produce noise in the band for which the system is listening. However, in order to produce
the signal for which you are listening, you need to use a high-power source that will generate a huge
amount of noise while running, as there will be large varying currents and voltages involved. The question,
then, was how to satisfy both requirements – powerful, high-voltage and inevitably noisy power supply for
the pulser, and low-voltage, ultra-quiet supply for the detector and control electronics?
Solution Through Cooperative Timing
IEM recognized that there was a solution implied by the way in which the functions of the EMAT
were operated. The pulser itself only needed power during the “bang” sequence. The “bang” itself, of
course, was irrelevant to the detection of wheel flaws; what IEM was interested in was detecting signals
after the “bang”. If, then, all the “noisy” work of converting power into its proper voltage and current
levels could be done during the “bang” phase, there would be an effective “quiet pause” in which the
preamplifier and other low-power electronics could do their work with virtually no internal noise sources.
This approach depends on extremely accurate synchronization of the electronics involved, and in rough
outline proceeds in this manner:
1.
2.
3.
4.
5.
6.
7.
8.
Timing driver signals that it is time to send a pulse.
High voltage supply activated.
Low-voltage capacitors charged during high-voltage pulse preparation and generation
“Bang” sent.
Timing driver signals pulse phase is over.
High-voltage supply shuts down.
Preamplifier, logic, and driver draw low-voltage current from capacitors, providing a lownoise source and permitting the “listen” phase to pass with very little interference.
“Listen” phase ends; return to beginning of pulse phase.
While simple in basic concept, to find the precise design required took a great deal of design work
and then experimentation. The end result, however, performs exactly as desired, generating virtually no
noise during the crucial listening phase.
Power Source
The high voltage and current demands of the high-power supply presented another challenge. The
initial power-up stage of the Portable Wheel Flaw Gauge draws considerable current, and thereafter the
Gauge maintains a fairly steady draw of one ampere or so. This requires that the power source be able to
provide a very high peak flow for a short time, and retain considerable capacity thereafter for long-term
maintenance. Currently, IEM’s solution is a customized lead-acid battery pack, similar to a miniaturized
motorcycle battery. The high peak flow and reserve capacity are both common features of lead-acid
batteries which has made them common choices for power sources. One drawback to this solution is that
lead-acid batteries – even small ones – do not have a particularly good power density, as shown in Table 1.
This means that a fairly large (and heavy) battery is required for IEM’s application. The entire device
15
remains portable, but is heavier than optimal. IEM would prefer to use lithium-ion batteries, which have a
far greater energy density and therefore offer the potential of a much smaller and lighter power source.
However, COTS lithium batteries are not designed to safely provide the peak current draw which the
Gauge requires; the charging and discharging of lithium batteries can present significant hazards if not done
properly. IEM’s intent for commercial development is to design a custom lithium-ion power source that
can provide both the peak draw and the reserve capacity that is needed for this application.
Table 1: Battery Technology Survey
Ave. Operating Volt. (V)
Energy Density (W-h / Kg)
Volumetric Eff. (W-h / Liter)
Cost ($ / W-h)
Memory Effect?
Self-Discharge Rate (% month)
Temp. Range (C)
Env. Concerns?
Sealed Lead-Acid
2
35
85
.25 to .50
No
5 to 10
0 to +50
Yes
Nickel Cadmium Nickel Metal Hydride Lithium Ion Lithium Metal
1.2
1.25
3.6
3
45
55
100
140 - 300
150
180
225
300
.75 to 1.5
1.5 to 3.0
2.5 to 3.5
1.4 to 3.0
Yes
No
No
No
25
20 to 25
8
1 to 2
-10 to +50
-10 to +50
-10 to +50
-40 to +150
Yes
No
No
No
Controller
The controller (shown in Figure 14) is the brain of the Portable Wheel
Flaw Detection Gauge. The pulser sends the basic signals; the sensor head detects
the return signals; the controller’s CPU and the software running thereon makes
sense of these signals, stores the results, and controls all the operations of every
other component of the machine. The controller integrates a number of
components into a single, compact unit that contains most of the key electronics,
supplies the power, supports the unit physically, and provides the user interface.
CPU
IEM has designed a number of rugged datalogger and industrial computer
products. Each specific application, however, has its own unique demands that
require a careful re-evaluation of the current technology and a selection of an
appropriate CPU – the workhorse section of the controller unit, which performs
most of the work involved.
Figure 14:
Portable Wheel
Flaw Detection
Gauge controller
For this application, after examination of the various options available,
IEM selected the Octagon System’s 5070 CPU control card. This unit, intended for high-performance, lowpower, rugged embedded control applications, offered a large number of attractive features for IEM’s
application, including (but not at all limited to) the following:
•
•
•
•
ZF Micro ZFx86 128MHz processor (more than adequate for
this application)
Integral Compact Flash card support
Integral LCD screen support
Multiple OS (NT, 98, CE, Linux, DOS, etc.) support
The 5070 (Figure 15) has many other potentially useful features,
including built-in connectivity for Ethernet, USB, parallel, and other
interface technologies. Octagon Systems has been very responsive to
inquiries and requests, and such support is always a major consideration in
the design and prototyping of new products that will inevitably require
support in all components if they are to be a commercial success.
Figure 15: Octagon
Systems' 5070 CPU
Control Card
Display Selection
For instrumentation applications of this nature, an LCD flat-panel display is one of the most
obvious and efficient display modalities. They draw little power, have a low profile, and modern LCD
panels can be quite rugged while achieving excellent resolution and providing many interface display
options. For this purpose, IEM selected the Philips LB064V02-B1 LCD display. This LCD display has high
16
resolution color capability, a built in backlight for low-light applications, and is provided with antiglare and
hard surface coatings.
In addition, this display offers one other very useful feature for this particular application. As the
preferred user interface for modern applications is a GUI – graphical user interface – some form of pointing
device is necessary. The LB064V02-B1 comes with an integral touchscreen capacity, eliminating the need
to include a separate touchpad, trackball, or other pointing device that would add size and inconvenience.
Digitizer
The digitizer takes the analog signal produced by the
preamplifier and envelope detector and converts it into a digital signal
suitable for analysis by the software. There are many different digitizer
cards – often called ADC (analog-to-digital converter) cards – on the
market. IEM selected the Diamond-MM-32-AT card, from Diamond
Systems, as the digitizer for this particular application. Shown in Figure
16, the MM-32-AT takes samples from the envelope at a rate of
200ksamp/sec, providing ample accuracy for detecting and locating flaws
within the wheel.
Figure 16: Diamond MM32 AT digitizer card
Power Supply
Supplying power for the CPU and associated cards required that this, too, have its own power
supply. However, this section of the device did not have the same specific problems associated with the
actual EMAT circuitry, and IEM therefore did not have to perform the same custom power supply design
that was necessary for those prior subsystems. Instead, a low-noise, high-efficiency power supply for the
main controller was assembled from two COTS components.
Integration and EMI/RFI Abatement
Having selected the components, it was then necessary to assemble all components into a
functional whole. This was facilitated by having made careful consideration of integration demands early
on and including those considerations in the component selection process. Because of this, integration of
the physical components on a basic level proceeded smoothly; the CPU had built-in support for the display,
and our design for the preamplifier and envelope detector was intended to feed directly to the selected ADC
digitizer.
However, the basic assembly would not function as a unit due to other conflicts. The most
important of these, on which IEM had to expend a considerable amount of time and effort, was abatement
of electromagnetic/radio-frequency interference (noise). As noted previously, this problem had been dealt
with on the pulser/sensing side by arranging for the preamplifier and associated electronics to be essentially
inert during “bang” sequences and active in the quiet intervals. This approach, however, was not possible
for the main controller, as it would effectively require a reboot of the system on every “bang”, something
that would take far too long. Other parts of the system, such as the unique power systems, had a potential
for similar interference.
There are basically two physical approaches that can be taken to eliminating this kind of
interference: build a shield around the noisy component, or to move sensitive components as far away from
the noisy one as possible. After a great deal of experimentation, IEM arrived at a final controller design that
minimized noise and permitted the entire system to continue functioning reliably and swiftly. Among other
required modifications, IEM designed a custom grounding enclosure for the pulser unit to intercept and
contain all the extreme noise pulses from the device.
Basic Controls
Separate from the main user interface are several controls hardwired into the controller and visible
on the controller’s base. Figure 17 shows all of these connections and controls. They are:
•
Test inputs – for verifying the functionality of the Wheel Flaw Detection Gauge. These
inputs consist of a trigger signal input and a receiver for obtaining the triggered signal.
17
•
•
•
High Voltage Enable – to prepare
the system to actually obtain
readings, the high-voltage supply
must be activated. It should not be
kept on at all times as this will waste
power.
Low Voltage On/Off – this is the
main system power switch.
Battery Pack connection – where
the power supply connects to the
controller.
High-Voltage supply enable
(on only when actually taking
readings)
Test probe ports
Battery
pack port
Main Power On/Off
Receiver
Trigger
Figure 17: Hardwired controls and ports on
main controller
Algorithm/Software Design and Testing
Basic Signal Processing Algorithms
IEM has performed the task of basic
EMAT signal analysis many times over the years.
A number of techniques have been developed
that have served well in this area.
Successive Signal
Returns
Maximum Signal
Strength = 255
1
2
3
4
Bandpass Filtering
Noisy signal
Ideally, a signal is sent out into the
Initial signal pulse
("Bang")
target under interrogation, and the return signal is
identical to the interrogating signal except with
changes that denote the flaws or structure of the
target material. In the real world, however, a
3
4
1
2
signal is essentially never “pure”, and internal
noise, outside sources of sound and electrical
Filtered signal
signals, and other elements make it likely that the
received signal is not even particularly close to
pure. It therefore becomes important to be able
to eliminate parts of the received signal that are
Figure 18: Bandpass filter eliminating spurious
not associated with the interrogating pulse in
noise and leaving desired signal
which we are interested. One of the basic ways to
do this is to install a filter that will not pass signals below
Successive Signal
a certain frequency or above another selected frequency;
Returns
Maximum Signal
this form of filtering is called a bandpass filter. IEM has
Strength = 255
used bandpass filtering in a number of applications.
1
2
3
Figure 18 shows a raw wheel signal (top, showing the
first, second, and third signal returns) and the signal after
a bandpass filter has been applied to it (bottom). To
"Spike" noise
eliminate spurious environmental and interference signals,
then, IEM has installed a hardware bandpass filter.
Figure 19: Bandpassed signal with
Noise “Spike” Elimination
“spike” noise
In real environments encountered by IEM in the
development of wheel and rail crack detection, such as train yards with large electric-based locomotives
and other electrical systems present, noise “spikes” – very strong transient signals covering wide bandwidth
– often are encountered. Such a signal would, after bandpass filtering, look like the one shown in Figure
19. To remove this type of noise, IEM uses a dv/dt filter – one that measures the change in overall voltage
as compared with time. A true signal will exhibit some overall breadth and measurable “ramp-up” and
“ramp-down”; a noise spike will go from very low to very high signal and back to low again in very short
time. By eliminating drastic, very short-term changes this form of noise can be removed, as shown in
Figure 20.
18
Signal Envelope Filtering
Successive Signal
Returns
The signals above are reasonably simple to
Maximum Signal
read with the unaided eye, but in order to permit
Strength = 255
automated analysis of them, they must be reduced to a
curve that is better represented in ways a machine can
1
2
3
understand. This is done by deriving the signal envelope
– a curve that delineates the overall behavior of the
signal. There are a number of hardware and software
methods for doing this; for purposes of the portable
Wheel Flaw Detection Gauge, a hardware solution is
Figure 20: Noise eliminated from signal
preferred, as this saves on processing demands in the
after dv/dt filtering
restricted processing environment of a portable device.
In simplified terms, the signal envelope is derived by taking the original signal, converting the negative
portions of the signal to positives and adding them to
the positive portion of the signal, and then producing a
curve that outlines, or “envelops” the resulting signal
graph. The resulting envelope is smoothed to produce
an actual curve. This process is represented visually in
Figure 21. Note that Figure 21 is done on different
data than the prior figures, to show some more features;
a flaw signal can be seen between the returns.
Signal Averaging
As signals in field conditions tend to be
relatively “rough”, even after the previously-described
Figure 21: Signal Envelope
approaches to improve the signal, IEM utilizes a rolling
average in approach to “smooth” the signal. This can
eliminate spurious signal spikes and produces curves that are more amenable to mathematical analysis; this
is very important for automating the analysis of wheel data. In this case, we are averaging the value of a
group of XY values for a given period of time –
points 1, 2, 3 are averaged, for instance, and then
points 2, 3, and 4, and so on. As the number of
points increases, there is a growing apparent
time-shift delay in the resultant curve (due to the
points being the average of data that is slightly
Original Signal
displaced in time relative to the “original”), as
Rolling
seen in Figure 22, which shows a set of regular
Average
time-domain data and the result of a 100-point
rolling average of this same data. Note that the
average data is smoother, much of the noise
cancelled out, but that there is a delay in the
peaks derived from the point averaging. In order
to line the peaks up, an automatic timecompensation function must be applied. We
apply just such a function in Figure 23, showing
Figure 22: Rolling Average, non-timethat the clarified curve is now properly aligned
compensated
with the raw data. Figure 24 shows this process
applied to the signal envelope (A) derived from
Figure 20, the result visible as (B). A comparison of the two images shows that the signals have been
emphasized and their transitions smoothed.
Advanced Algorithms
Feature Extraction and Thresholding
In order to provide a device that performs most of the work for the user, it is necessary that the
Wheel Flaw Detection Gauge be able to actually determine the existence of flaws on its own. One
necessary component of this is to enable the device to be able to tell when “peaks” (significantly higher
19
periods of signal) occur within the signal, and whether those peaks exceed some level of signal that would
indicate that they were true detected signals rather than just artifact of noise. The first of these subtasks
involves feature detection and extraction;
the second, the establishment of a threshold
and the detection of anything that surpasses
that threshold. These are examples of tasks
that are essentially trivial for human beings
because we have built-in feature extraction
and threshold detection ability; it is,
Original Signal
therefore, common for people to
underestimate the difficulty of these tasks
in the computing world. In actuality,
developing such algorithms is a very
nontrivial task if the results are to be robust
Phase-Compensated Rolling Average
and reliable.
Figure 25 shows IEM’s feature
extraction and thresholding algorithms
Figure 23: Time-phase compensated rolling average
applied to the signal envelope generated in
Figure 24. As can be seen, these algorithms establish several
(A)
thresholds – two for the detection of the return of the main signal,
suitably scaled for attenuation over space and time, and two in
the corresponding intervals for detecting potential signals within
Successive
those intervals; these pairs are the higher and lower generally
Signal Returns
1
2
3
horizontal lines seen in Figure 25. Each detected feature within
the critical intervals is shown by an asterisk; as can be seen,
IEM’s algorithm detects every notable peak within the intervals.
Expert System
(B)
An “expert system” is one of several types of so-called
“artificial intelligence” utilized in “smart” electronic systems.
Others include fuzzy logic systems and Artificial Neural
Networks (ANNs), both of which IEM has used in other
applications.
1
2
Successive
Signal Returns
3
Expert systems are essentially collections of rules and
Figure 24: Rolling average
decision trees that enable a system to perform a function very
applied to signal envelope
similar to that performed by an expert in the field in question. As
a simple example, if you wanted to program a shopping
robot to evaluate produce so that it would always get
vegetables of appropriate ripeness and condition, the part
of the expert system associated with, say, choosing the
Return signal
right avocados for making guacamole might involve rules
threshold
Area shown
about determining the state of an avocado, first via visual
in Closeup
cues (how green, holes or clearly rotting spots, etc) and
then by tactile examination (how firm or soft the avocado
is), and then make decisions about the acceptability of the
Return 1
Return 2
Detected
avocado based on the results of these rule inputs.
Calculated Signal
Thresholds
To create the current expert system for the Wheel
Flaw Detection Gauge, IEM tested a number of different
wheels in various circumstances and monitored the process
by which we were able to determine the presence or
absence of flaws, their nature, and so on. The results of
this monitored process were codified into a rule-decision
set that represented the evaluation, selection, and decision
20
Signal Peaks
Figure 25: Results of IEM's feature
extraction and thresholding algorithms
process of IEM’s experts on the use of EMAT technology. After primary evaluation of the expert system,
IEM decided to incorporate additional programming in the form of fuzzy logic
decision-making software, creating a “Fuzzy Expert System”.
Graphical User Interface (GUI) and Typical Use Procedure
Overview
Separate from the data processing software, the Graphical User Interface
(GUI) facilitates the interaction of the user and the instrument by making it simple to
control. IEM has prototyped and tested an appropriate GUI for the Wheel Flaw
Detection Gauge that offers all of the basic functions for control of the Gauge
functions and the display and storage of results. The control panel for the GUI can
be seen in Figure 29. Following a discussion of the controls of the GUI is a brief
description of the procedures followed when using the Portable Wheel Flaw
Detection Gauge.
1
2
Main Control Descriptions
The main GUI screen offers seven main control choices, labeled
Start/Stop, Calibration, Review, Edit, Help, Diagnostics, and Quit, as shown in
Figure 26. While they may seem self-explanatory, a quick description of each is in
order. Supplemental radio buttons are labeled in Figure 26 and discussed in their
appropriate section.
3
Start/Stop
As might be expected, this is the control used to begin and end sessions of
data recording/analysis. In the prototype, this can be set to utilize single data files for
Figure 26:
demonstration purposes, or a larger test data file. Figure 27 shows the GUI after
Controls for
running a test on a good wheel. Once the system is started, it will obtain a reading,
the GUI
displaying the raw data in the left-hand
window (this data can be shown as the raw
pulse-echo or as the signal envelope) and
the threshold/feature analysis graphs (of the
sort originally shown in Figure 25) in the
right-hand window. The bottom window
displays the results of the expert system in
judging the condition of the wheel. The
system attempts to present the data in all
three formats to allow the user to have the
most clear and complete view of the
behavior of the data. For standard
inspection purposes, of course, the key data
will be contained in the bottom window:
the determination of whether or not the
wheel is good or bad. The determination of
whether a wheel is good or bad, and, if
Figure 27: Wheel Flaw Detection Gauge GUI showing
bad, what the condition in question is, is
the capture and analysis of a good wheel.
done by the expert system. Selecting the
“Print” radio button (#1 in Figure 26) prints the results of a scan.
Calibration
Selecting Calibrate prepares the system for calibration and testing. This procedure must be done
immediately before the system is first used, so as to ensure that it is functioning properly and to adjust for
the specific design parameters for each individual system. Following this, calibration will be needed only
infrequently, either as part of specific periodic maintenance procedures, or under circumstances in which
the user has reason to suspect some problem with calibration due to unusual readings or an accident or
other event that may have affected the system.
21
In order to properly calibrate the system, the user must make sure that the proper calibration
wheel is available. This calibration wheel has been engineered by IEM to produce signals that emulate
those of specific flaws, thereby allowing the detection and expert system to be directly tested and adjusted.
When Calibrate is selected, it will remind the user
that a wheel must be selected and the Wheel Flaw
Detection Gauge’s sensor had placed upon the
calibration wheel. This message is shown in Figure
28. Click “OK” after ensuring that the sensor is
correctly placed; if it is not, calibration cannot occur
and the user will see only error messages.
Figure 28: Popup window asking user to
Calibration only needs to be done under two
verify the sensor is on the calibration fixture
circumstances: firstly if the sensor head is changed
(as each head will have its own detection characteristics) and secondly if the user notes behavior that
indicates that the unit is not well calibrated. It may be of use, however, to follow procedure similar to that
used with IEM’s Portable Electronic Wheel Gauge, and check calibration at the start and end of each shift,
simply to ensure the procedure is never entirely forgotten. Checking calibration is very quick, a matter of a
minute or so.
Review
Review is used for checking prior results, comparing old data with new, and so on. Upon selecting
Review, the user is presented with a choice to select the file containing the data that he or she wishes to
review. Once the file has been selected, it is analyzed and displayed just as though it were new data (as
shown under the “Start/Stop” section). Associated with the Review function is another radio-button style
control (#2 in Figure 26) called “Test Templates”. This permits the user to utilize signal template files
supplied with the system (see Prototype and Field Testing for more detail on these files).
Edit
The “Edit” choice opens a file menu that permits the user to examine and edit specific system files
to meet their specifications.
There are currently three system files relevant to the Edit GUI selection. These three files are:
•
•
•
wheelflaw-default.sys – this file stores all of the control values for running the wheel crack
detection application, including the sampling frequency, number of samples, flag values for
what actions the program takes at various points, and so on.
wheelflaw-logfile.sys – this file records all the activity of the wheel crack application, unless
the controlling flag variable in default.sys is set to disable this.
wheelflaw-rules.sys – this file contains many of the rules used by the expert system to
determine what wheels are and are not bad. Having this available as a separate file greatly
facilitates the fine-tuning and upgrading of the expert system.
Help
Selecting the Help button will bring up the Help files, including the User Manual, for the Wheel
Flaw Detection Gauge.
Diagnostics
Any instrument can develop difficulties, due to external or internal factors. Thus it is necessary to
provide means to analyze the functioning of the device and determine what may be going wrong. A
number of different responses or choices may be available during a diagnostic run.
If the main unit is connected to the Internet in some fashion, the radio button seen in Figure 26
labeled as #3 (“Remote”) may be selected. If it is active, the Wheel Flaw Detection Gauge will be able to
communicate with IEM directly, and IEM can diagnose, troubleshoot, and often will be able to fix any
issues remotely from our headquarters.
22
Quit
This selection needs little explanation. When Quit is clicked, the wheel crack application shuts
down. Remember to save any data before quitting, or it may be lost.
Using the Portable Wheel Flaw Detection Gauge
The procedure to use the Portable Wheel Flaw Detection Gauge is fairly obvious and
straightforward. The following list gives the procedure steps and approximate time.
1.
2.
3.
4.
5.
Activate Gauge. The Gauge is first activated by turning the main power switch (see Figure
17) to “on”. This will cause the machine to “boot” and will automatically load the testing
application. This will take a minute or two. The Gauge can be left on subsequent to this, so
this time cost applies only once per “shift” of use.
Sign In. The user will be given some sort of designation (username and password, etc) so as
to track and control use of the system. This takes about 10 – 15 seconds and is also a onceper-shift task.
Enter Pre-measurement data. This may include things such as the train car designation,
specifics of the type of testing being done, and so on. This is a bit hard to estimate as there
could be automated methods for doing this in some settings (and thus once the measurements
begin there is effectively no time cost), or there might be several entries needed. Done once
per each vehicle, and may take 30 seconds or so; the user then readies the Gauge by selecting
the “Start” button from the user interface.
Remove coverplate. This has to be done just before starting a sequence of readings; 2 – 5
seconds.
Take measurements. The user places the sensor head on the wheel, activates the high-power
switch (Figure 17) to permit it to take a reading, moves the head (as discussed in Usability
Issues) if desired for a second reading, and then switches off the high power and removes the
sensor head; if care is taken the coverplate may be left off until all readings have been taken,
but if any significant interval is to pass between readings the coverplate should be reapplied.
This sequence takes 20 seconds or less to complete; a strong, fast user could conceivably
perform two readings on one wheel in 5 seconds. The user then continues the procedure until
done with all wheels on that particular vehicle, at which point they would select the “Stop”
command on the user interface and repeat steps 3 through 5. Remember to reapply the
coverplate if any significant interval is to elapse between measurements.
The other described options in the control interface will generally be used in an office setting –
reviewing prior data, calibration, and so on. The precise nature of the entry and use procedures will need to
be determined and is discussed in the Needed Refinement for Commercialization section.
Usability Issues
Mechanical Support Components
Due to its “front-line” position in the wheel evaluation, the
sensor head must be made as rugged as possible, despite the presence of
delicate interior components. The rugged and solid nature of the head is
best seen in the rear view shown in Figure 29; the main casing is solid
metal and able to withstand a great deal of punishment.
Figure 29: Sensor Head
rugged metal housing
The PEEK plastic that protects the coils has demonstrated excellent wear resistance; however, it is
not particularly resistant to punctures from sharp or edged objects pressed against its surface.
Unfortunately, with a magnet of the strength needed to perform the EMAT readings, steel objects such as
screwdrivers, loose screws, and metal debris, if present, can be drawn to the coil region by the magnet; the
impact and attempts to remove them can easily damage the coil through puncturing or cutting the PEEK
casing. To protect the coils when readings are not being taken, a steel coverplate was fashioned. The
EMAT magnet holds the coverplate firmly on; removing the flat coverplate is difficult, so IEM is
23
experimenting with a number of potential designs for removing the plate more easily. Figure 30 shows the
coverplate in position on the sensor head.
Figure 31 shows the sensor head with the coverplate removed; the coils
are clearly visible through their casing. It is strongly recommended that
the coverplate only be removed when readings are about to be taken, and
replaced whenever a series of readings have been finished; this
minimizes the chance of accidents as described. When the cover is off,
basic precautions should be taken, such as ensuring no sharp/edged metal
tools or other objects are in the immediate vicinity, and performing a
quick wipe (with a rag, rough cloth, etc.) of the wheel surface to ensure no
sharp pebbles, metal shavings, or other edged materials are present when
the head is placed on the wheel.
Figure 30: Sensor head
with protective coverplate
Figure 31 also illustrates one of the other unusual features of the
sensor head – the mechanical design necessary to enable users to remove
the sensor from the wheels it is examining. As shown previously in Figure
10, a pair of plungers, activated by squeezing a handle on the sensor head
Figure 31: Sensor head
unit, is included in the sensor head design to assist in overcoming the
without protective cover
powerful pull of the head’s magnet, that would otherwise make it
extremely difficult to remove. The operation of this mechanism is shown in Figure 32, though with the
head turned upside down to show how the head is removed. In
Handle
Plunger button
actual operation, the coil side of the sensor head would be
Handle out
pushed in
down up
resting on a wheel surface prior to removal.
The user grasps the sensor head firmly, and then
squeezes the handle. This has a cam-based lever action on the
plungers, that are forced up and out of their settings and push the
head away from the wheel. The user then pulls up and away with
a slight twisting motion, removing the sensor head from the
wheel with ease; without using the plunger-based removal
system, it is possible that a smaller or weaker user would find it
virtually impossible to remove the sensor head at all!
Prototype Field Testing
Head Removal
before
Head Removal
after
Figure 32: Operation of removal
assisting plunger mechanism
Using the components discussed previously, IEM
assembled and field tested a prototype of the Wheel Flaw Detection
Gauge. This prototype is shown in Figure 33, and consists of the
sensor head and connector, main controller, and power pack (on
back of unit).
Tread Flaw Field Testing
Field testing of the device used the collection of wheel sets
IEM has for our in-house railroad testbed (a total of 8 separate
wheel sets). These sets include wheels with known flaws, new
wheels, and used but still good wheels. Some of these wheels were
shown in Figure 2, illustrating some of the flaws for detection. One
of the wheels (Figure 2D) had a small crack machined into it, as it
is difficult to locate an actual wheel that has an adequately small
Figure 33: Prototype of
flaw of this nature for testing purposes. The machined crack was
Wheel Flaw Detection Gauge
65mm (2.56 inches) long, running across the tread towards the field
side, and had a depth and width of 0.8mm (0.0315) inches, making
it a quite subtle defect in terms of size. Another similar crack was later machined into one of the knownflawed wheels to provide two separate flaw targets in a single wheel for testing. All of the flaws in IEM’s
test wheels were visible on the surface. Broader testing should be done on known-flawed wheels at some
24
location such as the TTCI that has many such sample wheels, including some with subsurface flaws not
externally visible.
In addition, IEM extracted EMAT signal data for wheels from a wayside crack detection system
developed by the U. S. Department of Transportation and AAR. This system used similar techniques for
Return 1
analyzing wheel flaws (Robert K. Larson Jr., Robert
L. Florom, and Britto R. Rajkumar, Field Testing of
"Bang"
a Wayside Wheel Crack Detection System, U.S.
Return 2
Return 3
Department of Transportation, Federal Railroad
Administration, Office of Research and
Development; DOT/FRA/ORD-92/07, Final Report,
May 1992). IEM used their initial signal graphs,
extracted the data therefrom, and constructed input
signals from them that corresponded with the signals
Figure 34: Raw data returns from new wheel
such wheels would have given our system. These
signals were then presented to the Gauge for analysis. This gave IEM data from 20 additional wheel sets.
Flaw detection
These signals were especially useful for testing our Fuzzy Expert
returns
System and are made available by the system under the “Test
Templates” option in the GUI, providing sample signals for a
Near
Near
variety of wheels and flaws.
Far
Far
Figure 34 shows the bang and returns from a new wheel.
Note, again, that this is raw data – no processing at all.
Nonetheless, three returns can be seen clearly. After processing,
IEM could see four returns from new or like-new wheels routinely.
"Bang"
Roundtrip
1
Roundtrip
2
Roundtrip
3
The raw data return from a flawed wheel – in this case,
Figure 35: Detection of small
the one with the small machined crack of a depth of less than 1mm
crack in raw data
– is equally illuminating. Shown in Figure 35, it is clear, even to
the naked eye, that the flaw is visible to the instrument and the system easily distinguishes the existence
and location of the flaw.
Measurement Procedures and Statistical
Results
Known defect
Measurement Procedures
188.5µs 10.20" from sensor
The following discussion focuses on the
image seen in Figure 36, which is another actual
test wheel from IEM’s work. The image shows the
main “bang” (far left) and two roundtrip return
signals, with a flaw signal present between the
roundtrip signals. It was first necessary to
Width of defect
determine in the field the actual speed of the
response ~23µs
acoustic signal in railway wheels. Multiple tests on
our in-house wheels were done to determine this;
for instance, on a 33.05” diameter wheel (with,
Figure 36: Example flaw detection graph for
therefore, a circumference of 103.83”), it took an
discussion of measurement technique
average of 876 microseconds (µs) for the signal to
complete a full roundtrip. Dividing the distance by
the number of inches yields us the speed (inches/µs) of the signal, which is 0.118in/µs. This velocity
measurement was consistent to within the limits of our measurement (physical ability to measure location
of receiving sensor on wheel, etc.) across all wheels tested, new, old, flawed, and unflawed.
As measuring the distance to a flaw depends on the time from the initial signal to the return from
the flaw, the width of the flaw response is the major constraint on the accuracy of the measurement. In
testing the flawed wheels in our in-house collection, we measured the width of the flaw response to
25
determine this constraint. On average, the flaw response is approximately 23µs wide, which combined with
the previously determined velocity yields a return pulse width of approximately 2.7 inches; this means that
any measurement obtained is only correct within ±1.35”. As the wheels are typically something around 100
inches in circumference (anywhere from 87 [28 inch wheels] to over 130 [42 inch wheels]), this is an error
of between 1 and 1.5%. This “window” is shown in outline in Figure 39. In this figure, a known defect (the
machined crack described earlier) is physically measured to be 10.2” from the sensor head. When the
Gauge is activated, the return pulse from the flaw is seen 188.5µs after the main pulse. Multiplying by the
pulse velocity yields a return distance of 22.243”; however, this is actually twice the distance to the flaw as
seen by the gauge, since the time involved is the time for the signal to travel to the flaw and “bounce back”,
returning along the same path. Thus, the distance from the flaw according to the gauge is 11.12” from the
sensor, a discrepancy of 0.92”.
Statistical Results of Gauge Tests
IEM took multiple readings on all 8 non-flawed and flawed wheel sets in our collection with the
sensor head placed at three or more different positions around each wheel. In addition, we took multiple
readings (at least three) with sensors in the same location, to verify that the Gauge would produce the same
results upon repetition. Repeating the reading procedure at the same location produced results that could
not be discriminated from each other by any reliable method; whatever margin of error exists within the
Gauge itself is smaller than the error introduced by external factors such as the limits of physically
measuring a path along a wheel. The flaws available in our wheel sets included condemnable shelling,
cracks (machined), hollow tread, and gouges/dings.
It was possible to determine the statistical variance for the measurement distances as determined
by the Gauge to the flaws on various wheels. As it turns out, the above example’s discrepancy of 0.92” is
the largest discrepancy seen in IEM’s testing regimen. Overall, including all tests on our 8 in-house wheel
sets as performed multiple times by different operators, the standard deviation of measurements was shown
to be 0.5221 inches. Assuming a standard bell-curve distribution for error, this means that 95% of all
readings would be expected to be within 1.044 inches of the true value; by comparison with the pulse-width
gap determined earlier, it can be seen that the accuracy of the Gauge is in fact determined by the limitations
on the physical pulse return itself, as the pulse width covers more than 2.5 standard deviations. The
following summarizes the results from our field tests of the prototype:
•
•
•
•
•
The prototype is consistent. It gave the same results for every wheel set under repeated
readings.
The prototype is reliable. It never rejected a good wheel, nor passed a bad wheel.
The prototype is accurate. Whenever it diagnosed a flaw or fault, the wheel in question did
indeed have the flaw or fault in question, and the fault or flaw was to be found at or very near
to the location indicated by the system.
Failure of the prototype to acquire data when properly placed only occurs when the
wheel itself is bad. Only shelling of a condemnable level (as defined in the AAR manual -Why Made code 75) or very severe hollow tread (necessitating wheel turning) caused
sufficient loss of signal to prevent a reading; spalling, moderate shelling, grease, paint, and
other contaminants had no effect on the function of the device.
The prototype is fast. To obtain two separate readings of one wheel, in two locations, takes
less than 20 seconds.
The field tests on real wheels demonstrated that moderately hollow tread presented some minor
contact difficulties; IEM has already designed a new contact head that eliminates this difficulty while
remaining able to contact non-hollow tread. Other than this, no major problems were encountered
throughout all of the live testing of the system. These tests focused on our initial sensor head design, for
tread flaw detection. Towards the end of the development cycle, IEM tested the system using a new head
for detecting flange flaws.
26
Flange Flaw Detection Field Testing
For simplicity in experimental design, IEM
utilized a dual EMAT, one transmitting and one receiving
(AKA the “pitch-catch” configuration), for the flange
flaw detection head; this also allowed us to test different
physical EMAT configurations for their efficacy in this
application. A sample of the raw signal graph returned
from this configuration is shown in Figure 37.
One clear difference between this and the prior
configuration is the double-peaked shape of the “bang”
and subsequent returns. This derives from the fact that
there are two closely-spaced transceivers on the sensor
head, and thus the device receives two closely-spaced
signal spikes whenever the signal passes the
head.
Bang
Return 1
Return 2
Figure 37: Return raw signal from pitchcatch EMAT on Flange
First Signal
Return
Second Signal
Return
This configuration demonstrated the ability of our
3
2
1
system to detect flange-related flaws, as shown
by the averaging and enlarging of several signals
such as the one shown previously. Figure 38
shows the resultant graph, focused on the section
between the first and second return signals.
Indications of flaws are indicated at points 1, 2,
and 3; #2, in fact, is a secondary echo of #1 (as
seen for the prior flawed wheel signals depicted
Figure 38: Flange signal showing flaws on flange
in Figure 35), but #3 indicates a separate flaw. In
fact, this wheel does indeed have small defects on
the flange area (dings and a small cut on the edge), in the locations indicated by the return signals. Similar
tests on IEM’s other in-house wheels yielded results consistent with those seen with the tread flaw sensor
head: good wheels were passed, bad wheels were not, and the system had an extremely low false positive
and false negative rate.
Noisy
signal
Conclusions
IEM has constructed a portable Wheel Flaw Detection
Gauge. This device can be applied to the tread at two points (which
need be separated only by a short distance) in a matter of a few
seconds, and from these two quick readings determine if flaws exist
within the wheel, and if they are present the number, size, and nature
of these flaws along the tread. IEM has further demonstrated that it
is eminently possible to perform the same function for other portions
of the wheel, using a device that differs from the tread flaw detection
configuration only in the “sensor head” used to deliver and receive
the EMAT signals.
"Bang"
Far Flaw
Return
Main
Main
Return 2
Return 1
Near Flaw
Return
Reduced
Noise
Figure 39: Raw and averaged
signals from machined crack
One major and important difference between the portable and rail-based versions of this
technology stems from the time element involved. An on-rail system, checking wheels as they pass, is
severely limited in its detection ability by the fact that it will have only one chance of short duration to
examine the wheel. A failure in coupling will result in no wheel reading, and even with good coupling only
a few pulses can be successfully sent. The limiting factor for wheels in such a setting is that the wheel must
remain in contact with the sensor head for at least the duration of one, and preferably two or more,
roundtrips of the signal around the wheel – a duration of slightly over one millisecond. Even a relatively
slow-moving train does not provide many chances for such a reading on a stationary, rail-based system, as
the length of contact is approximately one inch.
27
The Portable Wheel Flaw Detection Gauge, being hand-operated on a stationary wheel, can and
does obtain multiple cycles of data routinely. This results in the ability of the portable device to provide
higher-quality, more accurate results. A simple example of how this is accomplished is shown in Figure 39
at the top we have a single raw signal from the cracked wheel shown in Figure 35, while at the bottom is an
averaged signal, using 16 separate readings averaged into one.
The bottom version is clearly superior, sharper, with more clearly defined peaks and much
diminished noise, as discussed earlier in the sections on signal processing. Note how even at the very
beginning of the signal, following the “bang” – when there is much unavoidable noise and the signal tends,
therefore, to be useless – the noise has been drastically reduced and in fact the flaw return signals are
becoming visible, even with this very elementary process. Such additional data refinement has a “cascade”
effect; by being able to use simple means to dramatically improve the basic signal, the other more advanced
signal processing methods become capable of producing even more impressive results themselves, locating
and defining flaws and features that would be otherwise indistinguishable. These 16 separate readings were
obtained in approximately half a second – incurring no delay for the operator. For an in-ground system,
however, such time would be an unaffordable luxury – it is the equivalent of a train moving at less than 1.5
miles per hour. Thus, in-ground or on-rail systems will likely be best used as screening devices – passing
clearly good wheels through and sending any questionables to be examined by a portable device such as
this one, that will be able to quickly determine the nature and extent of any flaws in a wheel.
The Portable Wheel Flaw Detection Gauge has met or exceeded most of IEM’s original design
requirements, as shown in Table 2.
Table 2: Requirements and Performance of Wheel Flaw Detection Gauge Prototype
Mechanical Requirement Specifications
Category
Size
Requirement
As small as practical; will contain a keyboardstyle datalogger, so will not be overly small
Weight
5 - 10 lbs or less if possible. Based on IEM
experience in prior portable design (Portable
Electronic Wheel Gauge, etc)
One handed application/removal from wheel
Required or
Status of Requirement in Prototype
Preferred
Preferred 13"x8"x3" main unit. Can be made somewhat smaller
for production version
Required
7 lbs main unit, 3 lbs sensor head -- 10 pounds plus
batteries (6 lbs lead-acid; 3 for lithium-ion).
Additional lightening for production version
Yes
Maximum ‘G’
force
100G for short durations as shock. Nonrepetitive, damping sinusoid. All three axes.
Necessary for dealing with hard use in train yards
-- drops, impacts, etc.
Required
Yes
Vibration
Large amplitude vibrations at <50Hz frequencies
prevalent in off road vehicles with poor
suspensions. All three axes. Typical level at 20G
for up to 200msec. Basically assumes that gauge
may be transported casually via vehicle over
sometimes rough terrain.
Required
Yes
Application
Required
Environmental Requirement Specifications
Category
Temperature
Humidity
Pressure
Precipitation
dirt/ dust/ grease
paint/ shelling/
burned on grease
Requirement
Required or
Status of Requirement in Prototype
Preferred
Required
Yes
Required
Yes
Preferred
Yes
Required
Will function in rain; waterproof
Required
No effect from grease/dirt/grime on unit
Required
Can penetrate over 1/16" of paint, non-condemnable
shelling, and other coatings
-25F to 125F
95% non-condensing
Altitude - 15000 feet
2" / hour. Waterproofing required
Must not affect operation
Must penetrate at least 1/16" of interfering
surface coatings or conditions.
28
Wheel Flaw Detection Requirement Specifications
Requirement
Required or
Status of Requirement in Prototype
Preferred
Category
Flaw types to be
detected
Flaw Locations
Min detectable
flaw size
Maximum time for
detection
Readings per
wheel
Thermal crack; damaged tread (not flat); slots,
other cracks, or gouges.
tread or flange
Required
Yes
Required
rim or plate
Preferred
5% cross section, or 0.25 inches, whichever is
smaller
~2 sec or less
Objective
Required
Tread fully functional. Flange demonstrated and
prototype sensor head created. Needs swappable
connector for multiple head designs
Head designs for rim and plate examination being
created. Modeling demonstrates such sensor heads are
practical
Yes; Demonstrated detection of flaw depths and
widths measured in millimeters.
Yes (less than one second)
no more than 2
Required
Yes. 1 or two readings at most needed
Category
Size
Display interface
Color or Mono
Display style
Display Control
Data Displayed
Requirement
User Interface
Required or
Preferred
one handed use; small screen
single small text screen showing status, readings,
additional information
Color
hand-carried controller unit, LCD screen with
light for dark conditions
Required
Required
Required
Required
Main unit shoulder, one hand sensor placement
Can also show small graphics and other information
as desired
Yes
Yes
Change font style/size for preferred viewing
parameters
Gauge status (on/ready, low power, reading,
error), reading results (flaw found/ estimated
location/size, no flaws, error)
Required
Yes
Required
Yes
Required
After practice, takes 4 minutes or less to bring system
to full readiness and begin taking readings.
Required
20 seconds
Required
Takes less time than set-up time
Setup Time
No more than a few (5) minutes from cold
startup. Effectively no prep time for taking
measurements afterward.
Measurement Time One minute or less to obtain a reading when
system is prepared and running.
Takedown Time No more than 5 minutes to shut down and put
away.
Category
Price
Batteries
Status of Requirement in Prototype
Requirement
Miscellaneous
Required or
Preferred
Status of Requirement in Prototype
~$12,000 per unit
Preferred
yes
Endurance (longer life better)
Preferred
Size/weight (smaller better)
Preferred
Lead/acid batteries 2.5-3 hours; with lithium battery
pack, 6 hours
Lead/acid pack measures 6 lbs; lithium battery pack
would be half the size and weight
Yes. Calibration wheel is carryable, has reference
flaws for calibration, calibration need only be done
periodically to verify functioning of gauge
Yes
Calibration Wheel Provides reliable verification of operation of
device and flaw detection/classification rules.
Small enough to keep in office or shop area.
Modularity
wearable parts should be easily replaceable
Required
Preferred
Needed Refinement for Commercialization
The prototype as designed should have several additional refinements done in order to transform it
into a full-production commercial product. The current fully-functional prototype only detects flaws on the
tread of the wheel, although the sensor head for detecting flange flaws has been tested, and another head for
detecting flaws in the rim is under development. These refinements, as IEM currently sees them, are
described below, and would be the natural subject of Phase II development.
Hardware Refinement
During the prototype stage, it is generally preferable to leave at least some extra space or “wiggle
room” in the physical design to allow for the work done in adjusting components, testing new
29
configurations, etc. In the final design, IEM will reduce the space of components and optimize physical
configurations to present the most compact design that is consistent with maintaining high performance. To
be able to detect flaws in other parts of a wheel such as the flange or rim, as mentioned earlier, IEM expects
that different sensor heads would be needed to properly adhere to and induce signal into the wheel; this is
due to the fact that the type of ultrasonic wave needed (Lamb, Reynolds, etc.) and angle of induction
depends on the type of flaw and the location being probed, and these are produced by different head
designs. IEM therefore would, after determining proper design for the different heads, create a sensor head
design that would permit simple and fast switching of the sensor heads, preferably one-handed. In addition,
a slight redesign of the head to permit for some curvature of the tread surface is already underway to permit
coupling with moderately hollow tread. In order to minimize both size and weight, IEM will also need to
design a custom battery pack using lithium-ion technology. As Table 1 shows, the far greater energy
density of the lithium batteries will permit a much smaller battery pack to be designed once a method has
been devised to safely permit the pack to provide sufficient peak power. Ergonomic design considerations
must also be taken into account (see Final Remarks and Last Minute Results). This includes designs for
removing the coverplate (several being tested), for carrying the gauge and controller, displays, and so on.
Software Refinement
Besides refining the software, and optimizing it for performance, IEM will examine the feasibility
and desirability of adding other options to the analysis software, such as multiple-signal averaging,
frequency spectral analysis, and possibly more advanced approaches such as a version of our signal
detection algorithm developed with the Department of Defense. Additional work will also have to be done
on customizing and optimizing the user interface to present the most useful and attractive set of features
and performance. This will be done as part of an extensive set of field usability trials, where IEM will
obtain additional input from various users as to the needed/desired features of the system and incorporate
these results into the final design.
The calibration procedure, discussed earlier under the User Interface, must be explicitly codified,
and made an integral part of the system maintenance procedures. As currently designed, calibration is only
necessary when changing sensor heads or if the user notes some discrepancy that indicates a miscalibration. IEM has not seen a case in which the system lost calibration on its own; this does raise the
problem that if no set routine is determined for calibration, the system may never be calibrated. Thus the
system must be supplied with an option which will remind the user to calibrate whenever some interval
passes. The software for all functions must be compiled and placed in firmware onboard the Wheel Flaw
Detection Gauge. The full set of support documentation (Help files, maintenance and use manuals, etc.)
must be written and included with the finished product.
Final Remarks and Last-Minute Results
IEM has demonstrated that the Portable Wheel Flaw Detection Gauge can be configured to not
only detect flaws on the tread, but on all other parts – the flange, rim, and hub – of train wheels; TTCI has
confirmed that tread, flange, and rim flaws are of interest and importance to freight rail. It has been
specifically demonstrated that even very small flaws produce clear and unambiguous signals and that
different types of flaws produce different characteristic signals. This permits the Gauge to not only
determine that a wheel is flawed, but to determine the size, location, and specific type of flaw detected.
Subsequent to the completion of this project, IEM has performed some usability tests with inhouse and visiting personnel from various railroad organizations, including CSX. Consensus at this time is
that the “phone book” sized controller box may be better configured as a “lunch box” style device. IEM has
also begun development of an ergonomic/usability testing program with input from TTCI that would be
able to be combined with direct demonstration and functional testing of the system.
30