1
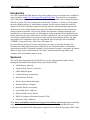
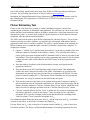
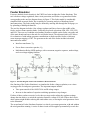
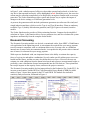
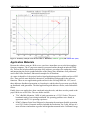
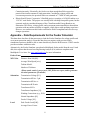
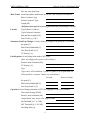
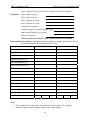
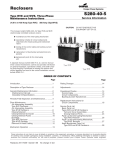
AWEA WindPower 2006
Software Tools for Distributed Wind
Software Tools for Distributed Wind Applications
Thomas E. McDermott, Ph. D, P. E.
Consulting Engineer
EnerNex Corporation
[email protected]
J. Charles Smith
Executive Director
Utility Wind Integration Group (UWIG)
[email protected]
Abstract - The Utility Wind Interest Group (UWIG) has undertaken a Distributed Wind Impacts
project, which includes site monitoring, case studies, and the development of Web-based
software tools for economic screening and engineering analysis. The software includes a
database of wind turbine flicker coefficients, and it can import NRECA MultiSpeak files and site
measurement data when available. Without such data, the software presents a simplified feeder
model for the user to edit critical data, and can use a generic wind model. By arrangement with
NREL, an enhanced version of their WindFinance Web application has been incorporated for
economic screening with sensitivity analysis. The feeder electrical simulator estimates flicker on
the feeder, and simulates voltage regulation, including the effects of line regulator controls,
capacitor switching controls, and variations in the WTG output. The electrical simulator also
verifies proper operation of the overcurrent protection system, including effects of the WTG and
its protection package. These are the most critical technical issues with connecting small and
medium sized WTGs to radial feeders. The software has been applied to distributed wind
applications in the United States and Europe, and these results are presented as case studies.
1
AWEA WindPower 2006
Software Tools for Distributed Wind
Introduction
The UWIG Distributed Wind Impacts Project has produced a suite of software tools, available to
project members, at http://www.uwig.org/distwind/default.htm. These tools focus on mediumscale wind turbine integration on distribution feeders, where medium-scale is roughly defined as
500 kW or greater. The first screening tool is the Flicker Calculator. For that, you only need to
know the number and type of wind turbines proposed, and the location where they would be
installed. The Flicker Calculator requires no special expertise, and minimal data requirements.
At the next level, the Feeder Simulator provides more detailed assessment of the potential for
voltage regulation problems, excessive tap changer and capacitor switching operations, misoperation of overcurrent protection, etc. Although the system model has been simplified for the
Feeder Simulator, the topics addressed are still fairly complicated. The user needs to be familiar
with voltage regulation and overcurrent protection practices on distribution feeders. The data
requirements are comparable to those for a distribution software package such as WindMil,
CYMDIST, Synergee Electric, DistriView, PSS/Adept, etc.
In cases where the utility will own the wind project, or wishes to assist the developer, the
Economic Screening application may be helpful. The user should be familiar with standard
engineering economics or financial techniques. The Economic Screener is customized for aspects
unique to wind, such as the Production Tax Credit, Clean Renewable Energy Bonds, and
estimates of the wind turbine capacity factor.
Sponsors
The Utility Wind Integration Group (UWIG) has over 90 organizational members. Those
funding the Distributed Wind Impacts Project specifically include:
•
Alaska Energy Authority
•
Alaska Village Electric Cooperative
•
APPA DEED Program
•
California Energy Commission
•
Edison Electric Institute
•
Electric Power Research Institute
•
Hawaiian Electric Company
•
Kotzebue Electric Association
•
Long Island Power Authority
•
Nebraska Public Power District
•
NRECA Cooperative Research Network (CRN)
•
Tennessee Valley Authority
Thus, many small utilities already have access to the software tools through their membership
in the American Public Power Association DEED program, or the National Rural Electric
Cooperative Association CRN. Other parties can gain access to the tools by joining UWIG; at the
2
AWEA WindPower 2006
Software Tools for Distributed Wind
time of this writing, annual utility dues range from $1000 to $5000 depending on 2004 gross
revenues. The up-to-date dues structure is always on-line at www.uwig.org.
In addition, the National Renewable Energy Laboratory (NREL) has provided source code for
their WindFinance Web application, to form the basis of UWIG’s Economic Screener for
Distributed Wind.
Flicker Estimating Tool
Flicker is one of the first issues coming to a utility distribution engineer’s mind, when
considering the possibility of distributed wind generation. The customers are closer to the wind
turbine and the system impedance tends to be higher, compared to a wind farm connected to the
transmission system. As a result, there could be a greater exposure to flicker-induced customer
complaints, after the turbine has been installed.
The UWIG tool suite includes a quick flicker estimating tool, shown in Figure 1, for use in this
situation. In order to use this calculator, you need the type of proposed wind turbine, and the
proposed location where it would be installed. The result is a quick estimate of the potential for
flicker becoming severe enough that other customers would notice and possibly complain. To
complete the estimate:
•
Choose a “Turbine Type” from the drop-down list box. At present, ten turbines from four
different vendors are available in the software’s library. To be included in the library, a
power quality test report compliant with IEC Standard 61400-21 must be provided for the
wind turbine. These power quality tests are time-consuming and expensive for the turbine
vendors, but more units will be added to the UWIG library as the test reports become
available.
•
Enter the number of turbines at this location and the average wind speed into the
appropriate edit boxes.
•
Enter the short-circuit MVA and impedance angle at this location. This information
would come from a short-circuit study of the feeder. If harmonics are of concern, this
information may already have been provided for an evaluation per IEEE Std. 519 at the
point of common coupling (PCC). Note that the Feeder Simulator can also provide this
information. Or, it may be estimated as described in the next point:
•
If the user does not know the short-circuit strength at the point of common coupling, it
may be estimated from the substation transformer size, the line construction type, and the
distance from the substation. Click the “Estimate Short-Circuit” button, which fills in the
short-circuit MVA and angle, and then click the “Calculate Flicker Severity” button.
•
Click on “Calculate Flicker Severity Level” to update the PST results for continuous and
step flicker, and the PLT result for step flicker. Values less than 0.90 are considered
acceptable for PST, but this example would exceed that threshold for switching flicker.
Values less than 0.70 are considered acceptable for PLT.
For continuous turbine flicker the short-term value PST and the long-term value PLT are defined
as equal to each other, so the Flicker Calculator only output PST.
For step flicker, the PST value is based on a 10-minute window and the PLT value is based on a
120-minute window. The flicker coefficients and the number of switching operations for each
3
AWEA WindPower 2006
Software Tools for Distributed Wind
window are based on the turbine characteristics, as reported by the manufacturer. Some older
flicker tests did not report the maximum number of switching operations for each window, in
which case the defaults from IEC standards are used, leading to PLT having the same value as
PST. When the vendor has a complete set of test data, these values may not be equal.
Figure 1 - The UWIG Flicker Estimating Tool for Distributed Wind
4
AWEA WindPower 2006
Software Tools for Distributed Wind
Feeder Simulator
For more detailed electrical analysis, the UWIG tool suite includes the Feeder Simulator. This
tool calculates voltage regulation, short-circuit protection, and flicker on a generalized feeder
corresponding to the one-line diagram shown in Figure 2. This feeder model is considerably
simplified from an actual feeder, but is suitable for screening analysis of distributed wind
interconnections. The feeder model may be defined by entering data through the Web pages, or
by uploading a MultiSpeak data file.
The one-line diagram includes a line voltage regulator and line recloser at the middle of the
feeder, and two shunt capacitor banks. Loads may be placed at locations LD0, LD1, LD2, LD3,
and LD4. There are two candidate wind turbine locations available on the feeder, one at the end
of the main branch and one at the end of a mid-feeder lateral. The adjacent feeder to B7 allows
for evaluation of wind turbine generator contributions to faults on other feeders, which may
cause improper tripping of CB1. The generator at the end of the feeder includes a detailed
interconnection model:
•
Interface transformer, Tg
•
Power factor correction capacitor, Cg
•
Multifunction Relay (MFR) package, with overcurrent, negative sequence, undervoltage,
and overvoltage tripping function.
Figure 2 - One-line Diagram of the Feeder Simulator's Electrical Model
One function of the Feeder Simulator is to simulate the feeder voltage regulation, over a timevarying profile of wind power generation. The important outputs include:
•
Time spent outside of the ANSI C84 A and B voltage ranges.
•
Increase in the number of capacitor switching operations or tap changes.
If either of these reaches excessive levels, then you may need to adjust the regulator settings,
change the time delays, or switch the capacitor control to voltage or kVAR. If these don’t work,
other options might include reducing the wind turbine size, or moving the wind generators closer
to the substation.
The second major Feeder Simulator function is to check overcurrent protection, with and without
the wind generation running. A series of short circuits will be applied systematically to each bus
5
AWEA WindPower 2006
Software Tools for Distributed Wind
in Figure 2, with a tabular output of all devices that either operated and reclosed, or locked out.
Any device that operated incorrectly will be highlighted in red. Should this occur, the corrective
actions may be somewhat complicated, to be analyzed by an engineer familiar with overcurrent
protection. The Feeder Simulator provides a quick and accurate way to explore the impact of
changes to the device settings, or of different generation levels.
At present, the generator models include synchronous generators (not often used for wind) and
simple induction machines, which cover the Type A and Type B interfaces. Plans are underway
to add the Type C (doubly-fed induction generator) and Type D (power electronic) interface
models.
The Feeder Simulator also provides a flicker estimating function. Compared to the simplified
calculator in Figure 1, this function allows for two generator sites, and also calculates the system
impedance automatically from the complete feeder model.
Economic Screening
The Economic Screening module was derived, as mentioned earlier, from NREL’s WindFinance
web application. In the optimizing mode, it can estimate the required first-year energy payment
to meet economic constraints, such as a minimum debt service coverage ratio, or a minimum
internal rate of return. In the un-constrained mode, it can predict the net present value or internal
rate of return, for a known first-year energy payment.
With respect to distributed wind, one important feature is the ability to estimate the capacity
factor of a given site and turbine combination. Several vendor-specific turbine power curves are
loaded into the library, and the user may also define their own curves. Likewise, the user can
estimate site wind conditions from the annual wind speed and reference (measurement) height, or
preferably, enter a distribution of actual measurements into the Web browser. These parameters
have major impacts on the capacity factor, and hence the project economics.
The Economic Screening module also has inputs tailored to the Production Tax Credit (PTC) for
investor-owned entities, and the REPI or Clean Renewable Energy Bonds (CREB) for public
entities. Figure 3 shows these inputs for the PTC and CREB. The module also includes a
sensitivity analysis function, illustrated in Figure 4.
Figure 3 - Production Tax Credit (left) and Clean Renewable Energy Bond (right) inputs
6
AWEA WindPower 2006
Software Tools for Distributed Wind
Figure 4 - Sensitivity Analysis of Net Present Value vs. Debt Ratio, with PTC (green) and without PTC (blue)
Application Materials
Because the software runs on a Web server, users have immediate access to the latest updates
from any computer. The 67-page user manual is presented on-line through an indexed HTML
file. This on-line help documents operation of the software, procedures for conducting a study
and interpreting the results, graphs and tables of the library data, definitions of all parameters
used in the Feeder Simulator, and tutorial examples for all functions.
At a more in-depth level, the project has developed application guides available on-line as PDF
files. These provide more historical, theoretical, and modeling background for the software
functions. There are two applications guides on-line for the evolving IEEE Std. 1547; one of
these addresses distributed generation as a broad topic, and the other focuses more specifically
on distributed wind generation. The third application guide addresses flicker, and wind turbine
flicker.
Finally, three case studies have been completed using the tools, and these are also posted to the
project Web site as PDF files. The case studies include:
•
TVA’s Buffalo Mountain, 2 MW of wind generation on a 13.2-kV feeder. This was a
benchmark study of an existing installation. No operating problems were found, in
agreement with TVA’s operating experience.
•
PG&E’s Hunters Point Naval Shipyard, to determine the maximum feasible generation
on a 12-kV feeder. Economic analysis included the Production Tax Credit, and use of a
more efficient wind turbine at greater hub height than assumed in the California Energy
7
AWEA WindPower 2006
Software Tools for Distributed Wind
Commission study. Electrically, the feeder was short enough that flicker posed no
practical limit on the amount of wind generation. Considering voltage profile and
overcurrent protection, the practical limit was estimated at 7.5 MW of wind generation.
•
Illinois Rural Electric Cooperative’s Pittsfield project, to analyze a 1650-kW turbine on a
12.47-kV rural feeder. The project was actually built with help from public grants, but the
economic analysis considered impacts of the Clean Renewable Energy Bonds as an
illustration. The flicker, voltage profile, and overcurrent protection analysis showed that
operation with one turbine would be acceptable, which agrees with operating experience.
However, two turbines on this feeder could lead to flicker complaints and excessive tap
changer operations.
Appendix – Data Requirements for the Feeder Simulator
This data sheet describes all data necessary to load the Feeder Simulator for voltage profile and
overcurrent protection analysis. From this data sheet, an engineer with previous feeder
simulation experience should be able to enter data directly into the Web browser. UWIG can also
provide assistance with these tasks.
Alternatively, the Feeder Simulator can upload a MultiSpeak feeder model from the user’s hard
disk; this requires that the user have Engineering Analysis (EA) software compliant with
MultiSpeak 2.0 or later. See www.multispeak.org for more information.
Feeder Name:
WTG Site:
Distance from Sub [kft]:
Average Wind Speed [m/s]:
Turbine Model:
Number of Turbines:
(Please attach vendor’s power curve, IEC flicker test report, and/or generator
electrical parameters if available.)
Substation:
Transmission Voltage [kV]:
Transmission MVASC 3-ph:
Transmission MVASLGF:
Transmission R/X ratio:
Transformer MVA:
Transformer Impedance [%]:
Winding Connections (e.g., D/Y):
Neutral Impedance [Ω]:
Feeder Voltage [kV]:
Load:
Peak Feeder Load [kW]:
Average Power Factor:
8
AWEA WindPower 2006
Software Tools for Distributed Wind
Note any large spot loads:
Main Trunk: for the three-phase main branch out to WTG site, list up to 4 sections of:
Phase Conductor Type:
Neutral Conductor Type:
Length [kft]:
(If different from typical cross-arm, please attach a pole drawing or sketch.)
Laterals:
Typical Phase Conductor:
Typical Neutral Conductor:
Min and Max Lengths [kft]:
Fuses Used (e.g., 15K)
Substation Load Tap Changer (if used): (Note: all voltages to be given on 120-volt base.)
Set-point [V]:
Min-to-Max Bandwidth [V]:
Line Drop R and X [V]:
CT Primary [A]:
Line Regulator (if used along main trunk to WTG site):
(Note: all voltages to be given on 120-volt base.)
Distance from Substation [kft]:
CT Primary [A]:
Type:
(Type can be A/B, buck/boost, 3-phase or 1-phase, wye or open delta, etc.
If not specified, we assume 3-phase wye connections.)
Forward
Reverse (if used)
Set-point [V]:
Min-to-Max Bandwidth [V]:
Line Drop R and X [V]:
Capacitors (if used along main trunk to WTG site, aggregate in one or two chunks):
Three-phase Rating [kVAR]:
Distance from Substation [kft]:
Control (fixed, time, temp, volts, amps, kVAR):
ON Threshold [A, V, kVAR]:
OFF Threshold [A, V, kVAR]:
Switching Delay [s]:
9
AWEA WindPower 2006
Software Tools for Distributed Wind
(Note: voltages to be on 120-volt base, currents to be on feeder primary.)
Economics:
WTG Capital Cost [$]:
WTG Annual Cost [$]:
Loan 1 Amount & Terms:
Loan 2 Amount & Terms:
Constraints or Incentives:
Contract Energy Price and Term [¢/kwh, yrs]:
Non-Contract Energy Price [¢/kwh]:
Project Life [years]:
(Please forward electronic files of site wind measurements, if available.)
Relay and Recloser Settings: (include the substation breaker or recloser, plus any line recloser
encountered between the substation and WTG site).
Setting
Substation Device
Line Recloser
Vendor & Product Name
Relay CT Ratio
N/A
Recloser Coil Size [A]
Distance from Sub [kft]
0
Phase Instantaneous [A]
Phase Time-Delayed [A]
Ground Instantaneous [A]
Ground Time-Delayed [A]
Phase Time Dial or Fast Curve
Ground Time Dial or Fast Curve
Phase Trip Slow Curve
Ground Trip Slow Curve
Number of Phase Fast Trips
Number of Ground Fast Trips
Number of Trips to Lockout
Reclosing Intervals [s]
Notes:
1. If you supply the CT ratio, please enter all Ampere values on the CT secondary.
Otherwise, please enter all Ampere values on the feeder primary.
10
AWEA WindPower 2006
Software Tools for Distributed Wind
2. For a relay, the trip settings are actually relay tap settings. The time dial ranges from 1 to
10, with increments of 0.5. Most relay product names (e.g., CO-##, IAC-##) specify the
inverse time behavior. If you have an electronic relay where this behavior is useradjustable, please include a term such as “extremely inverse” or “moderately inverse” in
the product name.
3. For a recloser, the curve should be A, B, C, D, or E. The trip settings are Amperes on the
feeder primary. Some older types of recloser may not have trip settings; they are based on
the coil size. In that case, please write N/A for their trip settings.
4. If separate ground trip settings are not used, either write N/A, or enter the same values as
the phase trip settings.
11