1
PONTIFICIA UNIVERSIDAD CATOLICA DE CHILE
ESCUELA DE INGENIERIA
DEVELOPMENT OF A SOLAR CELL
AND ENVIRONMENTAL
CHARACTERIZATION SYSTEM FOR
ISOLATED LOCATIONS
FRANCISCO JAVIER CALDERÓN PERALTA
Memoria para optar al título de
Ingeniero Civil Electricista
Profesor Supervisor:
ANDRÉS GUESALAGA MEISSNER
Santiago de Chile, 2005
PONTIFICIA UNIVERSIDAD CATOLICA DE CHILE
ESCUELA DE INGENIERIA
Departamento de Ingeniería Eléctrica
DEVELOPMENT OF A SOLAR CELL
AND ENVIRONMENTAL
CHARACTERIZATION SYSTEM FOR
ISOLATED LOCATIONS
FRANCISCO JAVIER CALDERÓN PERALTA
Memoria presentada a la Comisión integrada por los profesores:
ANDRÉS GUESALAGA MEISSNER
JUAN DIXON ROJAS
ÁLVARO SOTO ARRIAZA
Para completar las exigencias del título de
Ingeniero Civil Electricista
Santiago de Chile, 2005
ACKNOWLEDGEMENTS
I would like to express my gratitude to Allan Lüders, classmate and
friend with whom we participated in the Life in the Atacama project representing
Pontificia Universidad Católica de Chile. This work is the result of many hours of
discussions as part of our long-run teamwork to complete our respective theses. Both
complementary works are the result of a common goal, which was to accurately
characterize new ATJ solar technologies. This made us work together on both of our
theses.
I have to specially thank my advisor Andrés Guesalaga who trusted in
me giving me the honor to participate in the Life in the Atacama project of Carnegie
Mellon University representing our university. During these two years I have
received his unconditional support, encouraging me to continue participating in the
project and finish this work. Undoubtedly it is thanks to him that now I have the
opportunity to join the Robotics Institute of Carnegie Mellon University to continue
my postgraduate studies.
Last, but not least, I have to thank the Life in the Atacama team and the
Robotics Institute of Carnegie Mellon University who trusted in me providing all
the necessary equipment for the development of this project. I have to specially
thank David Wettergreen, Michael Wagner and James Teza. I received from them all
the support and technical advice that I could ever need for the development of this
work. They are the original creators of the idea of this project, and undoubtedly
many of the results obtained in this work have been their original thoughts.
ii
CONTENTS
Page
ACKNOWLEDGEMENTS ......................................................................................... ii
LIST OF TABLES ...................................................................................................... vi
LIST OF FIGURES.................................................................................................... vii
RESUMEN................................................................................................................... x
ABSTRACT................................................................................................................ xi
1
Background of the Project .................................................................................. 1
2
Overview of System ........................................................................................... 2
2.1 Block Diagram ........................................................................................... 3
3
Multipurpose Autonomous Solar Station (MASS)............................................. 5
3.1 MASS Modules.......................................................................................... 5
3.1.1 Central Computer Module ............................................................... 6
3.1.2 Power Supply System Module......................................................... 7
3.1.3 Mounting System Module ............................................................... 7
3.1.4 Power Manager and User-Interface System Modules ..................... 8
3.2 Software Core............................................................................................. 9
3.3 Power Control and User-Interface Systems ............................................. 11
3.3.1 Power Manager System ................................................................. 11
3.3.2 User-Interface System ................................................................... 13
3.3.3 User Interface & Power Manager Software: The Core Process .... 16
3.3.4 Microcontroller .............................................................................. 18
4
Solar Cell Testing Unit (SCTU) ....................................................................... 22
4.1 Objective .................................................................................................. 22
4.2 Implemented Solution .............................................................................. 23
4.2.1 Central Experiment........................................................................ 24
4.2.2 Pointing System ............................................................................. 28
4.2.3 Auxiliary Sensors........................................................................... 30
4.2.4 Physical Layout ............................................................................. 32
4.2.5 Control Software............................................................................ 34
5
Results .............................................................................................................. 41
5.1 Solar Cell Characterization ...................................................................... 41
5.1.1 Current-Voltage (I-V) Curves........................................................ 41
5.1.2 I-V Curves during Different Times of the Day........................................ 43
5.1.3 Sun-tracking system ................................................................................. 44
5.1.4 Solar Spectrum Measurements................................................................. 45
5.2 Weather Reports....................................................................................... 47
6
Conclusions ...................................................................................................... 49
References .................................................................................................................. 50
APPENDIXES ........................................................................................................... 54
Appendix A
Electrical Design and Detail of Devices Used in the MASS......... 55
A.1 Schematic of Power Manager / User-interface Board ............................. 55
A.2 Connectors in Power Manager / User-interface Board ............................ 56
A.3 Microcontroller: Battery Voltage Measuring System.............................. 56
A.4 Commercial Hardware used in the MASS System .................................. 58
A.5 Main Electronic components used in the Power Manager / Userinterface Board ......................................................................................... 60
Appendix B
Electrical Design and Detail of Devices of the SCTU System...... 61
B.1 General Schematic of the Solar Cell Testing Unit (SCTU) ..................... 61
B.2 Connectors in Signal Conditioner Board ................................................. 62
B.3 Interconnection of Solar Cells for Testing............................................... 62
B.4 Schematic of Signal Conditioner Board................................................... 64
B.5 Commercial Hardware used in the SCTU System................................... 65
B.6 Main Electronic Components used in the SCTU System ........................ 69
Appendix C
Connections of MASS / SCTU for Assembly in the Field............ 70
Appendix D
Detailed pin out of MASS / SCTU systems .................................. 74
D.1 Terminal blocks rack in the main enclosure ............................................ 74
D.2 Connections in Solar Controller............................................................... 76
D.3 Connections in current measuring board (secondary enclosure) ............. 76
D.4 Connections in Signal Conditioner Board ............................................... 77
D.5 Connections in terminal blocks rack in the secondary enclosure ............ 77
D.6 Connection of opto-relays in main enclosure .......................................... 78
D.7 Connection of solar cell testing sets......................................................... 79
Appendix E
Software-specific Details............................................................... 80
E.1 General Information about the processes................................................. 80
E.2 Generated Data Files ................................................................................ 80
E.3 Weather Data............................................................................................ 81
E.4 Solar Cell Data ......................................................................................... 81
E.5 Main programming code files .................................................................. 82
E.6 About Log Files and Time Management ................................................. 84
Appendix F
Implemented Protocol for PC – Microcontroller Communication 85
F.1 Behavior with unknown messages and timeouts ..................................... 87
Appendix G
Implemented User-interface Menus .............................................. 88
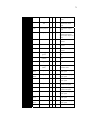
LIST OF TABLES
Page
Table 4.1: Main characteristics of the SCTU sensors connected to the
general-purpose data logger.............................................................................. 31
Appendixes
Table A.1: Commercial hardware used in the MASS................................................ 58
Table A.2: Electronic components used in the Power Manager / Userinterface board .................................................................................................. 60
Table B.3: Commercial hardware used in the SCTU system..................................... 65
Table B.4: Main electronic components used in the SCTU system........................... 69
Table C.5: Main connections in the main enclosure to install the MASS /
SCTU system in the field.................................................................................. 70
Table C.6: Main connections in the main enclosure to install the MASS /
SCTU system in the field.................................................................................. 72
Table D.7: Connected devices per terminal blocks in main enclosure ...................... 74
Table D.8: Cable connections in solar controller....................................................... 76
Table D.9: cable connection in current sensor board................................................. 76
Table D.10: Cable connections in signal conditioner board ...................................... 77
Table D.11: Cable connections in terminal blocks of the secondary enclosure ........ 77
Table F.12: All possible messages in computer – microcontroller
communication protocol ................................................................................... 86
vi
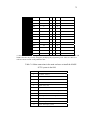
LIST OF FIGURES
Page
Figure 2.1: Block diagram of the system ..................................................................... 4
Figure 3.1: Internal structure of the MASS interacting with child
experiments......................................................................................................... 5
Figure 3.2: MASS / SCTU system installed in the field.............................................. 8
Figure 3.3: Simplified power-control diagram of devices whose power can
be interrupted.................................................................................................... 13
Figure 3.4: Implemented user interface system ......................................................... 14
Figure 3.5: Summary of implemented algorithm to perform an automatic
shutdown of the system .................................................................................... 18
Figure 3.6: Basic block diagram of the communication protocol between the
computer and the microcontroller in the hardware context.............................. 20
Figure 4.1 : General block-diagram of the SCTU system.......................................... 22
Figure 4.2: Block diagram of the SCTU and interaction with the MASS ................. 23
Figure 4.3: Block diagram of the Central Experiment............................................... 25
Figure 4.4: ATJ solar cell set used in the SCTU (embedded thermocouples
are shown)......................................................................................................... 27
Figure 4.5: SCTU mobile platform pointing to the sun ............................................. 28
Figure 4.6: Top-view diagram of the mechanical layout of SCTU mobile
platform ............................................................................................................ 33
Figure 4.7: Main components of the MASS/SCTU mounted in the field.................. 33
vii
Figure 4.8: Layout of components in the Primary and Secondary Electronics
Enclosure .......................................................................................................... 34
Figure 4.9: Flowchart of the general software operation ........................................... 36
Figure 4.10: Block diagram of processes and main functions running by the
MASS and SCTU in the main computer .......................................................... 40
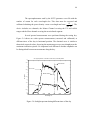
Figure 5.1: I-V curve for ATJ and silicon solar cells during the maximum
irradiance episode of the testing day ................................................................ 42
Figure 5.2: I-V curves of ATJ and silicon solar cells in horizontal position
during the testing day. Maximum power points are marked with an
asterisk (*) ........................................................................................................ 43
Figure 5.3: I-V curves for the solar cells pointing to the sun along the day.
Maximum power points are marked by an asterisk (*) .................................... 45
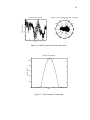
Figure 5.4: Sunlight spectrum during different times of the day ............................... 46
Figure 5.5: Temperature & Humidity weather plots.................................................. 47
Figure 5.6: Wind Speed & Direction weather plots................................................... 48
Figure 5.7: Solar Irradiance weather plot .................................................................. 48
Appendixes
Figure A.1: Schematic of Power Manager / User-interface Board ............................ 55
Figure A.2: Interface connectors in Power Manager / User-interface Board ........... 56
Figure B.3: Schematic of the SCTU system .............................................................. 61
Figure B.4: Main connector in Signal Conditioner Board ......................................... 62
viii
Figure B.5: Connection scheme of ATJ solar cell set used in the SCTU
system ............................................................................................................... 63
Figure B.6: Connection scheme of silicon solar cell set used in the SCTU
system ............................................................................................................... 63
Figure B.7: Schematic of Signal Conditioner Board ................................................. 64
Figure D.8: Cable connections of the three opto-relays of the system
mounted in a 4-channel I/O module rack ......................................................... 78
Figure D.9: Cable color code of ATJ and silicon solar cell sets................................ 79
Figure G.10: Implemented menus in user-interface system ...................................... 88
ix
RESUMEN
Este documento describe el diseño y desarrollo de una estación
multipropósito para la realización de experimentos en lugares aislados. Se presenta
su aplicación a un sistema para caracterizar celdas solares, adonde se requiere
capturar datos eléctricos y ambientales. Esto permite evaluar el desempeño de
nuevos dispositivos fotovoltaicos respecto a tecnologías convencionales, y a la vez
hacer un análisis ambiental del entorno.
El sistema implementado incluye dos tipos de celdas solares de prueba
sobre un sistema móvil capaz de orientarlas a posiciones arbitrarias, incluyendo la
localización continua del sol. Se captura información de sus características de
corriente/voltaje y sus temperaturas a lo largo del día, además de información
ambiental incluyendo el espectro solar incidente, la irradianza total y variables
meteorológicas.
La solución propuesta está basada en dos sistemas complementarios que
interactúan entre sí. Se incorpora un sistema específico para la caracterización de
celdas solares, el cual interactúa con un dispositivo genérico que le provee de
energía, capacidad de procesamiento, soporte físico e interfaz con el usuario en
terreno. Este diseño genérico permite que el sistema sea fácilmente ampliable para
proveer servicios similares a nuevos dispositivos que se requiera incorporar en el
futuro.
El trabajo presentado en este documento fue desarrollado para entregar
información científica a las operaciones de terreno del proyecto NASA “Life in the
Atacama” ejecutado por la Universidad de Carnegie Mellon en el desierto de
Atacama (Chile) durante los años 2003, 2004 y 2005.
x
ABSTRACT
This work describes the methods and techniques used for the
development of a multipurpose station to perform experiments in isolated places. Its
application in a system to characterize solar cells is presented, where capturing of
electrical and environmental data is required. Obtained results allow to compare the
performance of new and conventional photovoltaic devices, and also to characterize
the surrounding environment.
The implemented system incorporates two different solar cell
technologies. They are installed on a mobile platform capable of orienting their
position arbitrarily and perform continuous sun-tracking. Voltage, current and solar
cell temperature data is logged together with relevant environmental information
such as the incident solar spectrum, total irradiance and weather variables.
The proposed solution is based on two complementary systems that
interact between them. It incorporates a specific device for solar cell characterization
which interacts with a generic system that provides it with energy, processing power,
physical support and user-interface in the field. As a consequence of this generic
approach, the system can be easily expanded to provide analogue services to new
devices that need to be incorporated in the future.
The described system was developed to provide relevant scientific data
for field operations of the NASA-funded “Life in the Atacama” project performed by
Carnegie Mellon University in the Atacama desert (Chile) during years 2003, 2004
and 2005.
xi
1
1
BACKGROUND OF THE PROJECT
This document is developed as part of the NASA-funded “Life in the
Atacama” project, executed by Carnegie Mellon University with the collaboration of
Pontificia Universidad Católica de Chile among other institutions. The Life in the
Atacama project seeks to develop technology in support of robotic astrobiology for
NASA while conducting useful Earth science in the Atacama Desert of northern
Chile [Wett03]. The final objective is to create technology relevant to the exploration
of Mars in the form of an autonomous rover capable of traversing extremely long
distances finding basic forms of life without direct human intervention.
This technical report covers all details related to the construction of a
solar-powered and autonomous station for testing, which provides complementary
engineering and scientific data for rover operations during field experiments. The
main objectives of the station are: i) to characterize the electrical performance of
Advanced Triple Junction (ATJ) n/p InGaP/InGaAs/Ge solar cells built for space
applications in relation to standard silicon solar cell technology; ii) to provide tools
for weather-characterization during field operations, providing relevant data for
solar cell analysis, rover operation and scientific investigation; and iii) to be easily
upgradeable to add new experiments or additional weather sensors in the future.
The developed system was built and tested during field rover operations
of years 2003 and 2004 in the Atacama desert, near the cities of Iquique and
Antofagasta (Chile). The final version of the autonomous station is completed to
operate during the upcoming field season of 2005. The project was financed by the
Robotics Institute of Carnegie Mellon University (CMU) being developed by
students of the Electrical Engineering Department of Pontificia Universidad Católica
de Chile (PUC) under supervision of professors of PUC and faculty of CMU.
2
2
OVERVIEW OF SYSTEM
System requirements detailed in Chapter 1 are accomplished by the
development of two independent and interacting systems, the Multipurpose
Autonomous Solar Station (MASS) and the Solar Cell Testing Unit (SCTU). The
MASS is designed as a general-purpose device which provides basic services to
“child” experiments1 needing to operate in stand-alone mode. It interacts with the
SCTU, which is a child experiment capable of characterizing multiple solar cell
technologies by capturing electrical and environmental data.
The MASS is a solar-powered and general-purpose system designed to
provide power, processing capacity, user-interface and physical support to one or
more child experiments for long periods of time in isolated places. It offers hardware
and software to control child experiments by capturing, filtering and displaying
obtained results. Additionally, it provides power to devices through a power manager
system with energy-saving capabilities. The system is capable of switching Off
selected components when they are not in use and also to monitor the available
energy in the system batteries. If there is no remaining energy in the system it
performs a controlled emergency shutdown2, maintaining the computer Off until the
system batteries have been recharged. Furthermore, the MASS includes an onboard
user-interface composed by an alphanumeric display and keypad to manually
execute commands, change crucial execution parameters and monitor measured
variables without using external devices. All MASS characteristics are discussed in
Chapter 3.
1
Child experiments are defined as electronic systems that need to be externally
powered and controlled (e.g. data logging systems).
2
A “controlled shutdown” takes into account the hardware and software context,
exiting software routines, and even closing the complete operating system when necessary, prior to
hardware disconnection. This is done to maintain the integrity of the file system.
3
The SCTU is a group of several independent logging tools that provide
complementary information to characterize solar cells. Its objective is to analyze the
performance of standard silicon solar cells compared to the newly commerciallyavailable Advanced Triple-Junction (ATJ) n/p InGaP/InGaAs/Ge solar cells under
equivalent environmental conditions. It continually logs current-voltage data (I-V
curves) for the complete operation range and logs other possibly efficiencycorrelated values such as temperature of the solar panels, irradiance, solar spectrum
and weather data. All measurements are captured during different times of the day
with the cells positioned to different orientations (fixed positions and continuous
sun-tracking). The results of the SCTU provide relevant electrical data to compare
new and old solar cell technologies, and data to quantify the benefits of a suntracking mobile system. Details of the SCTU, including individual experiments and
captured variables are discussed in Chapter 4.
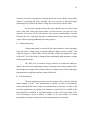
2.1
Block Diagram
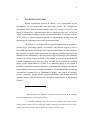
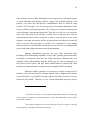
The MASS and SCTU systems contain several controllers, instruments,
sensors and actuators which are integrated to accomplish all of its requirements.
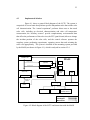
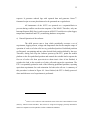
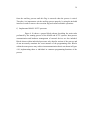
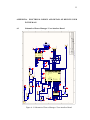
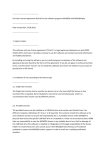
Figure 2.1 shows the modules and interfaces that form the MASS and SCTU
systems, including the control interface and power lines of the most relevant powerconsuming devices. A complete description of the elements shown will be covered in
detail in this document.
4
IDE
Hard Disk
USB
Power Solar
Panels
PC/104
Central
Computer
Relay
Spectrophotometer
Relay
DAC ADC – DIO Board
Dout
Variable
Load
Extra
RS-232 ports
ISA
Voltage Current
Test
Solar
Panels
Solar
Charger
Battery Pack
Temp.
Logger
Data
Logger
PTU
Microcontroller
LCD
Display
12V and 24V
(always on)
Keypad
Signal:
Power:
Figure 2.1: Block diagram of the system
5
3
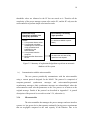
MULTIPURPOSE AUTONOMOUS SOLAR STATION (MASS)
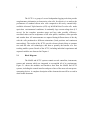
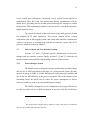
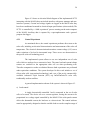
As discussed in Chapter 2, the MASS includes several hardware and
software components that provide services to child experiments. These components
are grouped into “modules” (or hardware-software units) which are available to child
experiments as independent units to perform specific functions, as shown in Figure
3.1. The MASS additionally defines a “software core” which delineates all the basic
rules for the software running on the MASS. All programs, including internal
module software and external child experiment software must follow these rules in
order to avoid potential conflicts.
MASS
Software Core
Modules
Main
Computer
(PC/104)
Power Manager
User Interface
(Microcontroller)
Power Supply System
Child
Experiments
Mounting
System
Figure 3.1: Internal structure of the MASS interacting with child experiments
3.1
MASS Modules
As shown in Figure 3.1, the MASS includes a main computer module,
power manager/user interface module, mounting module and power supply system
module. They provide child experiments with controlled power (when available),
advanced processing capacity, logging capacity, input and output of analog and
digital interfaces, physical storage space and user interface. Individual modules are
6
composed by one or more hardware units and include a control software (when
applicable).
As this report mainly intends to document the most relevant concepts and
techniques used in the implementation of a MASS system, details of specific
components used will be omitted in the main sections of this report (only generic
characteristics of the selected devices will be mentioned). Details of specific brands
and characteristics of used devices are included in Appendix A.
3.1.1
Central Computer Module
The central computer module is based on a high-performance x86 CPU
using the PC/104 form-factor. The PC/104 format was chosen due to its small-sized
and stackable architecture which allows to add new hardware boards in a spaceefficient way. The computer uses a laptop-type 3.5” hard drive and runs Redhat
Linux operating system. Linux was chosen given its proved stability, solid
networking capabilities and simple programming tools. The system provides
processing and storage capacity to child experiments as well as to the power
manager/user-interface module. Therefore, the main computer module of the MASS
can be used to control child experiments and also to log and process their captured
data.
In order to achieve the generic and expandable objectives of the MASS,
the PC/104 standard stack was expanded with additional boards to include various
widely-used analog and digital input/output (I/O) interfaces. Basic PC/104 interfaces
were extended with an analog/digital (A/D) input/output board and with a multiserial
RS232 / RS422/485 communications board.
The specific characteristics of the selected boards are an A/D interface
with 32 analog inputs, 4 analog outputs and 24 shared digital I/O, and a multiserial
board providing 8 additional serial ports. Considering the existence of a USB
interface in the motherboard, the system provides child systems with most of
standard interfaces available.
7
3.1.2
Power Supply System Module
The MASS provides power to its internal components as well as to child
experiments. It offers several voltage outputs which may be uninterrupted for lowconsuming devices, or relay-controlled for devices with high-power requirements or
with short duty cycles.
The system obtains its power from a group of solar panels. The excess
energy charges a set of batteries which power the system when there is no enough
solar energy available. A solar controller is included, which automatically manages
the energy available giving an optimal charging cycle to the batteries and also
maintaining the power solar panels working at their maximum efficiency point by
using pulse-width-modulation switching techniques. The solar charger additionally
protects the batteries from deep discharge, disconnecting them when a low-voltage
threshold is reached.
Given the power requirements of the experiments and devices used in
this work, two 1293 x 329mm commercial silicon solar panels were used, together
with two 12V lead acid batteries connected in series. The selected solar controller
includes the adequate pre-programmed charging cycle for the batteries.
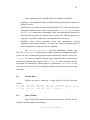
3.1.3
Mounting System Module
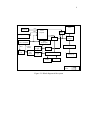
The system includes a weatherproof UV-stabilized enclosure to mount
electronic components. It is installed on a tripod providing mechanical support to the
complete system and physical storage space for MASS-related and external
components. It offers connection with the exterior in order to interface with sensors
and to receive solar power input.
A modified weather station enclosure was used in this work to benefit
from its incorporated capacity to keep the components protected from sunlight, dust
and moist. Built as a white fiberglass-reinforced enclosure it is designed to reflect the
solar radiation, therefore maintaining a relatively moderate internal temperature
when exposed to the sun. Modifications include a hinge-based second floor to
provide additional space for electronic components, and also weatherproof ducts to
8
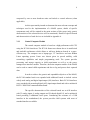
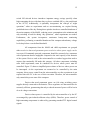
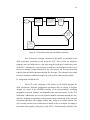
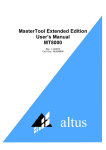
communicate with the exterior. The enclosure was mounted on a standard three
meter-tall galvanized steel weather station tripod, as shown in Figure 3.2. Child
experiment sensors are intended to be mounted on the top of the tripod in order to
minimize external effects caused by factors such as people and shadows.
Figure 3.2: MASS / SCTU system installed in the field
3.1.4
Power Manager and User-Interface System Modules
The MASS includes a power manager system for power control and a
user-interface system for user interaction. Although the two functions are not related,
both systems are controlled from a single microcontroller that independently
manages both units.
The user-interface includes an onboard mechanism for user control and
monitoring. The device incorporates a small LCD screen to display an ordered menusystem, for the user to perform routine tasks over the MASS or child experiments
without using external tools.
9
The power manager globally controls the power budget of the MASS by
switching devices On only when they are required to operate, and switching the
system Off if the battery voltage decreases below a configurable threshold. The
complete powering-scheme is configured using the user-interface system.
The user-interface/power manager systems is a relatively large system
involving several algorithms and specific components. The integrated system will be
covered in detail in section 3.3.
3.2
Software Core
The software core defines the basic rules and programming code
structure for all MASS-related processes3 running on the main computer. All MASS
and child software which directly or indirectly uses one or more of the MASS
modules must follow these rules in their programming code.
The MASS includes a core process which manages the user interface /
power manager module by handling user input and executing power schemes (details
of the core process are covered in section 3.3.3). This is a crucial software for the
operation of the MASS and must run at all times while the computer is powered.
This process must be the only entity that directly communicates with the
microcontroller.
In the case of child experiments, in general terms the main computer
must run at least n independent processes for n implemented experiments. Frequently
these processes need to communicate with other child processes to exchange relevant
data (e.g.. configuration parameters) or with the core process to execute MASSspecific actions (e.g. external user requests). Methods such as the use of files or
3
A process is referred in this document as an entity capable of executing a given piece
of code, that has its own execution stack, its own set of memory pages, its own file descriptors table
and a unique process ID.
10
direct memory access to share information between processes are discarded because
of speed limitations and sharing conflicts, among other potential problems. The
software core states that inter-process communication must be achieved using
System-V IPC4 messages. Two or more processes can exchange information if they
access a common system message queue. The sending process places a message onto
a queue through a message-passing module. Then the receiving process accesses the
same queue and retrieves the message. Sending and receiving processes need no
synchronization between them, being able to read or write the queue at any given
moment. A message in the queue will never interrupt the receiving process and will
only be received when the queue is checked. As a consequence, if the sending
process needs to be certain that the message was received, a two-way communication
system with acknowledge and timeout must be programmed.
Running independent processes for each child experiment takes
advantage of the multitasking capabilities of the Linux operating system and makes
it possible to incorporate with ease new child experiments. Routines that were
originally written independently from the MASS may be easily incorporated as a
new process to the system, and only minor modifications are needed only when
inter-process communication is required in order to implement IPC messaging.
Hardware conflicts caused by two processes accessing a single piece of
hardware is also solved using IPC message requests. Only a single process directly
accesses the device, receiving IPC message requests from other processes to execute
actions on their behalf5. Therefore, in case several independent processes need to
4
Unix System V Release 4 was developed by AT&T Bell Laboratories, incorporating
message queues for interprocess communication (IPC), among other functionalities such as shared
memory and semaphores.
5
This solution is analogue to the system used by the core process, where it is the only
entity that directly communicates with the microcontroller.
11
access a single piece of hardware, a dedicated “server” process for the hardware is
implemented. Then, this is the only process that directly communicates with the
shared device, providing services to other processes through IPC messages to control
the hardware. This implemented solution avoids the need of a synchronizing unit to
handle hardware access.
The system developed in this work runs a single child process to handle
the complete SCTU child experiment. This process controls several external
components such as data logging systems and testing units and also communicates
with the core process to exchange data with the user-interface system. The SCTU
process is analyzed in detail in chapter 4.
3.3
Power Control and User-Interface Systems
Sections 3.3.1 and 3.3.2 presents specific characteristics of the power
manager and user interface systems. Finally, sections 3.3.3 and 3.3.4 discusses all
shared elements (microcontroller and operating software) of both systems.
3.3.1
Power Manager System
The MASS system is designed to operate continuously providing energy
and services to child experiments at all times. As a solar-powered system, the daily
amount of energy available is variable, and depends on the sun-power available and
also in the size and efficiency of the power solar panels. Due to the existence of an
uncertainty factor, the MASS tries to reduce the power consumption of devices
whenever possible in order to prevent potential power outages6.
The MASS is designed to use its components in an energy-efficient way
in order to provide services to child experiments at any time of the day. Its ability to
6
The incorporation of higher capacity batteries or larger solar panels is discarded in
order to keep a portable and reduced-sized system.
12
switch Off selected devices introduces important energy savings specially when
high-consuming devices with short duty-cycles are switched Off (e.g. the pan/tilt unit
in the SCTU). Additionally, it optionally incorporates the concept of “night
operations” when no experiments and no user-monitoring are required during
predefined times of the day. During these episodes it makes a controlled shutdown of
the main computer of the MASS, reducing power consumption to the minimum and
only switching it back On during “day operations”, when experiments are needed.
Furthermore, the system incorporates continuous battery-state monitoring
capabilities, performing a controlled shutdown of the computer when battery voltage
levels drop below a user-defined threshold.
All components from the MASS and child experiments are grouped
either as devices that need permanent power or devices whose power supply can be
interrupted. Permanently-powered components should be extremely-low consumers
with requirements that are negligible compared to the total capacity of the batteries
of the system. Devices such as the microcontroller or weather loggers that need to
capture data continually fall under this category. All other components, including
most child experiments, must be considered as devices whose power must be
controlled. Figure 3.3 shows a simplified power-scheme of devices whose power can
be interrupted. As the experiments are assumed to be controlled by the main
computer, direct power control from the microcontroller over the experiments is not
required since the PC is the core of their execution. Therefore, the microcontroller
only controls the power state of the computer.
Devices that need permanent power are fed using switching power
supplies directly connected to the batteries. These regulators are characterized to be
extremely efficient, guaranteeing that only a reduced amount of power will be lost in
dc to dc voltage conversions.
Devices whose power is controlled by the microcontroller or by the PC
are managed by opto-isolated solid-state relays (SSRs). Therefore, power control of
high-consuming components is achieved by generating standard TTL digital control
signals.
13
Battery
Levels
Microcontroller
(always on)
Voltage
Reference
Experiment 1
PC
Experiment 2
Experiment n
Figure 3.3: Simplified power-control diagram of devices whose power can be
interrupted
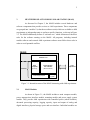
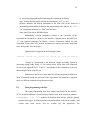
3.3.2
User-Interface System
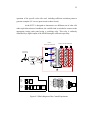
The user-interface system provides direct interaction capabilities
between the user and the MASS by including a small alphanumeric display and
keypad onboard. The user can execute actions on the MASS or can indirectly access
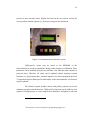
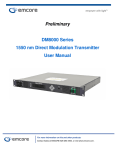
any of the child experiments using IPC messages. Figure 3.4 shows the user interface
system (keypad and user display) implemented for this work.
The user-interface is completely operated by the microcontroller and
communicates with the core process of the MASS when needed. The device displays
relevant data on the user display, receives user-input from the keypad and stores
relevant execution values in its internal EEPROM memory. Additionally, the
microcontroller may be indirectly used by child experiments (through the core
14
process) to store internal values, display local data on the user screen, and for the
user to perform manual requests (e.g. data processing) on the experiment.
Figure 3.4: Implemented user interface system
Child-specific values may be stored in the EEPROM of the
microcontroller to avoid recompilations during routine changes or calibration. These
parameters can be modified using the user-interface even when the main computer is
powered down. Therefore, all values can be updated without requiring external
hardware (e.g. keyboard/monitor, external computer, etc) when operating in the field.
To implement all this child-specific functionality in the microcontroller, its firmware
must be updated7.
The interface system includes menus with primary options and several
submenus grouping related functions. Child-specific functions may be added as new
options in existing groups or create complete new submenus. Navigation is achieved
7
The firmware is written in a high-level programming language (C).
15
in an analogue way to cellular telephone systems with cyclic menus. Basic options of
the MASS included in the user-interface are the following:
-
Main Menu: It cyclically displays user-relevant data on the alphanumeric
display, including status of the system (“online”, “permanent off”, “back in X
minutes” during sleeping time, “system loading”, “system boot failure” or
“lost connection”), battery voltage and relevant values of child experiments.
This is the default state of the system when the interface has not been used in
a predefined time.
-
Power Manager Menu: Includes several submenus related to powering up and
down the system. Basic submenus are the following:
-
Turn the system permanently On or Off. Starts or stops regular operations.
When turned On, the system starts to monitor battery voltage and
day/night operation times.
Forced On. Turns the system On with no experiments overriding “day”
and “night” limits and low voltage conditions. This option allows the user
to get data from the PC during night operations (when experiments are
not needed), switching the computer momentarily On. This state must be
manually executed to resume normal operations.
Turn the system Off for “today”. This option turns the system
immediately Off, turning it back On “tomorrow” morning according to
the predefined schedule. This function is useful when experiments are not
required for the current conditions (e.g. bad weather) or when irradiance
conditions are poor for battery charge, setting the system in a “charging
state” to prevent emergency shutdowns in the future. Additionally, this
option can be used to exit from the “Forced On” state engaging the
scheduling system again.
Configure Menu: Includes several submenus related to the storage of relevant
parameters in the EEPROM memory of the microcontroller. Basic stored
parameters are: low battery voltage threshold for turning the system Off, time
16
of the day when “night operations” start and total length (in minutes) of night
operations.
The specific implemented menu system used for the MASS / SCTU in
this work is exposed in Appendix G, including specific options for the SCTU child
experiment.
3.3.3
User Interface & Power Manager Software: The Core Process
The core process running on the PC is crucial for the operation of the
power manager and user-interface systems of the microcontroller. The core process
acts as the coordinating unit between the microcontroller and the rest of the system,
being the only process that directly communicates with it. It generates scheduled or
emergency shutdowns, powers down devices that are not in use, provides child
experiments with execution parameters stored in the microcontroller, publishes
relevant user-values on the onboard display, and executes manual requests upon user
request.
i)
Scheduled Shutdowns
During scheduled shutdowns the core process generates an autoshutdown procedure in order to save energy. These procedures are executed at
predefined times of the day, relying on the microcontroller to be powered back On.
The algorithm defines “day” and “night” operations, which are arbitrary times of the
day defined by the user. During “night operations” no power-controlled experiments
are executed and no external information is displayed on the user screen because the
computer is powered-off. The PC is automatically turned back on by the
microcontroller at the beginning of “day operations” according to a configurable
time determined by the core process before the computer was halted.
17
ii)
Emergency Shutdowns
Emergency shutdowns are also computer-generated halt requests, but
they are a consequence of the detection of a potential power problem. The core
process periodically receives scaled battery voltage8 information from the
microcontroller and generates an auto-shutdown procedure if its levels decrease
below a configurable-threshold. This mechanism prevents a deep discharge of the
batteries and an abrupt drop of power. When an emergency shutdown is generated,
all day operations are cancelled until the following day. This allows the batteries to
be recharged, avoiding endless-cycles of powering up and down due to voltage
variations caused by variations in the system load.
Figure 3.5 summarizes the implemented algorithm for the execution of
shutdown procedures.
iii)
Configurable Thresholds
All decision parameters such as limits of night/day operations and
voltage-thresholds are configurable values which are stored in the microcontroller to
be used by the core process in the computer. This process polls for the stored values
when needed according to the protocol detailed in Appendix F. Therefore, the user is
able to dynamically update parameters using the user-interface, even when the
computer has been powered down.
The implemented solution uses the advanced processing capacity of the
computer to take all powering decisions, but taking advantage of the features offered
by the user-interface as well. Therefore, the programming code must not be
recompiled and there is no need to access files in the hard drive because all
8
The scaled value is a reduced battery voltage that matches the ADC range of the
microcontroller. It is expressed in internal microcontroller counts which is proportional to the real
voltage value.
18
thresholds values are informed to the PC but not stored on it. Therefore all the
complexity of the power manager system relies on the PC, and the PC only uses the
microcontroller to perform simple user-interface tasks.
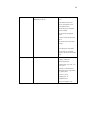
Event: End of Day
Operations or Battery Low
during day operations
Actions
1. Core process detects event
2. Core process calculates
remaining time until the start
of day operations and
publishes it to the
microcontroller
3. Core process halts the
computer
4. Microcontroller disconnects
the PC
Event: Battery Low during
night operations
No action
(no devices available to power
down)
Microcontroller turns the PC back
on when time until start of day
operations has elapsed
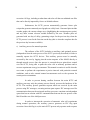
Figure 3.5: Summary of implemented algorithm to perform an automatic
shutdown of the system
iv)
Communication with the microcontroller
The core process periodically communicates with the microcontroller
using a custom protocol designed for the MASS. The protocol is comprised of
computer-generated synchronous messages and microcontroller-generated
asynchronous messages. Only synchronous messages are acknowledged, where the
microcontroller sends relevant parameters to the core process as an answer to the
original message. Details of the protocol are described in Appendix F. A general
description of the protocol is covered in section 3.3.4, subsection c).
3.3.4
Microcontroller
The microcontroller that manages the power manager and user-interface
systems is a low-power device that operates continually, having power requirements
that are negligible compared to the total capacity of the batteries. Due to its
19
extremely low power-consumption it should operate for weeks with the energy in the
batteries even during low power episodes, due to its capacity to disconnect highconsuming devices before the battery voltage levels decrease to critical values.
For the power manager system, the microcontroller acts as a passive unit
most of the time, acting only upon orders received from the core process of the
computer. In the case of the user-interface, the system is autonomously executed
allowing the user to navigate through an ordered-menu system and store relevant
values without requiring additional processing capacity.
a) Voltage Monitoring
Voltage monitoring is executed by the microcontroller, which constantly
reads the battery voltage using its internal analog to digital converter (ADC). The
captured voltage is a scaled value of the real battery voltage that matches the range
of the ADC. The scaled value is obtained from an adjustable high-impedance voltage
divider (potentiometer).
The ADC uses an external voltage reference to perform the analog to
digital conversion, thus minimizing erroneous readings such as those generated by a
fluctuating power supply. The external reference is composed by a Zener diode and a
potentiometer to adapt the breaking voltage of the diode.
b) Time Monitoring
The time monitoring system is used to measure time accurately while the
main computer is down. Time measurement is needed in order to systematically
switch On and Off the main computer at predefined times of the day. To achieve this
precision requirement, an auxiliary low-frequency crystal clock was enabled in the
microcontroller in addition to the high-frequency crystal used for the main clock.
The low-frequency crystal overflows a counter in an exact number of seconds
generating an interrupt, where precise time operations may be performed.
20
c) Firmware of the Microcontroller
The firmware of the microcontroller is one of the most relevant
components of the MASS system, being the nucleus of the user-interface and power
manager systems. The microcontroller achieves these tasks running a single routine
based on interruptions.
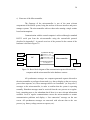
Communication with the central computer is achieved through a standard
RS/232 serial port from the microcontroller using the custom-built protocol
described in Appendix F. A general overview of the protocol in the context of the
hardware is shown in Figure 3.6.
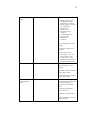
Synchronous Messages
Sensor 1
Sensor 2
Sensor n
1 Heartbeat + info
PC
2 Acknowledge + info
Asynchronous Messages
User Requests
Microcontroller
User
Interface
Figure 3.6: Basic block diagram of the communication protocol between the
computer and the microcontroller in the hardware context
All synchronous messages are computer-generated requests directed to
the microcontroller to perform relevant tasks (e.g. data to display on the user screen,
power-down requests, etc). These messages also act as “heartbeats” (or “keep alive”)
messages to the microcontroller, in order to confirm that the system is operating
normally. Heartbeat messages must be received from the core process on a regularbasis, containing new or else redundant data if there is no new relevant information
available. Lack of regular communications causes the microcontroller to assume
communication problems and display a “lost connection” message on the user
screen. All synchronous messages are answered with relevant data to the core
process (e.g. battery voltage, answer to requests, etc).
21
In parallel, the user interface can generate microcontroller-transmitted
asynchronous messages as a result of user requests. These messages are transferred
to the core process when needed and they are not acknowledged.
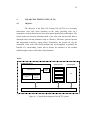
22
4
SOLAR CELL TESTING UNIT (SCTU)
4.1
Objective
The objective of the Solar Cell Testing Unit (SCTU) is to accurately
characterize solar cells when operating on the earth, providing tools for a
comparative analysis between new and conventional photovoltaic technologies. The
system makes an electrical characterization of the solar cells and provides data to
determine other relevant parameters such as efficiency, fill factor, spectral response
and temperature sensitivity, among others. Furthermore, the system can vary the
orientation of the solar cells (fixed positions and sun-orientation) to quantify the
benefits of a sun-tracking system and to analyze the influence of the incident
radiation angle on the overall solar cell performance.
SCTU
Central Experiment
Auxiliary Sensors
Solar Test Cells
Variable
Load
Pointing System
Spectrophotometer
Pyranometer
PTU
Current and Voltage
Sensors
Solar Cell
Temperature
Sensors
Wind
Ambient Humidity &
Temperature
Control Software
Figure 4.1 : General block-diagram of the SCTU system
23
4.2
Implemented Solution
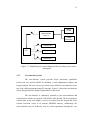
Figure 4.1 shows a general block-diagram of the SCTU. The system is
comprised of several units that perform specific independent tasks that aid the solar
cell characterization. The “central experiment” performs direct tests to the tested
solar cells, including an electrical characterization and solar cell temperature
measurement; the “auxiliary sensors” provide complementary environmental data
that affect the performance of these devices; the PTU (pan/tilt unit) allows to change
the incident position of the solar cells; and the control software operates the
complete system performing experiments, capturing sensor data and orienting the
solar cells appropriately. The system is installed on the mounting system provided
by the MASS (not shown in Figure 4.1), which is analyzed in section 4.2.4.
Electronic-controlled
Variable Load
Voltage Level
Current Level
MASS
Signal Conditioner
(optional)
D/A
Current Sensor
A/D
Group of Testing
Solar Cells
Thermocouple
RS/232
ports
USB
Temperature Transmitter
Variation of
position
Data Logger
Pan/Tilt Unit
(PTU)
Pyranometer
Wind Sensor
Spectrophotometer
Temperature &
Humidity Sensor
Control Signal:
Test Signal:
Mechanical:
Figure 4.2: Block diagram of the SCTU and interaction with the MASS
24
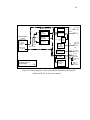
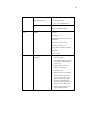
Figure 4.2 shows an electrical block-diagram of the implemented SCTU
interacting with the MASS (does not include interface with power manager and userinterface systems). Current and voltage signals are logged in the MASS after they
have been conditioned to match its electrical input specifications (when needed). The
SCTU is controlled by a “child experiment” process running on the main computer
of the MASS. Auxiliary data is captured by a spectrophotometer and a generalpurpose data logger.
4.2.1
Central Experiment
As mentioned above, the central experiment performs direct tests to the
solar cells, including an electrical characterization and measurement of the solar cell
temperature. The electrical characterization determines current-voltage (I-V) curves
under variations of its load in incremental steps. These curves are characteristic to
the specific solar cell technology used.
The implemented system allows to test two independent sets of solar
cells which are analyzed on a consecutive basis. The same load and current/voltage
sensors are switched to the appropriate solar cell set when performing tests.
Therefore comparative results are obtained because both experiments are performed
under equivalent conditions. The system developed in this work includes a set of
silicon solar cells (conventional technology) and a set of the newly commerciallyavailable Advanced Triple Junction (ATJ) n/p InGaP/InGaAs/Ge solar cells,
traditionally used on satellites.
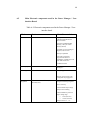
A general implementation scheme of the system is shown in Figure 4.3.
a) Load control
A single electronically-controlled load is connected to the set of solar
cells to be tested. The device acts as a current regulator, forcing the current to be
proportional to a voltage signal controlled by the MASS. If the solar panels cannot
deliver the demanded current, the load acts as a short-circuit. The control software
must be appropriately designed so that the variable load covers the complete range of
25
operation of the specific solar cells used, including sufficient resolution points to
generate complete I-V curves (open-circuit to short-circuit).
As the SCTU is designed to characterize two different sets of solar cells
under equivalent electrical conditions, the variable-load is switched to connect to the
appropriate testing solar panel using a switching relay. This relay is indirectly
controlled by a digital output of the MASS through a solid-state opto-relay.
Panel 1:
Silicon Solar Cells Panel
Panel 2: ATJ Solar Cells Panel
V1
V2
V3
13
12
7
2
Va
8
3
2
Variable Load
9
4
Vb
15
current sensor
output to MASS
14
5
3
10
Vc
-
From
ATJ solar
cells
LPF
Voltage
Follower
6
10
15
9
5
Voltage
Dividers
8
13
12
7
6
T2
T3
ATJ
MASS A/D
inputs
T4
T3
H1
Trans
X1
H2
H3
11
V1
V2
V3
1
T2
T1
Si
3
T1
4
MASS A/D
inputs
2
Va
Vb
Vc
14
Temperature Measuring (thermocouples)
Voltage Sensing Circuits
From
Si solar
cells
+
-
1
1
Control Signal
from MASS
11
+
PC controlled
Relay
T3
Figure 4.3: Block diagram of the Central Experiment
H4
8T
X2
temperature
transmitter
to MASS
26
b) Current Measurement
Current measurements of the solar cells are performed using a magnetoresistive current sensor whose operation is based on the anisotropic magnetoresistive (AMR) effect. The output of the sensor is a voltage proportional to the
measured current. The output voltage range meets the electrical standards of the
analog input of the MASS so it can be directly connected to that system.
Electrically, the current sensor is connected in series with the variable
load (see Figure 4.3), being switched by the same relay connecting both solar cell
sets. Therefore, a single sensor for current measurement is used, allowing to get
comparable current measurements and thus avoiding potential differences between
sensors.
c) Voltage Measurement
The voltage measurement electrical implementation is specific for the
particular set of solar cells that are being tested, which is dependant on the expected
history-maximum output voltage of the solar cells. Sensed voltages should never
exceed the electrical limits of the A/D converter of the MASS. Higher-expected
voltages occur during high-irradiance episodes during open-circuit conditions.
In the case of the silicon solar cell sets used, the open-circuit voltages
will never exceed the maximum voltage accepted by the analog input of the MASS.
Due to its low impedance, the voltage signal is directly connected to the analog input
of the MASS.
Conversely, ATJ solar cells are expected to operate at higher voltages
and lower currents than silicon solar cells due to its construction characteristics.
Open-circuit voltages regularly exceed the maximum voltage limit allowed by the
analog input of the MASS. In order to decrease this input voltage a high-impedance
voltage divider is implemented, obtaining a scaled value with negligible power
losses. This high-impedance voltage divider exceeds the maximum input impedance
recommended for the analog input of the MASS. Therefore, a voltage follower is
also included in order to decrease the input impedance observed by the MASS.
27
Additionally, a low-pass active filter was also incorporated to remove eventual
electric noise in the signal. Voltage divider, low-pass filter and voltage follower are
grouped and built together in a “signal conditioner” board.
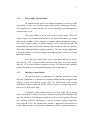
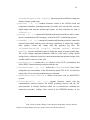
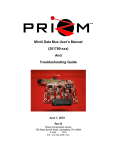
d) Solar Cell Temperature
Each set of solar cells includes two K-type thermocouples located in two
different locations of the solar panel as seen in Figure 4.4 for the ATJ solar panel
(location is analogous for the silicon solar panel). To determine the temperature of
the solar cell sets, a temperature transmitter to interface with the thermocouples is
used. The transmitter is programmed to operate with the specific kind of
thermocouple providing a calibrated output temperature upon request from the
central computer of the MASS. The device digitally transmits the temperature values
from the four thermocouples.
Figure 4.4: ATJ solar cell set used in the SCTU (embedded thermocouples are
shown)
28
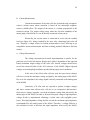
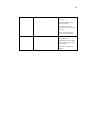
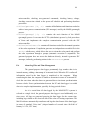
4.2.2
Pointing System
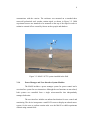
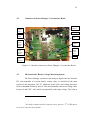
The objective of the pointing system is to characterize testing solar cells
under different external conditions. The solar cells and complementary instruments
are mounted on a pan/tilt unit (PTU) that can vary its orientation from horizontal to
sun-pointing or any fixed orientation at any given moment (a picture of the mobile
platform is shown in Figure 4.5). This mechanism provides the tools to quantify the
power benefits of implementing a sun-tracking system for applications such as
robots. It may be additionally used to determine the influence of the incident sunangle over the efficiency of the solar cells due to reflections and varying path-lengths
on each semiconductor caused by changes in the angle of the incident light.
Figure 4.5: SCTU mobile platform pointing to the sun
The main component of the solar-tracking system is its operation
software. Sun position is analytically determined knowing the geographical location
(latitude and longitude), and day and time of the year. This has economic advantages
over sun-locating sensors, but requires precision when installing the device in order
to get proper orientation.
29
Sun-tracking software uses the SPICE9 library written by NASA. SPICE
system is used as the mechanism for capturing, archiving and disseminating a variety
of ancillary and engineering information needed by scientists involved in mission
design, observation planning, science data analysis and visualization, and correlation
of data between multiple instruments. SPICE ancillary data includes spacecraft
trajectory, target body ephemerides, target size/shape/orientation, spacecraft
orientation, instrument mounting and field-of-view geometry, and commands and
events associated with the conduct of a mission. By providing SPICE with the
current geographic location and current date and time, the SCTU is able to get the
position of the sun at any given moment.
The implemented system in this document uses a commercial PTU
device based on a stepper motor. The pan/tilt unit includes a PTU controller which is
operated using a standard RS/232 serial line of the MASS. The PTU has a freedom
of 300º pan, 46º tilt (bottom) and 31º tilt (top). The pan range allows to track the sun
during daylight, but the tilt range may be a limiting factor on certain locations during
specific times of the day. The SCTU was built to operate in the latitudes ranging
from the Atacama desert to Rancagua, Chile, where the sun is positioned in the range
of the PTU during all the relevant high-irradiance times of the day for the complete
year.
The selected PTU is a big power consumer, what is mainly caused by the
controller servoing the PTU to maintain the desired position. Therefore, the PTU was
integrated to the power manager system of the MASS, only being powered during
experiment execution when repositioning of the solar cells is required. Powering of
the device is achieved using an opto-relay SSR controlled by the main computer of
9
SPICE is the standard for nearly all NASA planetary missions such as Galileo,
Clementine, MGS, Mars Odyssey, Cassini, NEAR, DS-1, Stardust, MER, Deep Impact, MRO and
CONTOUR. It will also be used on Mars Express (in parallel with ESA standards), and it could be
used on ESA's Rosetta, Japan's Nozomi, or other foreign missions.
30
the MASS, as discussed in section 3.3.1. Dramatic power savings are introduced by
the power manager when no experiments are performed (e.g. after sunset). Although
the selected PTU requires initialization procedures to determine its absolute position
each time it is powered, it was empirically determined that better power efficiencies
are obtained with numerous initializations on a day rather than continuous powering.
4.2.3
Auxiliary Sensors
The main objective of the auxiliary sensors is to capture data that
characterizes the incident environment affecting the solar cell performance for the
analysis of results. All data is periodically captured and retransmitted for logging in
the MASS. Onboard measurements include solar spectrum, irradiance (total power
per area), environmental temperature, relative humidity and wind speed. The
described system is implemented using a general-purpose data logger which is
operated through a RS/232 serial line from the MASS and a spectrophotometer
operated through USB.
a) General-purpose data logger
The general-purpose data logger is a programmable device able to
interface with an enormous variety of sensors for different purposes. Its interface
offers analog inputs, pulse counters, switched voltage excitations and digital ports.
The system runs user-programs (built with a proprietary programming language),
being able to scan measurements at independent intervals and make more complex
operations such as averaging of measurements and raw data conversion to units. It
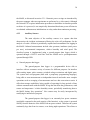
offers data storage capabilities, being capable of operating for long periods of time
without communication with the MASS. It logs the data from the pyranometer, wind
sensor and temperature / relative humidity sensor, periodically transferring data to
the MASS during “day operations”. New sensors may be easily incorporated by
modifying its internal user-program.
The general-purpose data logger is an extremely-low power consumer
(negligible compared to the total capacity of the batteries), so the system is powered
directly from the batteries of the MASS with no power control. Therefore the system
continually logs data from its sensors, even during night operations. This allows to
31
permanently log weather variables even when the MASS is powered down, allowing
to characterize the surrounding environment. Deep-discharge of the battery is
unlikely to occur because, according to electrical specifications, they should provide
the data logger with enough power for days, even when the MASS was powered
down due to low voltage conditions.
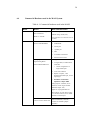
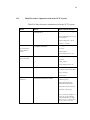
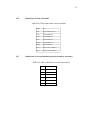
Table 4.1 shows the main electrical characteristics of sensors used by the
SCTU that are connected to the general-purpose data logger.
Table 4.1: Main characteristics of the SCTU sensors connected to the
general-purpose data logger
Sensor
Main Characteristics
Pyranometer
-Flat spectral response for the full solar spectrum
-Spectral Response Waveband: 305 – 2800nm
-Maximum Irradiance: 2000 W / m 2
-Operating Temperature: -40 to 80ºC
Wind Monitor
-Measures wind speed & direction
- Range of operation (speed): 0 – 60 m/s
-Accuracy (speed): 0.3m/s
-Range of operation (direction): 355º (electrical)
-Accuracy (direction): 3º
Temperature &
Relative Humidity
Sensor
-Temperature Range: -40ºC to 60ºC
-
Expected error: < 0.6ºC for 0-35ºC range
-Relative Humidity Range: 0 to 100%
-
Typical long-term stability: <1% RH per
year
32
b) Spectrophotometer
The spectrophotometer allows to analyze the performance of the solar
cell sets, capturing the incident solar spectrum. The device is mounted on the same
mobile-plate of the testing solar cells (controlled by the PTU) in order to capture the
exact incident solar radiation of the panels.
The spectrophotometer was incorporated mainly to analyze the
performance of ATJ solar cells when comparing results to existing studies in space.
ATJ solar cells are constructed including three junctions in series optimized to
capture specific parts of the spectrum. If the atmosphere eventually filters relevant
wavelengths to one of the junctions, the performance of the whole solar cell may be
degraded due to its serial configuration. Therefore, spectral differences in space and
in the atmosphere may be used to analyze the obtained results.
The system developed for this work uses a spectrophotometer which is
powered and operated through a USB interface. It uses a closed proprietary
communication protocol so its operation is restricted to the software provided by the
manufacturer. It has two independent channels (master and slave) which together
cover a spectral range from 200 to 1100nm. Although the spectrometer does not
cover the complete spectral range used by ATJ solar cells (300 to 1900nm,
approximately), it includes the part with the highest irradiances (visible region).
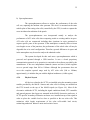
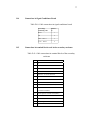
4.2.4
Physical Layout
All devices related to the SCTU are installed using the mounting system
module provided by the MASS. Sensors and solar cells for testing are mounted on
the PTU located on the top of the MASS tripod (see Figure 4.6). Most of the
electronics within the SCTU, including the signal conditioner board, PTU controller
and general-purpose data logger are mounted in the MASS electronics enclosure. A
SCTU-specific secondary electronics enclosure was installed on top of the tripod in
order to place the variable load as close as possible to the test solar cells. This
minimizes cable length requirements of the solar cell/variable load circuit,
minimizing undesired inductive noise and resistive losses.
33
Test Panel 1
(Si)
Spectrophotometer
Test Panel 2
(ATJ)
Temperature
Transmitter
Silicon Solar
Test Panel
(Siemens)
Advanced Triple
Junction Solar Test
Panel (Emcore)
Support Plate
Mobile Platf orm
Thermocouples
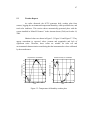
Figure 4.6: Top-view diagram of the mechanical layout of SCTU mobile
platform
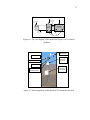
Wind Sensor
Pyranometer
Spectrophotometer
Secondary
Electronics
Enclosure
Solar cell sets
Temperature &
Humidity Sensor
Primary
Electronics
Enclosure
Figure 4.7: Main components of the MASS/SCTU mounted in the field
34
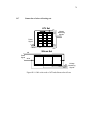
Figure 4.7 shows the mounting scheme of the SCTU devices. Figure 4.8
shows the layout of components of the SCTU in the primary and secondary
electronics enclosure.
Primary Electronics Enclosure
Secondary Electronics Enclosure
PTU
Controller
Variable
Load
Relay
(switches
solar cell
sets)
Generic
Data
Logger
Protectio
n Fuses
Signal
Conditioner
Current
Sensor
Figure 4.8: Layout of components in the Primary and Secondary Electronics
Enclosure
4.2.5
Control Software
The SCTU is operated by a single independent process running on the
main computer of the MASS. It operates the general-purpose data logger,
temperature transmitter, PTU controller and central experiment using the features of
the MASS. The process uses RS/232 serial interfaces for communications, digital
outputs to switch to the appropriate solar-cell set and to power down the PTU when
not in use, analog outputs to operate the variable load and analog inputs to read
current and voltage levels. It additionally communicates with the core process of the
MASS to receive user-generated orders, calibration parameters and powering down
35
requests. It generates ordered logs with captured data and generates Octave10formatted scripts to create plots that need to be generated on a regular basis.
All instruments of the SCTU are operated on a sequential-basis to
prevent sharing conflicts on the main computer of the MASS. Therefore, only one
Interrupt Request (IRQ) line is used to operate all RS/232 serial devices (data logger,
temperature transmitter and PTU), minimizing hardware occupation.
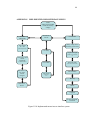
a) General Operation of the software
The child process runs a loop which periodically executes a set of
experiments, logging current, voltage and temperature data for the complete range of
operation of each set of solar cells in every predefined position. Predefined positions
are flat-panel, sun-pointing and any other desired fixed position defined by the user.
Therefore, during each loop the software powers-up the PTU, points the mobile
platform to the first predefined position and controls the variable-load to operate the
first set of solar cells from open-circuit to short-circuit. Once it has finished, it
switches the load to the second set of solar cells and repeats the experiment. The
PTU is sequentially pointed to each of the following predefined positions, repeating
equivalent experiments for each orientation for both solar cell sets. A summary of
this procedure is shown in Figure 4.9. Once finished, the PTU is finally powereddown until the next set of experiments is performed.
10
Octave is a free software written under the terms of the GNU General Public License
(GPL) by John W. Eaton and others. The software is a high-level language, primarily intended for
numerical computations with capabilities similar to Mathworks Matlab®.
36
Mobile platform is
pointed to a
predefined pos ition
us ing the PTU
Sy stem Star ts
B oth panels are tes ted.
IV c urves, temperatures
and insolation are
acquired and saved
The photo
spec tra is
manually
acquired
NO
Are all the
predefined
positions
reviewed ?
YES
W aits a
predefined
amount of time
and res tarts.
Figure 4.9: Flowchart of the general software operation
Part of the power manager execution of the MASS is performed in the
child experiment, powering up and down the PTU. This is done for simplicity
purposes since the child process is the only program requiring to control the power
of the PTU. Alternatively, control of power could have been integrated to the rest of
the power manager, being controlled by the core process and receiving powering
requests from the child experiment through IPC messages. This solution was avoided
because it introduces additional complexity to the system without major benefits.
b) Integration with the MASS
The SCTU takes advantage of the features of the MASS designed for
child experiments. Relevant configuration parameters that are subject to frequent
changes are stored in the EEPROM memory of the microcontroller, including
geographical location (latitude and longitude) and correction values for the PTU
orientation. Additionally, the user can generate manual commands through the userinterface, including sun-pointing at any moment and the suspension of the solar-cell
experiment (therefore only logging weather data, acting as a weather station). The
user can also read the latest weather data available on the user-display according to
the current data logged by the process of the SCTU. All functionality offered by the
37
MASS is achieved by communicating with the core process of the MASS via IPC
messages, as described on earlier sections.
c) Software of the electronically-controlled load
As discussed in section 4.2.1 in order to control the variable load a
voltage control-signal must be generated in incremental steps in order to vary the
solar cell operation from open-circuit to short-circuit. This is achieved by the SCTU
using the D/A converter of the MASS. The process logs only data points that provide
valuable information, i.e. points which are obtained until the short-circuit condition
is reached11. The control range used for each set of solar cells (from open-circuit to
short-circuit) is empirically determined for the specific set of solar cells that are
being tested. These parameters must be introduced in the programming code of the
process. As a consequence in the implemented SCTU, silicon and ATJ solar cell sets
have dedicated connectors that cannot be interchanged. Furthermore, the
programming code will need modifications (and recompilation) if new solar cell sets
with different electrical characteristics were incorporated to the system.
d) Data processing
The SCTU process incorporates data processing of the logged data,
ordering captured information. Data is ordered on a daily-basis, generating separate
files and directories for each day of experiments. Weather data is logged in an
independent text-file each day, incorporating data from all weather sensors in a
single file. Solar-cell electrical data is logged in independent daily-created
directories, storing in them all the multiple files12 generated during each experiment
11
As the variable operates controlling current the short-circuit condition is dependant
on the characteristics of the solar cells used.
12
Each experiment of a particular set of solar cells pointing in a particular direction
generates an independent text-file log.
38
execution. All logs, including weather data and solar-cell data are tabulated text-files
that can be directly imported by Octave or Matlab software.
Furthermore, the SCTU process automatically generates Octave plot
scripts that generate commonly-used graphs on a daily-basis. Generated plots include
weather graphs, the current-voltage curve (highlighting the maximum power point),
and any other custom relevant variable defined by the user. Weather plots are
generated with one day of delay, generating scripts for the previous day when the
SCTU process is ran for the first time on the day (this is when the complete data for
the previous day becomes available).
e) Auxiliary process for manual operation
The software of the SCTU includes an auxiliary (and optional) process
(independent from the main process of the SCTU previously described) in order to
manually operate the SCTU devices. This auxiliary process must be manually
executed by the user by logging into the main computer of the MASS directly or
through network access. Once the process is executed the user gains direct control
over the SCTU, being able to point the solar cells at arbitrary positions and to
execute experiments at any given moment. This manual execution is useful when the
user wants to perform the experiments at precise intervals with particular external
conditions, and to take external manual measurements such as the spectrum for
certain precise orientations.
In order to prevent sharing conflicts between the main SCTU and
auxiliary processes only the primary process directly accesses the hardware of the
SCTU. The auxiliary process generates requests which are received by the main
process using IPC messages, executing actions upon request. IPC messages used for
communication between the main and auxiliary processes constitute an independent
queue that has no relation with IPC communication between the core process of the
MASS and the rest of the child processes.
In order to interrupt the execution of automatic solar cell experiments
during manual operations, the auxiliary process generates an IPC flag upon
execution. Once this flag is set, the main SCTU process only operates under requests
39
from the auxiliary process until this flag is removed when the process is exited.
Therefore, it is important to exit the auxiliary process properly, by using the included
interface in order to remove the execution flag and resume automatic operations.
f) Implemented MASS / SCTU processes
Figure 4.10 shows a general block-scheme describing the main tasks
performed by the running process of the MASS and SCTU systems. Inter-process
communication and hardware management of external devices are also included.
Blocks shown within individual processes only describe actions of the process and
do not necessarily constitute the exact structure of the programming code. Blocks
within the same process may achieve intercommunication that is not shown in Figure
4.10, implementing them as individual or common programming-functions of the
process.
40
SCTU Main Process
Control of
PTU Power
User- generated
manual
commands
Positioncontrol of PTU
Userupdateable
configuration
SCTU Auxiliary
Process
User Requests:
Information for
user-screen
• Point to a
predefined
position
• Make solar
experiment
MASS Core Process
RS/232
Microcontroller
PTU power
opto-relay
RS/232
PTU
controller
NASA
Spice
“Solar
Library”
Switching of
solar cells
connecting
variable-load
Control of
Variable-load
DATA
LOGGING
Inter-process
Communication via
IPC messages:
Dout
Ordered daily
log-files &
Octave-script
generation
Dout
Analog
Output
RS/232
RS/232
Analog
Inputs
Opto-relay
and solarcell
switching
relay
Variableload control
Generalpurpose
data logger
Temperature
Logger
Solar cell
voltage
and current
Figure 4.10: Block diagram of processes and main functions running by the
MASS and SCTU in the main computer
41
5
RESULTS
In order to demonstrate the capabilities of the system and validate the
quality of its data, the results of several automatically-executed experiments are
presented. This section is only a brief summary of results obtained during the solar
cell analysis and should not be used by themselves as concluding evidence about the
performance of the tested solar cells.
Section 5.1 shows solar cell characterization results. This includes I-V
curves for the ATJ and silicon solar cell sets, and I-V curve variation for ATJ solar
cells along a single day. In addition, results of spectral measurements are illustrated.
Finally, section 5.2 shows examples of automatically-generated weather plots created
by the MASS with SCTU data.
5.1
Solar Cell Characterization
Experiments shown in this section were acquired during a single testing
day on December 12, 2004 in the region of Rancagua (Chile). The selected day was a
“typical” summer day on the area, sunny and completely cloudless.
5.1.1
Current-Voltage (I-V) Curves
One of the most distinctive characteristics of individual solar cell
technologies is their current-voltage (I-V) curve. This curve is obtained by varying
the load in incremental steps, constantly logging voltage and current values from
open-circuit to short-circuit conditions, as described in earlier sections.
Figure 5.1 contrasts the characteristic curves of ATJ and silicon solar
cells during the maximum irradiance episode of the day in horizontal position,
showing relevant electrical parameters. Results confirm that both solar technologies
operate in distinct electrical ranges and present significant differences in
performance. Regarding data quality, captured I-V data from both solar cell sets lack
of significant noise and are suitable for solar cell analysis.
42
35
Voc
Jsc
Vpmax
Jpmax
Temp
FF
Eff
Irradiance
30
Current Density [mA/cm2]
25
ATJ
Si
2345 mV
13.64 mA/cm2
2020 mV
12.31 mA/cm2
53.7 ºC
77.74 %
23.6 %
1052 W/m2
529.3 mV
34.11 mA/cm2
371.3 mV
29.99 mA/cm2
56.7 ºC
61.7 %
10.6 %
1052 W/m2
20
ATJ IV curve
ATJ maximum power point
Si IV curve
Si maximum power point
15
10
5
0
0
0.5
1
1.5
2
2.5
Voltage [V]
Figure 5.1: I-V curve for ATJ and silicon solar cells during the maximum
irradiance episode of the testing day
ATJ solar cells operate at a higher voltage and lower current levels than
silicon solar cells. ATJ technology demonstrates a noticeably higher conversion
efficiency13 than silicon solar cells, obtaining a 23.6% compared to the 10.6% of the
silicon technology. While the ATJ curve has a more squared shape (sharp corner),
the silicon curve is rounder, what is reflected on a higher fill factor (FF) of the ATJ
technology.
13
The conversion efficiency parameter indicates the percentage of incident solar power
that the solar cell converts into electrical power.
43
5.1.2
I-V Curves during Different Times of the Day
The I-V curves presented in section 5.1.1 only reflect the performance of
the solar cells during a particular instant of the day. I-V curves vary significantly
during the day mainly because of variations in the sun radiation angle (cosine effect),
influence of the atmosphere (changes in the relative position of the earth respect to
the sun) and variations in solar cell temperature.
Varying curves during the testing day for the horizontal position are
shown in Figure 5.2. ATJ and silicon technologies maintain significant differences in
their electrical operating ranges. Variations of I-V curves along the day for each
individual technology are mainly observed in the current values, being the opencircuit voltage almost stationary along the day.
35
Time
Current Density [mA/cm2]
30
11:11
13:51
16:43
25
ATJ
Si
20
15
10
5
0
0
0.5
1
1.5
2
2.5
Voltage [V]
Figure 5.2: I-V curves of ATJ and silicon solar cells in horizontal position
during the testing day. Maximum power points are marked with an asterisk (*)
44
As stated above, an important cause for curve changes during the day is
the variation of the sun incident radiation angle, which is explained by the cosine
effect. This effect states that for a surface located on a fixed position on earth the
amount of incident sunrays will vary along the day due to variations of the exposed
area to the solar rays14. The maximum amount of incident radiation on the fixed
surface will occur when the incident sunrays strike perpendicular to the fixed
surface. This occurs because during these episodes the parallel incident sunrays
“see” the largest surface.
Changes during the day are also caused by the atmosphere, because the
path length of the incident radiation varies with the position of the sun. Normal
incident sunrays to the surface of the earth cross a smaller section of the atmosphere
resulting in less attenuation. Conversely, when the path of the sunrays is largest, the
attenuating effect of the atmosphere on the sunrays increases resulting in a lower
irradiance. These path length differences may also cause variations in the solar
spectrum, since the atmosphere can unequally filter certain wavelengths.
Furthermore, changes are also caused by variations in the temperature of
the solar cell. Varying I-V curves may be corrected by temperature to make
appropriate comparisons between experiments. Correction parameters are provided
by the manufacturer or can be determined by empirical analysis. Correction by
temperature is beyond the scope of this simplified analysis, but the expected
behavior is of a higher electrical performance with lower operating temperatures.
5.1.3
Sun-tracking system
Figure 5.3 illustrates I-V curves for both technologies, which was
obtained continually pointing the solar cells to the sun with the automatic sun-
14
This approach considers that all the incident light to the surface is due to direct
normal irradiance (beam irradiance), neglecting the influence of diffuse radiation (reflections of
scattering).
45
tracking system of the SCTU. During these experiments the cosine effect is cancelled
since the incident sunrays are normal to the solar cells at all times. Therefore,
observed changes along the day are attributed mainly by path variations of the
incident sunlight through the atmosphere and changes in the operating temperatures
of the solar cells. An important improvement in performance can be observed related
to Figure 5.2, specially during times of the day where the sun is far from the normal
position (when the cosine effect degradation is stronger).
35
Time
11:11
13:51
16:43
Current Density [mA/cm2]
30
25
ATJ
Si
20
15
10
5
0
0
0.5
1
1.5
2
2.5
Voltage [V]
Figure 5.3: I-V curves for the solar cells pointing to the sun along the day.
Maximum power points are marked by an asterisk (*)
5.1.4
Solar Spectrum Measurements
The spectrum of the incident radiation is crucial for the analysis of solar
cells. Solar cell performance is dependant on the presence of specific bands of the
spectrum, so its values are an important performance variable to consider in the
analysis.
46
The spectrophotometer used by the SCTU generates a text file with the
number of counts for each wavelength slot. This data must be corrected and
W
calibrated obtaining the power density versus wavelength and area (
). The
nm ⋅ m 2
device includes two channels, the Master Channel covering the UV and visible
ranges and the Slave channel covering the near-infrared segment.
Several spectral measurements were performed during the testing day.
Figure 5.4 shows two solar spectra measurements (corrected and calibrated) at
different times of the day in horizontal position. The obtained curve is similar to
theoretical expected values, observing the maximum power per wavelengths near the
maximum insolation episode. No important local differences besides amplitude can
be distinguished between measurements along the day.
Sun Light spectra at 13:51 PM vs 18:18 hours; horizontal position
5
4.5
Slave Channel
4
3.5
13:51 hours
W/nm*m2
3
Master Channel
2.5
2
1.5
18:18 hours
1
0.5
0
200
300
400
500
600
Wavelength nm
700
800
900
1000
Figure 5.4: Sunlight spectrum during different times of the day
47
5.2
Weather Reports
As earlier discussed, the SCTU generates daily weather plots from
sensors, logging the environmental temperature/humidity, wind speed/direction, and
total solar irradiance. This section shows automatically-generated plots with the
system installed in “Mina El Guanaco” in the Atacama desert (Chile) on October 18,
2004.
Obtained values are shown in Figure 5.5, Figure 5.6 and Figure 5.7. They
appear concordant to expected values (contour and magnitude) and lack of
significant noise. Therefore, these values are suitable for solar cell and
environmental characterization considering that the instruments have been calibrated
by the manufacturer.
Relative Humidity for Oct/08/2004
Temperature for Oct/08/2004
18
20
Relative Humidity (%)
Temperature (Deg C)
16
14
12
10
8
15
10
6
5
4
0
5
10
15
Hour
20
0
5
10
15
Hour
Figure 5.5: Temperature & Humidity weather plots
20
48
Wind Speed for Oct/08/2004
Polar plot of speed and direction of the wind: Oct/18/2004
90
60
10
150
8
6
30
180
0
4
330
210
2
300
240
270
0
5
10
Hour
15
20
Figure 5.6: Wind Speed & Direction weather plots
Insolation for Oct/08/2004
1000
800
Insolation (W/m²)
Wind Speed (m/s)
20
120
10
600
400
200
0
0
5
10
15
20
Hour
Figure 5.7: Solar Irradiance weather plot
49
6
CONCLUSIONS
This document has proposed solutions to address the difficulties of
performing experiments in isolation requiring external support. The proposed system
controls a solar cell testing unit that allows to characterize Advanced Triple Junction
(ATJ) n/p InGaP/InGaAs/Ge solar cells built for space applications on the earth, in
comparison to conventional silicon solar cell technologies. The proposed solution
allows to get a sets of data for solar cell characterization under a variety of external
conditions including results that are relevant for both, the electrical performance and
mechanical/weather requirements of the solar panels.
Two prototype versions of the system have been successfully tested
during field operations of the “Life in the Atacama” project of Carnegie Mellon
University in the Atacama desert in Chile. They have been operated for two
independent one-month periods with successful results. The final version of the
system has been tested in the area of Rancagua, Chile capturing relevant data for an
uninterrupted two-month period. The system has been completed to operate
uninterruptedly during the three-month long field operations of “Life in the
Atacama” during year 2005.
This document has intended to cover all technical details of the
implemented solution serving the purpose of a technical manual, but also has
intended to propose generic solutions to common problems of devices needing to
operate autonomously and unattended. The development of a power manager system
is proposed, providing hardware and software tools to minimize the power
consumption of experiments that are performed in isolation. Additionally, a generic
and expandable user-interface is proposed automating commonly user-required tasks
that allow to perform these actions without requiring additional hardware tools.
Future work in the system shown in this document is completely opened
to serve multiple purposes, from being just an autonomous weather station
incorporating additional relevant sensors (precipitation, barometric pressure and leaf
wetness, among others) to incorporating completely new child system using the
MASS to receive complete support.
50
REFERENCES
[Wett03] WETTERGREEN, D., CABROL, N., CALDERÓN, F., DEANS, M.,
JONAK, D. LÜDERS, A., SHAW, F., SMITH, T., TEZA, J., TOMPKINS,
P., URMSON, C., VERMA, V., WAGONNER, A., and WAGNER, M.
(2003) Life in the Atacama: Field Season 2003 Experiment Plans and
Technical Results. Robotics Institute, Carnegie Mellon University.
Technical Report CMU-RI-TR-03-50, October 2003.
[Mars99] MARSHALL, A.D. (1999) IPC: Message Queues:sys/msg.h. Retrieved
from http://www.cs.cf.ac.uk/Dave/C/node25.html on December 1 2004.
[Nasa04] NASA (2004) Overview of Spice. Navigation and Ancillary Information
Facility, NASA. Retrieved from ftp://naif.jpl.nasa.gov/pub/naif/
toolkit_docs/Tutorials/pdf/individual_docs/05_overview.pdf
on
March 1 2005.
[Hopk04] HOPKINS, S. (2004)
Diamond
Systems
Analog Input Interfacing Considerations.
Corporation.
Retrieved
from
http://www.diamondsystems.com/files/binaries/Analog_Interfacing_Co
nsiderations.PDF
on March 1 2005.
[Pana02] PANASONIC (2002) Valve-Regulated Lead Acid Batteries: Individual
Data Sheet. Panasonic Corporation.
[Diam03] DIAMOND (2003) Diamond MM-32-AT User Manual v2.64. Diamond
Systems Corporation.
[Conn04] CONNECT TECH (2004) Xtreme/104 User’s Manual revision 0.05.
Connect Tech Inc.
[Siem98] SIEMENS (1998) Solar Module SM55. Product data sheet, Siemens Solar
Industries.
[Morn01] MORNINGSTAR (2001) Prostar Solar Controller’s Operator’s
Manual. Morningstar Corporation.
51
[Micr01] MICROCHIP (2001) PIC16F87X Data Sheet. Microchip Technology
Inc.
[Texa01] TEXAS INSTRUMENTS (2001) PT5100 Series Data Sheet. Texas
Instruments Inc.
[Emco04] EMCORE (2004) Advanced Triple-Junction (ATJ) High Efficiency
Solar Cells for Space Applications Product Brief. Emcore
Photovoltaics.
[Siem94] SIEMENS (1994) High Efficiency Solar Electric Cells. Siemens Solar
Industries.
[Exec03] EXECUTIVE ENGINEERING (2003) EE30180A DC Electronic Load
300 Watt. Product Data Sheet and Installation Information, Executive
Engineering Inc.
[Direc00] DIRECTED PERCEPTION (2000) Computer Controlled Pan-Tilt Unit
Model PTU User’s Manual Version 1.14. Directed Perception Inc.
[Camp01] CAMPBELL SCIENTIFIC (2001) CR10X Measurement and Control
Module Operator’s Manual. Campbell Scientific Inc.
[Camp02] CAMPBELL SCIENTIFIC (2002) CM3 Pyranometer Instruction
Manual. Campbell Scientific Inc.
[Camp04] CAMPBELL SCIENTIFIC (2004) CS500 Temperature and Relative
Humidity Probe Instruction Manual. Campbell Scientific Inc.
[Camp05] CAMPBELL SCIENTIFIC (2005) Wind Speed and Direction Sensor
05103 Product Brochure. Campbell Scientific Inc.
[Cam004] CAMPBELL SCIENTIFIC (2004) 05103, 05106, and 05305 R.M.
Young Wind Monitors Instruction Manual. Campbell Scientific Inc.
52
[Teza03] TEZA, J. and WAGNER, M. (2003) Insolation of the Atacama Desert. Life
in the Atacama Project Workshop Presentations, July 28, Carnegie
Mellon University, Pittsburgh, United States of America.
[Sypr03] SYPRIS TEST AND MEASUREMENT (2003) F.W. Bell NT Series
Magneto-Resistive Current Sensors for Peak Currents up to 150A.
Sypris Test and Measurement Inc.
[Opto204] OPTO 22 (2004) G4 Digital DC Output Data Sheet, Opto 22 Inc.
[Gray05] GRAYHILL
Grayhill Inc.
(2005) Grayhill Output Modules. Product Brochure,
[Icpd04] ICP DAS (2004) I-7017, I-7018, I-7019, M-7017, M-7018 and M-7019
Series User’s Manual revision B1.3. ICP DAS Inc.
[Tyco03] TYCO (2003) KU Series P&B Catalog 1308242, Tyco Electronics.
[Newm95] NEWMARCH, J. (1995) Inter-Process Communication – Unix API.
Retrieved from http://pandonia.canberra.edu.au/OS/l9_1.html on
December 1 2004.
[Cani02] CANISIUS COLLEGE (2002) Interprocess communication in UNIX.
Computer Science Department, Canisius College. Retrieved from
http://www-cs.canisius.edu/PL_TUTORIALS/C/ADVANCED/ipc on December
1 2004.
[Cani85] CANISIUS COLLEGE (1985) Concurrent Programming in C Under the
UNIX Operating System. Computer Science Department, Canisius
College. Retrieved from http://www-cs.canisius.edu/ PL_TUTORIALS/
C/ADVANCED/ipc
on December 1 2004.
[Kort04] KORTESMAA, T. (2004) Multi-Process Programming and InterProcess
Communications
(IPC).
Retrieved
from
http://users.evitech.fi/~tk/rtp/multi-process.html on December 1
2004.
53
54
APPENDIXES
D
C
B
A
3
T3
T2
R10
V Adj. Ref
10K
1
DB4
DB6
Contrast
R/W
2
4
6
8
10
12
14
16
VCC
DB5
DB7
RS
VCC
R8
10K
TIP31C
Q1
LCD Header
1
3
5
7
9
11
13
15
JP2
C10
220uF
V+2
24 V REF
24 V REF
R5
Display Contrast
10K
VCC
U5
LM336Z5.0
R9
Res1
5K
V+3
IGND
1
IN
U3
VCC
Enable
R6
RPot1
100K
C13
100pF
3
2
12
31
33
34
35
36
37
38
39
40
2
3
4
5
6
7
13
1
5k
PIC16F877A
VSS
VSS
RB0/INT
RB1
RB2
RB3
RB4
RB5
RB6
RB7
1
IN
U4
Y1
VDD
VDD
C2
Cap
15pF
OSC2/CLKO
1
3
RE0/RD/AN5
RE1/WR/AN6
RE2/CS/AN7
RD0/PSP0
RD1/PSP1
RD2/PSP2
RD3/PSP3
RD4/PSP4
RD5/PSP5
RD6/PSP6
RD7/PSP7
RC0/T1OSI/T1CKI
RC1/T1OSI/CCP2
RC2/CCP1
RC3/SCK/SCL
RC4/SDI/SDA
RC5/SDO
RC6/TX/CK
RC7/RX/DT
C1 XTAL
Cap
15pF
2
3
PT5101 5V
OUT
GND
3
Datalogger Power 12 V
2
1
JP6
RA0/AN0
RA1/AN1
RA2/AN2
RA3/AN3/VREF
RA4/T0CKI
RA5/SS/AN4
OSC1/CLKI
MCLR/VPP
U1
120uF
C11
V+1
Backlight ON/OFF signal
SW-PB
S1
R7
PT5102 12V
OUT
GND
2
Voltage Divider
Battery Voltage
1
T8
T7
2
Battery In 24 V
2
1
2
1
2
8
9
10
19
20
21
22
27
28
29
30
15
16
17
18
23
24
25
26
14
VCC
11
32
C3
33pF
1uF
C5
VCC
120uF
C12
1
XTAL
Y2
1uF
C6
2
4
C4
33pF
4
Figure A.1: Schematic of Power Manager / User-interface Board
VCC
VEE
R1IN
R2IN
T1OUT
T2OUT
VDD
VCC
Date:
File:
B
Size
Title
1uF
C7
C9
1uF
1
6
2
7
3
8
4
9
5
Number
VCC
Keys Header
1
2
3
4
5
JP1
C8
1uF
VCC
Header 5
2
1
JP5
Serial
J3
10
11
5
4/6/2005
Sheet of
C:\Documents and Settings\..\Power Manager.SCHDOC
Drawn By:
Esc Key
Left Key
Enter Key
Right Key
6
13
8
14
7
2
16
G4 Opto-Relay 2 A
MAX232
GND
R1OUT
R2OUT
T1IN
T2IN
C1+
C1C2+
C2-
Power Manager and LCD Display Schemtics
5K
R4
5K
R3
5K
R2
5K
R1
15
12
9
11
10
1
3
4
5
U2
5
RS-232 O ut
6
Revision
6
D
C
B
A
A.1
RS-232 In
JP4
55
APPENDIX A ELECTRICAL DESIGN AND DETAIL OF DEVICES USED
IN THE MASS
Schematic of Power Manager / User-interface Board
56
A.2
Connectors in Power Manager / User-interface Board
Keypad
connector
RS/232
Interface
(to PC)
12V Output
PC-relay
control
Battery input
(24V)
LCD
screen
contrast
adjust
Voltage
Reference
adjust
LCD
screen
backlight
adjust
Battery
voltage
divider
adjust
Reset
LCD
screen
connector
Figure A.2: Interface connectors in Power Manager / User-interface Board
A.3
Microcontroller: Battery Voltage Measuring System
The Power Manager system uses the analog to digital converter from the
PIC microcontroller to read the battery voltage value, as described in the main
section of this document. The PC shutdowns itself if the read voltage decreases
below a threshold defined by the user. The microcontroller reads a raw voltage value
between 0 and 10241, value which is proportional to the input voltage. The value in
1
The analog to digital conversion is based on 10 bits. Therefore, 2
levels can be read by the microcontroller.
10
= 1024 discrete
57
volts can be determined knowing the exact voltage of the Zener-reference (adjustable
using a potentiometer on the power manager board) and the resistor values of the
voltage divider (used to match the battery voltage to the voltage operation levels of
the microcontroller).
The core process of the MASS in the main computer reads the raw
voltage value obtained by the microcontroller and converts it to volts. The value in
volts in retransmitted back to the microcontroller as text (according to the protocol
shown in Appendix F) to be shown to the user on the LCD display. Although this
system reduces processing requirements to the microcontroller, the user-interface is
not able to show a value in volts when the system loses the processing power of the
main computer of the MASS (night operations and low battery-voltage operations).
As an alternative, during these operation conditions the user-interface shows the rawvoltage value on the user screen in the format “X/1024”, where X is the raw voltage.
During night operations and low-voltage battery conditions the system is assumed to
be unmonitored and battery voltage should not be needed by the user on regular
operations. Anyway, during these conditions the user can alternatively read the
battery-voltage from the included display of the solar controller.
58
A.4
Commercial Hardware used in the MASS System
Table A.1: Commercial hardware used in the MASS
Block
Device
Main Characteristics
Batteries
2 x Panasonic valve-regulated
lead acid batteries
Nominal voltage: 12V (each)
Model: LC-X1220P
PC/104 stack
Nominal voltage: 20Ah (each)
Note: both batteries are connected in series in
the MASS
Main CPU Board:
Pentium III Processor
Kontron model MOPSlcd7
256Mb RAM
2 serial ports
1 parallel port
USB
10/100 Base-TX Ethernet
Onboard VGA interface
Analog/Digital –
Digital/Analog Board:
Analog Inputs:
Diamond Model MM-32-AT
32 single-ended, 16 differential or
16SE+8DI
o Current configuration: 32
single-ended inputs
16 bits A/D resolution
Bipolar or unipolar, ±10V
maximum detectable input, several
input ranges
Maximum recommended
impedance to input: 200Ω
Analog Outputs: 4 channels, 12 bitresolution, several ranges available
(maximum output: 10V)
Digital I/O: 24 programmable I/O
Other features: 2x 32-bit down counter,
1x 16-bit down counter, Clock: 10Mhz
(internal) or external input
Serial Board:
Connect Tech Inc Xtreme/104
Board provides 8 additional serial ports.
RS/232 and RS/422 (or RS/485)
interfaces are available (jumperselectable)
59
Power Board
50W output
TRI-M Model HE104
6V to 40V Input Range
5V, 12V, -12V regulated output
Hard Drive:
Hitachi Travelstar 40GB
Model: IC25N040ATCS05-0
Solar Panels for
Power
2 x Siemens SM55 solar
modules
36 single-crystalline Silicon solar cells
per panel
Weatherproof
Maximum Power Rating: 55W (AM1.5,
1000W/m^2)
Short Circuit Current: 3.45A
Open-circuit voltage: 21.7V
Bypass diodes for shading conditions
Dimensions:
1293 x 329 mm
Solar Controller
Morningstar Corporation
Prostar 15
Charges batteries obtaining energy
from solar panels
Uses PWM techniques to operate
solar panels in their maximum
power point
Supports different ranges of
batteries and voltages
100% solid state
Remote battery sense terminals
Several electronic protections:
short circuit, overload, reverse
current at night, high voltage
disconnect, high temperature
disconnect, lighting and transient
surge protection, among others
LCD display and LED to show
status, voltages and faults
60
A.5
Main Electronic components used in the Power Manager / Userinterface Board
Table A.2: Electronic components used in the Power Manager / Userinterface board
Block
Device
Main Characteristics
Microcontroller
PIC16F877
High performance RISC CPU,
CMOS-FLASH-based 8-bit
microcontroller
256 Bytes of EEPROM data
memory; 368 bytes of data
memory (RAM)
8 channels of 10-bit Analog-toDigital (A/D) converter
Interrupt capabilities
Universal Synchronous
Asynchronous Receiver
Transmitter (USART/SCI) with
9-bit address detection
2 additional timers
User display
DMC-16202NY-LY-AGE
LCD Display 16x2 with
Backlight
User keypad
Storm GS040203
4-key keypad
Polymer casing keytops with
configurable keytop graphics
Voltage
Regulation
Texas Instruments PT5101 (5V) and
PT5102 (12V)
1-A Positive Step-down
Integrated Switching Regulator
90%+ efficiency
Laser-trimmed output voltage
Output current limiting
Thermal shutdown protection
Input voltage range:
9-38V (PT5101)
16-38V (PT5102)
Output current: 0.1 – 1A
61
APPENDIX B ELECTRICAL DESIGN AND DETAIL OF DEVICES OF
THE SCTU SYSTEM
B.1
General Schematic of the Solar Cell Testing Unit (SCTU)
1
2
3
4
5
6
JP4
Input from
D/A board
+
2
1
3
+12V
B
2
1
JP2 Control Signal
U1
Input
D1
-
10
2
20
C2
Load Control
3/4 A
3/4 A
JP1
F4
+12V
500-3000uF
4
+5V
A
1
2
Variable Load
A
F5
ATJ solar cells
Common Ground
Silicon solar cells
1
2
3
B
Solar Cell Sets Input
5
Current Sensor
K1
Iin
1 2 3 4 5
Iout
JP3
+12V
C
-12V
1
2
C
Current Output
Title
Size
Number
Revision
B
D
Date:
File:
1
2
3
D
4/17/2005
Sheet of
C:\Documents and Settings\..\variable load schematic
Drawn(only
By: for document printing).SCHDOC
4
5
6
Figure B.3: Schematic of the SCTU system
Figure B.3 shows the schematic used to control the electronic-controlled
variable load from the MASS. The diagram does not include details of the voltage
monitoring signals, which connect directly to the analog to digital converter of the
MASS in the case of the silicon solar cells, and through the signal conditioner board
(shown in Figure B.7) in the case of ATJ solar cells.
Different components shown in Figure B.3 are distributed between the
primary and secondary electronic enclosures. The electronic-controlled variable load,
current sensor and switching relay are located in the secondary electronics enclosure
in order to maintain cables connecting the testing solar cells and variable load the
62
shortest possible. The opto- isolator and voltage and current monitor signals are
located in the main electronic enclosure interfacing with the MASS.
B.2
Connectors in Signal Conditioner Board
Power
Input
ATJ voltagemonitoring
signals
Output
Signals
Figure B.4: Main connector in Signal Conditioner Board
B.3
Interconnection of Solar Cells for Testing
The ATJ solar cell set is built interconnecting in series fifteen Emcore
Advanced Triple Junction solar cells. The solar panel is arranged in three rows of
five solar cells each. Each row of solar cells provides a voltage output to monitor the
voltage of each individual row. The three voltage outputs are logged by the SCTU
system through the analog to digital board of the main computer of the MASS.
Figure B.5 shows the connection scheme of the ATJ solar cell set.
The silicon solar cell set is built interconnecting in series three Siemens
single-crystal silicon solar cells. Each individual solar cells provides an output to
monitor the voltage of the individual cell. The three voltage outputs are logged by
63
the SCTU system through the analog to digital board of the main computer of the
MASS. Figure B.6 shows the connection scheme of the silicon solar cell set.
Voltage
Monitoring
Signals
Power
Signal
Figure B.5: Connection scheme of ATJ solar cell set used in the SCTU system
Power
Signal
Voltage
Monitoring
Signals
Figure B.6: Connection scheme of silicon solar cell set used in the SCTU
system
Figure B.7: Schematic of Signal Conditioner Board
D
C
B
A
1
-12
+12
Header 5
1
2
3
4
5
JP1
Res1
10K
R2
C1
Cap
3.3uF
R1
Res1
1K
5
6
3
2
2
2
A
8
-12
4
B
8
-12
4
+12
+12
7
1
U1B
TL062P
U1A
TL062P
JP3
R10
Res1
178k
R8
Res1
464k
JP2
P1-2
R9
Res1
750k
P1
R7
Res1
750k
Header 4
1
2
3
4
Header 5
3
3
R12
Res1
124k
P1-3
R11
Res1
845k
1
2
3
4
5
-12
B
4
U2B
TL062P
U2A
TL062P
5
Date:
File:
B
Size
Title
Res1
10K
7
1
R6
-12
+12
+12
5
Res1
10K
5
6
A
4
R4
C2
Cap
3.3uF
R3
Res1
1K
3
2
8
4
8
4
5
6
A
-12
B
-12
+12
+12
7
1
U3B
TL062P
U3A
TL062P
6
Revision
6
4/10/2005
Sheet of
C:\Documents and Settings\..\Buffer y filtro de Drawn
voltajes.SCHDOC
By:
Number
C3
Cap
3.3uF
R5
Res1
1K
3
2
8
4
8
4
D
C
B
A
B.4
1
64
Schematic of Signal Conditioner Board
65
B.5
Commercial Hardware used in the SCTU System
Table B.3: Commercial hardware used in the SCTU system
Block
Device
Main Characteristics
ATJ Solar cell set
15x Emcore Advanced Triple Junction
Solar Cells for Space Applications,
connected in series in a single solar
panel
InGaP / InGaAs / Ge Solar Cells
with n-on-p polarity on 140-µm
Uniform Thickness Ge Substrate
Silicon Solar cell set
Variable Load
3x Siemens 103mm standard single
crystal silicon solar cells, connected in
series in a single solar panel
Executive Engineering EE30180A DC
Electronic Load
Fully space-qualified with
proven flight heritage in LEO
and GEO environments
Electrical Parameters at AM0
(1353W/M^2 at 28ºC):
Voc: 2.60V
Jsc: 17.1mA/cm2
Vmp: 2.30
Jmp: 16.2mA/cm2
BOL efficiency at maximum
power point: 27.5%
Square silicon single crystal
solar cell grown by the
Czochralski method
Electrical Parameters at Standard
Test Conditions (1000W/m2,
25ºC and AM1.5):
Voc: 0.585V
Icc: 3.46A
Adjustable and selectable quasi
constant power / constant current
mode
Thermal and over power
protection
Input Voltage: 0 -55V
Input current (adjustable): 0-80
Amperes
Maximum Power dissipation:
300 Watts
66
Pan/tilt unit
Directed Perception Pan-Tilt Unit
Model PTU-C46-70
Computer-controlled (RS/232
port)
Self calibration upon reset
Power consumption can be
controlled from host
ASCII and binary command
modes available
DC input from unregulated
source
Constant current bipolar motor
drives
On-the-fly position and speed
changes
Pan: 300 degrees of freedom
Tilt: 46 degrees of freedom
(bottom), 31 degrees of freedom
(top)
Temperature logger
ICP DAS Model CON I-7018
RS/485 interface
Voltage, current and
thermocouple input
Thermocouple: Type J, K, T, E,
R, S, B, N, C
Channels : 8 differential or 6
differential and 2 single-ended
by jumper select
Accuracy: ±0.1%
Sampling rate: 10
Samples/Second
Power Consumption: 1W
67
General- purpose data
logger
Campbell Scientific CR10X
Electrical Interfaces:
Analog Inputs: 12 single-
ended or 6 differential
(individually configured)
Analog Outputs: 3 switched,
active only during
measurement
2 Pulse counters
3 Switched voltage
excitations
8 control/ digital ports
1 Serial I/O port
64Hz Scan rate
13 A/D bits
Stores 62000 data points (nonvolatile)
32 kilobytes available to run
programs
Electrical characteristics
Input voltage: 9.6 to 16V
Current drain (typical):
Pyranometer
Kipp and Zonen CM3
1.3mA quiescent, 13mA
during processing and 46mA
during analog measurement
Thermopile pyranometer
Measurement range: 305 to
2800nm
Maximum irradiance: 2000W/m2
Signal output: 0-50mV
Flat spectral response of the full
solar spectrum range
Temperature and
Relative Humidity
Sensor
Campbell Scientific CS500-L
Contains a Platinum Resistance
Temperature detector (PRT) and
a Vaisala INTERCAP®
capacitive relative humidity
sensor
Temperature measurement
range: -40º to 60ºC
Temperature Output signal: 0 to
1V
Relative Humidity measurement
range: 0 to100%
68
Wind Monitor
R.M. Young 05103
Measures wind speed and
direction
Wind speed range: 0-60m/s
(±0.3m/s accuracy)
Wind speed range: 0-360º
mechanical, 355º electrical (±3º
accuracy)
Power: switched excitation
provided by the data logger
Spectrophotometer
Ocean Optics SD2000
Two independent channels
(master and slave)
Spectral Range: 200 to 850nm
(master channel); 520-1100nm
(slave channel)
Cosine corrector disks both
channels
69
B.6
Main Electronic Components used in the SCTU System
Table B.4: Main electronic components used in the SCTU system
Block
Device
Main Characteristics
Current Sensor
F.W. Bell NT-5
Primary nominal current (Ipn):
5A
Measurement Range: 0 to ±15A
(for 3 seconds)
Output voltage at ±Ipn: ±2.5V
Linearity: < ±0.25%
Opto-relays
2x Grayhill 70G-ODC5
4000Vrms optical-isolation
5Vdc logic
(for control of PC
power and PTU
power)
3-60Vdc output
Current rating (at 45ºC): 3A
PC-controlled optorelay (solar cells)
Opto 22 Model G4ODC5
4000Vrms optical-isolation
5Vdc logic
5-60Vdc output
Current rating (at 45ºC): 3A
Switching Relay
Potter & Brumfield KUP-14D15-12
Basic enclosed relay
3C (3PDT) contact arrangement
12VDC coil input
10 Amps max
Operational
Amplifiers
3x ST Microelectronics TL062N
2 JFET-input operational
amplifiers per unit
Wide common-mode and
differential voltage ranges
Output short-circuit protection
Slew Rate: 3.5V/µs (typ)
These operational amplifiers are
used in the signal conditioner
board, implementing a voltage
follower in series with an active
low-pass filter in each unit
70
APPENDIX C CONNECTIONS OF MASS / SCTU FOR ASSEMBLY IN
THE FIELD
Table C.5 shows the cable connections needed in the main enclosure
when installing the system in the field. Several cables enter the primary enclosure
which are connected in one of the three connection locations available in the
enclosure.
Table C.5: Main connections in the main enclosure to install the MASS /
SCTU system in the field
Cable 0: Power Solar Panel 1 cable
Cable 1: Power Solar Panel 2 cable
Cable 2: Battery Cable
Cable 3: From secondary enclosure
Cable 4: From temperature logger
Cable 5: From silicon solar panel (voltage
monitoring)
Cable 6: From ATJ solar panel (voltage
monitoring)
Cable 7: Cable from pyranometer
Cable 8: Cable from anemometer
Cable 9: Cable from temperature and humidity
sensor
Cable
Wire (in
Cable)
0123456789
Connects to:
(in primary
enclosure)
Connection Location A: Wire connects in
terminal block rack
Connection Location B: Wire connects in signal
conditioner board
Connection Location C: Wire connects in
general-purpose data logger
Connection
location
A
B
C
Final electrical
Connection in MASS or
SCTU hardware (*)
X
+
1
X
Solar Controller: +
X
-
2
X
Power Solar Panel 2: +
(series connection)
X
+
3
X
Power Solar Panel 1: (series connection)
X
-
4
X
Solar Controller: -
X
-
6
X
Solar Controller: Battery
- and power manager
board
X
+
7
X
Solar Controller: Batter +
and power manager board
Relay +
X
Switching relay in SCTU:
+ (coil)
X
red
71
X
Brown
Relay -
X
Switching relay in SCTU:
- (coil)
X
white
Analog Output
Vo0
X
Electronic-controlled
variable load: control
signal
X
green
Analog Input 0
X
Current sensor: output
signal
X
blue
Analog Input 1
X
Electronic-controlled
variable load: internal
current sensor output (not
used)
X
Black
G
X
Ground for secondary
enclosure
X
yellow
12V
X
12V for secondary
enclosure
X
orange
-12V
X
-12V for secondary
enclosure
X
green
ICP Logger
(green)
X
Temperature transmitter:
data -
X
yellow
ICP Logger
(yellow)
X
Temperature transmitter:
data +
X
red
ICP Logger (red)
X
Temperature transmitter:
+Vs
X
black
ICP Logger
(black)
X
Temperature data
transmitter: Gnd
X
Green +
black3
Analog Input 5
X
Voltage monitoring signal
in solar panel
X
White +
black5
Analog Input 6
X
Voltage monitoring signal
in solar panel
X
red
Analog Input 7
X
Voltage monitoring signal
in solar panel
X
black1
Analog Ground
X
Voltage monitoring
ground in solar panel
X
black1
1
X
Voltage monitoring
ground in solar panel
X
red
2
X
Voltage monitoring signal
in solar panel
X
white +
black5
3
X
Voltage monitoring signal
in solar panel
X
green +
black3
4
X
Voltage monitoring signal
in solar panel
clear
G
X
X
72
X
red
1H
X
X
blue
1L
X
X
white
AG
X
X
clear
G
X
X
black
G
X
X
red
P1
X
X
blue
E1
X
X
white
AG
X
X
green
2H
X
X clear
G
X
X black
3H
X
X red
12V
X
X green
AG
X
X brown
2L
X
(*) Shows the final internal wiring destination of the terminal block connection. Connections such as A/D
and D/A interface may be easily changed by modifying the programming code. Values are shown as a
reference and are current on the publication date.
Table C.6: Main connections in the main enclosure to install the MASS /
SCTU system in the field
Terminal #
Connection
4
ATJ Power: red (V+)
5
ATJ Power: white (V-)
6
Silicon Power: red (V+)
7
Silicon Power: white (V-)
8
Signals: red (+ coil)
9
Signals: brown (- coil)
10
Signals: blue (variable load current signal)
11
Signals: white (variable load control)
12
Signals: green (current sensor signal)
13
Signals: yellow (12V)
14
Signals: orange (-12V)
15
Signals: black (logic ground)
73
Table C.6 shows the cable connections needed in the secondary
enclosure when installing the SCTU system in the field. Three cables enter the
secondary enclosure, named as “ATJ Power” (power signal from ATJ solar cell set),
“Silicon Power” (power signal from silicon solar cell set) and “Signals” (signals and
power for/from the main enclosure).
74
APPENDIX D DETAILED PIN OUT OF MASS / SCTU SYSTEMS
The following tables shows every connection between devices in the
complete MASS / SCTU system. These tables are provided for reference purposes
only and should not be changed for regular operations, unless a severe electronic
redesign is being made or for fault detection.
D.1
Terminal blocks rack in the main enclosure
All cables connected to individual blocks are shown below.
Table D.7: Connected devices per terminal blocks in main enclosure
Block Number
1
2
3
4
5
6
7
8
RELAY +
RELAY -
ICP Logger Green
ICP Logger
Yellow
ICP Logger Red
Detail of Connected Devices
+ Solar Panel 1 (Power Supply)
Solar + (Solar Charger)
- Solar Panel 1 (Power Supply)
Terminal Block 3
+ Solar Panel 2 (Power Supply)
Terminal Block 2
- Solar Panel 2 (Power Supply)
Solar – (Solar Charger)
GND for Power Manager Card
Battery – (Solar Charger)
Terminal Block 6
Battery Terminal Block 5
Battery +
Terminal Block 8
+24V for Power Manager Card
Battery + (Solar Charger)
Terminal Block 7
To Solar Experiment: + connection of switching relay
(Solar Panel Chooser) (red)
SS-Relay Rack Opto-22: Field Connection 7
To Solar Experiment: - connection of switching relay
(Solar Panel Chooser) (brown)
Terminal Block B or C
RS232/RS485 Converter – TD(A)
Temperature Logger – “DATA –“
RS232/RS485 Converter – TD(B)
Temperature Logger – “DATA +”
Terminal Block 12V
Temperature Logger – “+Vs”
75
ICP Logger Black
Terminal Block B or C
Temperature Logger – “GND”
G
Terminal B or C, equivalent to GND from Solar Charger
Black from main cable from solar experiment
5V available from Power Supply Card – PC /104
12V available from Power Supply Card – PC /104
Yellow from main cable from solar experiment
-12V available from Power Supply Card – PC /104
Orange from main cable from solar experiment
5V
12V
-12V
Digital Output
DO0 / Channel A
Opto Isolator – Field side, Pin #7
Analog Channel
Output Vo0
Solar Experiment Main Cable (White) (Control Signal for the Variable
Load)
Analog Channel
Input 0
Solar Experiment Main Cable (Green) (Input From External Current
Sensor)
Analog Channel
Input 1
Solar Experiment Main Cable (Blue) (Input from Variable Load's Internal
Sensor)
Analog Channel
Input 2
Red Cable from Signal Conditioner Card (Voltage reading of Panel 1 of
ATJ panels)
Analog Channel
Input 3
Green Cable from Signal Conditioner Card (Voltage reading of Panel 1+2
of ATJ panels)
Analog Channel
Input 4
Yellow Cable from Signal Conditioner Card (Voltage reading of Panel 1 of
ATJ panels)
Analog Channel
Input 5
Silicon Panel Signal Cable: Green+Black 3
Analog Channel
Input 6
Silicon Panel Signal Cable: White+Black 5
Analog Channel
Input 7
Silicon Panel Signal Cable: Red
Analog Ground
Silicon Panel Signal Cable: Black 1
G
Note: Details marked in BOLD are connections that have to be made recurrently, each time the Solar
Station is installed. Details not in bold, are permanently connected and should remain untouched, unless
the weather station is disassembled completely.
76
D.2
Connections in Solar Controller
Table D.8: Cable connections in solar controller
D.3
From
To
Load -
Terminal Block B or C
Load +
Terminal Block A
Solar +
Terminal Block 1
Solar -
Terminal Block 4
Battery +
Terminal Block 8
Battery -
Terminal Block 5
Sense +
Short Circuit to Battery +
Sense -
Short Circuit to Battery -
Connections in current measuring board (secondary enclosure)
Table D.9: cable connection in current sensor board
Pin #
Connection
1
I Sensor - Iout
2
I Sensor - Iin
3
Output I sensor
4
Ground
5
-12V
6
12V
77
D.4
Connections in Signal Conditioner Board
Table D.10: Cable connections in signal conditioner board
ATJ voltage
monitoring cable
D.5
Connects
to:
black 1
1
red
2
white + black 5
3
green + black 3
4
Connections in terminal blocks rack in the secondary enclosure
Table D.11: Cable connections in terminal blocks of the secondary
enclosure
Pin # Connection
1
NC
2
NC
3
NC
4
V+ ATJ Panels
5
Common V- for ATJ & Si Panels
6
V+ Si Panels
7
Common V- for ATJ & Si Panels
8
Relay - Control V+ (Coil)
9
Relay - Control V- (Coil) (Brown)
10
Output from internal I sensor included
(Red)
in Variable Load (Blue)
11
Control Signal for Variable Load (White)
12
Output from external I sensor (Green)
13
12V (Yellow)
14
-12V (Orange)
15
Logical Ground (Black)
78
D.6
Connection of opto-relays in main enclosure
The three opto- relays located in the main enclosure (PC power, PTU
power and solar panel control) are installed in a 4-channel I/O module rack. Figure
D.8 shows the connection scheme of interface with the rest of the system.
“24V”
from Solar
Charger
“12V”
from PC/104
24V PWR
to PC/104 (3-2/10A)
24V PWR
to PTU (1A)
“Bypass” switch
Control from D
Digital Channel A (bit 0)
“5 V in”
from Power
Manager
“PC Control”
from PIC
12V PWR
to RELAY
Solar Exp.
Control from D
Digital Channel A (bit 4)
5V
from AD/DA
Figure D.8: Cable connections of the three opto-relays of the system mounted
in a 4-channel I/O module rack
79
D.7
Connection of solar cell testing sets
ATJ Set
red
black 3
+green
Voltage
Monitoring
Signals
Power
Signal
black 5
+white
+ red
- white
+
Power
Signal
-
red
black 1
Silicon Set
white
red
black 5 + white
black 3 + green
black 1
Voltage
Monitoring
Signals
Figure D.9: Cable color code of ATJ and silicon solar cell sets
80
APPENDIX E
E.1
SOFTWARE-SPECIFIC DETAILS
General Information about the processes
The central computer of the system runs the MASS and SCTU processes
under Redhat 7.3. The complete programming code of the software can be located in
the hard drive at the following location:
/home/mwagner/atacama/src/solarStation/
Code related to the MASS (user interface and power manager systems)
can be found in the PIC subdirectory.
The system runs two concurrent processes, called “pwrmngd” (MASS
process) and “solarStation” (SCTU process). Only the MASS process needs to be
executed, automatically running the “child” SCTU child process by forking
procedures of Linux. On the current setup the pwrmngd process is executed
automatically on bootup by the rc.local file. Manual execution may be performed
executing the following command:
/usr/sbin/pwrmngd2
E.2
Generated Data Files
The SCTU process generates several data files which are stored at the
following location:
/data/weatherStation/
2
execution.
In case of recompilation the pwrmngd file must be generated by a “make install”
81
Three subdirectories are available which store data on a daily basis:
- dailyLogs/: stores tabulated weather text data files that can be directly imported to
Matlab or Octave.
- SolarPanels/: stores tabulated solar cell data from the SCTU, which can be directly
imported to Matlab or Octave. Files are stored in the Automatic.Data or in the
Manual.Data subdirectories, depending if they were automatically generated or
using the auxiliary process for manual control, respectively. All data captured on a
single day is stored in a subdirectory containing the date in its name.
- dailyPlots/: stores Octave-executable scripts that automatically generate
frequently-required plots (weather, I-V curves, etc). Plots are generated once all
the weather data for a single day has been captured.
The /data/weatherStation/directory additionally contains two
files. The usergnted.m contains a filtered data set which was manually generated
by the user after executing the appropriate option onh the user interface system. The
workLog.dat file is a temporary file that stores weather data for the last ten days
(older data is automatically removed). The workLog.dat file is internally used by
the system for automatically filtering data (e.g. generation of usergnted.m), but
may also be used by the user for simplifying manual multiple-day data processing
procedures.
E.3
Weather Data
Weather log data is written on a single daily-file with the following
format:
101
102
103
E.4
(year)
(year)
(year)
(day of year)
(day of year)
(day of year)
(Unix time)
(Unix time)
(Unix time)
(insol, W/m2) (tot.energy, kJ), 0, 0
(wind, m/s) (wind, m/s), (wind_d1), (wind_d2)
(temp, ºC) (humidity, %), 0, 0
Solar Cell Data
Solar cell data files include relevant information in the filename for file
ordering. The file format is the following:
nº-type-position-time.log
82
- nº: increasing sequential number indicating the experiment of the day.
- type: defines the solar panel used for the experiment (“ATJ” or “Si”).
- position: indicates the desired orientation of the solar cells in the format of a
sequential position number defined in the programming code. May be “i0”, “i1”, ….
“in” (predefined positions) or “iSun” (sun-oriented).
- time: time of the day in HH.MM format
Additionally, relevant parameters related to the execution of the
experiment are included as a header in the text file. Captured data is preceded by a
“%” sign (ignored comments for Matlab / Octave). Parameters include the real
orientation of the solar cells, desired orientation in degrees and settle measuring
time, among other relevant factors.
Captured data is logged with the following format:
(current[A])
(voltage 1 [V])
(voltage 2 [V])
(voltage 3 [V])
(temp1[ºC]) (temp2[ºC])
“Voltage x” corresponds to the different voltage measuring signals in
increasing voltage order, being “v3” the voltage across all the solar cells connected
in series (see Appendix D.7). “Temp x” corresponds to the temperature of the two
thermocouples in the solar cell set.
Furthermore, the last row in the data file includes the global irradiance in
W/m^2 measured during the execution of the experiment. The parameter is repeated
in the six different columns to help data processing.
E.5
Main programming code files
The main programming code files written specifically for the MASS /
SCTU are discussed below. General-purpose libraries used in the system are omitted.
- dataLogger {.h, .cc}: includes all functions that interact with the general-
purpose data logger. Includes functions to download data, read current weather, read
current date (time server) and for weather log file generation. The
83
writeDataLogger(FILE *logFile) function must be modified to change the
format of output weather logs.
- panelTest {.h, .c}: contains functions related to the AD/DA board and
temperature transmitter, including functions to read the A/D, write the D/A, write the
digital output and read the thermocouple inputs. All these functions are used in
readPanel.cc.
- pwrcomm {.h, .c}: contains all definitions and functions needed to achieve interprocess communication (IPC messages), used by the SCTU (solarStation) process.
- readPanel {.h, .cc}: contains all constants and functions needed to capture the
electrical data related with the solar cell testing experiment. It controls the variable
load, captures current and voltage data and generates log files. The
writePanelData(FILE *logFile, RADIANS ptuPan, RADIANS
ptuTilt) must be modified in order to change the format of output weather logs.
The .h file contains important definitions related to settle times, voltage divider
scaling factors, calibration factors for current measurement and operation range of the
variable load for each set of solar cells.
- solarStation.cc: contains the main function of the SCTU (solarStation) and
NASA SPICE related-functions needed to track the sun.
- solarStationPTU {.h, .cc}3: defines the SolarStationPTU class, which
encapsulates the functionality of the Directed Perception PTU-46-70, on which the
testing solar cell sets and spectrophotometer are mounted.
- weatherStationSerialPorts.h: defines serial ports used by MASS/SCTU
systems.
- PIC/src/prococol
{.h,
.cc}: contains functions related with the
communication protocol between the MASS (pwrmngd process) and the PIC
microcontroller. It includes functions called on a recurrent-basis, including the
connection procedure, reading values stored in the EEPROM memory of the
3
Code written by Michael Wagner, Senior Research Programmer from the Robotics
Institute of Carnegie Mellon University, member of the Life in the Atacama team.
84
microcontroller, checking user-generated commands, checking battery voltage,
checking current time related to the power-off schedule and performing shutdown
procedures.
- PIC/src/pwrcomm {.h, .c}: contains all definitions and functions needed to
achieve inter-process communication (IPC messages) used by the MASS (pwrmngd)
process.
- PIC/src/pwrmngd {.h, .c}: contains the main function of the MASS
(pwrmngd) process. It executes the SCTU (solarStation) process by fork procedures
of Linux and implements the complete communication protocol with the PIC
microcontroller.
- PIC/src/solarControl.c: contains all functions needed for the manual operation
of the solar experiment. Compilation generates an independent executable file in the
PIC/bin subdirectory, which allows the user to orient the solar panels and perform
the solar experiment through a prompt (automatic execution is suspended). The
generated program does not access the hardware directly, instead it generates IPC
messages, indirectly performing actions in the solarStation process.
E.6
About Log Files and Time Management
The general-purpose data logger permanently logs weather data in its
internal memory, adding a timestamp of its internal clock. When the PC is online all
information stored in the data logger is transferred to the computer. When
transferring the data, the computer is unable to determine in terms of its internal PC
clock the exact time when the data was generated due to inexistent synchronization
between clocks. Exact synchronization between the PC and data logger is avoided
due to its complex implementation, specially for long periods of time.
As it is crucial that all data logged by the MASS/SCTU systems is
referred to a single clock, the general-purpose data logger is used additionally as a
time server. All logs are generated querying the data logger for the current time,
including logs related to the electrical data of the solar cell testing experiment. The
MASS software automatically transforms and logs the date format of the data logger
in terms of standard “Unix time” (elapsed number of seconds since 00:00:00 of
January 1st 1970, UTC time).
85
APPENDIX F IMPLEMENTED
PROTOCOL
FOR
MICROCONTROLLER COMMUNICATION
PC
–
The PC and the microcontroller communicate through a standard
RS-232 serial line. The PC works in a “Connection Request / Connected” system,
having different options available according to its actual connection state. The
system will try to maintain a connected status during all the time possible. The
microcontroller does not specifically have a “connected” status, but it defines its
internal state according to the last command received from the PC and position of the
relays (opened-closed).
Kinds of messages (“x” represents a number between 0-9):
1x: Informative, deal with connection status of the PC/104.
2x: Synchronous commands from the PC to the PIC
3x: Asynchronous commands from the PC to the PIC
4x: Synchronous commands from the PIC to the PC
5x: Asynchronous commands from the PIC to the PC
All messages being communicated will have the following structure:
*xxmmmm#
(* is the starting character for a message,
xx is the kind of message,
mmmm: is the “body” of the message (additional information being sent with kind of message). Different kinds of data
will be separated by a semicolon (;). Different lengths are accepted, but should be shorter than 100 characters,
#: ending character for delimiting the end of a message).
All possible messages are described in Table F.12.
86
Table F.12: All possible messages in computer – microcontroller
communication protocol
Message
Informative
*10#
ACK10
*11#
Connection Request from PC – PC is not connected. Will be sent every 5
seconds in case an ACK is not received. NOTE: PIC GOES TO MAIN MENU
AUTOMATICALLY.
ACK to “10”
From the PC: Should I turn on all the experiments?
ACK11.0
Answer to 11: no, don’t turn on experiments.
ACK11.1
Answer to 11: yes, turn on experiments.
*12#
ACK12.XX
*13#
ACK13.XX
*14#
ACK14.HH:MM
*15#
ACK15.XX
*16#
ACK16.XX
*17#
ACK17.XX
*18#
ACK18.XX
*19#
From PC to
PIC
Description
From the PC: What is the battery voltage limit?
Answer to 12: voltage, in volts*100 (no decimals included)
From the PC: What is the length of the night?
Answer to 13: night length, in minutes
From the PC: At what time does the night start?
Answer to 14 (hours & minutes)
From the PC: What is the PTU Orientation?
Answer to 15: PTU Orientation in degrees* 100
From the PC: What is the PTU Slip?
Answer to 16: PTU Orientation in degrees* 100
From the PC: What is the Latitude?
Answer to 17: Latitude* 100
From the PC: What is the Longitude?
Answer to 18: Longitude* 100
From the PC: PC was turned on “normally”?
ACK19.0
Answer to 19: No, it was turned at night.
ACK19.1
Answer to 19: Yes
*20x#
From the PC: Temperature is being sent (ºC*100, no decimals). RANGE: -99.99
to 99.99ºC
*21x#
From the PC: % Relative Humidity is being sent (%*100, no decimals). Limit:
100.00%
*22x#
From the PC: W/m^2 is being sent (*10, no decimals). LIMIT: 3276.7 W/m^2
*23x#
From the PC: Wind (m/s) is being sent (*100, no decimals). Limit: 327.67 m/s
87
From PIC to
PC
F.1
*24x#
From the PC: Leaf sensor measurement is being sent (*10, no decimals). LIMIT:
100.0%
*25x#
From the PC: Informing battery level in Volts*100 (this is the same
measurement received from the PIC but transformed into Volts according to
voltage divider and supply voltage). LIMIT: 99.99V
ACK2x.V
From the PIC: Informing actual battery level. This message will be sent as an
answer to any “2x” message (V=in “ticks” between 0-1024).
*30x#
Auto shutdown request; turn back on tomorrow (to be used when turning off at
night) in “X” minutes. If x= -1, do not turn on again. Limit: 999 minutes
*31x#
Auto shutdown request, PIC decides when to turn system on again (low battery
limit). Message should include for how much more time it should monitor the
batteries. If that time occurs, delay turning on for tomorrow. NOT USED.
*50x#
Shut down PC now. X=1 to turn back on tomorrow, X=0 turning off is forever.
*51#
Command was removed (NOT USED)
*52#
Shut down solar experiment now (for today).
*53#
Point PTU to the sun (to manually take a spectrophotometry).
*54x#
Generate plots now, for “x” hours. If “X”= -1, generate plots for today.
*55#
User has updated configuration values stored in the EEPROM, so PC should ask
for these values again.
Behavior with unknown messages and timeouts
Microcontroller: Only answers to known commands ignoring unknown messages. If
100 continuous characters are received without “*” and “#”, the received message is
discarded and waits for a new message. If no messages are received from the PC in
10 seconds, assumes communication problems and displays an error on the LCD
screen. User generated messages (asynchronous messages) don’t have a timeout nor
expect an acknowledge. The PIC does not know the connection state of the PC
(connected/connection request) and will always answer to ANY command received,
even if it is a command that is not expected in the actual state from the PC.
PC: if unexpected command is received returns to “not connected / connection
request” status. If 100 characters are received with no “*” and “#”, data is assumed
as erroneous and returns to the not connected state. Each sent message has a timeout,
and repeats it every “x” seconds if no acknowledge is received.
88
APPENDIX G IMPLEMENTED USER-INTERFACE MENUS
MAIN
(Shows current weather
conditions & battery
voltage)
POWER
MANAGER
GENERATE
PLOTS
CONFIGURE
Battery Voltage limits
for turning system on/off
Turn ON/OFF
PC / 104
(and all experiments)
For Today
Length of the night
(Minutes to turn PC back
on)
Turn ON PC/104
with no
experiments
(to download data at
i h)
Shut Down PC
now, turn it
back on
tomorrow
i
Last 24 hours
Start of the night
(time when to turn PC off)
PTU Orientation
Last X hours
(X chosen by
user)
PTU Slip
Point PTU to
the sun
Latitude
Longitude
Is Solar Experiment
Connected?
Figure G.10: Implemented menus in user-interface system