1
WebFOCUS InfoAssist User's
Manual
Version 7 Release 7.02
DN4501033.1110
Cactus, EDA, EDA/SQL, FIDEL, FOCUS, Information Builders, the Information Builders logo, iWay, iWay Software,
Parlay, PC/FOCUS, RStat, TableTalk, Web390, and WebFOCUS are registered trademarks, and DataMigrator and
Magnify are trademarks of Information Builders, Inc.
Adobe, the Adobe logo, Acrobat, Adobe Reader, Flash, Adobe Flash Builder, Flex, and PostScript are either registered
trademarks or trademarks of Adobe Systems Incorporated in the United States and/or other countries.
Due to the nature of this material, this document refers to numerous hardware and software products by their
trademarks. In most, if not all cases, these designations are claimed as trademarks or registered trademarks by their
respective companies. It is not this publisher’s intent to use any of these names generically. The reader is therefore
cautioned to investigate all claimed trademark rights before using any of these names other than to refer to the
product described.
Copyright © 2011, by Information Builders, Inc. and iWay Software. All rights reserved. Patent Pending. This manual,
or parts thereof, may not be reproduced in any form without the written permission of Information Builders, Inc.
WebFOCUS
Contents
Preface................................................................................................................7
Documentation Conventions..............................................................................................8
Related Publications..........................................................................................................9
Customer Support.............................................................................................................9
Information You Should Have...........................................................................................10
User Feedback................................................................................................................11
Information Builders Consulting and Training.....................................................................11
1. Introducing and Launching InfoAssist...........................................................13
Introducing InfoAssist......................................................................................................14
Introducing Personal InfoAssist........................................................................................15
Accessing InfoAssist.......................................................................................................16
Accessibility Compliance With InfoAssist...................................................................16
Creating Reports From Reporting Objects..................................................................17
Launching InfoAssist.......................................................................................................18
Launching InfoAssist in the Domain Tree...................................................................19
Using the Splash Screen..........................................................................................21
Selecting a Data Source...........................................................................................22
2. Setting InfoAssist User Preferences.............................................................25
Changing User Preferences..............................................................................................26
3. Using the InfoAssist Application Window......................................................31
Components of the InfoAssist Application Window.............................................................32
Selecting From the Application Main Menu........................................................................34
Quick Access Toolbar......................................................................................................36
Accessing Properties Using the Control Panel....................................................................39
Using the Home Tab................................................................................................41
Using the Insert Tab................................................................................................48
Using the Format Tab...............................................................................................50
Using the Data Tab..................................................................................................57
WebFOCUS InfoAssist User's Manual
3
Contents
Using the Slicers Tab...............................................................................................64
Using the Layout Tab...............................................................................................64
Using the View Tab..................................................................................................66
Using the Field Tab..................................................................................................72
Using the Series Tab...............................................................................................81
Understanding the Resources Panel.................................................................................85
Using the Data Pane to Add Fields to a Report...........................................................89
Using the Query Design Pane in the Resources Panel.................................................91
Using Right-Click Field Options in the Query Design Pane............................................94
Understanding the Results Panel......................................................................................98
Using the Query Design Pane in the Results Panel.....................................................99
Understanding the Layout Canvas...........................................................................101
Understanding the Output Window..........................................................................103
Using the Navigation Taskbar.........................................................................................114
Using the Status Bar.....................................................................................................116
4. Customizing and Styling Reports.................................................................119
Excel Output for Reports................................................................................................120
Styling Reports.............................................................................................................121
Changing a Field Format.........................................................................................133
Using Custom Reporting Features...................................................................................136
Creating Customized Report Outputs..............................................................................150
5. Creating and Customizing Charts................................................................159
Selecting a Chart Type...................................................................................................160
Chart Types...........................................................................................................161
Using Custom Chart Features.........................................................................................173
Adding a Page Heading and Page Footing to a Chart........................................................189
Designing a Chart in Active Preview................................................................................193
Chart Elements.....................................................................................................196
Customizing a Series.............................................................................................197
Customizing the Background and Frame..................................................................207
Customizing the Grid Lines.....................................................................................212
Customizing the Axis Labels...................................................................................213
Customizing the Axis Titles.....................................................................................216
4
WebFOCUS
Contents
Customizing the Legend.........................................................................................220
6. Using Document View and Building Compound Documents........................223
Accessing Document View.............................................................................................224
Building a Compound Document.....................................................................................230
Creating a Compound Document From a Single Report.............................................230
Inserting a Chart....................................................................................................231
Inserting a Report..................................................................................................237
Inserting Reports From Multiple Data Sources.........................................................242
Inserting an Existing Report....................................................................................244
Inserting Text and Images......................................................................................245
Editing Components in a Compound Document........................................................248
Adding Active Technologies Form Controls to a Compound Document................................265
Associating a Field With a Control...........................................................................266
Using the Active Dashboard Properties Dialog Box...................................................270
Reader Comments...........................................................................................283
WebFOCUS InfoAssist User's Manual
5
Contents
6
WebFOCUS
WebFOCUS
Preface
This documentation describes how to use the WebFOCUS InfoAssist application. It is intended
for users that need to create, modify, and run reports.
Contact your local Information Builders account manager to learn how to license and enable
this new capability.
Note: The WebFOCUS toolset generates the rich FOCUS fourth generation language. While
this language is very extensive, the WebFOCUS toolset only supports a subset of the language
and only specific syntax constructs. While the user can manually modify the content of these
WebFOCUS procedures/files, there is no guarantee that the user will be able to open the
modified procedure in the tool.
How This Manual Is Organized
This manual includes the following chapters:
Chapter/Appendix
Contents
1
Introducing and Launching
InfoAssist
Describes the benefits of the WebFOCUS InfoAssist
ad hoc reporting tool, how to access it, and how to
use its start-up screen.
2
Setting InfoAssist User
Preferences
Describes how to customize the InfoAssist
application.
3
Using the InfoAssist
Application Window
Describes how to use the elements that make up the
application window.
4
Customizing and Styling
Reports
Describes how to apply styling to reports and create
custom report output.
5
Creating and Customizing
Charts
Describes how to create and customize charts, and
provides an overview of the available chart types and
output formats.
WebFOCUS InfoAssist User's Manual
7
Documentation Conventions
6
Chapter/Appendix
Contents
Using Document View and
Building Compound
Documents
Describes features of compound documents and
Document view, which enables users to add text,
images, active form controls, reports, and charts to
create compound documents in InfoAssist.
Documentation Conventions
The following table lists and describes the conventions that apply in this manual.
Convention
Description
THIS TYPEFACE
Denotes syntax that you must enter exactly as shown.
or
this typeface
Represents a placeholder (or variable) in syntax for a value that
you or the system must supply.
this typeface
Indicates a default setting.
underscore
this typeface
Represents a placeholder (or variable), a cross-reference, or an
important term. It may also indicate a button, menu item, or
dialog box option that you can click or select.
this typeface
Highlights a file name or command.
Key + Key
Indicates keys that you must press simultaneously.
{
}
Indicates two or three choices; type one of them, not the braces.
[
]
Indicates a group of optional parameters. None are required,
but you may select one of them. Type only the parameter in the
brackets, not the brackets.
|
8
Separates mutually exclusive choices in syntax. Type one of
them, not the symbol.
WebFOCUS
Preface
Convention
Description
...
Indicates that you can enter a parameter multiple times. Type
only the parameter, not the ellipsis points (...).
.
Indicates that there are (or could be) intervening or additional
commands.
.
.
Related Publications
To view a current listing of our publications and to place an order, visit our Technical
Documentation Library, http://documentation.informationbuilders.com. You can also contact
the Publications Order Department at (800) 969-4636.
Customer Support
Do you have any questions about this product?
Join the Focal Point community. Focal Point is our online developer center and more than a
message board. It is an interactive network of more than 3,000 developers from almost
every profession and industry, collaborating on solutions and sharing tips and techniques,
http://forums.informationbuilders.com/eve/forums.
You can also access support services electronically, 24 hours a day, with InfoResponse
Online. InfoResponse Online is accessible through our World Wide Web site,
http://www.informationbuilders.com. It connects you to the tracking system and knownproblem database at the Information Builders support center. Registered users can open,
update, and view the status of cases in the tracking system and read descriptions of reported
software issues. New users can register immediately for this service. The technical support
section of www.informationbuilders.com also provides usage techniques, diagnostic tips,
and answers to frequently asked questions.
Call Information Builders Customer Support Service (CSS) at (800) 736-6130 or (212) 7366130. Customer Support Consultants are available Monday through Friday between 8:00
a.m. and 8:00 p.m. EST to address all your questions. Information Builders consultants can
also give you general guidance regarding product capabilities and documentation. Please
be ready to provide your six-digit site code number (xxxx.xx) when you call.
To learn about the full range of available support services, ask your Information Builders
representative about InfoResponse Online, or call (800) 969-INFO.
WebFOCUS InfoAssist User's Manual
9
Information You Should Have
Information You Should Have
To help our consultants answer your questions effectively, be prepared to provide the following
information when you call:
Your six-digit site code (xxxx.xx).
Your WebFOCUS configuration:
The front-end you are using, including vendor and release.
The communications protocol (for example, TCP/IP or HLLAPI), including vendor and
release.
The software release.
Your server version and release. You can find this information using the Version option
in the Web Console.
The stored procedure (preferably with line numbers) or SQL statements being used in
server access.
The Master File and Access File.
The exact nature of the problem:
Are the results or the format incorrect? Are the text or calculations missing or
misplaced?
The error message and return code, if applicable.
Is this related to any other problem?
Has the procedure or query ever worked in its present form? Has it been changed recently?
How often does the problem occur?
What release of the operating system are you using? Has it, your security system,
communications protocol, or front-end software changed?
Is this problem reproducible? If so, how?
Have you tried to reproduce your problem in the simplest form possible? For example, if
you are having problems joining two data sources, have you tried executing a query
containing just the code to access the data source?
Do you have a trace file?
How is the problem affecting your business? Is it halting development or production? Do
you just have questions about functionality or documentation?
10
WebFOCUS
Preface
User Feedback
In an effort to produce effective documentation, the Documentation Services staff welcomes
your opinions regarding this manual. Please use the Reader Comments form at the end of
this manual to communicate suggestions for improving this publication or to alert us to
corrections. You can also use the Documentation Feedback form on our Web site,
http://documentation.informationbuilders.com/feedback.asp.
Thank you, in advance, for your comments.
Information Builders Consulting and Training
Interested in training? Information Builders Education Department offers a wide variety of
training courses for this and other Information Builders products.
For information on course descriptions, locations, and dates, or to register for classes, visit
our World Wide Web site (http://www.informationbuilders.com) or call (800) 969-INFO to
speak to an Education Representative.
WebFOCUS InfoAssist User's Manual
11
Information Builders Consulting and Training
12
WebFOCUS
WebFOCUS
1
Introducing and Launching InfoAssist
Ad hoc reporting is critical to an effective
decision-making process and efficient
day-to-day operations. InfoAssist provides
a robust, user-friendly solution that helps
companies overcome traditional ad hoc
reporting challenges.
Tools that provide ad hoc reporting
solutions have freed non-technical users
from their dependence on Information
Technology (IT). These tools empower
users to satisfy their own Business
Intelligence (BI) needs. With these tools,
business professionals are able to
transform enterprise data into the
compelling reports needed to effectively
perform their jobs without IT intervention.
Topics:
Introducing InfoAssist
Introducing Personal InfoAssist
Accessing InfoAssist
Launching InfoAssist
However, most of the solutions on the
market address only part of the problem.
They provide users with limited options
for answering the important questions
raised by the information contained in
their reports. Most reporting tools are
technical in nature and provide a host of
features that can often be confusing to
even the most technically astute user.
Additionally, while ad hoc reporting tools
decrease report development tasks for
IT teams, the need to install and
administer related software on user
desktops increases.
WebFOCUS InfoAssist User's Manual
13
Introducing InfoAssist
Introducing InfoAssist
WebFOCUS InfoAssist extends the power of WebFOCUS Managed Reporting. InfoAssist
provides business users with the most advanced, yet simple to use, ad hoc reporting features
needed to create intricate reports and perform insightful analysis.
InfoAssist is a powerful report generation tool that enables business users to leverage state
of the art ad hoc functionality. With InfoAssist, you can quickly and easily:
Generate highly complex reports, charts, and documents from any enterprise information
source without IT intervention.
Complete tasks, such as building a report, with minimal clicks.
Progress to more sophisticated activities such as publishing and sharing documents.
Convert reports to charts, or charts to reports, in a single click.
Analyze multiple reports and charts simultaneously, using advanced tiling options to view
data from multiple perspectives.
Output report data in a variety of formats, including HTML, active reports, active Flash,
PDF, active PDF, Excel, and PowerPoint.
InfoAssist is a Rich Internet Application (RIA) that uses AJAX (Asynchronous JavaScript and
XML) technology. It delivers its cutting-edge functionality using a familiar Microsoft® Officelike interface. This highly intuitive environment shields users from the underlying technical
complexities associated with ad hoc reporting features, while providing access to all the
functionality needed to address mission-critical information requirements.
This powerful ad hoc reporting tool enables rapid and efficient design and deployment of
reports and charts. It uses an interactive and fully customizable WYSIWYG (What You See
Is What You Get) development environment. Users receive instant feedback throughout the
development process to ensure that reports and charts are properly built.
InfoAssist offers ad hoc reporting in a single, thin-client environment. There is no software
to install, no desktop clients to maintain, and no user licenses to track. It is a RIA that
makes desktop-style ad hoc applications readily available, using the Web, to business users
across your enterprise.
Note: If you manually edit a report created with InfoAssist, do not delete or modify the
internal comments located at the top of the procedure. Modifying these comments, or any
content of the procedure, could produce unpredictable results when you open the report
with InfoAssist. In general, we do not recommend that you manually edit a procedure.
14
WebFOCUS
1. Introducing and Launching InfoAssist
Introducing Personal InfoAssist
The self-service version of InfoAssist, known as Personal InfoAssist, is available outside the
Dashboard (Managed Reporting) environment. Any application can call and open Personal
InfoAssist. This feature enables you to integrate InfoAssist into your own self-service
applications.
With Personal InfoAssist, you can browse for saved reports (procedures) on your local desktop.
You can also save reports to the local desktop and restore them from the desktop. You
execute reports only within InfoAssist. There is no facility that allows query execution outside
the tool. You can call Personal InfoAssist from a URL that is a standard JavaServer Page
(JSP).
All functionality for the Dashboard version of InfoAssist is provided in Personal InfoAssist
except the following:
Customizing InfoAssist by modifying user preferences.
Drilling down to a procedure.
Applying custom themes.
Running reports in deferred mode.
The URL for accessing Personal InfoAssist is
http://hostname[:port]/wf_context_root/MyIA[?IBIC_server=server][&IBIAPP_app=app]
where:
hostname[:port]
Is the name of the host where the WebFOCUS Web application is deployed. Specify the
optional port number only if you are not using the default port number.
wf_context_root
Is the site-customized context root for the WebFOCUS Web application deployed on your
application server. The default value is ibi_apps.
server
Is the optional WebFOCUS Reporting Server to use.
app
Is the optional application path name to search.
WebFOCUS InfoAssist User's Manual
15
Accessing InfoAssist
Accessing InfoAssist
In this section:
Accessibility Compliance With InfoAssist
Creating Reports From Reporting Objects
You can launch InfoAssist in Dashboard from the following access points:
Standard Reports
Reporting Objects
My Report created from a Reporting Object
Custom Report
The following apply.
InfoAssist is not accessible from the Managed Reporting Applet.
Administrators and developers with the Data Server privilege can override the application
path at the time of data selection.
Accessibility Compliance With InfoAssist
WebFOCUS InfoAssist is Section 508 compliant with the following end-user configuration:
Internet Explorer Browser Version 7 or 8.
JAWS Version 9.0 or higher. See the Freedom Scientific® web site,
http://www.freedomscientific.com, for browser requirement information.
In Dashboard, accessibility mode is on by default for Section 508 users. Non-Section 508
users must click the Accessibility On link in the Dashboard banner. To navigate InfoAssist
using the JAWS screen reader, you must verify the following JAWS settings.
Forms Mode is turned on.
Virtual PC Cursor is disabled.
Alt Attribute is checked under the Graphics Settings.
Button Text Options is set to Use Title.
InfoAssist supports JAWS Version 9.0 and higher.
16
WebFOCUS
1. Introducing and Launching InfoAssist
Creating Reports From Reporting Objects
When you use InfoAssist to create reports, charts, and compound documents from Reporting
Objects, the following options are supported.
Define - Ability to remove from or add to a report.
Filters - Existing filters are displayed in the filter area of the Query Design pane, and you
can add them to a report if desired.
Report and Graph - Headings, footings, and field placement as SUM/PRINT, BY, and
ACROSS are supported.
Document View - Compound documents are supported.
The following limitations apply.
Join - Cannot be edited.
Data Source - Data sources cannot be added.
Other - Cannot be viewed or edited.
Application Object - Not supported.
For more information, see the WebFOCUS Managed Reporting Developer's Manual.
WebFOCUS InfoAssist User's Manual
17
Launching InfoAssist
Launching InfoAssist
In this section:
Launching InfoAssist in the Domain Tree
Using the Splash Screen
Selecting a Data Source
Reference:
Browser Configuration
To access InfoAssist, log on to Dashboard and type valid Managed Reporting credentials on
the Login page, which is shown in the following image.
Sites that use integrated single logon may use the following URL to access the Dashboard
log in page directly.
http://hostname[:port]/wf_context_root/bid-login?
where:
hostname[:port]
Is the name of the host where the WebFOCUS Web application is deployed. Specify the
optional port number only if you are not using the default port number.
wf_context_root
Is the site-customized context root for the WebFOCUS Web application deployed on your
application server. The default value is ibi_apps.
18
WebFOCUS
1. Introducing and Launching InfoAssist
Launching InfoAssist in the Domain Tree
Reference:
Opening Existing Procedures
After you access Dashboard, there are multiple ways to launch InfoAssist from the Domain
Tree, depending on your privileges. You can launch InfoAssist using the following methods.
Standard Reports folder. Right-click a Standard Reports folder and select InfoAssist.
Standard Report procedure. Right-click a procedure that was created previously with
InfoAssist and saved in the Standard Reports folder, and select Open.
Custom Reports folder. Right-click the Custom Reports folder and select InfoAssist.
My Report or Custom Report procedure. Right-click a procedure that was created
previously with InfoAssist and saved in the My Reports or Custom Reports folder, and
select Open.
Reporting Objects. Right-click a procedure in the Reporting Objects folder, and select
InfoAssist.
WebFOCUS InfoAssist User's Manual
19
Launching InfoAssist
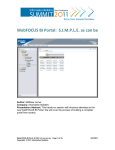
The following image shows the right-click menu option for launching InfoAssist from the
Standard Reports folder.
Note: If you create a Reporting Object with InfoAssist, the only tool available to open the
Reporting Object will be InfoAssist. Power Painter, Report Assistant, Graph Assistant, and
Advanced Graph Assistant will not display on the drop-down menu.
Reference: Opening Existing Procedures
You can open existing procedures created with InfoAssist. When InfoAssist opens a report
that you previously created, the report is opened using the last view that was displayed when
you saved the report.
20
WebFOCUS
1. Introducing and Launching InfoAssist
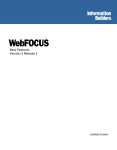
Using the Splash Screen
When you launch InfoAssist, a splash (start-up) screen is displayed. The splash screen
displays the available options, as shown in the following image.
The available options are grouped into the following two sections.
Getting Started. The Getting Started options enable you to launch the tool in the
development mode in which you are working. The following Getting Started options are
available when you open InfoAssist.
Build a Report - Starts InfoAssist in the Interactive Design view that enables you to
begin to build a report. A dialog box opens and prompts you to select a data source.
Build a Chart - Starts InfoAssist in the Interactive Design view that enables you to
begin to build a chart (graph). A dialog box opens and prompts you to select a data
source.
Build a Document - Starts InfoAssist in Document view with options set to begin
building a document. A dialog box opens, where you can select a data source. For
more information, see Using Document View and Building Compound Documents on
page 223.
Open Existing Item - The Open dialog box opens, where you can select an existing
report.
WebFOCUS InfoAssist User's Manual
21
Launching InfoAssist
Change Default Options - The Options window opens, where you can change the default
settings to reflect your preferences. For more information, see Changing User
Preferences on page 26.
When you change your options and click Set, the changed options will be effective in
your next InfoAssist session. Close and relaunch the tool. You are returned to the
splash screen unless the Show Splash Screen option was deselected and a Start
Mode was selected. In that case, InfoAssist proceeds in the selected Start Mode.
Close Application - Closes and exits the tool.
Help. The Help options provide help for the new user. The following Help options are
available when you open InfoAssist.
InfoAssist Help - Opens the online documentation window for InfoAssist.
Online Forum - Opens the WebFOCUS Focal Point Web site in a new browser window.
Tip: You can suppress the splash screen by changing the default settings in the Options
window.
Selecting a Data Source
Reference:
Opening a New Procedure
Selecting a data source is the first step when you create a new report or chart. When the
Open dialog box appears, select the desired data source and click OK, which closes the
dialog box. You can also double-click a data source to open it and close the dialog box in
one step. If the desired data source is not in the default directory, select a different directory
using the Look in drop-down list.
22
WebFOCUS
1. Introducing and Launching InfoAssist
The Open dialog box is shown in the following image.
InfoAssist also displays the Open dialog box when you save a report, select a drill-down
procedure, or open a WebFOCUS StyleSheet, theme, or Cascading Style Sheet (CSS) file.
WebFOCUS InfoAssist User's Manual
23
Launching InfoAssist
Reference: Opening a New Procedure
When you open a new procedure in InfoAssist, you are presented with the splash (start-up)
screen. Selecting Build a Report, Build a Chart, or Build a Document displays the Open dialog
box for selecting a data source. When you select a data source and click OK, the InfoAssist
application window opens, as shown in the following image.
Reference: Browser Configuration
When using Internet Explorer to access InfoAssist, you must have the correct security settings
to run the program properly. Automatic prompting for downloads must be enabled. For more
information on changing your Internet Explorer security settings, please see your browser
documentation.
24
WebFOCUS
WebFOCUS
2
Setting InfoAssist User Preferences
You can change the default user
preferences to customize the way that
InfoAssist behaves when you are using
the tool to create reports and generate
output. You can customize the InfoAssist
interface, including all menus and dialog
boxes, by selecting an application theme
that applies the desired styling.
Topics:
Changing User Preferences
Additionally, you can style independently
from the interface, the reports created
with InfoAssist by selecting a separate
document theme.
WebFOCUS InfoAssist User's Manual
25
Changing User Preferences
Changing User Preferences
Reference:
Startup Options
Layout
View
Format
Environment and Styling
You can change the default user preferences for using InfoAssist. Select Options in the
Application Main Menu, or select Change Default Options in the splash (start-up) screen.
The Options window, as shown in the following image, opens to provide you with a userfriendly interface for customizing the InfoAssist application.
The Options window enables you to customize InfoAssist by selecting your preferences in
the following areas:
Startup Options
Layout
26
WebFOCUS
2. Setting InfoAssist User Preferences
View
Format
Environment and Styling
If any of the options in these areas are gray in color, they are disabled and you do not have
access to changing that user preference. To gain access, contact your administrator.
Reference: Startup Options
The Startup Options section of the Options window displays the Show splash screen check
box. This check box is selected by default and opens the splash screen every time you
launch InfoAssist. When the check box is cleared, the Start Mode drop-down menu is
activated. This menu provides the start-up options report, chart, or compound document.
The selected option will be the default view when launching InfoAssist, instead of displaying
the splash screen.
Reference: Layout
The Layout section of the Options window provides drop-down menus for selecting values
for printing reports and charts. The following settings and values are available.
Page Size - Values are A4, A3, A5, Letter, Tabloid, and Legal. The default value is Letter.
Orientation - Values are Portrait and Landscape. The default value is Portrait.
Reference: View
The View section of the Options window provides drop-down menus for selecting values for
the following settings.
Design View - Values are Interactive and Query. The default value is Query.
Preview Method - Values are Preview with Source Data and Preview with Sample Data.
This menu becomes active when Interactive is selected from the Design View drop-down
menu. The default value is Preview with Source Data.
Record Limit - Values are All Records, 1, 10, 50, 500, or you can type the desired numeric
value directly in the menu. The default value is 500.
Data Panel - Values are Logical, List, and Structured. The default value is Logical.
Query Panel - Values are 2x2 (2 columns by 2 rows), 1x4 (1 column by 4 rows), and Tree.
The default value is Tree.
Output Target - Values are Single Tab, New Tab, Single Window, and New Window. The
default value is Single Tab.
WebFOCUS InfoAssist User's Manual
27
Changing User Preferences
Reference: Format
The Format section of the Options window provides drop-down menus for selecting values
for the following settings.
Report output type - Values are HTML, PDF, PowerPoint, Excel 2007, Excel 2000, active
report, active Flash, and active PDF. The default value is HTML.
Chart output type - Values are HTML, PDF, PowerPoint, Excel 2000, active report, active
Flash and active PDF. The default value is HTML.
Document output type - Values are HTML, PDF, PowerPoint, Excel 2000, active report,
active Flash, and active PDF (for Compound documents containing only reports). The
default value is PDF.
Reference: Environment and Styling
The Environment and Styling section of the Options window provides an Application Theme
drop-down menu and a Document Theme selection field and Browse button, as shown in
the following image.
The selected Application Theme applies styling to all interfaces, menus, and dialog boxes
within InfoAssist. It also becomes the default Document Theme used to style all reports and
charts.
Selecting a specific Document Theme overrides the selected Application Theme for styling
reports and charts. However, if you subsequently change the Application Theme, it becomes
the default Document Theme again, which overrides any Document Theme selected previously.
28
WebFOCUS
2. Setting InfoAssist User Preferences
The Application Theme drop-down menu has options for selecting Blue, Charcoal, Windows
Classic, Grey (the default), High Contrast, Ruby, or Turquoise. The Document Theme selection
field has a Browse button that you can select to search for an existing WebFOCUS StyleSheet
or Cascading Style Sheet. You can also type the path directly in the field. The following image
shows the dialog box used for selecting a Document Theme with the Template option
selected.
You can also select a document styling theme by selecting the Theme button in the Report
group of the Home tab in the Control Panel. For more information, see Using the Home Tab
on page 41.
WebFOCUS InfoAssist User's Manual
29
Changing User Preferences
30
WebFOCUS
WebFOCUS
3
Using the InfoAssist Application Window
InfoAssist provides a self-contained
environment and an intelligent, flexible
layout for creating reports and charts.
The application window provides intuitive
menus and toolbars, a versatile control
panel that provides access to specialized
groups for different functional areas of
report design, a taskbar for selecting
output, and a status bar for directing
output.
The application window also provides a
resources area for selecting and sorting
data, and a multi-faceted results area
that can display report design, a preview
of report output, or actual report output.
Topics:
Components of the InfoAssist
Application Window
Selecting From the Application Main
Menu
Quick Access Toolbar
Accessing Properties Using the Control
Panel
Understanding the Resources Panel
Understanding the Results Panel
Using the Navigation Taskbar
Using the Status Bar
WebFOCUS InfoAssist User's Manual
31
Components of the InfoAssist Application Window
Components of the InfoAssist Application Window
InfoAssist displays the Application Main Menu, Quick Access Toolbar, and Control Panel at
the top of the window. It displays the Resources Panel in the left pane, the Results Panel
in the right pane, and the Navigation Taskbar and Status Bar at the bottom of the window,
as shown in the following image.
32
WebFOCUS
3. Using the InfoAssist Application Window
The InfoAssist application window is composed of the following functional areas.
Application Main Menu
Displays open, save, run, and other options in a pop-up window when you select the IA
button. For details, see Selecting From the Application Main Menu on page 34.
Quick Access Toolbar
Displays the most commonly used functions in a toolbar that is always visible. For details,
see Quick Access Toolbar on page 36.
Control Panel
Displays property controls using highly visible icons that are grouped logically by
functionality within each tab of the Control Panel. Tabs include Home, Insert, Format,
Data, Slicers, Layout, View, Field, and Series (charts only). For details, see Accessing
Properties Using the Control Panel on page 39.
Resources Panel
Displays the fields from the selected data source in the Data pane. Also displays the
Query Design pane below the Data pane except in Query Design view. For details, see
Understanding the Resources Panel on page 85.
Results Panel
Displays either the Query Design pane, Layout Canvas, or Output window. The Query
Design pane is displayed when you select Query Design view. The Layout Canvas is
displayed in Interactive mode when you create or modify a report. The Output window is
displayed when you execute a report. For details, see Understanding the Results Panel
on page 98.
Navigation Taskbar
Displays groups and icons to provide different views and quick access to all active reports
and report output. For details, see Using the Navigation Taskbar on page 114.
Status Bar
Displays the status of the last selected action, the name of the current report, an output
format button that shows the selected format, and an output target button that shows
the selected option for displaying new output windows or tabs. For details, see Using
the Status Bar on page 116.
WebFOCUS InfoAssist User's Manual
33
Selecting From the Application Main Menu
Selecting From the Application Main Menu
Reference:
Recent Items
The Application Main Menu, which opens when you click the IA button in the top-left corner
of the InfoAssist window, displays buttons for commonly used functions and lists recently
worked on reports and reports that have been pinned to the Recent Reports section. You
can use this menu to create a new report, open an existing item, save a report, save a report
with a new name, publish a report to your managed reporting environment, run a report, run
a report in deferred mode, close InfoAssist, modify user preferences, exit the tool, open a
recently worked on item, and open a pinned item.
The Application Main Menu, as shown in the following image, lists recently worked on reports
and pinned reports. The menu also displays buttons labeled New, Open, Save, Save As,
Publish, Run, Run Deferred, Close, Options, and Exit.
Selecting New has different behaviors depending on your current InfoAssist session. For
more information, see New Icon on page 36.
Selecting Options opens the Options window, where you can change the default user
preferences to customize the InfoAssist application. For more information, see Changing
User Preferences on page 26.
34
WebFOCUS
3. Using the InfoAssist Application Window
Selecting Close will close only the currently active report. You will be prompted to save upon
closing.
Reference: Recent Items
The Recent Items section of the Application Main Menu lists recent reports and reports that
have been pinned to the menu.
Pinned reports are represented by blue pin
list and are in alphabetical order.
icons. Pinned reports are at the top of the
Recent reports are represented by yellow
icons. Recent reports appear below the separator
bar and are in the order of when they were created, with the most recently created report at
the top.
You can pin important reports to the top of the Recent Reports section of the Application
Main Menu for quick and easy access. To promote a recent report to pinned report, click
the yellow pin icon. The icon will turn blue and the report will be moved to the pinned report
area of the Recent Items window, where it will stay until it is unpinned. To demote a pinned
report, click the blue pin icon. The icon will turn yellow and the report will be moved below
the separator bar.
Reports also have a context menu that you can access by right-clicking a report in the Recent
Items section of the Main Menu, as shown in the following image.
The options in the menu are as follows:
WebFOCUS InfoAssist User's Manual
35
Quick Access Toolbar
Open, which opens the selected report.
Pin to list, which pins a recent report to the pinned reports list.
Remove from list, which unpins a pinned report from the pinned reports list.
Clear unpinned list, which clears all reports from the recent items list.
Quick Access Toolbar
Reference:
New Icon
Undo and Redo Icons
The Quick Access toolbar, located to the right of the Application Main Menu button, is always
visible no matter which options are selected. It provides access to the most commonly used
functions.
From left to right, you can select New (create a new report, chart, or compound document),
Open (an existing report), Save, Undo, Redo, View code, and Run, as shown in the following
image.
Reference: New Icon
The New
icon allows you to create a new report, chart, or compound document. The exact
functionality of the New icon depends on your current InfoAssist session.
36
WebFOCUS
3. Using the InfoAssist Application Window
Opening a Reporting Object through InfoAssist and then clicking the New icon will result in
a new report being generated from the Reporting Object. You will be prompted to choose
the type of report you wish to create from the Reporting Object, as shown in the following
image.
WebFOCUS InfoAssist User's Manual
37
Quick Access Toolbar
Opening a new session of InfoAssist and then clicking the New icon will result in a new report
being created. You will be prompted to choose a data source, as shown in the following
image.
Opening an existing My Report will result in the New icon being grayed out and inactive.
Reference: Undo and Redo Icons
The Undo
icon allows you to undo your last action. The Redo
icon allows you to
redo the action. The Redo icon is the opposite of the Undo icon. It reinstates the change
made by the Undo icon.
The Undo icon or Redo icon is enabled (blue) when there is an action to undo or redo.
Otherwise, the icon is disabled (gray).
For example, assume that your first action when creating a report is to add a database field
to the report. After you add the field, the Undo icon turns blue. You can now click the Undo
icon to remove the field from the report. The Undo icon turns gray, and the Redo icon turns
blue. To restore the field to the report, click the blue Redo icon.
You can also press Ctrl+Z to undo an action, or Ctrl+Y to redo that action.
38
WebFOCUS
3. Using the InfoAssist Application Window
You can undo and redo up to 25 actions per session. InfoAssist maintains the undo/redo
list of actions even when you switch between reports.
When a dialog box is open in the application window, you cannot use the Undo and Redo
icons. However, when you click OK and close the dialog box, the icons become available for
use. With a single click of Undo, you can undo all the actions that you performed in the
dialog box, and you can reinstate them with a single click of Redo.
Accessing Properties Using the Control Panel
In this section:
Using the Home Tab
Using the Insert Tab
Using the Format Tab
Using the Data Tab
Using the Slicers Tab
Using the Layout Tab
Using the View Tab
Using the Field Tab
Using the Series Tab
The Control Panel provides access to logical groupings of all property controls and options
in one location. This feature minimizes the need to go to other areas of the application to
view or modify application properties.
Property controls and options are grouped logically by functionality, using a set of tabs
located at the top of the Control Panel. Each tab provides a collection of related groups
containing icons (buttons). The tabs, which are located below the Application Main Menu
and Quick Access Toolbar, include Home, Insert, Format, Data, Layout, View, and Field, as
shown in the following image. The Home tab is selected by default when you first open
InfoAssist.
The Control Panel also provides a Series tab when you are creating a chart.
WebFOCUS InfoAssist User's Manual
39
Accessing Properties Using the Control Panel
When selected, each tab opens a different view of the Control Panel by exposing groups
that contain clustered, highly visible icons. You control some properties just by clicking the
icon (button), while others have drop-down menus for selecting options. Some options open
dialog boxes that provide additional property controls.
The layout of the Control Panel spans the width of the application window. It displays all
property controls using different sized icons and groups, depending on the size of the monitor
and application window. When you reduce the size of the application window, some groups,
which contain property controls, are collapsed into single buttons as determined by the
amount of available space. The following image shows the Features group, from the Format
tab, collapsed into a single button.
When a group of property controls is collapsed into a single button, the individual property
icons are removed from view, but are still available. Selecting a collapsed group button
restores the group to its normal full size and displays all of the individual property icons.
The following image shows the expanded Features group.
When expanding a collapsed group, the Control Panel collapses a neighboring group to make
enough room to expand the selected group.
When a property control icon (button) or option in a pop-up menu or dialog box is gray in
color, that functionality is not available for that report as it currently exists. Some functionality
is available for reports only, charts only, or compound documents only. In some situations,
selecting one or more options makes other options incompatible with the previously selected
ones. As a result, the incompatible options are gray and unavailable for selection. InfoAssist
automatically makes incompatible options unavailable (gray) as you create and modify a
report.
Note: For some icons, their availability is a result of an administrative setting. If you do not
have access to that property, contact your administrator to gain access.
40
WebFOCUS
3. Using the InfoAssist Application Window
Using the Home Tab
The Home tab enables you to control the most commonly used properties and options from
the Format, Design, Filter, and Report groups, as shown in the following image.
The Home tab provides the following property control groups.
Format
Displays a button showing the current output format plus buttons to toggle between
creating a report (the default) or a chart. The drop-down menu for the output format
button displays all supported output format options, which include HTML (the default
for charts and reports), active report, active Flash, PDF (the default for compound
documents), active PDF, Excel 2007 (reports designed in Interactive and Query Design
views only), Excel 2000, Excel Formula (reports designed in Interactive and Query Design
views only), Excel Pivot (reports designed in Interactive and Query Design views only),
and PowerPoint, as shown in the following image.
When you run a report, the output is created in the format that is currently selected. You
can also select output format options from the Output Types group in the Format tab of
the Control Panel and from the output format button in the Status Bar.
WebFOCUS InfoAssist User's Manual
41
Accessing Properties Using the Control Panel
Selecting Report or Chart determines whether report-specific or chart-specific functionality
is available in the InfoAssist tool. The default name ReportX or ChartY will be given for
each new report or chart created in a given InfoAssist session, where X and Y are numbers
that increase in numerical order starting from 1. For more information on switching
between multiple reports, see Using the View Tab on page 66.
Design
Enables you to select the design mode for creating reports, and design preview options
for accessing data. The design preview options include Query Design view, Interactive
Design view (the default), or Document view. The design options include Data from
Source (the default), Use Sample Data, and Records. The Design group is shown in the
following image.
Selecting Interactive Design view displays a preview of the report in the Results Panel
as you create the report. Selecting Query Design view displays the Query Design pane
in the Results Panel, which provides a large work area for creating the report. Query
Design view also reduces processing time because it does not access the actual data
source as you create the report.
Selecting Document view displays the Document Layout Canvas in the Results Panel,
where you can add text, images, lines, reports, and charts to create a compound
document. For more information about Document view, see Using Document View and
Building Compound Documents on page 223.
Selecting Data from Source uses the selected data source to display a live preview of
the output in the Results Panel. Selecting Use Sample Data displays sample data, which
reduces processing time by eliminating the need to access the actual data source.
The Records option limits the number of rows retrieved from the data source when
Interactive Design view is selected. This feature is useful in reducing response time if
you are working with a large amount of data. Type the desired number of rows directly
in the Records field, or use the drop-down menu to select one of the preset record limits.
The preset choices are All rows, 1, 10, 50, 100, 500, and 1000.
Filter
Provides the Filter button, which opens the simple filter dialog box for creating WHERE
statements. WHERE statements enable you to select only the data that you want and
to exclude unwanted data. You also have options to Exclude or Include an existing Filter,
as shown in the following image.
42
WebFOCUS
3. Using the InfoAssist Application Window
In the simple filter dialog box, you can create simple filters using the Values, Prompt,
and Relational Operators menus. For more information, see Using the Field Tab on page
72. For more information on creating advanced filters, see Using the Data Tab on page
57.
Report
Provides options that you can select to enhance a report, including Theme, Style, Banded
(reports only), Header/Footer, Column Totals (reports only), and Row Totals (reports
only), as shown in the following image.
Selecting Theme opens a dialog box where you can select a theme, other than the default
(or selected) application theme, to style your report or chart. To select from an assortment
of color-coded WebFOCUS StyleSheet themes that are standard with InfoAssist, select
the Template button and choose a theme. Appended to the name of each standard
theme is the following string: _theme.sty. You can choose black, blue, charcoal, combined
gradient, gray, navy, ocean, ruby, or turquoise.
To select a customized Cascading Style Sheet theme created by you or someone else
in your organization, select the Managed Reporting button and search for a customized
theme in the Other Files folder in the selected Dashboard Domain. You can also select
a document styling theme or an application theme to style all reports created in InfoAssist.
Use the Environment and Styling section of the Options window, which is accessible by
selecting Options in the Application Main Menu. You can also select Change Default
Options in the splash (start-up) screen that appears when you launch InfoAssist. For
more information, see Environment and Styling on page 28.
WebFOCUS InfoAssist User's Manual
43
Accessing Properties Using the Control Panel
The Style button is available in Query Design view, Interactive Design view, and Document
view. Selecting Style opens a dialog box for applying global styling to the entire report.
The available styling options are font family, font size, font color, background color, text
justification (left, center, right), font styling (bold, italic, underline), and resetting to styles
from the template. The styling options are shown in the following image.
For more information about styling reports, see Styling Reports on page 121.
For reports only, selecting Banded opens a color selection dialog box for choosing a
color that provides an alternating color scheme for the report. The report output will
display alternating rows of data, using a white background for one row and a background
of the selected color for the next row. This pattern continues throughout the report. For
more information, see How to Style Rows of Data With Alternating Colors in a Report on
page 127.
44
WebFOCUS
3. Using the InfoAssist Application Window
The following image shows the color selection dialog box that opens when you select
the Banded reporting option.
Use the color selection dialog box for choosing colors throughout InfoAssist. When
choosing colors, you can click a color square on the left side of the dialog box, or click
an area of the color palette on the right side of the dialog box. You can also select colors
by typing numbers in the Hue, Sat, and Lum fields, or the Red, Green, and Blue fields.
You can also use the up and down arrows next to each field to set numeric values. To
make your choice of color transparent, for the purpose of overlay and translucency,
select the Transparent check box.
The Header/Footer button is available in Query Design view, Interactive Design view,
and Document view.
Clicking the Header/Footer button opens the Heading & Footing dialog box, from which
you can add and style headings and footings.
For a report, you can add and style report headings, page headings, page footings,
and report footings. In the dialog box, the tab for Report Heading is selected (active)
by default.
For a chart, you can add and style page headings and page footings. For a chart,
Page Heading is selected (active) by default.
WebFOCUS InfoAssist User's Manual
45
Accessing Properties Using the Control Panel
The following image shows the Heading & Footing dialog box with Report Heading active
by default. It contains sample report heading text (Dollar Sales by Product and Region).
Another way to access the Heading & Footing dialog box is to click the arrow next to the
Header/Footer button. It opens a drop-down menu from which you can select the heading
or footing that you want to work with. After you make your selection, the Heading &
Footing dialog box opens, and the heading or footing that you selected is active. The
following image shows the drop-down menu for a report, from which you can select the
active heading or footing.
From the Heading & Footing dialog box, you can add and style the active heading or
footing, or choose a different one to work with by selecting the applicable tab. You can
switch among tabs, but InfoAssist does not save changes made on the tabs until you
click Apply or OK. If you click Apply, the Heading & Footing dialog box remains open. If
you click OK, the dialog box closes.
46
WebFOCUS
3. Using the InfoAssist Application Window
You can style a selected heading or footing using the options on the styling ribbon. From
left to right, you can customize the font type, font size, and font style (bold, italic, or
underline). You can justify text (left, center, or right), select the font color and background
color, and restore styling settings to their default value from the template.
You can also insert "quick text" into a heading or footing. Quick text is supplied for you.
It includes information that is typically useful in identifying a report or chart. From the
preformatted text drop-down menu, you can select Draft, Page X of Y, Confidential, Date
(multiple formats), Time (multiple formats), or Created by (followed by a name), as shown
in the following image.
For charts, an icon
on the far right of the styling ribbon is enabled. This icon
provides two options for controlling the way in which the page heading and page footing
are rendered. The default option, Create Heading and Footing as Text, renders the
heading and footing as text elements that are separate from the chart image. The option
Embed Heading and Footing in the Chart renders the heading and footing text as part
of the chart image.
Once you have added a heading or footing to a report or chart, you can double-click it
on the canvas in design mode to reopen the Heading & Footing dialog box. You can also
right-click an existing heading or footing in design mode and select Edit from the menu
to open the dialog box.
For more information on adding and styling headings and footings, see How to Add
Headings and Footings to a Report on page 123 and Adding a Page Heading and Page
Footing to a Chart on page 189.
For reports only, selecting Column Totals adds a grand total row to the bottom of the
report to sum numeric data in each column. For reports only, selecting Row Totals adds
a grand total column to the right side of the report to sum numeric data in each row. For
more information, see How to Add Column Totals to a Report on page 141 and How to Add
Row Totals to a Report on page 142.
WebFOCUS InfoAssist User's Manual
47
Accessing Properties Using the Control Panel
Using the Insert Tab
The Insert tab is accessible only while in Document view. If you are in Interactive Design
view or Query Design view, the Insert tab will be grayed out and unavailable, as shown in
the following image.
The Insert tab enables you to add reports, charts, existing reports, text, images, and active
form controls (for active report, active PDF, and active Flash outputs only) to a canvas in
Document view, as shown in the following image.
The Insert tab provides the following groups.
Reports
Enables you to insert reports, charts, and existing reports into your compound document.
You can add multiple reports and charts to a single canvas with these buttons. The
Reports group is shown in the following image.
Selecting Report inserts a report placeholder in the top-left corner of the canvas.
Selecting Chart inserts a chart placeholder in the top-left corner of the canvas.
Selecting Existing Report opens the Open dialog box where you can select an existing
report to be inserted in the top-left corner of the canvas.
Objects
Enables you to insert text and images into your compound document. The Objects group
is shown in the following image.
48
WebFOCUS
3. Using the InfoAssist Application Window
Selecting Text inserts an inline text object in the top-left corner of the canvas.
Selecting Image causes an Open dialog box to appear. Browse to the desired image and
click OK to insert it in the top-left corner of the canvas.
Active Dashboard Prompts
Enables you to insert active form controls into your compound document. You can add
multiple controls to a single canvas with these buttons. This group is only visible when
the output format of the compound document is set to active report, active PDF, or active
Flash. The Active Dashboard Prompts group is shown in the following image.
Selecting Drop Down inserts a drop-down control placeholder in the top-left corner of the
canvas.
Selecting List inserts a list control placeholder in the top-left corner of the canvas.
Selecting Checkbox inserts a checkbox control placeholder in the top-left corner of the
canvas.
Selecting Radio Button inserts a radio button control placeholder in the top-left corner
of the canvas.
Selecting Text inserts a text area control placeholder in the top-left corner of the canvas.
For more information on inserting active form controls, see Adding Active Technologies
Form Controls to a Compound Document on page 265.
WebFOCUS InfoAssist User's Manual
49
Accessing Properties Using the Control Panel
Using the Format Tab
The Format tab provides different options for selecting output formats and other reporting
features, depending on whether you are creating a report or a chart. For reports, the Format
tab provides access to the Output Types, Destination, Navigation, and Features groups, as
shown in the following image.
For charts, the Format tab provides access to the Output Types, Destination, Chart Types,
Features, and Labels groups, as shown in the following image.
The Format tab provides the following groups and options.
Output Types
Provides buttons that you can select to create output in any of the supported formats,
which include HTML (the default for charts and reports), active report, active Flash, PDF
(the default for compound documents), active PDF, Excel formats (Excel 2000 only for
charts and Compound documents), and PowerPoint, as shown in the following image.
For more information on the additional Excel formats available for reports, see Excel
Output for Reports on page 120.
Note: The active PDF output can only be displayed if you have Adobe® Reader® 9.0 or
higher.
When you run a report, the output is created in the format that is currently selected. You
can also set output format options from the output format button in the Status Bar.
Destination
Provides buttons that enable you to easily toggle between creating a report (the default)
or a chart and a button to enable the creation of an InfoMini application, as shown in
the following image.
50
WebFOCUS
3. Using the InfoAssist Application Window
Selecting InfoMini enables the creation of an InfoMini application.
Selecting Report or Chart determines whether report-specific or chart-specific functionality
is available in the InfoAssist tool. If you switch from Report to Chart or Chart to Report,
all selected options specific to each type of report are maintained during the current
session until you save the report. When you save a report, chart-specific options are not
maintained. When you save a chart, report-specific options are not maintained.
Navigation
For reports only, the Navigation group provides buttons for selecting options that affect
output display and navigation. These options include Table, Table of Contents, Freeze,
Pages On Demand, and Auto Drill & Analysis, as shown in the following image.
Table is selected by default and generates standard WebFOCUS browser output.
Selecting Table of Contents generates output by displaying a table of contents icon in
the top-left corner where report output is normally displayed. Selecting the table of
contents icon opens a menu that enables you to select (view) individual values of the
first sort (BY) field, one value at a time. You can also select options to view the entire
report or remove the table of contents. For more information, see How to Create Table
of Contents Reports on page 154. The Table of Contents option is activated only when
HTML, active report, Excel, or PowerPoint output format is selected.
Selecting Freeze generates output with column titles that freeze (remain in view) when
you scroll through pages of the report output. For more information, see How to Freeze
Column Titles in a Report on page 155.
Selecting Pages On Demand displays one page of output at a time. This option provides
a menu bar at the bottom of the report output, where you can choose to view additional
pages of output. For more information, see How to Create Pages On Demand Reports on
page 156. The Pages On Demand option is activated only when HTML or active report
output format is selected.
WebFOCUS InfoAssist User's Manual
51
Accessing Properties Using the Control Panel
Selecting Auto Drill & Analysis generates output which invokes OLAP processing. For
more information, see How to Create OLAP Reports on page 151. The OLAP option is
activated only when HTML output format is selected.
Features (for Reports)
Provides buttons for selecting specialized reporting features, including Title Popup,
Accordion, Repeat Sort Value, Stack Measures, and Excel Formula, as shown in the
following image.
Selecting Title Popup displays pop-up titles when the mouse pointer hovers over a column
title in the report output. For more information, see How to Add Pop-Up Titles to a Report
on page 144. The Title Popup feature is activated only when HTML output format is
selected.
Selecting Accordion creates expandable views of data for each vertical sort field. This
option displays data values only for the first vertical sort field when you first view the
output. You can manually expand your view to expose the data values of lower-level sort
fields. For more information, see How to Create Accordion Reports on page 156. The
Accordion feature is activated only when HTML or active report output format is selected.
Selecting Repeat Sort Value displays all repeated sort values in the output instead of
blanks after the first instance of a new sort value, which is the default behavior.
Selecting Stack Measures displays all numeric measure field names in a column of the
report output with the corresponding numeric data values displayed. For more information,
see How to Implement Stacked Measures on page 157. The Stack Measures feature is
activated only when HTML, Excel, or PowerPoint output format is selected.
Features (for Charts)
Provides buttons for selecting custom chart features, including 3D Effect, Rotate,
Reference, Annotate, and Grid lines, as shown in the following image.
52
WebFOCUS
3. Using the InfoAssist Application Window
Selecting 3D Effect (the default) sets the three-dimensional view to on or to off. The 3D
Effect feature is disabled for 3D, stock, gauge, gauge thermometer, pareto, spectral
map, and funnel chart types.
Selecting Rotate toggles between a vertical display or horizontal display of a chart. For
more information, see How to Rotate a Chart on page 174. The Rotate feature is disabled
for pie, scatter, 3D, stock, gauge, gauge thermometer, pareto, spectral map, and funnel
chart types.
Selecting Reference opens a drop-down menu that provides the Add Reference Line to
Y-Axis and Add Reference Line to X-Axis options. Selecting one of these options opens
the appropriate Reference Line dialog box, where you can set the specific X-Axis or YAxis value, type the desired text, and position the reference line on a chart. For more
information, see How to Display Reference Lines on page 175. The Reference feature is
disabled for pie, 3D, stock, gauge, gauge thermometer, pareto, spectral map, and funnel
chart types.
Selecting Annotate opens a drop-down menu that provides the Add an annotation option.
Selecting this option opens the Annotation dialog box, where you can type the desired
text and position the annotation on a chart. The choices for Position are Top Left, Top
Middle, Top Right, Middle Left, Middle Right, Bottom Left, Bottom Middle, and Bottom
Right, as shown in the following image. For more information, see How to Display
Annotations on page 178.
Selecting Grid lines opens a drop-down menu that provides options to add O1 Minor
Gridlines and Y1 Minor Gridlines to the O1 Major Gridlines and Y1 Major Gridlines that
are displayed by default on a chart. You can also deselect the default grid lines to
suppress their display on a chart. For more information, see How to Display Grid Lines
on page 179.
Note: The chart features are grayed out and unavailable when designing a chart that
will be output in active report, active Flash, or active PDF formats.
WebFOCUS InfoAssist User's Manual
53
Accessing Properties Using the Control Panel
Chart Types (for Charts)
For charts only, the Chart Types group provides buttons for selecting the most commonly
used chart types, which include Bar (the default), Pie, Line, Area, and Scatter. You can
also click the Other button to select additional chart types. The Chart Types group is
shown in the following image.
When you click Other, the New Chart dialog box opens. Across the top of the dialog box
are eight tabs, which are depicted by icons. Each tab represents a chart type category.
As shown in the following dialog box, the left-most tab represents the bar chart category,
which is selected by default. When selected, it displays thumbnail images of the bar
chart variations that are supported by InfoAssist.
54
WebFOCUS
3. Using the InfoAssist Application Window
In this example, the Vertical Percent Bar chart type is selected. A description of the
selected chart type is provided beneath the images.
Note: You can only choose from Bar, Pie, Line, and Scatter charts if the output format
selected is active report.
For more information on the chart types that you can choose from, see Selecting a Chart
Type on page 160.
Labels (for Charts)
Provides the Axes and Legend buttons, which have drop-down menus for selecting a
specific option.
WebFOCUS InfoAssist User's Manual
55
Accessing Properties Using the Control Panel
Selecting Axes enables you to choose the following:
Show O1-Axis Labels (selected by default)
Show Y1-Axis Labels (selected by default)
Stagger O1-Axis Labels
Stagger Y1-Axis Labels
Rotate O1-Axis Labels
Rotate Y1-Axis Labels
The two Rotate options provide a choice of None (the default), 45, 90, and 270 degrees.
For more information, see How to Customize the Display of Axis Labels on page 182.
Selecting Legend opens a drop-down menu, where you can select or deselect Show
Legend to display or hide the legend on a chart, change the default Legend Position,
and change the default Legend Orientation. The choices for Legend Position are Auto
(the default), Bottom, Right, Left, Top, Right bottom, Right top, Left bottom, Bottom right,
Top right, Bottom left, and Top left, as shown in the following image.
For Legend Orientation, the choices are Auto (the default), Vertical, and Horizontal. For
more information, see How to Customize the Display of Legend Labels on page 183.
56
WebFOCUS
3. Using the InfoAssist Application Window
Using the Data Tab
The Data tab provides access to data manipulation and data display properties and options
in the Calculation, Join, Filter, and Data Source groups, as shown in the following image.
The Data tab provides the following groups and options.
Calculation
Provides the Detail and Summary buttons, which enable you to create Define and Compute
fields, as shown in the following image.
Selecting Detail opens the DEFINE Field Creator dialog box, which enables you to create
a defined field, type a name for the field, and enter a format. Note that a Define field is
added to the actual data.
Selecting Summary opens the COMPUTE Field Creator dialog box, which enables you to
create a computed field, type a name for the field, and enter a format.
WebFOCUS InfoAssist User's Manual
57
Accessing Properties Using the Control Panel
The Field Creator dialog boxes, which open when you select Detail or Summary, provide
similar functionality, including options to display data source fields in a Tree, Dimension,
or List view. You can also view a complete set of functions instead of data source fields
by selecting the Functions button. The following image shows the DEFINE Field Creator
dialog box.
Filter
Provides advanced filtering options, through an Advanced Filter dialog box. Advanced
Filter options include the ability to use Where and Where Total, in addition to enabling
And, as well as Or, conjunctions in a single expression. You can also group conditions
and expressions, as well as apply functions and calculations within criteria. This option
provides more functionality than the Simple Filter. For more information on the simple
filter, see Using the Field Tab on page 72. The Filter group is shown in the following
image.
Note: The Filter group is not available when working with SAP BW, Essbase, or Microsoft
SQL Server Analysis Services cubes.
58
WebFOCUS
3. Using the InfoAssist Application Window
In the Advanced Filter dialog box, you can create Where and Where Total filters, as shown
in the following image.
You can change between Where and Where Total by double-clicking on WHERE.
Double-clicking the Double-click or press F2 to edit! text opens drop-down menus for
Fields, Operators, and Values. You can retrieve fields and values from the Master File
and data source.
The Field drop-down menu provides a field list from the Master File.
The Equal to (default value) drop-down menu provides the following operators:
Equal to
Not equal to
Greater than
Less than
Greater than or equal to
Less than or equal to
In literal list
Not in literal list
WebFOCUS InfoAssist User's Manual
59
Accessing Properties Using the Control Panel
Missing
Not missing
From - To
Not From - To
Includes literal list
Excludes literal list
Contains characters
Omits characters
Like character mask
Not like character mask
The Value drop-down menu opens a dialog box with multiple options, as shown in the
following image.
The type drop-down menu contains the following options.
Constant - Enables the entry of a literal constant value.
Parameter - Enables you to specify a parameter by entering a name and description
in the provided text input areas, as well as selecting the type of parameter (Simple,
Static, Dynamic).
60
WebFOCUS
3. Using the InfoAssist Application Window
Field - Enables the specification of a field name to compare against.
The value area contains a text input box that you can use to manually insert values. It
also contains a Get Values drop-down menu, which supplies the following options.
All - Retrieves all of the values from the selected field.
First - Retrieves the first value from the selected field.
Last - Retrieves the last value from the selected field.
Minimum - Retrieves the minimum value from the selected field.
Maximum - Retrieves the minimum value from the selected field.
From File - Retrieves a value that you specify. Selecting this option will cause a browse
dialog box to appear.
Note: The Get Values drop-down menu will only be accessible if you have already selected
a field.
After selecting the desired values, you can move them into and out of the Multiple Values
area with the left and right arrows. You can also change the value order and delete
values with the up and down arrows and the delete icon.
After creating a condition, you can insert additional conditions before and after the
selected condition by using the Insert Before and Insert After buttons at the top of the
Advanced Filter dialog box. You can use either And or Or conjunctions to link conditions
and the Group and Ungroup buttons to nest and organize conditions.
WebFOCUS InfoAssist User's Manual
61
Accessing Properties Using the Control Panel
You can create additional filters by selecting the New Filter button at the top of the
Advanced Filter dialog box.
After creating the desired filters, pressing OK will save and apply the filters. You can
access them from the Filter pane of the Resources panel.
Data Source
Provides the Add Data Source and Switch Data Source buttons. The Data Source group
is accessible only while in Document view. If you are in Interactive Design view or report
Design view, the group will be grayed out and unavailable. The Data Source group is
shown in the following image.
Note: The Data Source group is grayed out and unavailable when working with Reporting
Objects.
62
WebFOCUS
3. Using the InfoAssist Application Window
Selecting Add Data Source allows you to add additional data sources to a compound
document, which enables inserting reports from different data sources into the same
document. An Open dialog window will appear, as shown in the following image.
Selecting Switch Data Source allows you to choose which data source is currently active
and being used to create new reports. A drop-down list with all of the data sources that
have been added will appear, as shown in the following image.
You can also switch data sources by selecting a report that is using a data source
different than the one that is currently active.
WebFOCUS InfoAssist User's Manual
63
Accessing Properties Using the Control Panel
Using the Slicers Tab
The Slicers tab provides the ability to create and edit slicers, as shown in the following
image.
The Slicers tab provides the following groups and options.
Options
Provides the New Group, Clear Slicers, and Update Preview buttons.
Record Limit
Provides the Preview and Run Time drop-down menus.
Group
Provides a group for each Slicer group that is added.
Using the Layout Tab
The Layout tab provides access to page display and layout options from the Page Setup,
Size & Arrange (Document View only), and Report groups, as shown in the following image.
The Layout tab provides the following groups and options.
Page Setup
Provides the Margins, Orientation, Size, Units, and Page Numbers (reports only) buttons,
which enable you to customize the page setup for the output of your report.
64
WebFOCUS
3. Using the InfoAssist Application Window
Selecting Margins enables you to set margin values by choosing Normal (1 inch all
around), Narrow (.5 inch all around), Moderate (.5 inch left/right), Wide (1.5 inch
left/right), or Custom. Choosing Custom opens the Margins dialog box, as shown in the
following image, where you can set specific margins as needed.
Selecting Orientation enables you to set the orientation of your report to portrait or
landscape.
Selecting Size enables you to select the size of the paper for printing output. You can
choose A3, A4, A5, Letter, Legal, Tabloid, or PowerPoint.
Selecting Units enables you to select the unit of measurement used for customizing the
dimensions of your report or chart. You can choose Inches, Centimeters, Points, or
Pixels.
For reports only, selecting Page Numbers enables you to select page numbering options.
You can choose one of the following:
No Lead (no space for headers)
On (page numbers only in headers)
Off (space for headers, but no page numbering)
The Page Numbers value is overridden by header and footer text options.
Size & Arrange
Provides Height and Width, Auto Overflow, Aspect Ration, Autofit, and Align buttons. The
Size & Arrange group is only available in Document view. For more information on using
the options available in the Size & Arrange group to layout components in a compound
document, see Editing Components in a Compound Document on page 248.
WebFOCUS InfoAssist User's Manual
65
Accessing Properties Using the Control Panel
Report
Provides the Cell Padding (reports only) and Autofit Column (reports only) buttons, which
enable you to customize report spacing settings.
Selecting Cell Padding opens the Cell Padding dialog box. From that dialog box, you can
set specific values to control the amount of space inserted between rows and columns
in a report. For more information, see How to Use Cell Padding in a Report on page 132.
Selecting Autofit Column limits the width of columns in a report to be no wider than the
largest value in each column. Autofit Column is selected by default.
Using the View Tab
The View tab provides access to report design viewing properties and options in the Design,
Show/Hide, Data Panel, Query Panel, Output Window, and Query groups as shown in the
following image.
The View tab provides the following groups and options.
Design
Enables you to toggle between Query (Design view), Interactive (Design view), and
Document (Design view) as shown in the following image. Once Document view is selected
you cannot toggle back to Query or Interactive view.
Selecting Query (Design view) displays the Query Design pane in the Results Panel,
providing a larger area for creating the report. By default, the Query Design pane is
displayed in the lower half of the Resources Panel. Selecting Interactive (Design view)
displays a preview of the report that is being created in the Results Panel. For details,
see Understanding the Results Panel on page 98.
Show/Hide
Provides the Resources, Ruler, and Grid buttons, as shown in the following image, which
enables you to choose different viewing options while working with reports and output.
66
WebFOCUS
3. Using the InfoAssist Application Window
The default view in InfoAssist shows both the Resources Panel and the Results Panel
at the same time. Selecting Resources minimizes the Resources Panel and expands the
size of the Results Panel to also occupy the area where the Resources Panel normally
appears. The Results Panel can display a preview of a report, output of a report, or the
Query Design pane.
Data Panel
Enables you to display data source fields in the Data pane (Resources Panel), using
different views that are labeled Logical (the default), List, and Structured. All three views
provide options for displaying each data source field as a Title, Description, or Field
Name. The List view also includes options to show the Alias, Format, and Reference of
each field. The Data Panel group is shown in the following image.
The following is an example of the default Logical view, displaying the Title of each field.
WebFOCUS InfoAssist User's Manual
67
Accessing Properties Using the Control Panel
The following is an example of the List view, displaying the (data source) Field Name of
each field.
68
WebFOCUS
3. Using the InfoAssist Application Window
The following is an example of the Structured view, displaying the Description of each
field.
Query Panel
Provides the Tree (the default), Areas 2x2, and Areas 1x4 buttons to select different
views of the Query Design pane. The following image shows the Query View group.
WebFOCUS InfoAssist User's Manual
69
Accessing Properties Using the Control Panel
You can display the filter and data source field containers in the Query Design pane in
one of three ways: in a two-column by two-row grid by selecting Areas 2x2, in a onecolumn by four-row grid by selecting Areas 1x4, or in the default data tree (which has no
grid) by selecting Tree. For example, the following image shows the Query Design pane
when Areas 2x2 is selected for a report.
Output Window
Provides the Arrange, Output Location, and Switch Output buttons, as shown in the
following image.
70
WebFOCUS
3. Using the InfoAssist Application Window
Selecting Switch Output opens a drop-down menu for choosing to view any active output
window. Selecting the Arrange button opens a drop-down menu for choosing to display
multiple output windows in several different ways. For example, the following image
shows how you can display three output windows when you select Tile Vertically.
Selecting the Output Location button opens a drop-down menu for choosing to direct
new output to a Single Tab (the default), New Tab, Single Window, or New Window. For
details, see Understanding the Output Window on page 103.
Report
Provides the Switch Report button, as shown in the following image, which allows you
to switch between multiple reports.
Selecting Switch Report opens a drop-down menu for choosing any active report or chart.
You may have multiple reports and charts open in the application window, as shown in
the following image.
WebFOCUS InfoAssist User's Manual
71
Accessing Properties Using the Control Panel
Note: You can also switch reports from the Status Bar, for more information, see Using
the Status Bar on page 116.
Using the Field Tab
The Field tab appears in the Control Panel when you select a data source field in the Query
Design pane or Layout Canvas. The options available in the Field tab are specific to the data
type that is selected. The options available for numeric fields are different from the options
available for non-numeric and date fields. The Field tab provides access to the Filter, Sort,
Break, Style, Format, Specific, Visibility, and Links groups, as shown in the following image.
The Fields tab provides the following groups and options.
Filter
Provides simple filtering options, including Filter, Exclude, Include, and Prompt. The Filter
group is shown in the following image.
Selecting Filter opens the simple filter dialog box for creating or modifying WHERE
statements. WHERE statements enable you to select only the data that you want and
to exclude all unwanted data. The following choices are available in the Values dropdown menu:
72
WebFOCUS
3. Using the InfoAssist Application Window
Fetch All Values From Source
Fetch Values From Disk File
Fetch First Value in Source
Fetch Last Value in Source
Fetch Minimum
Fetch Maximum
The following choices are available in the Prompt drop-down menu:
No Value Prompt (the default)
Prompt using Data Values (Dynamic)
Prompt using Selection (Static)
Prompt using Text Input (Simple)
Selecting any Prompt option changes the purpose of the dialog box to creating an auto
prompting parameter that you can select when you run a report. When you select the
Prompt using Data Values (Dynamic) option or the Prompt using Text Input (Simple)
option, the Values drop-down menu is disabled (gray). The Filter dialog box is shown in
the following image.
When you select an existing filter in the Filter area of the Query Design pane, choosing
Exclude removes, but does not delete, the filter from the report. When you select a filter
that was previously excluded from a report in the Filter area of the Query Design pane,
choosing Include restores the filter to the report.
WebFOCUS InfoAssist User's Manual
73
Accessing Properties Using the Control Panel
Selecting Prompt opens the Filter dialog box for creating an auto prompting parameter
that you can select when you run a report. The Filter dialog box is used to create both
filters and auto prompting parameters. The following choices are available in the Prompt
drop-down menu:
Prompt using Data Values (Dynamic). This is the default value.
Prompt using Selection (Static)
Prompt using Text Input (Simple)
Selecting the Allow Multiple Values for Prompt button displays a multi-select menu in the
output window when you create a dynamic auto prompting parameter for a field and then
run the report. The Filter dialog box, shown in the following image, creates a filter that
displays a dynamic auto-prompt, when the report is run, for the Product field. The dynamic
auto-prompt lists the products that you can select.
74
WebFOCUS
3. Using the InfoAssist Application Window
The following is an example of a window that prompts the user for a parameter value.
This window is displayed when you run a report after creating a dynamic auto prompting
parameter for the Product field.
WebFOCUS InfoAssist User's Manual
75
Accessing Properties Using the Control Panel
If you select the Allow Multiple Values for Prompt button while creating a dynamic auto
prompting parameter, a multi-select menu is displayed when the report is run. Selecting
multiple parameter values displays output in the same window as the prompt, as shown
in the following image.
Sort
Provides sort options, including the default Up (ascending sort), Down (descending sort),
Rank (reports only), and Limit (reports only). The Sort group is shown in the following
image.
Selecting Up (default) sorts the selected field in ascending order.
76
WebFOCUS
3. Using the InfoAssist Application Window
Selecting Down sorts the selected field in descending order.
Selecting Rank inserts a rank column immediately to the left if a BY field is selected
and copies the field as a BY field and adds a rank column to the left of the BY field if a
Measure is selected. Ranking a Measure will result in two copies of the field, the original
Measure and the BY field that is created during ranking.
The Limit drop-down menu allows you to specify the number of unique values displayed
for a sort group that has been added.
For more information about these report options, see Using Custom Reporting Features
on page 136.
Break
For reports only, the Break group, as shown in the following image, enables you to
customize a report by adding a Page Break, Line Break, Subtotal (for numeric fields only),
Sub Head, Sub Foot, and Recompute to the report output. The Break group is shown in
the following image.
Selecting Page Break starts a new page when the primary sort field changes.
Selecting Line Break inserts a line in the report output when the primary sort field
changes.
Selecting Sub Head opens a dialog box where you can type text to add a subheading
just below the column titles in the report output when the primary sort field changes.
Selecting Sub Foot opens a dialog box where you can type text to add a subfooting at
the end of the data on each page of the report output when the primary sort field changes.
Selecting Subtotal inserts a line, total text (TOTAL FIELD Value), and subtotals for all
numeric fields when the primary sort field changes.
Selecting Recompute recalculates the result of a Compute command. Recompute is
similar to Subtotal in that it recalculates only at the specified sort break. Recompute is
not available for ACROSS fields.
For more information about these report options, see Using Custom Reporting Features
on page 136.
WebFOCUS InfoAssist User's Manual
77
Accessing Properties Using the Control Panel
Style
Provides styling options for reports and charts. For a selected field in a report, you can
customize the font type, font size, font color, and background color. You can also justify
text (left, center, right), style fonts (bold, italic, underline), and restore styling to the
default values. You can apply styling to the Data (the default), column Title, or both the
Data and column Title for the selected field in a report. The Style group is shown in the
following image.
For more information about styling reports, see Styling Reports on page 121.
Format
Provides formatting options for virtual or column fields including Alphanumeric, Integer,
Decimal, Currency, Percentage, Comma, and Decimal Spaces. The Format group is shown
in the following image.
The drop-down menu provides three field-type options for the selected column, which
are Alphanumeric, Integer, and Decimal. Selecting the fourth option, More Options...,
opens the Field Format Options dialog box, which provides further formatting options for
the selected field. For more information, see Changing a Field Format on page 133.
You can also apply floating and non-floating currency and percent signs, and commas.
You can increase and decrease decimal places by selecting the appropriate buttons
under the drop-down menu.
Specific
Provides additional options for a selected field, including Data Bars (reports only),
Aggregation, and Traffic Lights, as shown in the following image.
78
WebFOCUS
3. Using the InfoAssist Application Window
For reports only, selecting Data Bars adds a data visualization column to the right of a
selected numeric field. The column displays values in each row using horizontal bars
that extend from left to right in varying lengths, depending on the corresponding data
values. For more information, see How to Add Data Visualization Bars to a Report on page
144.
Selecting Aggregation opens a drop-down menu, as shown in the following image. The
choices are None (the default), Sum, Average, Count, Count Distinct, Percent of Count,
First Value, Last Value, Maximum, Minimum, Total, Percent, Row Percent, and Average
Square.
Sum is the default aggregation type value for all numeric fields added to the Measure
field container in the Query Design pane. Changing the Measure field container from
Sum to Print, Count, or List overrides all assigned aggregation type values. For more
information related to reports, see How to Display Measure Data Using Aggregation
Options in a Report on page 145. For more information related to charts, see How to
Display Measure Data on a Chart Using Aggregation Values on page 200.
WebFOCUS InfoAssist User's Manual
79
Accessing Properties Using the Control Panel
Selecting Traffic Lights opens the Traffic Light Condition dialog box. From that dialog box
you can add new conditional styling or modify existing conditional styling by applying
traffic light (and other) colors to a selected field in the output when the field meets
specified criteria. For more information related to reports, see How to Apply Traffic Light
Conditional Styling to Data in a Report on page 129. For more information related to charts,
see How to Apply Traffic Light Conditional Styling to a Chart on page 201.
Visibility
Enables you to hide or show a selected field in the output. Fields added to a report or
chart are visible in the output by default. Selecting Hidden in the Visibility group, as
shown in the following image, hides the selected field (suppresses its display) in the
output.
To display a hidden field, select Hidden again.
Links
Enables you to add a hyperlink or drill-down procedure to a selected field in a report by
selecting Hyperlink in the Links group, as shown in the following image.
80
WebFOCUS
3. Using the InfoAssist Application Window
When you select Hyperlink, the Drill Down dialog box opens. From that dialog box, you
can configure a hyperlink or drill-down procedure for the selected field. Clicking that field
in report output takes you to the specified URL or executes the specified procedure. The
Drill Down dialog box is shown in the following image.
Using the Series Tab
The Series tab, which appears in the Control Panel only when you are working with charts,
provides access to chart properties and options through the Select, Properties, Line, and
Pie groups, as shown in the following image.
WebFOCUS InfoAssist User's Manual
81
Accessing Properties Using the Control Panel
The Series tab provides the following property control groups.
Select
Provides a drop-down menu for selecting a specific measure field to which to apply one
or more of the options that are available in the Series tab. The default setting is All
Series, which applies the selected options to all the measure fields in the report. The
following image shows the Select drop-down menu for a report with four measure fields
(Unit Sales, Dollar Sales, Budget Units, and Budget Dollars).
Properties
Provides the Data Position, Data Labels, Type, Trendline, and Equation options to further
enhance a chart, as shown in the following image.
Selecting Data Position opens a drop-down menu with options for selecting a location at
which to display data values as labels on a chart. The choices are:
Above (the default)
On top edge
Below top edge
Center
Base
For more information, see How to Display Data Labels on page 185.
Selecting Data Labels enables you to add labels to a chart, or remove them.
Selecting Type opens a drop-down menu with options for selecting different chart types.
The choices are None (the default), Bar, Line, and Area.
82
WebFOCUS
3. Using the InfoAssist Application Window
As shown in the following image, selecting Trendline opens a drop-down menu that
provides options for adding a trendline to a chart. The choices are None (the default),
Linear, Quadratic, Polynomial, Hyperbolic, Logarithmic, Modified Hyperbolic, Rational,
Exponential, Modified Exponential, Log Quadratic, and Geometric. For more information,
see How to Display Trendlines on page 180. The Trendline menu is shown in the following
image.
Selecting Equation displays the associated mathematical equation for the selected
trendline on the chart.
Line
Provides the Smooth Line and Marker options, as shown in the following image.
Selecting Smooth Line draws the chart using smooth lines. For more information, see
How to Display Smooth Lines on page 188.
WebFOCUS InfoAssist User's Manual
83
Accessing Properties Using the Control Panel
Selecting Marker enables you to change the display of the default data and legend
markers on line and scatter chart types. As shown in the following image, in the dropdown menu that opens, the marker display options are None, Square (the default), Circle,
Diamond, Plus, Triangle Down, Triangle Up, Triangle Right, Triangle Left, Pirate Plus,
House, Hexagon, Fat X, Five Star, Six Star, Hourglass, Sideways Hourglass, and Line.
For more information, see How to Customize the Display of Markers on page 186.
Pie
Provides options to Expand or Hide slices in a pie chart, as shown in the following image.
The Pie group is activated only when you select Pie in the Chart Types group of the Format
tab.
84
WebFOCUS
3. Using the InfoAssist Application Window
Understanding the Resources Panel
In this section:
Using the Data Pane to Add Fields to a Report
Using the Query Design Pane in the Resources Panel
Using Right-Click Field Options in the Query Design Pane
Reference:
Field Image List
Filter Area of the Query Design Pane
The Resources Panel displays the Data pane in the upper half of the panel and the Query
Design pane in the lower half of the panel by default. When you select Query Design view,
the Resources Panel displays the Data pane only. You select Query Design view by going to
the Design group of the View tab or Home tab and selecting Query.
WebFOCUS InfoAssist User's Manual
85
Understanding the Resources Panel
The following image shows the default view of the Resources Panel, which displays the Data
pane above the Query Design pane when you create a report.
The Data pane, which contains all the fields from the selected data sources, is always
displayed.
You can manually adjust the size of the Resources Panel and Results Panel by clicking and
dragging the border between the two panels in either direction. With the mouse cursor, hover
over the border. When the cursor changes to a two-way arrow, click and drag the border.
86
WebFOCUS
3. Using the InfoAssist Application Window
Reference: Field Image List
In the Resources panel, each field has an image associated with it. The following table
displays each image and describes what it represents.
Icon
Type
Database
Dimension Segment
Measure Segment
Locked Segment
Unique Segment
Key Field
Index Field
Blob or Compute Field
Text or Alpha Field
Date or Date and Time Field
Numeric Field
Calculated Date Field
Calculated Numeric Field
Calculated Other Field
Calculated Text Field
WebFOCUS InfoAssist User's Manual
87
Understanding the Resources Panel
Reference: Filter Area of the Query Design Pane
The Filter area of the Query Design pane displays the filters that have been created for the
selected report. The filter area contains both advanced and simple filters, as shown in the
following image.
For more information on simple filters, see Using the Field Tab on page 72. For more
information on advanced filters, see Using the Data Tab on page 57.
Note: The Filter area displays all created filters, both active (included) and inactive (excluded).
88
WebFOCUS
3. Using the InfoAssist Application Window
Using the Data Pane to Add Fields to a Report
There are several ways that you can add data source fields to a report. You can drag and
drop, double-click, or right-click data source fields in the Data pane to add them to a Query
field container or Filter in the Query Design pane. After you add data source fields to a Query
field container, you can change the order of the fields by dragging and dropping one field
above or below another field. In Query Design view, you can also add data source fields in
the Data pane to Report Heading, Report Footing, Page Heading, and Page Footing text fields
in the Query Design pane, depending on which Header/Footer options are selected in the
Query View group of the View tab.
Drag and Drop. The method that provides the most control is drag and drop. You can drag
and drop data source fields from the Data pane to the desired Query field container, Filter,
or Heading and Footing text fields in the Query Design pane. For a larger work area in which
to drop data source fields in the desired Query field container, make sure that Query Design
view is selected, and then select Areas 2x2 or Areas 1x4 from the Query View group of the
View tab. You select Query Design view by going to the Design group of the View tab or Home
tab and selecting Query. That selection expands the Query Design pane so that it is displayed
in the Results Panel.
Multi-Select. You can multi-select data source fields that you want to add to a report in
Interactive Design view, Query Design view, and Document view. To select multiple data
source fields to add to a report, click the desired fields while holding the Ctrl key on the
keyboard. You can drag and drop fields onto the canvas pane, or add them to the Query
field container.
Double-Click. To automatically add a field to the appropriate field container in the Query
Design pane, you can double-click a data source field in the Data pane. When you doubleclick a numeric measure field in the Data pane, it is automatically added to the Sum
(Measure) Query field container. When you double-click a dimension (non-numeric or date)
field in the Data pane, it is added to the By (Row Label) Query field container for a report,
or to the X Axis Query field container for a chart. You cannot automatically add a field to the
Across (Column Label) Query field container for a report, or to the Legend (Series) and Multigraph Query field containers for a chart.
Right-Click. You can also right-click a field in the Data pane to add it to the Filter area or
a Query field container in the Query Design pane. For reports, the available right-click options
are as follows:
Sum - For measure (numeric) fields.
Sort - For all types of fields.
Across - For dimension (non-numeric or date) fields.
Include as Coordinated - Only available in Document view.
Filter - For all types of fields.
WebFOCUS InfoAssist User's Manual
89
Understanding the Resources Panel
Slicers - For all types of fields.
The following image shows the pop-up menu that appears when you right-click a field in the
Data pane of a report.
For charts, the available right-click options are as follows:
Sum - For measure (numeric) fields.
Include as Category Axis - For dimension (non-numeric or date) fields.
Include as Legends Series - For dimension (non-numeric or date) fields.
Filter - For all types of fields.
Slicers - For all types of fields.
Include as Coordinated - Only available in Document view.
The following image shows the pop-up menu that appears when you right-click a field in the
Data pane of a chart in Interactive view and Query Design view.
90
WebFOCUS
3. Using the InfoAssist Application Window
The following image shows the pop-up menu that appears when you right-click a field in the
Data pane of a chart in Document view.
Although most measure fields are composed of numeric values, and most dimension fields
are composed of non-numeric or date values, there can be exceptions, depending on the
selected data source.
Using the Query Design Pane in the Resources Panel
The Query Design pane, which contains the Filter and Query (field container) areas, is
displayed below the Data pane, except when you select Query Design view, which expands
the size of the Query Design pane and displays it in the Results Panel. There are different
field containers for reports and charts.
Reports. For all reports, the Query field containers in the Query Design pane include Sum,
By, and Across.
Use the Sum
field container to aggregate or display numeric measure fields. Its
right-click menu provides options to Sum (the default), Print, Count, or List the fields in
the report.
Use the By field container to vertically sort dimension fields to produce row labels in the
report output. Dimension fields are normally non-numeric or date fields.
Use the Across field container to horizontally sort dimension (non-numeric or date) fields
to produce column labels in the report output.
WebFOCUS InfoAssist User's Manual
91
Understanding the Resources Panel
The following image shows the Filter and Query (field container) areas of the Query Design
pane as it appears in the Resources Panel for reports.
Charts. For most charts, the Query field containers in the Query Design pane include Measure
(Sum), X Axis, Legend (Series), and Coordinated. More complex charts that require additional
data dimensions have alternative field containers.
Use the Measure (Sum) field container to aggregate or display numeric measure field
values.
Use the X Axis field container to sort dimension (non-numeric or date) fields in the chart
output.
Use the Legend (Series) field container to display dimension (non-numeric or date) fields
as color-coded values (lines, bars, areas, scatter plots) that match the color-coded
dimension values displayed in the legend below the chart. Legend (Series) provides
functionality that is similar to an Across field in a report.
Use the Coordinated field container to collectively sort and collate by a common sort
group (for Compound documents only).
92
WebFOCUS
3. Using the InfoAssist Application Window
The following image shows the Filter and Query (field container) areas of the Query Design
pane as it appears in the Resources Panel for most charts in Interactive view and Query
Design view.
For pie charts, the Query field containers in the Query Design pane include Measure (Sum),
Pie slices, Category, and Coordinated.
Use the Measure (Sum) field container to aggregate or display numeric measure field
values in the pie.
Use the Pie slices field container to display dimension (non-numeric or date) fields as
color-coded pie slices that match the color-coded dimension values displayed in the
legend below the chart. The Pie slices field container is the equivalent of the Legend
(Series) field container used for other chart types.
Use the Category field container to sort dimension (non-numeric or date) fields in the
chart output. Category is the equivalent of the X Axis field container used for other chart
types.
Use the Coordinated field container to collectively sort and collate by a common sort
group (for Compound documents only).
WebFOCUS InfoAssist User's Manual
93
Understanding the Resources Panel
The following image shows the Query (field container) area of the Query Design pane as it
appears in the Resources Panel for pie charts in Interactive view and Query Design view.
Using Right-Click Field Options in the Query Design Pane
Reference:
Right-Click Field Options in Query Design Pane
In the Query Design pane, you can right-click any field and select from a list of available
options that are displayed in the pop-up menu that appears. The options that you can select
vary, depending on the type of Query field container in which the field is located and the type
of report that you are creating (report or chart).
Report. When you create a report, the Query field containers in the Query Design pane
include Sum (Measure), By, and Across.
Right-clicking a Sum field in a report displays the Filter Values, Sort, Visibility, Change Title,
Edit Format, More, and Delete options, as shown in the following image. You can select
more to access the Data Bars, Aggregation Functions, and Traffic Light Conditions options.
94
WebFOCUS
3. Using the InfoAssist Application Window
Right-clicking a By field in a report displays the Filter Values, Sort, Break, Visibility, Change
Title, More, and Delete options, as shown in the following image. You can select more to
access the Traffic Light Conditions option.
Right-clicking an Across field in a report displays Filter Values, Sort, Break, Visibility, Change
Title, and Delete options, as shown in the following image.
Chart. When you create a chart, the Query field containers in the Query Design pane include
Measure (Sum), X Axis, Legend (Series), and Coordinated (for Compound documents only).
Right-clicking a Measure (Sum) field in a chart displays the Filter Values, Visibility, Change
Title, More, and Delete options, as shown in the following image. You can select more to
access the Aggregation Functions and Traffic Light Conditions options.
WebFOCUS InfoAssist User's Manual
95
Understanding the Resources Panel
Right-clicking an X Axis or Legend (Series) field in a chart displays the Filter Values, Sort,
Visibility, Change Title, and Delete options, as shown in the following image.
Right-clicking a Coordinated field in a chart displays all the preceding options, with the
exception of Change Title.
Reference: Right-Click Field Options in Query Design Pane
The following table lists and describes all the right-click field options available in the Query
Design pane for a selected field.
96
Option
Description
Filter Values
Opens the Filter dialog box for creating WHERE statements,
which enable you to select only the data that you want and to
exclude all unwanted data.
Prompt for Values
Opens the Filter dialog box for creating an auto prompting
parameter that can be selected when a report is run.
Rank
Inserts a rank column immediately to the left if a BY field is
selected and copies the field as a BY field and adds a rank
column to the left of the BY field if a Measure is selected.
Ranking a Measure will result in two copies of the field, the
original Measure and the BY field that is created during ranking.
Limit
Provides a menu for specifying the number of unique values
displayed for a sort group that has been added.
Sort
Provides a menu for selecting sorting options.
Data Bars
Provides a menu for enabling the data bar representation
functionality. Selecting On adds a data visualization column to
the right of a selected numeric field. The column displays values
in each row using horizontal bars that extend from left to right
in varying lengths, depending on the corresponding data values.
WebFOCUS
3. Using the InfoAssist Application Window
Option
Description
Aggregation Functions
Provides a menu for selecting options to assign an aggregation
type value to a selected numeric field in a report.
Subtotal
Provides a menu for enabling subtotal functionality. Selecting
On inserts a line, descriptive text, and subtotal values in the
report output for all numeric fields when the primary sort field
changes.
Page Break
Provides a menu for enabling page break functionality. Selecting
On starts a new page in the report output when the primary
sort field changes.
Traffic Light Conditions
Opens the Traffic Light Condition dialog box, where you can
add new conditional styling or modify existing conditional styling
by applying traffic light (and other) colors to a selected field in
the report output when the field meets specified criteria.
Visibility
Provides a menu for controlling the visibility of the selected
field. Selecting Hide removes the selected field from the report
output. Selecting Show (the default) displays the selected field
in the report output.
Change Title
Opens the Edit Title dialog box, as shown in the following image,
where you can change the title of the selected field by typing
the new title in the Enter Title field.
Edit Format
Opens the Field Format Options dialog box, where you can edit
the field type and display options.
Delete
Deletes the selected field.
All the right-click options available in the Query Design pane are also available in the Field
tab. For more information, see Using the Field Tab on page 72.
WebFOCUS InfoAssist User's Manual
97
Understanding the Results Panel
Understanding the Results Panel
In this section:
Using the Query Design Pane in the Results Panel
Understanding the Layout Canvas
Understanding the Output Window
As you create or modify a report, the Results Panel displays the Layout Canvas in the default
Interactive Design view, or in the Query Design pane when you select Query Design view.
When you execute a report, the Results Panel displays the Output window. If the output
window is closed or if there is no report to preview, the Results Panel is blank. You can
select Query Design view or Interactive Design view from the Design group of the View tab
or Home tab.
The following image shows the Results Panel, which displays a chart preview when you first
enter InfoAssist to create a chart. The Resources Panel appears to the left of the Results
Panel.
98
WebFOCUS
3. Using the InfoAssist Application Window
After executing a report to generate output, if you minimize or close the Output window, the
Results Panel displays empty space, as shown in the following image.
Using the Query Design Pane in the Results Panel
The Query Design pane displays the Filter area, and the Query field containers. The Query
Design pane is displayed in the Resources Panel below the Data pane when you select the
default Interactive Design view.
The Results Panel provides a larger area for displaying the Query Design pane. This feature
is useful when you are designing a report with multiple filters or numerous fields. You can
select Query Design view or Interactive Design view from the Design group of the View tab
or Home tab.
WebFOCUS InfoAssist User's Manual
99
Understanding the Results Panel
The following image shows the Query Design pane in the Results Panel of the InfoAssist
application window. It is displaying report field containers that include Filter, Sum, By, and
Across.
100
WebFOCUS
3. Using the InfoAssist Application Window
Depending on whether you are creating a report or a chart, the Query Design pane displays
selected data source fields using different types of field containers. For reports, the Query
Design pane displays Column Labels, Row Labels, and Measures field containers. For charts,
the Query Design pane displays Filter, Legend (Series), Categories (Axis), and Measures
(SUM) field containers, as shown in the following image.
Understanding the Layout Canvas
The Layout Canvas displays a preview of the report being created or modified in the Results
Panel when you are in the default Interactive Design view. To select Interactive Design view,
go to the Design group of the View tab or Home tab and select Interactive. The Layout Canvas
is always fully maximized (within the Results Panel) and cannot be minimized, cascaded, or
tiled. However, whenever no report exists, a blank canvas is displayed.
WebFOCUS InfoAssist User's Manual
101
Understanding the Results Panel
The Layout Canvas displays either live data or sample data, depending on whether you
selected Data from Source (the default) or Use Sample Data in the Design group of the
Home tab. When you select Data from Source, a live preview of the report being built is
refreshed in the Layout Canvas as you add and remove data source fields in the report.
When you select Use Sample Data, the Layout Canvas displays sample data from the Master
File, with the same formatting and styling used to display live data.
The following image shows a preview of a report displayed in the Layout Canvas in Interactive
Design view.
102
WebFOCUS
3. Using the InfoAssist Application Window
Understanding the Output Window
Reference:
Output Target Options
Output View Options
Output Format Options
When you run a report, the output is displayed either as a output window in the Results
Panel or in a new browser window. You can create and display multiple output windows in
several different ways, depending on the following options. You can select these options in
the Output Window group of the View tab:
Cascade
Tile Horizontally
Tile Vertically
Switch
Single Tab
New Tab
New Window
Single Window
Output window and tab options are also available in the Status Bar, and output window
display options are also available in the Navigation Taskbar.
Note: When you run a report, tab focus will be on the output window and pressing the Tab
key will not move the selection. To move the Tab focus out of the output window, press F6.
Reference: Output Target Options
The following are output target options that you can select.
Single Tab. When you select Single Tab and run a report, a new output window is created
in the Results Panel, a report instance is created, and an output tab is placed on the
Navigation Taskbar. As you modify a report, the same output window is refreshed each
time the report is run. This option, which is the default, is ideal when you are working
with just one report.
WebFOCUS InfoAssist User's Manual
103
Understanding the Results Panel
New Tab. When you select New Tab, each time you run a report, a new output window
is created in the Results Panel. A new report instance is also created and preserved by
the addition of a new output tab on the Navigation Taskbar. Each output tab maintains
the output of the report that generated the corresponding output window. Selecting an
output tab on the Navigation Taskbar loads the associated output instance into the output
window.
New Window. When you select New Window, each time you run a report, a new browser
window is opened and populated with the report output. The output is not displayed in
the Results Panel, and an output tab is not added to the Navigation Taskbar.
Single Window. When you select Single Window and run a report, a new browser window
is opened and populated with the report output. As you modify the report, the same
browser window is refreshed each time the report is run. If the browser window is closed
and the report is run, a new browser window is opened again and is refreshed for each
subsequent run. The output is not displayed in the Results Panel, and an output tab is
not added to the Navigation Taskbar.
Reference: Output View Options
The following are output view options that you can select.
104
WebFOCUS
3. Using the InfoAssist Application Window
Cascade. When you select Cascade, if multiple output windows exist, they are cascaded
diagonally across the Results Panel, as shown in the following image. This option does
not affect open browser windows when you select New Window or Single Window.
WebFOCUS InfoAssist User's Manual
105
Understanding the Results Panel
Tile Horizontally. When you select Tile Horizontally, if multiple output windows exist,
they are tiled horizontally, one above another, across the Results Panel, as shown in the
following image. This option does not affect open browser windows when you select New
Window or Single Window.
106
WebFOCUS
3. Using the InfoAssist Application Window
Tile Vertically. When you select Tile Vertically, if multiple output windows exist, they
are tiled vertically, side by side, across the Results Panel, as shown in the following
image. This option does not affect open browser windows when you select New Window
or Single Window.
Switch. When you select Switch, a drop-down menu opens, where you can select any
active report to view the output. The selected report is loaded into the output window or
browser window, depending on the selected output window or tab option.
Reference: Output Format Options
The Output window can display report output in any of the supported formats, which include
HTML, active report, active Flash, PDF, active PDF, Excel formats, and PowerPoint. For more
information on the additional Excel formats available for reports, see Excel Output for Reports
on page 120.
WebFOCUS InfoAssist User's Manual
107
Understanding the Results Panel
The following image shows HTML report output, which is the default output format, as
displayed in the Output window. The Resources Panel is displayed on the left.
108
WebFOCUS
3. Using the InfoAssist Application Window
The following image shows active report output displayed with an output location of new
window.
WebFOCUS InfoAssist User's Manual
109
Understanding the Results Panel
The following image shows active Flash output displayed with an output location of new
window. The drop-down menu for the second column of data exposes the reporting options.
110
WebFOCUS
3. Using the InfoAssist Application Window
The following image shows PDF report output displayed with an output location of new
window.
WebFOCUS InfoAssist User's Manual
111
Understanding the Results Panel
The following image shows active PDF report output displayed with an output location of new
window.
Note: The active PDF output can only be displayed if you have Adobe Reader 9.0 or higher.
112
WebFOCUS
3. Using the InfoAssist Application Window
The following image shows Excel 2000 report output displayed with an output location of
new window.
WebFOCUS InfoAssist User's Manual
113
Using the Navigation Taskbar
The following image shows PowerPoint report output displayed with an output location of
new window.
Using the Navigation Taskbar
The Navigation Taskbar provides quick access to all active output windows and to the report
design that generated the output. You can return to the last report that you edited in the
Query Design pane by selecting the Design View button on the taskbar. The Navigation
Taskbar, as shown in the following image, is always visible in InfoAssist. It is located near
the bottom of the application window, just above the Status Bar.
114
WebFOCUS
3. Using the InfoAssist Application Window
Each of the active output windows displays a tab on the Navigation taskbar. Selecting the
tab displays that output window in the Results Panel. If you save a report with a unique
name each time you modify it, when the report is executed and a new output window is
generated, the unique name appears as a tab on the taskbar. If you continue to modify and
execute a report without saving it with a unique name, a number in parentheses is appended
to the original, saved report name in the tab on the Navigation taskbar to differentiate
between the multiple output windows.
The ability to select report output from the Navigation Taskbar depends on the output window
option selected from the Status Bar or from the Output Window group of the View tab. For
more information, see Using the Status Bar on page 116 or Understanding the Output Window
on page 103.
Each report tab on the Navigation Taskbar has a right-click menu with options to Restore,
Minimize, Maximize, Close, Load View, and Auto Resize, as shown in the following image.
Restore, Minimize, Maximize, and Close are standard options available in any browser window
or software application. Minimize, Maximize (if the window is not maximized) or Restore (if
the window is maximized), and Close can also be found in the top-right corner of the output
window, as shown in the following image.
WebFOCUS InfoAssist User's Manual
115
Using the Status Bar
You can load the underlying report design for each output window into the Query Design
pane by right-clicking any active output window tab on the taskbar and selecting Load View.
The Auto Resize option enables automatic resizing of an output window as needed when
you add or remove fields.
The Query View Tools pop-up menu at the far left of the Navigation Taskbar provides options
for displaying all active output windows in the Results Panel. The display options that you
can select are Cascade, Tile Horizontally, Tile Vertically, Maximize All or Restore All, Minimize
All, and Close All. The name of each active output window is displayed at the bottom of the
pop-up menu, as shown in the following image.
The Query View Tools pop-up menu options are directly linked to the options available in the
Output Window group of the View tab.
Using the Status Bar
The Status Bar displays the status of the last selected action, a reports button that shows
the number of open reports, an output format button that shows the selected format, and
an output target button that shows the selected option for displaying new output windows
or tabs. The Status Bar is shown in the following image.
116
WebFOCUS
3. Using the InfoAssist Application Window
When you select the reports button, a pop-up menu opens, with options for selecting any of
the open reports, as shown in the following image. Each report is listed by name and an
icon which represents the report type (report, chart, compound document). The report you
select becomes active.
When you select the output format button, a pop-up menu opens, with options for selecting
a different output format, as shown in the following image. Output formats include HTML,
active report, active Flash, PDF, active PDF, Excel 2007, Excel 2000, Excel Formula, Excel
Pivot, and PowerPoint.
When you select the output target button, a pop-up menu opens, with options for Single Tab
(the default), New Tab, Single Window, and New Window, as shown in the following image.
Selecting Single Tab from the output target menu and running a report creates a new output
window on the first run and refreshes the output window on each subsequent run.
WebFOCUS InfoAssist User's Manual
117
Using the Status Bar
Selecting New Tab from the output target menu creates a new output window and a new
report instance each time a report is run. For each report instance, a new output tab is
placed on the Navigation Taskbar to preserve that report. Each output tab maintains the
state of the report that generated that output. Selecting any output tab on the Navigation
Taskbar loads the associated report information into the Query Design pane.
Selecting Single Window from the output target menu and running a report creates output
in a new browser window on the first run, and then continues to update the open browser
window until that window is closed. If the window is closed and a report is run, a new browser
window is opened and each subsequent run of the report continues to populate the open
browser window.
Selecting New Window from the output target menu and running a report creates output in
a new browser window. An output tab is not added to the Navigation Taskbar.
118
WebFOCUS
WebFOCUS
4
Customizing and Styling Reports
You can apply styling to specific areas
of a report to customize its appearance
and functionality. You can also use the
many optional reporting features to add
custom functionality and output formats
to reports.
Topics:
Excel Output for Reports
Styling Reports
Using Custom Reporting Features
Creating Customized Report Outputs
WebFOCUS InfoAssist User's Manual
119
Excel Output for Reports
Excel Output for Reports
Reports created in Interactive view or Query Design view have Excel output options in addition
to Excel 2000, that are not available to charts and reports created in Document view.
The additional options for the Excel format can be accessed through a drop-down menu on
the Excel icon in the Output Types group of the Format tab when creating a report in Interactive
view or Query Design view, as shown in the following image.
Note: The additional Excel output types can also be accessed through the Output Format
button on the Status bar and the Format group on the Home tab. When you are creating a
chart or are in Document view, Excel 2007, Excel 2000, Excel Formula, and Excel Pivot will
be grayed out and inactive.
The Excel output types are explained in the following table.
Output Type
Excel 2007
Available in...
Interactive view
(reports only)
Description
Outputs the report in Excel 2007 format.
Query Design view
(reports only)
Excel 2000
Interactive view
(reports and charts)
Outputs the report in Excel 2000 format.
Query Design view
(reports and charts)
Document view
120
WebFOCUS
4. Customizing and Styling Reports
Output Type
Available in...
Excel Formula
Interactive view
(reports only)
Description
Outputs the report in Excel with pivot
table processing.
Query Design view
(reports only)
Excel Pivot
Interactive view
(reports only)
Outputs the report using native Excel
formulas for totals and computed values.
Query Design view
(reports only)
Styling Reports
In this section:
Changing a Field Format
How to:
Perform Report Level Styling
Style Data and Column Titles in a Report
Add Headings and Footings to a Report
Style Headings and Footings in a Report
Style Rows of Data With Alternating Colors in a Report
Apply Traffic Light Conditional Styling to Data in a Report
Use Cell Padding in a Report
You can apply custom styling to specific areas of a report. When creating a report in
InfoAssist, you can perform the following styling customization.
Global styling for the entire report. For details, see How to Perform Report Level Styling
on page 122.
Style data and column titles. For details, see How to Style Data and Column Titles in a
Report on page 123.
Style headings and footings. For details, see How to Style Headings and Footings in a
Report on page 126.
WebFOCUS InfoAssist User's Manual
121
Styling Reports
Style the rows of data with alternating colors. For details, see How to Style Rows of Data
With Alternating Colors in a Report on page 127.
Apply traffic light conditional styling to data. For details, see How to Apply Traffic Light
Conditional Styling to Data in a Report on page 129.
Increase or decrease the amount of space inserted between rows and columns. For
details, see How to Use Cell Padding in a Report on page 132.
Procedure: How to Perform Report Level Styling
You can apply styles to an entire report by using the Style button in the Report group of the
Home tab.
1. With a report or compound document open, select the Home tab in the Control Panel.
2. Select Style in the Report group.
The Report Style dialog box will open.
3. You can globally style the font family, font size, font color, background color, text
justification (left, center, right), font styling (bold, italic, underline), and reset the styles
from the template.
Note: Reset only works while the Report Style dialog box is open. Once you click OK,
all changes will be committed. To undo global styling after it has been committed, you
must use the Undo command from the Quick Access Toolbar.
122
WebFOCUS
4. Customizing and Styling Reports
Procedure: How to Style Data and Column Titles in a Report
You can style data, column titles, or both in the report output for the selected data source
field.
1. Select the desired data source field in the Query Design pane.
The Field tab is displayed in the Control Panel.
2. Select one of the following in the Style group.
Data Style - Styles only the data for the selected data source field.
Title Style - Styles only the column title for the selected data source field.
Data + Title - Styles both the data and the column title for the selected data source
field.
3. Select any of the following styling options that are available in the Style group.
Font type - Use the drop-down menu to change the font type.
Font size - Use the drop-down menu to change the numeric value for the font size.
Text justification - Click the Justify Left, Justify Center, or Justify Right icon to justify
the text.
Font styling - Click the Bold, Italic, or Underline icon to style the selected font.
Font color - Click the Font Color icon to open the Color dialog box, where you can
select the font color.
Background color - Click the Background Color icon to open the Color dialog box,
where you can select the background color.
Procedure: How to Add Headings and Footings to a Report
You can make a report more meaningful by adding headings and footings. Headings and
footings supply context and key information about a report, such as its purpose and audience.
Headings and footings also provide structure, helping you navigate to the detail sought, and
they enhance visual appeal.
In this procedure, you will add and style a report heading and page heading. The procedure
uses sample values, but you can supply values that apply to your own, real reports.
This feature is available in Query Design view, Interactive Design view, and Document view.
1. With your report open, click the Header/Footer icon in the Report group of the Home
tab.
WebFOCUS InfoAssist User's Manual
123
Styling Reports
The Heading & Footing dialog box opens.
2. Select the tab for the heading or footing element that you want to add.
For a report, you can add a report heading, page heading, page footing, or report footing.
By default, the Report Heading tab is selected. In this procedure, accept the default.
3. Click inside the design area of the dialog box, and type the text for the heading.
For example, the text for a sample report heading might be Dollar Sales by Product and
Region.
4. Using the styling ribbon, apply styling to the report heading text.
For example, click the arrow next to the font type field, and select HELVETICA. Select
11 for the font size. Click the Italic icon to remove the default italic font, and click the
Left justification icon to align the heading text with the left side of the report when it is
run.
The sample report heading with the selected styling values is shown in the following
image.
5. Click Apply to save the changes you have made so far, without closing the dialog box.
6. To add a page heading, select the Page Heading tab.
In this procedure, you are going to add one of the supplied quick text options.
124
WebFOCUS
4. Customizing and Styling Reports
7. Click the last icon on the right of the styling ribbon, and select Confidential from the
drop-down list.
8. Change the font and font size as desired. For example, change the font to HELVETICA
and the size to 10. Click the Left justification icon to align the page heading with the
report heading.
You can add your own text before or after the supplied text, for example, For Regional
Managers Only.
9. Click OK to save the report heading and page heading and close the Heading & Footing
dialog box.
WebFOCUS InfoAssist User's Manual
125
Styling Reports
The report heading and page heading that you added and styled are shown in Interactive
Design View in the following image.
10. To make changes to either the report or page heading, right-click the heading and select
Edit from the drop-down menu.
Procedure: How to Style Headings and Footings in a Report
You can style headings and footings in the report output for the selected heading or footing
field.
1. Highlight the desired heading or footing text in the Query Design pane.
The Home tab is displayed in the Control Panel.
2. Click the Style group.
The Style dialog box opens.
3. Select any of the following styling options that are available in the Style dialog box.
126
WebFOCUS
4. Customizing and Styling Reports
Font type - Use the drop-down menu to change the font type.
Font size - Use the drop-down menu to change the numeric value for the font size.
Text justification - Click the Justify Left, Justify Center, or Justify Right icon to justify
the text.
Font styling - Click the Bold, Italic, or Underline icon to style the selected font.
Font color - Click the Font Color icon to open the Color dialog box, where you can
select the font color.
Background color - Click the Background Color icon to open the Color dialog box,
where you can select the background color.
Reset styles - Click the Resetting styles icon to reset all the options to the default
styles from the template.
Procedure: How to Style Rows of Data With Alternating Colors in a Report
You can style rows of data with alternating colors in the report output for the selected data
source field.
1. Select the Home tab on the Control Panel.
2. Select Banded in the Report group.
WebFOCUS InfoAssist User's Manual
127
Styling Reports
The Color dialog box opens, as shown in the following image.
3. Click a color square on the left side of the dialog box, or click an area of the color palette
on the right side of the dialog box.
You can also select colors by typing numbers in the Hue, Sat, and Lum fields, or in the
Red, Green, and Blue fields. You can also use the up and down arrows next to each
field to set numeric values.
Make sure that the selected color appears in the Selected Color field and that the
Transparent check box is not selected.
4. Click OK.
5. Run the report.
128
WebFOCUS
4. Customizing and Styling Reports
The selected color provides an alternating color scheme for the report. The report output
displays alternating rows of data, using a white background for one row and a background
of the selected color for the next row. This pattern continues throughout the report, as shown
in the following image of Banded report output.
Procedure: How to Apply Traffic Light Conditional Styling to Data in a Report
You can apply conditional traffic light styling to data for a selected numeric measure field.
By default, the report displays the values that satisfy the first condition in green, and the
values that satisfy the second condition in red.
1. Select the numeric measure data source field in the Query Design pane.
The Field tab is displayed in the Control Panel.
2. Select Traffic Lights from the Specific group.
The Traffic Light Condition dialog box opens, displaying the green light selection fields.
You can select and type green light criteria in these fields.
3. From the drop-down menu below the selected data source field name, choose one of
the following relational operators:
Equal to
Not equal to
Greater than
WebFOCUS InfoAssist User's Manual
129
Styling Reports
Less than
Greater than or equal to
Less than or equal to
4. In the field to the right of the operator drop-down menu, type the desired value for the
selected operator. Data values that meet the criteria will display in green in the report
output.
Alternatively, you can select an option from the Values drop-down menu, and select the
desired data value in the Data Values dialog box that opens. From the Values drop-down
menu, as shown in the following image, you can select Fetch All Values from Source,
Fetch Values from Disk File, Fetch First Value in Source, Fetch Last Value in Source,
Fetch Minimum, or Fetch Maximum.
5. Click Add New.
The red light selection fields are displayed in the Traffic Light Condition dialog box, where
you can select and type red light criteria.
6. From the red light drop-down menu, choose the desired relational operator.
7. In the field to the right of the red light drop-down menu, type the desired value for the
selected operator. WebFOCUS will display data values that meet the criteria in red in
the report output.
Alternatively, you can select an option from the Values drop-down menu, and select the
desired value in the Data Values dialog box that opens.
8. Perform any of the following actions in the Traffic Light Condition dialog box.
To delete an existing traffic light condition, click the Remove button.
130
WebFOCUS
4. Customizing and Styling Reports
To apply styling and to change colors, click the Style button. In the Style pop-up menu
that opens, click the color
icon to open the Color dialog box, where you can select
a color different from the default green and red colors that appear for the first two
conditions. When selecting colors, you can click a color square on the left side of
the dialog box or click an area of the color palette on the right side of the dialog box.
You can also select colors by typing numbers in the Hue, Sat, and Lum fields, or in
the Red, Green, and Blue fields. You can also use the up and down arrows next to
each field to set numeric values.
To add more traffic light conditions, click Add New and select a different color for
each new condition that you specify.
9. Click OK when you are ready to close the Traffic Light Condition dialog box.
10. Run the report.
The following image shows the Traffic Light Condition dialog box. It contains criteria to display
values for Unit Sales that are greater than 600000 in green, and values for Unit Sales that
are less than 600001 in red.
WebFOCUS InfoAssist User's Manual
131
Styling Reports
The following image shows the resulting report output with the traffic light conditional styling
applied. The data in the Unit Sales column is displayed in either green or red, according to
the criteria that was specified in the Traffic Light Condition dialog box.
Procedure: How to Use Cell Padding in a Report
You can customize the amount of space inserted between rows and columns in a report.
1. Select the Layout tab in the Control Panel.
2. Select Custom from the drop-down menu for the Cell Padding button in the Report group.
The Cell Padding dialog box opens.
3. Type the desired cell padding values in the Top, Bottom, Left, and Right fields.
4. Click OK.
132
WebFOCUS
4. Customizing and Styling Reports
Changing a Field Format
How to:
Assign an Alphanumeric Format
Assign a Numeric Format
Assign a Date Format
Assign a Date-Time Format
Add a Percent Sign to a Numeric Field
You can change the default formats that are assigned to a virtual or column field in InfoAssist.
The following image shows the Field Format Options dialog box.
The following procedures show how to change a field format from the Field Format Options
dialog box. For more information on how to use the Format group options from the Control
Panel, see Using the Field Tab on page 72.
Procedure: How to Assign an Alphanumeric Format
1. Select the virtual or column field.
2. Right-click and select Edit Format from the drop-down menu.
WebFOCUS InfoAssist User's Manual
133
Styling Reports
The Field Format Options dialog box opens.
3. Select the Alphanumeric option in the Field Type option group.
4. To assign a different length, specify a number between 1 and 4095 in the Total Length
box. The default value is 20.
5. Click OK to close the Field Format Options dialog box and return to the Results Panel.
The new format appears in the previously selected column.
Procedure: How to Assign a Numeric Format
1. Select the virtual or column field.
2. Right-click and select Edit Format from the drop-down menu.
The Field Format Options dialog box opens.
3. Select one of the following options in the Field Type option group:
Floating Point (default length 7.2)
Integer (default length 5)
Decimal (default length 12.2)
Packed (default length 12.2)
If the selected field matches the selected format type, its current length appears in the
Length box. Otherwise, the default length appears in the Length box. The Decimal box
shows the numbers of decimal places for Floating Point, Decimal, and Packed.
4. To assign a different length, specify numbers in the Length box for format types as
follows: 1-9 for Floating Point, 1-11 for Integer, 1-20 for Decimal, and 1-33 for Packed.
5. To assign a different number of decimal places for Floating Point, Decimal, or Packed,
specify the number in the Decimal box.
6. Click OK to close the Field Format Options dialog box and return to the Results Panel.
The new format appears in the previously selected column.
Procedure: How to Assign a Date Format
1. Select the virtual or column field.
2. Right-click and select Edit Format from the drop-down menu.
The Field Format Options dialog box opens.
3. Select the Date option in the Field Type option group.
134
WebFOCUS
4. Customizing and Styling Reports
4. To assign a different date display format, select a date format from the Display Options
box. The default date display format is MDY.
5. Click OK to close the Field Format Options dialog box and return to the Results Panel.
The new format appears in the previously selected column.
Procedure: How to Assign a Date-Time Format
1. Select the virtual or column field.
2. Right-click and select Edit Format from the drop-down menu.
The Field Format Options dialog box opens.
3. Select the Date-Time option in the Field Type option group.
4. To assign a different date-time format, first select the date format you wish to use from
either the Year First, Month First, or Day First drop-down menu.
5. Select a time format (if applicable) from the options box on the right.
Selecting the Time Only check box will let you only set a time format.
6. Click OK to close the Field Format Options dialog box and return to the Results Panel.
The new format appears in the previously selected column.
Procedure: How to Add a Percent Sign to a Numeric Field
You can add a percent sign to the end of a numeric value (Decimal, Integer, and Floating
Point format types). This numeric display option includes a percent sign along with the
numeric data, but does not calculate the percent.
1. Select the virtual or column field.
2. Right-click and select Edit Format from the drop-down menu.
The Field Format Options dialog box opens.
3. Select one of the numeric value format types in the Field Type option group and then
select the Percent (%) check box.
4. Click OK to close the Field Format Options dialog box and return to the Results Panel.
The new format appears in the previously selected column.
WebFOCUS InfoAssist User's Manual
135
Using Custom Reporting Features
Using Custom Reporting Features
How to:
Rank Fields in a Report
Limit the Variables of a Column in a Report
Add Page and Line Breaks to a Report
Add Subtotals to a Report
Add Column Totals to a Report
Add Row Totals to a Report
Add Subheadings and Subfootings to a Report
Add Pop-Up Titles to a Report
Add Data Visualization Bars to a Report
Display Measure Data Using Aggregation Options in a Report
Display Repeated Sort Values in a Report
Recalculate the Result of a Compute Command
You can use the following custom features when creating reports in InfoAssist.
Rank - Inserts a ranking column for By and Measure fields in a Report. For details, see
How to Rank Fields in a Report on page 137.
Limit - Limits the number of unique variables in a column. For details, see How to Limit
the Variables of a Column in a Report on page 138.
Page Breaks - Starts a new page in the output when the primary sort field changes. For
details, see How to Add Page and Line Breaks to a Report on page 139.
Line Breaks - Inserts a line in the report output when the primary sort field changes. For
details, see How to Add Page and Line Breaks to a Report on page 139.
Subtotal - Inserts subtotals in the output for all numeric fields when the primary sort field
changes. For details, see How to Add Subtotals to a Report on page 140.
Column Totals - Inserts a grand total row at the bottom of the report to sum numeric data
in each column. For details, see How to Add Column Totals to a Report on page 141.
Row Totals - Inserts a grand total column to the right side of the report to sum numeric
data in each row. For details, see How to Add Row Totals to a Report on page 142.
136
WebFOCUS
4. Customizing and Styling Reports
Sub Head - Adds a subheading just below the column titles in the report output when the
primary sort field changes. For details, see How to Add Subheadings and Subfootings to
a Report on page 142.
Sub Foot - Adds a subfooting at the end of the data on each page of the report output
when the primary sort field changes. For details, see How to Add Subheadings and
Subfootings to a Report on page 142.
Pop-up Titles - Adds pop-up titles to report output when the mouse pointer hovers over
a column title. For details, see How to Add Pop-Up Titles to a Report on page 144.
Data Bars - Adds data visualization bars to numeric data. For details, see How to Add
Data Visualization Bars to a Report on page 144.
Aggregation - Displays numeric measure data using aggregation options other than the
default of Sum. For details, see How to Display Measure Data Using Aggregation Options
in a Report on page 145.
Repeat Sort Values - Displays all repeated sort values instead of blanks after the first
instance of a new sort value appears in the report. The default behavior is to display
blanks after the first instance of a new sort value. For details, see How to Display Repeated
Sort Values in a Report on page 147.
Recompute - Recalculates the result of a Compute command. Recompute is similar to
Subtotal in that it recalculates only at the specified sort break. For more details, see
How to Recalculate the Result of a Compute Command on page 148.
Procedure: How to Rank Fields in a Report
You can add rank columns to BY and Measure fields in a Report by using the Rank button
in the Sort group. Adding a rank column to a BY field will insert a rank column immediately
to the left of the field. Adding a rank column to a Measure field will create a copy of the
column as a BY field and add a rank column to the left of the new BY field.
Note: The rank option can also be accessed by right-clicking a BY or Measure field and
accessing the Rank option through the context menu.
1. Select a By or Measure field in the Query Design pane.
The Field tab is displayed in the Control Panel.
WebFOCUS InfoAssist User's Manual
137
Using Custom Reporting Features
2. Select Rank from the Sort group. A rank column will now appear, as shown in the following
image.
Note: The rank column can now be edited and formatted like any other column, with
the following exceptions:
The only formatting that can be applied is Traffic Light Conditions.
It cannot be hidden.
You cannot insert breaks or a filter.
No column can be moved in between the rank column and the column it is ranking.
Procedure: How to Limit the Variables of a Column in a Report
You can limit the number of unique variables that appear in a column using the Limit dropdown menu available in the Sort group of the Fields tab when a column is selected.
Note: The Limit option can also be accessed by right-clicking a column and accessing the
Limit option through the context menu.
1. Select a By or Measure field in the Query Design pane.
The Field tab is displayed in the Control Panel.
138
WebFOCUS
4. Customizing and Styling Reports
2. Enter a number or select a number from the Limit drop-down menu in the Sort group.
The field will now be limited to the entered number of unique values.
Procedure: How to Add Page and Line Breaks to a Report
You can add page breaks and line breaks to report output for the primary sort field.
1. Select a By (sort) field in the Query Design pane.
The Field tab is displayed in the Control Panel.
2. Select Page Break or Line Break from the Break group.
3. Run the report.
If you select Page Break, a new page is created every time the value of the primary sort field
changes. Each page includes a new set of column titles, as shown in the following image.
WebFOCUS InfoAssist User's Manual
139
Using Custom Reporting Features
If you select Line Break, a new divider line is inserted in the report output every time the
value of the primary sort field changes, as shown in the following image.
Procedure: How to Add Subtotals to a Report
1. Select a By (sort) field in the Query Design pane.
The Field tab is displayed in the Control Panel.
2. Select Subtotal from the Break group.
3. Run the report.
Selecting Subtotal inserts a line, descriptive text (*TOTAL FIELD Value), and subtotals for
all numeric fields every time the value of the primary sort field changes. The following image
is an example of report output when you select the Subtotal option.
140
WebFOCUS
4. Customizing and Styling Reports
Procedure: How to Add Column Totals to a Report
1. Select the Home tab in the Control Panel.
2. Select Column Totals from the Report group.
3. Run the report.
Selecting Column Totals adds a grand TOTAL row at the bottom of the report that sums
numeric data in each column, as shown in the following image.
WebFOCUS InfoAssist User's Manual
141
Using Custom Reporting Features
Procedure: How to Add Row Totals to a Report
1. Select the Home tab in the Control Panel.
2. Select Row Totals from the Report group.
3. Run the report.
Selecting Row Totals adds a grand TOTAL column to the right side of the report that sums
numeric data in each row, as shown in the following image.
Procedure: How to Add Subheadings and Subfootings to a Report
You can add subheadings and subfootings to report output for the primary sort field.
1. Select a By (sort) field in the Query Design pane.
The Field tab is displayed in the Control Panel.
2. Select Sub Head or Sub Foot from the Break group.
3. In the Sub header or Sub footer dialog box that opens, type the desired text, style the
text using the styling controls (if desired), and click OK.
142
WebFOCUS
4. Customizing and Styling Reports
The following image shows the Sub header dialog box.
4. Run the report.
Subheadings are displayed just below the column titles in the report output every time the
value of the primary sort field changes. Subfootings are displayed at the end of the data on
each page of the report output every time the value of the primary sort field changes. The
following image shows how subheadings appear in the report output.
WebFOCUS InfoAssist User's Manual
143
Using Custom Reporting Features
Procedure: How to Add Pop-Up Titles to a Report
1. Select the Format tab in the Control Panel.
2. Click Title Popup in the Features group.
3. Run the report.
Selecting Title Popup displays pop-up titles when the mouse pointer hovers over any column
title in the report output, as shown in the following image.
Procedure: How to Add Data Visualization Bars to a Report
You can add data visualization bars to the report output for a selected numeric data source
field.
1. Select the desired numeric data source field in the Query Design pane.
The Field tab is displayed in the Control Panel.
2. Select Data Bars from the Specific group.
3. Run the report.
A data visualization column is added to the right of the selected numeric data source field
to display values in each row. The column uses horizontal bars that extend from left to right
in varying lengths, depending on the corresponding data values. The following image is an
example of report output when you select the Data Bars option.
144
WebFOCUS
4. Customizing and Styling Reports
Procedure: How to Display Measure Data Using Aggregation Options in a Report
You can display numeric measure data using a variety of aggregation type values other than
the default of Sum.
1. Select the desired numeric measure data source field in the Query Design pane.
The Field tab is displayed in the Control Panel.
2. Select Aggregation from the Specific group, or right-click the selected measure field and
select Aggregation Functions.
WebFOCUS InfoAssist User's Manual
145
Using Custom Reporting Features
3. In the Aggregation Functions drop-down menu that opens, as shown in the following
image, the choices are Sum, Average, Count, Count Distinct, Percent of Count, First
Value, Last Value, Maximum, Minimum, Total, Percent, Row Percent, and Average Square.
If you change the Measure field container from Sum to Print, Count, or List, it overrides
all assigned aggregation type values.
The following image is an example of the MIN (minimum), MAX (maximum), and AVE
(average) aggregation prefix operators added to measure fields in the Query Design
pane.
4. Run the report.
146
WebFOCUS
4. Customizing and Styling Reports
The following image is an example of report output produced by assigning the Minimum,
Maximum, and Average aggregation options to measure fields in a report.
Procedure: How to Display Repeated Sort Values in a Report
1. Select the Format tab in the Control Panel.
2. Click Repeat Sort Value in the Features group.
3. Run the report.
WebFOCUS InfoAssist User's Manual
147
Using Custom Reporting Features
When you select Repeat Sort Value, all repeated sort values are displayed in the report
output, as shown in the following image. This option overrides the default behavior, which
displays blanks after the first instance of each new sort value that appears in the report.
Procedure: How to Recalculate the Result of a Compute Command
1. Select a By (sort) field in the Query Design pane.
The Field tab is displayed in the Control Panel.
2. You can recalculate the result of a Compute command either by:
Selecting Recompute from the Break group as shown in the following image.
148
WebFOCUS
4. Customizing and Styling Reports
Or, selecting Recomputed Totals from the right-click menu on a sort field, as shown in
the following image.
Note: Recompute is not available for ACROSS fields.
3. Run the report.
WebFOCUS InfoAssist User's Manual
149
Creating Customized Report Outputs
The following image shows a calculated field name Diff, which is the difference between
Dollars and Buddollars. This value is then recomputed for each sort break on region.
The recomputed value is the difference between the totals for Dollars and Buddollars.
Creating Customized Report Outputs
How to:
Create OLAP Reports
Create Table of Contents Reports
Freeze Column Titles in a Report
Create Pages On Demand Reports
Create Accordion Reports
Implement Stacked Measures
In addition to HTML, active report, active Flash, PDF, active PDF, Excel, and PowerPoint
output formats, you can create the following custom report output formats.
OLAP - To view output with OLAP functionality. For details, see How to Create OLAP Reports
on page 151.
150
WebFOCUS
4. Customizing and Styling Reports
Table of Contents - To view output for individual values of the first sort (BY) field, one
value at a time. For details, see How to Create Table of Contents Reports on page 154.
Freeze - To view output with column titles that freeze (remain in view) when you scroll
through pages of the report output. For details, see How to Freeze Column Titles in a
Report on page 155.
Pages On Demand - To view output, one page at a time, and use a menu bar at the
bottom of the report output, from which you can view any specific page. You can also
click an arrow to move forward a page, move backward a page, go to the first page, or
go to the last page. For details, see How to Create Pages On Demand Reports on page
156.
Accordion - To view output that is expandable for each vertical sort field. This option
displays data values only for the first vertical sort field when you first view the output.
You can manually expand your view to expose the data values of lower-level sort fields.
For details, see How to Create Accordion Reports on page 156.
Procedure: How to Create OLAP Reports
1. Select the Format tab in the Control Panel.
2. Click the Auto Drill & Analysis button in the Navigation group.
3. From the OLAP group, as shown in the following image, you can select Olap panel not
accessible, Olap panel accessible (default), Dimension filtering enabled, Dimensions
grouped in tabs, or More options. These options are mutually exclusive meaning that
only one can be selected at a time. Clicking the arrow portion of the Auto Drill & Analysis
button will display the context menu.
Note: The context menu automatically goes away after you click one of the menu options,
click the arrow again, or click anywhere else on the screen. This means only one selection
or action can be performed in the context menu at a time.
Selecting OLAP panel not accessible means that only the sorting options will display in
the column titles and the OCP (OLAP Control Panel) cannot be accessed from the title
options.
Selecting OLAP panel accessible (the default) allows access to the OLAP panel using
the Auto Drill & Analysis button in the output of the report.
WebFOCUS InfoAssist User's Manual
151
Creating Customized Report Outputs
Note: Using this option versus the hidden option allows the user to better distinguish
the difference between the first and second options. The hidden option is available by
accessing the Navigation dialog.
Selecting Dimension filtering enabled means that dimension filters are displayed at the
top of the report. Customizing the filter placement must be done in the Navigation dialog
box (accessed by clicking More options…).
Selecting Dimensions grouped in tabs means that the dimension filters are grouped into
tabs based on hierarchy/within statements in the metadata.
If you select More options, the Auto Drill & Analysis dialog box opens, as shown in the
following image.
The Auto Drill & Analysis dialog box allows the following additional
configuration/customization options for OLAP output.
Selecting OLAP panel is not accessible means that only the sorting options will display
in the column titles and the OCP (OLAP Control Panel) cannot be accessed from the
title options.
Selecting OLAP panel is accessible allows access to the OLAP panel using the OLAP
button in the output of the report.
Selecting Hide access to the OLAP panel hides access to the OLAP panel.
152
WebFOCUS
4. Customizing and Styling Reports
Selecting Dimension filtering enabled provides a secondary positioning option allowing
placement of the filters on the Top (default) or Bottom of the report. Note: If the
Dimension filtering enabled option is deselected at any time, the position option
resets to Top.
Selecting Dimensions grouped in tabs means that the dimension filters are grouped
into tabs based on hierarchy/within statements in the metadata.
Selecting an Auto drill option, which is set to None by default, can only be changed
in the Auto Drill & Analysis dialog box. The dialog box has the following options for
auto drill.
Dimensions enables automatic drill downs on dimensions in both reports and
graphs.
Dimensions and Measures (the default), enables automatic drill downs on
dimensions in both reports and graphs and, also, on measures in reports.
None disables automatic drill downs.
4. Run the report.
Selecting an option from the OLAP group, such as OLAP panel is accessible, generates output
that invokes OLAP processing. The following image is an example of an OLAP report. The
OLAP button below the report launches the OLAP Control Panel when clicked.
WebFOCUS InfoAssist User's Manual
153
Creating Customized Report Outputs
Procedure: How to Create Table of Contents Reports
1. Select the Format tab in the Control Panel.
2. Click Table of Contents in the Navigation group.
3. Run the report.
A table of contents icon is displayed in the top-left corner of the report output, as shown
in the following image.
4. Double-click the icon to display the Table of Contents pop-up menu, which enables you
to select and view individual values of the first sort (BY) field, one value at a time.
154
WebFOCUS
4. Customizing and Styling Reports
Drag the Table of Contents pop-up menu in any direction to view the report output, which
is displayed behind the menu by default. Select a sort field to view values for that field.
In the following example, clicking Espresso displays the corresponding report output.
You can also select options to view the entire report or remove the table of contents.
Procedure: How to Freeze Column Titles in a Report
1. Select the Format tab in the Control Panel.
2. Click Freeze in the Navigation group.
3. Run the report.
Selecting Freeze generates output with column titles that freeze (remain in view) when you
scroll through pages of the report output.
WebFOCUS InfoAssist User's Manual
155
Creating Customized Report Outputs
Procedure: How to Create Pages On Demand Reports
1. Select the Format tab in the Control Panel.
2. Click Pages On Demand in the Navigation group.
3. Run the report.
Selecting Pages On Demand displays one page of output at a time. This option provides a
menu bar at the bottom of the report output, as shown in the following image, where you
can choose to view additional pages of output.
Procedure: How to Create Accordion Reports
1. Select the Format tab in the Control Panel.
2. Click Accordion in the Features group.
3. Run the report.
Selecting Accordion creates expandable views of data for each vertical sort field. This option
displays data values only for the first vertical sort field when you first view the output. You
can manually expand your view to expose the data values of lower-level sort fields, as shown
in the following image.
156
WebFOCUS
4. Customizing and Styling Reports
Procedure: How to Implement Stacked Measures
1. Select the Format tab in the Control Panel.
2. Click Stack Measures in the Features group.
3. Run the report.
When the Stacked Measures option is enabled, all measures on the report are stacked.
The following image shows the InfoAssist interface in Interactive Design view before the
Stacked Measures button is clicked.
WebFOCUS InfoAssist User's Manual
157
Creating Customized Report Outputs
The following image shows the InfoAssist interface in Interactive Design view after the
Stacked Measures button is clicked.
158
WebFOCUS
WebFOCUS
5
Creating and Customizing Charts
InfoAssist enables you to easily create
different types of simple and complex
charts. You can select from a variety of
chart types and output formats, and can
add custom features to a chart.
You can also create a chart from any
existing report in InfoAssist.
Topics:
Selecting a Chart Type
Using Custom Chart Features
Adding a Page Heading and Page
Footing to a Chart
Designing a Chart in Active Preview
WebFOCUS InfoAssist User's Manual
159
Selecting a Chart Type
Selecting a Chart Type
In this section:
Chart Types
A chart often conveys meaning more clearly and effectively than data displayed in tabular
form. A chart enables you to visually communicate quantitative information. On a chart, you
can give data a shape and form, and reveal patterns and relationships among many data
values.
It is important that you select a chart type that is appropriate for your data. InfoAssist provides
a complete chart type library, which includes advanced chart types, as well as basic types.
You can select from a wide variety of chart types to best represent the data that you want
to display.
The Chart Types group, which is accessible from the Format tab on the Control Panel, makes
chart type selection easy. It provides an array of buttons for selecting the five most commonly
used chart types, which include Bar (the default), Pie, Line, Area, and Scatter. A button
labeled Other gives you access to the chart type library.
The Chart Types group is shown in the following image.
You can create each chart type using one of the following output formats:
HTML
active report (Bar, Pie, Line, and Scatter charts only)
active Flash
PDF
active PDF
Excel
PowerPoint
160
WebFOCUS
5. Creating and Customizing Charts
Chart Types
How to:
Select a Basic Chart Type
Select an Advanced Chart Type
The following are the chart types that you can select.
Bar charts. Bar charts plot numerical data by displaying rectangular blocks against a
scale (numbers or variable measures that appear along the axis). The length of a bar
corresponds to a value or amount. You can clearly compare data series (fields) by the
relative heights of the bars. Use a bar chart to display the distribution of numerical data.
You can create horizontal as well as vertical bar charts. For a complete list of available
bar chart types, see Bar Chart Types on page 169.
The following is an example of a basic bar chart.
Pie charts. Pie charts emphasize where your data fits, in relation to a larger whole. Pie
charts work best when the data consists of several large segments. Too many variables
divide the pie into small segments that are difficult to see. Use color on individual
segments to create visual contrast. For a complete list of available pie chart types, see
Pie Chart Types on page 170.
WebFOCUS InfoAssist User's Manual
161
Selecting a Chart Type
The following is an example of a basic pie chart.
Line charts. Line charts are useful for emphasizing the movement or trend of numerical
data over time. They allow you to trace the evolution of a data point by working backward
or interpolating. Highs and lows, rapid or slow movement, or a tendency towards stability
are all types of trends well suited to a line chart.
You can also plot line charts with two or more scales to present a comparison of the
same value, or set of values, in different time periods. For a complete list of available
line chart types, see Line Chart Types on page 170.
162
WebFOCUS
5. Creating and Customizing Charts
The following is an example of a basic line chart.
A radar line chart is available in the line chart category, and a radar area chart is available
in the area chart category. Radar charts compare two or more data sets. You can use
axes or polygons to represent values in a star or spider configuration. Radar charts are
essentially analogous to line charts, except that the scale wraps around. Radar charts
work well with data that is cyclical, such as the months of a year.
Area charts. Area charts are similar to line charts except that the area between the data
line and zero line (or axis) is usually displayed in color. Area charts allow you to stack
data on top of each other. Stacking allows you to highlight the relationship between data
series, showing how some data series approach a second series. For a complete list of
available area chart types, see Area Chart Types on page 171.
WebFOCUS InfoAssist User's Manual
163
Selecting a Chart Type
The following is an example of a basic area chart.
XY plot charts. There are three different types of XY plot charts.
Scatter. Scatter charts share many of the characteristics of basic line charts. You
can plot data using variable scales on both axes. When you use a scatter chart, the
data is plotted with a basic line pattern so that you can visualize the density of
individual data values around particular points, or discern patterns in the data. A
numeric X-axis, or sort field, always yields a scatter chart by default.
Scatter charts and line charts are distinguishable from one another only by virtue of
their X-axis format. Line charts can appear without connecting lines, making them
look like scatter charts, and scatter charts can appear with connecting lines, making
them look like line charts.
164
WebFOCUS
5. Creating and Customizing Charts
The following is an example of a basic scatter chart.
Polar. Polar charts share characteristics with scatter charts. Only one column field
is allowed, in the following order: X (degree) for the column field and Y (distance from
the center) for the Across/By field.
Bubble. Bubble charts display three dimensions, requiring three column fields
representing X, Y, and Z data values, in that order. The size of the bubbles is
proportional to the values that they represent.
3D charts. 3D charts add visual depth to a chart presentation. You can easily recognize
trends based on two or more data sets. 3D charts also add impact to your presentation.
For a complete list of available 3D chart types, see 3D Chart Types on page 172.
WebFOCUS InfoAssist User's Manual
165
Selecting a Chart Type
The following is an example of a 3D bar chart.
Stock charts. Stock charts track the trend of a particular stock. They show the trading
volume of the stock, its opening and closing values, and its high and low values over a
specific time period. The data is represented by sets of bars or lines. For a complete list
of available stock chart types, see Stock Chart Types on page 172.
Special charts. Special charts include a variety of additional chart types.
Gauge. A gauge chart indicates the current position of a single data value within a
given spectrum. This chart has a circular shape.
Gauge thermometer. A gauge thermometer chart indicates the current position of
a single data value within a given scale. This chart has the shape of a thermometer.
Pareto. A pareto chart uses the X-axis to show group members, and the Y-axis to
show the percent of the total of all groups that each group represents. This chart
highlights the differences between groups of data.
Vertical Box plot. A vertical box plot is oriented vertically and shows distribution of
data through five-number summaries: Upper limit, Upper Quartile, Median, Lower
Quartile, and Lower Limit. This chart can be represented with or without outliers, also
known as whiskers.
Horizontal Box plot. A horizontal box plot is oriented horizontally and shows
distribution of data through five-number summaries: Upper limit, Upper Quartile,
Median, Lower Quartile, and Lower Limit. This chart can be represented with or without
outliers, also known as whiskers.
166
WebFOCUS
5. Creating and Customizing Charts
Funnel. A funnel chart is essentially a pie chart, displaying only one group of data at
a time, from the first series to the last series at the bottom of the funnel.
Pyramid. A pyramid chart is essentially a pie chart, displaying only one group of data
at a time, from the first series to the last series at the top of the pyramid.
Spectral map. A spectral map contains a row or column matrix of markers that are
displayed in different colors, according to the data values.
Procedure: How to Select a Basic Chart Type
The Chart Types group provides buttons for selecting the five most commonly used chart
types.
1. On the Format tab in Query Design view or Interactive Design view, locate the Chart
Types group.
2. Click the Bar, Pie, Line, Area, or Scatter button, depending on the type of chart that you
want to create.
The default value is Bar chart.
The following image shows the Chart Types group, with Pie chart selected.
3. Run the report.
InfoAssist will generate the chart type that you chose.
Procedure: How to Select an Advanced Chart Type
InfoAssist provides a complete chart type library, which includes advanced chart types, as
well as basic types. The Other button in the Chart Types group gives you access to the library.
1. On the Format tab in Query Design view or Interactive Design view, locate the Chart
Types group.
2. Click the Other button.
WebFOCUS InfoAssist User's Manual
167
Selecting a Chart Type
The following image shows the Chart Types group, with Other selected.
The New Chart dialog box opens. Each of the eight tabs across the top of the dialog box
represents a chart type category.
3. To display the name of a category, hover over the tab with the mouse.
From left to right, the chart type categories are bar, line, area, pie, XY plot, 3D, stock,
and special.
4. Click a chart type category.
All supported variations of the chart type appear as thumbnail images in the area
underneath.
5. Within the category, click an image to display a detailed description of that chart type.
If you are not familiar with a chart type, be sure to read the description carefully before
finalizing your selection. Some chart types require a certain number of data values, or
a certain type of data values. If your data does not satisfy the requirements, the chart
will not accurately represent the data.
168
WebFOCUS
5. Creating and Customizing Charts
In the following example, the 3D tab is selected (the third tab from the right). Underneath
the tab, the 3D chart types supported by InfoAssist are displayed as images. Within the
images, the 3D Cylinder chart type is selected, and a description is displayed underneath.
You can also hover over an image with your mouse to display the chart type name.
In the following example, the mouse is hovering over the selected chart type to display
its name.
6. Click OK on the New Chart dialog box to finalize your selection and close the dialog box.
7. Run the report.
InfoAssist will generate the chart type that you chose.
Reference: Bar Chart Types
The following table lists the available bar chart types.
Available Bar Chart Types
Vertical Clustered Bar
WebFOCUS InfoAssist User's Manual
Horizontal Clustered Bar
169
Selecting a Chart Type
Available Bar Chart Types
Vertical Stacked Bar
Horizontal Stacked Bar
Vertical Dual-Axis Clustered Bar
Horizontal Dual-Axis Clustered Bar
Vertical Dual-Axis Stacked Bar
Horizontal Dual-Axis Stacked Bar
Vertical Bi-Polar Clustered Bar
Horizontal Bi-Polar Clustered Bar
Vertical Bi-Polar Stacked Bar
Horizontal Bi-Polar Stacked Bar
Vertical Percent Bar
Horizontal Percent Bar
Vertical Histogram
Horizontal Histogram
Vertical Waterfall
Horizontal Waterfall
Multi-3Y Bar
Multi-5Y Bar
Multi-4Y Bar
Error Bar
Reference: Pie Chart Types
The following table lists the available pie chart types.
Available Pie Chart Types
Multi Pie
Multi Ring Pie
Multi Proportional Pie
Multi Proportional Ring Pie
Single Pie
Single Ring Pie
Pie-Bar
Ring Pie-Bar
Reference: Line Chart Types
The following table lists the available line chart types.
Available Line Chart Types
Vertical Absolute Line
170
Horizontal Absolute Line
WebFOCUS
5. Creating and Customizing Charts
Available Line Chart Types
Vertical Stacked Line
Horizontal Stacked Line
Vertical Dual-Axis Absolute Line
Horizontal Dual-Axis Absolute Line
Vertical Dual-Axis Stacked Line
Horizontal Dual-Axis Stacked Line
Vertical Bi-Polar Absolute Line
Horizontal Bi-Polar Absolute Line
Vertical Bi-Polar Stacked Line
Horizontal Bi-Polar Stacked Line
Vertical Percent Line
Horizontal Percent Line
Radar Line
Reference: Area Chart Types
The following table lists the available area chart types.
Available Area Chart Types
Vertical Absolute Area
Horizontal Absolute Area
Vertical Stacked Area
Horizontal Stacked Area
Vertical Bi-Polar Absolute Area
Horizontal Bi-Polar Absolute Area
Vertical Bi-Polar Stacked Area
Horizontal Bi-Polar Stacked Area
Vertical Percent Area
Horizontal Percent Area
Radar Area
Reference: XY Plot Chart Types
The following table lists the available XY plot chart types.
Available XY Plot Chart Types
XY Scatter
XY Polar
Bubble
WebFOCUS InfoAssist User's Manual
171
Selecting a Chart Type
Reference: 3D Chart Types
The following table lists the available 3D chart types.
Available 3D Chart Types
3D Bar
3D Pyramid
3D Octagon
3D Cylinder
3D Floating Cubes
3D Floating Pyramids
3D Connected Series Area
3D Connected Series Ribbon
3D Connected Group Area
3D Connected Group Ribbon
3D Cone
3D Sphere
3D Surface
3D Surface with Sides
3D Smooth Surface
3D Smooth Surface with Sides
3D Honeycomb Surface
Reference: Stock Chart Types
The following table lists the available stock chart types.
Available Stock Chart Types
Stock Hi-Lo
Stock Hi-Lo with Volume
Stock Hi-Lo Open-Close
Stock Hi-Lo Open-Close with Volume
Open-Hi-Lo-Close Candle Stock
Open-Hi-Lo-Close Candle Stock with
Volume
Reference: Special Chart Types
The following table lists the special chart types that are available to you.
Special Chart Types
Gauge
172
Gauge Thermometer
WebFOCUS
5. Creating and Customizing Charts
Special Chart Types
Pareto
Funnel
Vertical Box plot
Horizontal Box plot
Pyramid
Spectral Map
Using Custom Chart Features
How to:
Rotate a Chart
Display Reference Lines
Display Annotations
Display Grid Lines
Display Trendlines
Customize the Display of Axis Labels
Customize the Display of Legend Labels
Display Data Labels
Customize the Display of Markers
Display Smooth Lines
Your presentation of data on a chart is successful when it communicates to your audience
the message that is intended. InfoAssist helps you meet the needs of your audience and
convey your message by providing numerous chart features. For example, you can adjust
the appearance of a chart, add layers of information, or customize the labels that identify
the data that is displayed.
Note: The following custom chart features are only available to charts that are being output
in HTML, PDF, Excel 2000, or PowerPoint format.
You can use the following custom features when creating charts with a compatible output
format.
Rotate the orientation of a chart. For details, see How to Rotate a Chart on page 174.
Add reference lines to a chart. For details, see How to Display Reference Lines on page
175.
WebFOCUS InfoAssist User's Manual
173
Using Custom Chart Features
Add annotations to a chart. For details, see How to Display Annotations on page 178.
Change the display of grid lines on a chart. For details, see How to Display Grid Lines on
page 179.
Add a trendline to a chart. For details, see How to Display Trendlines on page 180.
Customize the display of axis labels on a chart. For details, see How to Customize the
Display of Axis Labels on page 182.
Customize the display of legend labels on a chart. For details, see How to Customize the
Display of Legend Labels on page 183.
Add data labels to a chart. For details, see How to Display Data Labels on page 185.
Customize the display of markers on line and scatter chart types. For details, see How
to Customize the Display of Markers on page 186.
Display line charts using smooth lines. For details, see How to Display Smooth Lines on
page 188.
After you have designed a chart with the desired custom features, you can make it more
meaningful by adding a page heading and page footing. For details, see Adding a Page
Heading and Page Footing to a Chart on page 189.
Procedure: How to Rotate a Chart
You can rotate bar, line, and area chart types to change the orientation of the data.
1. Create a chart.
2. Click the Format tab in the Control Panel.
3. Click Rotate in the Features group.
4. Run the report.
174
WebFOCUS
5. Creating and Customizing Charts
The chart is rotated 90 degrees clockwise. The following is an example of a bar chart
that is rotated.
Procedure: How to Display Reference Lines
Reference lines draw attention to specific data locations on a chart. You can add up to three
horizontal (X-axis) and three vertical (Y-axis) reference lines to a chart.
1. Create a chart.
2. Click the Format tab in the Control Panel.
3. Click Reference in the Features group.
4. In the drop-down menu that opens, click one of the following:
Add Reference Line to Y-Axis
Add Reference Line to X-Axis
WebFOCUS InfoAssist User's Manual
175
Using Custom Chart Features
The Reference Line dialog box opens, as shown in the following image.
5. In the Value field, type the specific X-axis value or Y-axis value that indicates where to
display the reference line.
6. In the Text field, type the desired text for the reference line.
7. In the Position drop-down menu, click the desired position of the reference line on the
chart.
The choices are Above Center (the default), Above Left, Above Right, Below Center,
Below Left, and Below Right, as shown in the following image.
8. Set the desired Color, Weight, and Style values for the reference line.
The choices for Weight are 1px - Light (the default), 2px - Medium, and 3px - Heavy.
176
WebFOCUS
5. Creating and Customizing Charts
The choices for Style are Solid (the default), Dots, Many Dots, Dashed, Dashed Dots,
Long Dash, and Mixed Dashes, as shown in the following image.
Clicking Color opens the Color dialog box, where you can select a standard or custom
color. The selected color is applied to both the reference line and the text.
9. Click OK to save the values that you supplied and close the Reference Line dialog box.
10. Run the report.
The reference line is added to the chart. The following is an example of a bar chart with
a Y-axis reference line. The reference line was added by typing 10000000 in the Value
field, and Top Selling Product in the Text field. The reference line uses the default Above
Center setting for Position.
WebFOCUS InfoAssist User's Manual
177
Using Custom Chart Features
Procedure: How to Display Annotations
Annotations are explanatory notes or comments. You can add up to eight annotations on a
chart.
1. Create a chart.
2. Click the Format tab in the Control Panel.
3. Click Annotate in the Features group.
4. In the drop-down menu that opens, click Add an annotation.
The Annotation dialog box opens, as shown in the following image.
5. In the text input field, type the desired text for the annotation.
6. In the Position drop-down menu, click the desired position for the annotation on the
chart.
The choices are Top Left, Top Middle, Top Right, Middle Left (the default), Middle Right,
Bottom Left, Bottom Middle, and Bottom Right, as shown in the following image.
7. Click OK to save the values that you supplied and close the Annotation dialog box.
8. Run the report.
178
WebFOCUS
5. Creating and Customizing Charts
The annotation is added to the chart. The following is an example of a bar chart with an
annotation.
Procedure: How to Display Grid Lines
You can add O1 Minor Gridlines and Y1 Minor Gridlines to the O1 Major Gridlines and Y1
Major Gridlines that are displayed by default on a chart.
1. Create a chart.
2. Click the Format tab in the Control Panel.
3. Click Grid lines in the Features group.
4. In the drop-down menu that opens, select or deselect any of the grid line options.
The O1 Minor Gridlines and Y1 Minor Gridlines options are deselected by default, and
the O1 Major Gridlines and Y1 Major Gridlines options are selected by default.
You can deselect any of the grid lines, including the default grid lines. Deselected grid
lines do not display on the chart.
5. To select or deselect other grid line options, repeat steps 3 and 4.
6. Run the report.
WebFOCUS InfoAssist User's Manual
179
Using Custom Chart Features
The selected grid lines are added to the chart, and any deselected grid lines are removed.
The following is an example of a bar chart that displays O1 Minor Gridlines and Y1 Minor
Gridlines and the default grid lines, O1 Major Gridlines and Y1 Major Gridlines.
Procedure: How to Display Trendlines
A trendline is a line that is drawn over the plot area of a chart to show the pattern of the
data points. The pattern reveals a statistical trend.
1. Create a chart.
2. Click the Series tab in the Control Panel.
3. Click Trendline in the Properties group.
180
WebFOCUS
5. Creating and Customizing Charts
4. In the Trendline drop-down menu that opens, click the type of trendline that you want
to display. The choices are None (the default), Linear, Quadratic, Polynomial, Hyperbolic,
Logarithmic, Modified Hyperbolic, Rational, Exponential, Modified Exponential, Log
Quadratic, and Geometric, as shown in the following image.
5. Optionally, to display the mathematical equation for the selected trendline option, click
Equation in the Properties group of the Series tab.
6. Run the report.
The chart displays the selected trendline option. The following image shows a trendline
that is displayed with the Linear option. The mathematical equation for the option is
displayed above the trendline.
WebFOCUS InfoAssist User's Manual
181
Using Custom Chart Features
Procedure: How to Customize the Display of Axis Labels
You can display, hide, stagger, and rotate both the X-Axis (O1) labels and the Y-Axis (Y1)
labels by making selections in the Axes drop-down menu.
1. Create a chart.
2. Click the Format tab in the Control Panel.
3. Click Axes in the Labels group.
4. In the drop-down menu that opens, select or deselect any of the following axis display
options:
Show O1-Axis Labels (selected by default)
Show Y1-Axis Labels (selected by default)
Stagger O1-Axis Labels
Stagger Y1-Axis Labels
Rotate O1-Axis Labels
Rotate Y1-Axis Labels
The two Rotate options provide a choice of None (the default value), 45, 90, and 270
degrees.
5. To select or deselect other axis display options, repeat steps 3 and 4.
6. Run the report.
182
WebFOCUS
5. Creating and Customizing Charts
The selected axis display options appear on the chart. The following is an example of
a bar chart with both the Rotate O1-Axis Labels and Rotate Y1-Axis Labels options
selected and set to 45 degrees.
Procedure: How to Customize the Display of Legend Labels
By default, when there are two or more measure fields in a report, the titles of the fields
automatically appear in a legend on the chart. You can specify the position of a legend on
a chart, or its orientation. You can also suppress the display of the legend.
1. Create a chart with two or more measure fields.
2. Click the Format tab in the Control Panel.
3. Click Legend in the Labels group.
4. In the drop-down menu that opens, do one of the following.
Select or deselect Show Legend.
WebFOCUS InfoAssist User's Manual
183
Using Custom Chart Features
Highlight Legend Position and click one of the available options. The choices for
positioning the chart legend are Auto (the default), Bottom, Right, Left, Top, Right
bottom, Right top, Left bottom, Bottom right, Top right, Bottom left, and Top left, as
shown in the following image.
Highlight Legend Orientation and click one of the available options. The choices are
Auto (the default), Vertical, and Horizontal.
5. To select or deselect other legend display options, repeat steps 3 and 4.
6. Run the report.
184
WebFOCUS
5. Creating and Customizing Charts
The selected legend display options appear on the chart. The following is an example
of a bar chart with the Legend Position set to Right bottom and the Legend Orientation
set to Vertical.
Procedure: How to Display Data Labels
You can display data labels (values) on a chart in a variety of ways.
1. Create a chart.
2. Click the Series tab in the Control Panel.
3. Click Data Labels in the Properties group to enable label display.
4. Click Data Position in the Properties group.
5. In the drop-down menu that opens, select one of the following data label display options:
Above (the default)
On top edge
Below top edge
Center
Base
6. Run the report.
WebFOCUS InfoAssist User's Manual
185
Using Custom Chart Features
The chart displays the selected data label option. The following image shows data labels
that are displayed using the Center display option.
Procedure: How to Customize the Display of Markers
By default, data markers are automatically displayed on line and scatter chart types. If a
line or scatter chart type contains more than one measure field, markers are also displayed
in the legend. You can change the default shape of the data and legend markers, to a shape
of your choice.
1. Create a chart for a line or scatter chart type.
2. Click the Series tab in the Control Panel.
3. From the drop-down list in the Select group, click the series (field) to which the marker
will apply.
4. Click Marker in the Line group.
186
WebFOCUS
5. Creating and Customizing Charts
5. In the marker drop-down menu that opens, click the desired marker shape. The options
are None, Square (the default), Circle, Diamond, Plus, Triangle Down, Triangle Up,
Triangle Right, Triangle Left, Pirate Plus, House, Hexagon, Fat X, Five Star, Six Star,
Hourglass, Sideways Hourglass, and Line, as shown in the following image.
6. If applicable, repeat steps 3, 4, and 5 to select different markers for other series in the
report.
7. Run the report.
WebFOCUS InfoAssist User's Manual
187
Using Custom Chart Features
The chart displays the selected marker shapes. The following image shows the Square
marker for Dollar Sales, and the Circle marker for Quantity. The markers are used to
display points of data on the line chart. They are also used in the legend to identify the
data that is displayed.
Procedure: How to Display Smooth Lines
1. Create a chart and do one of the following.
Click the Format tab, and click Line in the Chart Types group.
In any type of chart, click the numeric measure field in the Query Design pane, click
the Series tab, click Type in the Properties group, and click Line. Use this technique
to create a combination chart that displays different types of chart data (for example,
bar or line) for different measure fields.
2. Click the Series tab, and click Smooth Line in the Line group.
3. Run the report.
188
WebFOCUS
5. Creating and Customizing Charts
In the following combination chart, the Line type and smooth lines were applied to the
Dollar Sales field. The Bar type was applied to the Quantity field.
Adding a Page Heading and Page Footing to a Chart
How to:
Add a Page Heading and Page Footing to a Chart
Control the Rendering of a Page Heading and Page Footing
Page headings and page footings supply context and key information about a chart, such
as its purpose, audience, and author. Page headings and page footings also enhance visual
appeal.
The first procedure in this topic describes how to add a page heading and page footing to
a chart. The second procedure describes how to control the way in which a page heading
and page footing are rendered on a chart at run time. This is an optional feature that extends
your capabilities when working with page headings and page footings.
Procedure: How to Add a Page Heading and Page Footing to a Chart
In this procedure, you will add and style a page heading and page footing. The procedure
uses sample values, but you can supply values that apply to your own charts.
This feature is available in Query Design view, Interactive Design view, and Document view.
WebFOCUS InfoAssist User's Manual
189
Adding a Page Heading and Page Footing to a Chart
1. With your chart open, click the Head/Foot button in the Report group of the Home tab.
The Heading & Footing dialog box opens.
2. Click the tab for the page heading or page footing, depending on which you want to add.
By default, the Page Heading tab is selected. In this procedure, accept the default to
add a page heading first.
Tip: Another way to access the Heading & Footing dialog box is to click the arrow next
to the Head/Foot button. It opens a drop-down menu from which you can select the
heading or footing that you want to work with. After you make your selection, the Heading
& Footing dialog box opens, and the heading or footing that you selected is active.
3. Click inside the design area of the dialog box, and type the text for the page heading.
For example, the text for a sample page heading might be Dollar Sales for Selected
Products.
4. Using the styling options, apply styling to the page heading text.
For example, click the arrow next to the font type field, and click HELVETICA. Click 10
for the font size. Click the Left justification icon to align the page heading on the left
when the chart is run.
A sample page heading with the selected styling values is shown in the following image.
5. Click Apply to save the changes that you have made so far, without closing the dialog
box.
6. To add a page footing, click the Page Footing tab.
In this procedure, you are going to add one of the supplied quick text options, followed
by some text of your own.
190
WebFOCUS
5. Creating and Customizing Charts
7. Click the down arrow next to the preformatted text icon, and click Created by from the
drop-down list, as shown in the following image.
8. Complete the text by typing the applicable value within the supplied text, for example,
Created By Sales Manager.
9. Change the styling as desired.
10. Click OK to save the page heading and page footing and close the Heading & Footing
dialog box.
11. Run the report. The chart contains the page heading and page footing that you added
and styled, as shown in the following image.
12. To make changes to either the page heading or page footing, return to design view.
Right-click the heading or footing, and click Edit from the drop-down menu.
WebFOCUS InfoAssist User's Manual
191
Adding a Page Heading and Page Footing to a Chart
Procedure: How to Control the Rendering of a Page Heading and Page Footing
You can control the way in which a page heading and page footing are rendered on a chart
at run time.
1. Open your chart in the desired view.
2. Open the Heading & Footing dialog box, as described in How to Add a Page Heading and
Page Footing to a Chart on page 189.
3. Click the Text options for chart
icon on the styling ribbon.
A drop-down menu opens, with two options for rendering the page heading and page
footing.
Tip: Your choice for a page heading will also apply to a page footing, and vice versa.
Create Heading and Footing as text renders the heading and footing as text
elements that are separate from the chart image. This is the default value.
Embed Heading and Footing in the chart renders the heading and footing text as
part of the chart image.
In the following example, the option for embedding the page heading and page footing
in the chart is selected.
4. Click OK to save your selection and close the Heading & Footing dialog box.
192
WebFOCUS
5. Creating and Customizing Charts
Designing a Chart in Active Preview
In this section:
Chart Elements
Customizing a Series
Customizing the Background and Frame
Customizing the Grid Lines
Customizing the Axis Labels
Customizing the Axis Titles
Customizing the Legend
In Interactive Design view, the canvas on the right of the window provides a preview of the
report that you are creating or modifying. For charts, the preview is called active because
the chart image is live, not static. InfoAssist can recognize and quickly process your mouse
actions on the chart.
In active preview, when you move the mouse over a graph element (legend, axis label, title)
the bounding area will be highlighted with a dotted line, as shown in the following image
where the legend is highlighted.
WebFOCUS InfoAssist User's Manual
193
Designing a Chart in Active Preview
In active preview, when you select a graph element (legend, axis label, title) the bounding
area will be highlighted with a solid line, as shown in the following image where the legend
is highlighted.
In active preview, right-clicking an element on a chart opens a pop-up menu with the design
options that are available for that element. Once you have made a choice from the menu,
InfoAssist applies it to the chart element, so that you see the result right away. In InfoAssist,
the pop-up menus in active preview for charts are called right-click menus.
194
WebFOCUS
5. Creating and Customizing Charts
This image shows an active preview of a bar chart in Interactive Design view. In this example,
the right-click menu for a series (field) element is displayed.
Right-click menus are enabled for charts that are generated with either sample data or live
data from your data source.
The following topics describe the chart elements and right-click menus that you can work
with to design your charts in active preview.
WebFOCUS InfoAssist User's Manual
195
Designing a Chart in Active Preview
Chart Elements
This diagram identifies many of the key elements that you can customize on a chart. The
elements that are shown are included on a default vertical bar chart. Depending on the type
of chart that you are creating, the elements and their associated right-click menu options
will vary.
You can customize optional elements on a chart, that is, elements that are not included by
default. For example, you can draw minor grid lines on a bar chart and customize them,
using the options on the minor grid line right-click menu. For instructions on drawing minor
grid lines, see How to Display Grid Lines on page 179.
196
WebFOCUS
5. Creating and Customizing Charts
Customizing a Series
How to:
Display Measure Data on a Chart Using Aggregation Values
Apply Traffic Light Conditional Styling to a Chart
Suppress the Display of a Series
Control the Color Mode
A series is a data source field that is included in a chart. You can customize a series in a
number of ways.
When you right-click a series on a chart in Interactive Design view, a menu similar to the
following is displayed.
Tip: The options that you see on the menu depend on the type of chart that you are creating.
For example, you do not see Series Type for a pie chart, but you do see it for a bar, line,
and area chart.
WebFOCUS InfoAssist User's Manual
197
Designing a Chart in Active Preview
The options on the menu are described in the following table.
Option
Description
Filter Values
Enables you to create or modify a WHERE statement, using
the Filter dialog box. With a WHERE statement, you select only
the data that you want to display, and exclude unwanted data.
For information on filtering your data, see Using the Data Tab
on page 57 and Using the Field Tab on page 72.
Prompt for Values
Enables you to create an auto-prompt parameter, using the
Filter dialog box. With this type of parameter, you are prompted
for a value for a data source field when you run a report. The
output displays information only for the field value that you
choose.
For information on creating an auto-prompt parameter, see
Using the Field Tab on page 72.
Aggregation Functions
Assigns an aggregation value to a numeric measure field in a
report. Aggregation values include the following:
None (the default), Sum, Average, Count, Percent of Count,
First Value, Last Value, Maximum, Minimum, Total, Percent,
Row Percent, Average Square
For instructions, see How to Display Measure Data on a Chart
Using Aggregation Values on page 200.
Traffic Light Conditions
Enables you to specify the color of numeric measure fields in
the output, depending on conditions that you set. By default,
a chart displays values that satisfy the first condition in green
and values that satisfy the second condition in red. You use
the Traffic Light Condition dialog box to specify the conditions
and colors.
For instructions, see How to Apply Traffic Light Conditional
Styling to a Chart on page 201.
Visibility
Controls the display of the selected series (field) on a chart.
The value Hide suppresses the display of the series, and the
default value Show displays the series.
For instructions, see How to Suppress the Display of a Series
on page 204.
198
WebFOCUS
5. Creating and Customizing Charts
Option
Description
Change Title
Enables you to edit the title of the selected series. On the
Edit Title dialog box, type the new title in the Enter Title field
and click OK.
Series Type
Changes the chart type of the selected series to Bar, Line, or
Area. The option None (the default) returns the series to the
chart type that was in effect before you changed it.
This option applies to bar, line, and area chart types only.
Series Color
Enables you to specify the color of the selected series, using
the Color dialog box. For information on the Color dialog box,
see How to Customize the Background Color on page 209.
Data Labels
Controls the display of data labels (values) on the selected
series. The default value Hide suppresses the display of
labels, and the value Show displays labels.
This option does not apply to the gauge chart type.
Color Mode
Controls how color is applied to a series (measure field) on a
chart. The possible settings are By Series (the default) and
By Group. For example, assume that there is only one series
on a sample bar chart. The By Series setting applies the same
color to all the bars in the series. The By Group setting applies
a different color to each bar.
For instructions and sample output based on each setting,
see How to Control the Color Mode on page 205.
Add Trendline
Draws a line on a chart to indicate a statistical trend. You can
choose from the following types of trendlines:
None (the default), Linear, Quadratic, Polynomial, Hyperbolic,
Logarithmic, Modified Hyperbolic, Rational, Exponential,
Modified Exponential, Log Quadratic, Geometric
This option does not apply to the pie, funnel, 3D, gauge, or
stock chart type.
For an example of a chart with a trendline, see How to Display
Trendlines on page 180.
Delete
WebFOCUS InfoAssist User's Manual
Removes the selected series from the report and updates the
active preview accordingly.
199
Designing a Chart in Active Preview
Procedure: How to Display Measure Data on a Chart Using Aggregation Values
You can display numeric measure data using a variety of aggregation values.
1. In Interactive Design view, right-click a series on your chart to display a menu of design
options.
2. Highlight Aggregation Functions.
3. In the Aggregation Functions drop-down menu that opens, click the desired aggregation
value.
The choices are None (the default), Sum, Average, Count, Percent of Count, First Value,
Last Value, Maximum, Minimum, Total, Percent, Row Percent, and Average Square, as
shown in the following image.
If you change the Measure (Sum) field container in the Query Design pane from Sum to
Print, Count, or List, the change overrides all assigned aggregation values.
4. Run the report.
200
WebFOCUS
5. Creating and Customizing Charts
In the following image, the aggregation value of Maximum (MAX) was applied to Unit
Sales, and the value of Average (AVE) was applied to Dollar Sales.
Procedure: How to Apply Traffic Light Conditional Styling to a Chart
You can apply traffic light conditional styling to a selected numeric measure field on a chart.
By default, the chart displays the values that satisfy the first condition in green, and the
values that satisfy the second condition in red.
1. In Interactive Design view, right-click a series on your chart to open a menu of design
options.
2. Click Traffic Lights Conditions.
The Traffic Light Condition dialog box opens, displaying the green light selection fields.
You can select and type green light criteria in these fields.
3. From the drop-down menu below the selected measure field name, click one of the
following relational operators:
Equal to
Not equal to
Greater than
Less than
Greater than or equal to
WebFOCUS InfoAssist User's Manual
201
Designing a Chart in Active Preview
Less than or equal to
4. In the field to the right of the operator drop-down menu, type the desired value for the
condition.
WebFOCUS will display data values that meet the criteria in green in the chart output.
Alternatively, you can click an option in the Values drop-down menu, and double-click
the desired data value in the Data Values dialog box that opens. As shown in the following
image, from the Values drop-down menu, you can click Fetch All Values from Source,
Fetch Values from Disk File, Fetch First Value in Source, Fetch Last Value in Source,
Fetch Minimum, or Fetch Maximum.
5. Click Add New.
The red light selection fields are displayed in the Traffic Light Condition dialog box, where
you can select and type red light criteria.
6. From the red light drop-down menu, click the desired relational operator.
7. In the field to the right of the red light drop-down menu, type the desired value for the
condition.
WebFOCUS will display data values that meet the criteria in red in the chart output.
Alternatively, you can click an option in the Values drop-down menu, and click the desired
value in the Data Values dialog box that opens.
202
WebFOCUS
5. Creating and Customizing Charts
The following image shows the Traffic Light Condition dialog box. It contains criteria to
display values for Unit Sales that are greater than or equal to 600000 in green, and
values for Unit Sales that are less than or equal to 599999 in red.
8. Click OK when you are ready to close the Traffic Light Condition dialog box.
In the Traffic Light Condition dialog box, you can perform the following actions.
To delete an existing traffic light condition, click the Delete button.
To apply styling and to change colors, click the Style button. In the Style pop-up menu
that opens, click the Font Color
icon to open the Color dialog box, where you can
select a color different from the default green and red colors that appear for the first
two conditions. When selecting colors, you can click a color square on the left side
of the dialog box, or click an area of the color palette on the right side of the dialog
box. You can also select colors by typing numbers in the Hue, Sat, and Lum fields,
or in the Red, Green, and Blue fields. You can also use the up and down arrows next
to each field to set numeric values.
To add more traffic light conditions, click Add New and select a different color for
each new condition that you specify.
9. Run the report.
The following image shows a sample bar chart, with traffic light conditional styling applied.
The Unit Sales data is displayed in either green or red, according to the criteria that was
specified in the Traffic Light Condition dialog box.
WebFOCUS InfoAssist User's Manual
203
Designing a Chart in Active Preview
The chart also displays data labels for each Unit Sales measure value.
Procedure: How to Suppress the Display of a Series
In this procedure, you will suppress the display of a series (field) in the chart output. For
this option to work correctly, the chart that you are designing must include more than one
series.
1. In Interactive Design view, right-click a series on your chart to open a menu of design
options.
2. Highlight Visibility.
A drop-down menu provides values for controlling the display of the selected series.
204
WebFOCUS
5. Creating and Customizing Charts
3. As shown in the following image, click Hide to remove the selected series from the
output.
4. Run the report. The hidden series is not displayed in the output.
Tip: You can restore the series to the output. One way to do that is to right-click the
name of the series in the Query Design pane in the Resources panel, highlight Visibility,
and click Show from the pop-up menu. Another way to restore the series is to use the
Hidden toggle in the Visibility group on the Field tab.
Procedure: How to Control the Color Mode
With the Color Mode option, you can control how color is applied to a series (measure field)
on a chart. The possible settings are By Series (the default) and By Group.
In this procedure, you will run a bar chart with a single series, using the default By Series
setting. Then you will run the same report, using the By Group setting.
1. In Interactive Design view, display a bar chart with a single series. Right-click a bar on
the chart to open a menu of design options.
2. Highlight Color Mode to display the available settings.
3. Accept the default setting, By Series, and run the report.
WebFOCUS InfoAssist User's Manual
205
Designing a Chart in Active Preview
In the following sample output, all the bars in the single-series report are displayed in
the same color.
4. Return to Interactive Design view, right-click a bar, highlight Color Mode, and click By
Group.
5. Run the report.
206
WebFOCUS
5. Creating and Customizing Charts
In the following sample output, each bar in the single-series report is displayed in a
different color.
Customizing the Background and Frame
How to:
Customize the Background Color
Remove 3D Depth From a Bar Chart
You can adjust the appearance of the background and frame to achieve a visual effect that
is different from the default.
The background of a chart is the area around the frame. By default, the background color
is white, which you can change. The background right-click menu also has an option to
restore the legend if you have chosen to suppress it.
WebFOCUS InfoAssist User's Manual
207
Designing a Chart in Active Preview
The following image shows the menu that is displayed when you right-click the background
of a bar chart.
The frame of a chart is the area that contains the plot points. It is also the area in which
horizontal and vertical grid lines are drawn. By default, the frame color is light gray, and
the frame depth is 3D. You can change the frame color and the depth.
The following image shows the menu that is displayed when you right-click a frame on a
bar chart. In the image, the Show 3D option is On (the default).
The frame element does not apply to the pie, 3D, spectral map, or pareto chart type.
208
WebFOCUS
5. Creating and Customizing Charts
The options for the background and frame elements are described in the following table.
Element
Option
Description
Background
Background Color
Enables you to specify the color of the
background, using the Color dialog box. For
instructions, see How to Customize the
Background Color on page 209.
Show legend
Controls the display of the legend on the
background. When selected, it displays the
legend. When deselected, it suppresses the
display of the legend.
Frame Color
Enables you to specify the color of the frame,
using the Color dialog box.
Show 3D
Controls the depth of the frame. The default
value On renders the frame in 3D depth. The
value Off renders the frame in one dimension.
Frame
For instructions, see How to Remove 3D Depth
From a Bar Chart on page 211.
Procedure: How to Customize the Background Color
In this procedure, you will change the color of the background of a chart from white (the
default), to a color of your choice.
1. In Interactive Design view, right-click the background of your chart.
The following menu is displayed.
2. Click Background Color.
The Color dialog box opens.
3. Select the color of your choice.
WebFOCUS InfoAssist User's Manual
209
Designing a Chart in Active Preview
When selecting colors, you can click a color square on the left side of the dialog box,
or click an area of the color palette on the right side of the dialog box. You can also
select colors by typing numbers in the Hue, Sat, and Lum fields, or in the Red, Green,
and Blue fields. You can also use the up and down arrows next to each field to set
numeric values.
In the following image, a shade of yellow has been selected.
4. Click OK on the Color dialog box after you have made your selection.
5. In Interactive Design view, the new background color is reflected on the chart, as shown
in the following example.
210
WebFOCUS
5. Creating and Customizing Charts
Procedure: How to Remove 3D Depth From a Bar Chart
3D depth for bar charts is enabled by default. In this procedure, you will remove 3D depth
from a default vertical bar chart, using the frame right-click menu.
1. In Interactive Design view, right-click the frame of a bar chart to open a menu of design
options.
2. Highlight Show 3D.
3. From the drop-down menu, click Off, as shown in the following image.
4. In Interactive Design view, the bar chart is no longer displayed in 3D depth, as shown
in the following example.
WebFOCUS InfoAssist User's Manual
211
Designing a Chart in Active Preview
Customizing the Grid Lines
A chart can contain several types of grid lines. All grid lines are drawn across the entire
region of the chart.
Minor grid lines supplement major grid lines. If a plot point falls in between major grid lines,
you can use minor grid lines for more precise interpretation of the data.
For information on adding grid lines to a chart, or removing them, see How to Display Grid
Lines on page 179.
Horizontal major grid lines enhance the display of values, compared to the Y-axis scale
alone. They are enabled by default. They do not apply to the pie, 3D, gauge, spectral
map, or funnel chart type.
Horizontal minor grid lines are disabled by default. They do not apply to the pie, 3D,
gauge, spectral map, or funnel chart type.
Vertical major grid lines (ordinal axis) enhance the display of values, compared to the
X-axis scale alone. They are enabled by default. They do not apply to the pie, 3D, gauge,
spectral map, or funnel chart type.
Vertical minor grid lines (ordinal axis) are disabled by default. They do not apply to the
pie, 3D, gauge, spectral map, or funnel chart type.
Vertical major grid lines (numeric axis) enhance the display of values, compared to the
X-axis scale alone. They are enabled by default. They apply only to scatter and bubble
chart types, where the X-axis is numeric.
Vertical minor grid lines (numeric axis) are disabled by default. They apply only to scatter
and bubble chart types, where the X-axis is numeric.
Using the applicable right-click menu, you can remove any type of grid line or change its
color.
212
WebFOCUS
5. Creating and Customizing Charts
The following image shows the menu that is displayed when you right-click any type of grid
line on a chart. In this example, a vertical major grid line is selected.
The options for the grid line elements are described in the following table.
Element
Option
Description
Horizontal Major Grid Lines
Delete
Removes the grid line from the chart
and updates the active preview
accordingly.
Set Line
Color
Enables you to specify the color of
the grid line, using the Color dialog
box.
Horizontal Minor Grid Lines
Vertical Major Grid Lines (Ordinal
Axis)
Vertical Minor Grid Lines (Ordinal
Axis)
Vertical Major Grid Lines (Numeric
Axis)
Vertical Minor Grid Lines (Numeric
Axis)
Customizing the Axis Labels
A chart can contain the following types of axis labels.
O1-axis labels are also called the ordinal axis labels. They do not apply to the scatter,
bubble, pie, funnel, or gauge chart type.
WebFOCUS InfoAssist User's Manual
213
Designing a Chart in Active Preview
Y1-axis labels represent a numeric scale, usually located on the left side of a vertical
chart.
Y2-axis labels represent a numeric scale, usually located on the right side of a vertical
chart with dual axes or multiple axes. The features that apply to Y2-axis labels also apply
to Y3-axis, Y4-axis, and Y5-axis labels.
X1-axis labels appear on chart types such as scatter and bubble, where the X-axis scale
is numeric.
Using the applicable right-click menu, you can delete, stagger, rotate, and style any type of
axis label. You can also format any type of axis label except the O1-axis label.
The following image shows the menu that is displayed when you right-click a Y1-axis label
on a chart.
214
WebFOCUS
5. Creating and Customizing Charts
The options for the axis label elements are described in the following table. For an example
of a chart with customized axis labels, see How to Customize the Display of Axis Labels on
page 182.
Element
Option
Description
O1-Axis Labels
Delete
Removes the labels from the chart and updates the
active preview accordingly.
Stagger
Controls the positioning of the labels. The On value
positions the labels in a zigzag pattern. The Off
default value positions the labels in a straight row.
Rotate
Rotates the labels a specified number of degrees:
None (the default), 45, 90, or 270.
Style Labels
Enables you to apply styling to the labels, using the
Style dialog box. You can specify font name, font
size, font style (bold, italic, underline), text
justification (left, center, right), and font color, or
reset the styling to the default.
WebFOCUS InfoAssist User's Manual
215
Designing a Chart in Active Preview
Element
Option
Description
Y1-Axis Labels
Delete
Removes the labels from the chart and updates the
active preview accordingly.
Stagger
Controls the positioning of the labels. The On value
positions the labels in a zigzag pattern. The Off
default value positions the labels in a straight row.
Rotate
Rotates the labels a specified number of degrees:
None (the default), 45, 90, or 270.
Format Labels
Formats the labels according to the value that you
specify:
Y2-Axis Labels
X1-Axis Labels
General (the default), No decimal, Percent with no
decimal, Percent with one decimal, Percent with two
decimals, Currency general, Currency with no
decimal, General in thousands, Currency in
thousands, General in millions, Currency in millions,
General in billions, Currency in billions, General in
trillions, Currency in trillions, Thousands separator
no decimal, Thousands separator two decimals,
Date short, Date medium, Date long, Date full,
Percent with no decimal/100, Percent with one
decimal/100, Percent with two decimals/100.
Style Labels
Enables you to apply styling to the labels, using the
Style dialog box. You can specify font name, font
size, font style (bold, italic, underline), text
justification (left, center, right), and font color, or
reset the styling to the default.
Customizing the Axis Titles
How to:
Change the Text for the O1-Axis Title
A chart can contain the following types of axis titles.
The O1-axis title represents the name of a sort field in a chart.
216
WebFOCUS
5. Creating and Customizing Charts
The Y1-axis title represents the name of a measure field in a chart. By default, when
there is a single measure field in the report, the title appears on the Y-axis of the chart.
When there is more than one measure field, the titles of the fields appear in the legend.
The Y2-axis title represents the name of a measure field that is placed on the Y2-axis.
A Y2-axis title applies only to charts with dual axes or multiple axes.
The X1-axis title represents the name of a sort field when the X-axis is numeric. An X1-axis
title applies only to scatter, bubble, and XY polar chart types.
Using the applicable right-click menu, you can delete any type of title, change the text for
the title, or style the title.
The following image shows the menu that is displayed when you right-click the O1-axis title
on a chart.
WebFOCUS InfoAssist User's Manual
217
Designing a Chart in Active Preview
The options for the title elements are described in the following table.
Element
Option
Description
O1-Axis Title
Delete
Removes the selected title from the chart and
updates the active preview accordingly.
Change Title
Enables you to edit the selected title.
Y1-Axis Title
Y2-Axis Title
For instructions, see How to Change the Text for the
O1-Axis Title on page 218.
X1-Axis Title
Style Title
Enables you to apply styling to the selected title,
using the Style dialog box. You can specify font
name, font size, font style (bold, italic, underline),
text justification (left, center, right), and font color,
or reset the styling to the default.
Procedure: How to Change the Text for the O1-Axis Title
In this procedure, you will change the default text for the O1-axis title. The default text is
the name of a sort field in the chart.
1. In Interactive Design view, right-click the O1-axis title on your chart to open a menu of
design options.
218
WebFOCUS
5. Creating and Customizing Charts
2. Click Change Title, as shown in the following image.
The Edit Title dialog box opens.
3. In the Enter Title field, type the new text for the title, and click OK.
In this example, the new text is SALES TERRITORIES.
WebFOCUS InfoAssist User's Manual
219
Designing a Chart in Active Preview
4. In Interactive Design view, the new text is displayed, as shown in the following example.
Customizing the Legend
The legend contains information that is necessary to accurately interpret the data on a chart.
By default, a chart displays either a Y1-axis title if there is a single measure field, or a legend
if there are multiple measure fields.
The following image shows the menu that is displayed when you right-click a legend on a
chart.
220
WebFOCUS
5. Creating and Customizing Charts
If you right-click the background area around the legend, two additional options are available:
Legend Area Color and Legend Border Color. All the options for the legend element are
described in the following table.
Option
Description
Show Legend
Controls the display of the legend. When you check this option (the
default), InfoAssist displays the legend. When you deselect this
option, InfoAssist suppresses the display of the legend.
The background right-click menu has an option to restore the legend
after it has been suppressed.
Legend Position
Controls the placement of the legend on the chart. Possible values
are:
Auto (the default), Bottom, Right, Left, Top, Right bottom, Right
top, Left bottom, Bottom right, Top right, Bottom left, Top left
For an example of a customized legend, see How to Customize the
Display of Legend Labels on page 183.
Legend Orientation
Controls the orientation of the legend on the chart. Possible values
are:
Auto (the default), Vertical, Horizontal
For an example of a customized legend, see How to Customize the
Display of Legend Labels on page 183.
Legend Area Color
Enables you to specify the color of the legend background area,
using the Color dialog box.
This option is available only when you right-click the area around
the legend.
Legend Border
Color
Enables you to specify the color of the border around the legend
background area, using the Color dialog box.
This option is available only when you right-click the area around
the legend.
WebFOCUS InfoAssist User's Manual
221
Designing a Chart in Active Preview
222
WebFOCUS
WebFOCUS
6
Using Document View and Building Compound
Documents
Designing documents in Document view
allows you to add text, images, active
form controls, reports, and charts to
create compound documents that can
be used to generate presentation-ready
reports based on your data. Document
view combines the features of report
building with the ability to style and
present customized documents.
WebFOCUS InfoAssist User's Manual
Topics:
Accessing Document View
Building a Compound Document
Adding Active Technologies Form
Controls to a Compound Document
223
Accessing Document View
Accessing Document View
How to:
Access Document View to Build a New Compound Document
Access Document View By Opening an Existing Item From the Splash Screen
Access Document View By Opening an Existing Report From the Quick Access Toolbar
Access Document View From the Document Button on the Home and View Tabs
A blank InfoAssist canvas in Document view is shown in the following image.
In Document view you can:
Build a new Compound document.
Open an existing Compound document.
Generate a new Compound document from an existing single report.
Procedure: How to Access Document View to Build a New Compound Document
You can access Document view from the InfoAssist splash screen to create a new compound
document.
224
WebFOCUS
6. Using Document View and Building Compound Documents
Note: The following procedure assumes that the splash screen is set to display when
InfoAssist is started. If the splash screen is not the default and you would like to alter the
User Options, see Changing User Preferences on page 26. If the splash screen is turned off
and Document is selected as the Start Mode, you can begin the following procedure at step
3, otherwise this procedure cannot be used to create a new Compound document.
1. Open InfoAssist, as described in Launching InfoAssist on page 18.
After you launch InfoAssist, the splash screen appears.
2. Select Build a Document, as shown in the following image.
An Open dialog box appears.
3. Select a data source to begin your compound document. Click OK. InfoAssist opens a
new canvas in Document view.
Note: Compound documents can be built using more than one data source. The source
you select here is the one you will begin with, you can add more at any time. For more
information on adding additional data sources, see Using the Data Tab on page 57.
Procedure: How to Access Document View By Opening an Existing Item From the Splash Screen
You can access existing compound documents in Document view from the InfoAssist splash
screen.
Note: The following procedure assumes that Show splash screen is selected in the Options
dialog box. If the splash screen is not the default and you would like to alter the User Options,
see Changing User Preferences on page 26.
WebFOCUS InfoAssist User's Manual
225
Accessing Document View
1. Open InfoAssist, as described in Launching InfoAssist on page 18.
After you launch InfoAssist the splash screen appears.
2. Select Open Existing Item, as shown in the following image.
3. Select one of the compound documents, which are represented by the Document
icon.
226
WebFOCUS
6. Using Document View and Building Compound Documents
4. Click OK.
InfoAssist opens the compound document in Document view.
Note: If you select a single report in step 3, InfoAssist will open the report in either
Query Design view or Interactive Design view. To view a copy of the report in Document
view, refer to How to Access Document View From the Document Button on the Home
and View Tabs on page 228.
Procedure: How to Access Document View By Opening an Existing Report From the Quick Access
Toolbar
You can access existing compound documents in Document view from the InfoAssist Quick
Access Toolbar.
1. With InfoAssist open, select Open existing item
from the Quick Access Toolbar.
An Open dialog box appears, as shown in the following image.
2. Select one of the compound documents, which are represented by the Document
icon.
3. Click OK.
InfoAssist opens the compound document in Document view.
WebFOCUS InfoAssist User's Manual
227
Accessing Document View
Note: If you select a single report in step 2, InfoAssist will open the report in either
Query Design view or Interactive Design view. To view a copy of the report in Document
view, refer to How to Access Document View From the Document Button on the Home
and View Tabs on page 228.
Procedure: How to Access Document View From the Document Button on the Home and View
Tabs
With InfoAssist in Interactive Design view or Query Design view, you can access Document
view by selecting the Document button that is in the Design group. Accessing Document
view with this method creates a copy of the current single report as a compound document.
You can use this method to promote My Reports to Document view. You can also access
Document view in Reporting Objects by using the following steps.
Note: When a Reporting Object is promoted to Document view any reports and charts that
the Reporting Object has are all be added to the canvas.
The Design group is part of both the Home and View tabs and is shown in the following
image.
1. With an InfoAssist report open, select the Home or View tab in the Control Panel.
2. Select Document in the Design group.
228
WebFOCUS
6. Using Document View and Building Compound Documents
InfoAssist will enter Document view. To reflect this, the Document icon will be highlighted
in the Design group, and in the left corner of the Navigation taskbar. The following image
shows the highlighted Document icon.
Note: The single report you started with will still exist in the original view. Selecting
Document view while a single report is open does not convert the report to a compound
document. It makes a copy of the report, with the copy becoming a compound document
and the original remaining unchanged. You can switch between the new compound
document and the original report using the Switch Report button in the Report group on
the View tab of the Control Panel. For more information on switching between reports,
see Using the View Tab on page 66.
WebFOCUS InfoAssist User's Manual
229
Building a Compound Document
Building a Compound Document
In this section:
Creating a Compound Document From a Single Report
Inserting a Chart
Inserting a Report
Inserting Reports From Multiple Data Sources
Inserting an Existing Report
Inserting Text and Images
Editing Components in a Compound Document
Reference:
Output Format Options in Compound Documents
Document view allows you to build multiple reports and charts on the same canvas. The
styling, design, and report building functionality of Interactive Design view and Query Design
view is available in Document view, as well as additional features that simplify building
compound documents. You can build and insert multiple reports in the form of reports and
charts. You can also insert images and text for presentation and organizational purposes.
Creating a Compound Document From a Single Report
You can take a single report created in Interactive Design view or Query Design view and
convert it into a Compound document, displaying it in the Document view.
When you convert a single report into a compound document, the original report is preserved
and a copy of that report is opened as a compound document in Document view. You can
then add additional reports, charts, images, and text.
230
WebFOCUS
6. Using Document View and Building Compound Documents
Inserting a Chart
How to:
Insert a Chart With the Insert Tab
Insert a Chart With Drag and Drop
Insert a Chart With Double-Click
Insert a Chart With Right-Click
With InfoAssist opened in Document view, you can insert multiple charts and reports onto
the canvas. Following the procedures below, you can insert charts into new compound
documents and documents that are already populated with reports, text, and images.
In Document view, you can insert a chart in the following ways.
Use the Insert tab.
Drag and drop a data source field onto the canvas.
Double-click a data source field.
Right-click a data source field.
Note: Using the Insert tab, double-clicking a data source field, and right-clicking a data
source field will all result in a chart placeholder being inserted in the top-left corner of the
canvas. Dragging and dropping a data source field onto the canvas will insert the place
holder at the location you dropped the data source field.
The following procedures detail how to insert new charts. For more information on how to
edit existing charts, see How to Style and Customize a Chart on page 257.
Procedure: How to Insert a Chart With the Insert Tab
In Document view, you can insert charts in a number of ways. Inserting charts with the Insert
tab is unique to Document view. For more information on the Insert tab, see Using the Insert
Tab on page 48.
1. With InfoAssist open in the Document view, select the Insert tab from the Control Panel.
WebFOCUS InfoAssist User's Manual
231
Building a Compound Document
2. Select Chart in the Reports group, as shown in the following image.
A chart placeholder appears in the top-left corner of the canvas.
You can now add fields to the chart using the canvas and the Resources Panel. For
more information on how to use the Resources Panel to add additional fields to the
report, see Understanding the Resources Panel on page 85.
Procedure: How to Insert a Chart With Drag and Drop
In Document view, you can insert charts in a number of ways. Inserting charts by dragging
data source fields from the Resources panel onto the Layout Canvas can be accomplished
in both the Interactive Design view and Document view. To insert a chart, make sure that
Chart is selected in the Destination group of the Format tab. This option is also on the Home
tab, in the Format group.
1. With InfoAssist open in Document view, select the Format tab from the Control Panel.
2. Select Chart in the Destination group, as shown in the following image.
Note: Chart can also be selected from the Home tab, in the Format group.
3. Select a data source field from the Data pane in the Resources Panel and drag it onto
the Layout Canvas. Make sure that you drop the data source field onto an open area of
the canvas and not on top of another chart or report.
232
WebFOCUS
6. Using Document View and Building Compound Documents
A chart placeholder with the selected data source will appear in the Results panel, as
shown in the following image.
You can now add fields to the chart using the canvas and the Resources Panel. For
more information on how to use the Resources Panel to add additional fields to the
report, see Understanding the Resources Panel on page 85.
Procedure: How to Insert a Chart With Double-Click
In Document view, you can insert charts in a number of ways. Inserting charts by doubleclicking a data source field in the Resources panel can be accomplished in the Query Design
view, Interactive Design view, and Document view. To insert a chart, make sure that no
report is actively selected on the canvas and Chart is selected in the Destination group of
the Format tab. This option is also on the Home tab, in the Format group.
1. You cannot insert a new chart with a double-click if a report is actively selected. If a
report is selected, click the canvas to deselect the report and make the canvas the
active object.
2. Select the Format tab from the Control Panel.
WebFOCUS InfoAssist User's Manual
233
Building a Compound Document
3. Select Chart in the Destination group, as shown in the following image.
Note: Chart can also be selected from the Home tab, in the Format group.
4. Double-click a data source field in the Data pane of the Resources Panel.
A chart placeholder with the selected data source will appear in the Results panel, as
shown in the following image.
You can now add fields to the chart using the canvas and the Resources Panel. For
more information on how to use the Resources Panel to add additional fields to the
report, see Understanding the Resources Panel on page 85.
234
WebFOCUS
6. Using Document View and Building Compound Documents
Procedure: How to Insert a Chart With Right-Click
In Document view, you can insert charts in a number of ways. Inserting charts by right-clicking
a data source field in the Resources panel can be accomplished in the Query Design view,
Interactive Design view, and Document view. To insert a chart, make sure that no report is
actively selected on the canvas and Chart is selected in the Destination group of the Format
tab. This option is also on the Home tab, in the Format group.
1. You cannot insert a new chart with a right-click if a report is actively selected. If a report
is selected, click the canvas to deselect the report and make the canvas the active
object.
2. Select the Format tab from the Control Panel.
3. Select Chart in the Destination group, as shown in the following image.
Note: Chart can also be selected from the Home tab, in the Format group.
4. Right-click a data source field in the Data pane of the Resources Panel. A menu will
appear, as shown in the following image.
5. Select from the available right-click options, which are listed below.
Include as Measure - For measure (numeric) fields.
Include as Category Axis - For dimension (non-numeric or date) fields.
Include as Legend Series - For dimension (non-numeric or date) fields.
WebFOCUS InfoAssist User's Manual
235
Building a Compound Document
Filter - For all types of fields
Coordinated
Note: The Coordinated field container contains a common sort field for creating multiple
reports and graphs that are burst into separate page layouts. Each value for a coordinated
sort field displays on a separate page.
A chart placeholder with the selected data source will appear in the Results panel, as
shown in the following image.
Note: The chart placeholder will turn into a live preview of the chart once both X-axis
and Y-axis data fields are selected.
You can now add fields to the chart using the canvas and the Resources Panel. For
more information on how to use the Resources Panel to add additional fields to the
report, see Understanding the Resources Panel on page 85.
236
WebFOCUS
6. Using Document View and Building Compound Documents
Inserting a Report
How to:
Insert a Report With the Insert Tab
Insert a Report With Drag and Drop
Insert a Report With Double-Click
Insert a Report With Right-Click
With InfoAssist opened in Document view, you can insert multiple charts and reports onto
the canvas. Following the procedures below, you can insert reports into new compound
documents and documents that are already populated with reports, text, and images.
In Document view, you can insert a report in the following ways.
Use the Insert tab.
Drag and drop a data source field onto the canvas.
Double-click a data source field.
Right-click a data source field.
Note: Using the Insert tab, double-clicking a data source field, and right-clicking a data
source field will all result in a report placeholder being inserted in the top-left corner of the
canvas. Dragging and dropping a data source field onto the canvas will insert the place
holder at the location you dropped the data source field.
The following procedures detail how to insert new reports. For more information on how to
edit existing reports, see How to Style and Customize a Report on page 255.
Procedure: How to Insert a Report With the Insert Tab
In Document view, you can insert reports in a number of ways. Inserting reports with the
Insert tab is unique to Document view. For more information on the Insert tab, see Using
the Insert Tab on page 48.
1. With InfoAssist open in the Document view, select the Insert tab from the Control Panel.
WebFOCUS InfoAssist User's Manual
237
Building a Compound Document
2. Select Report in the Reports group, as shown in the following image.
A report placeholder will appear in the top-left corner of the canvas.
You can now add fields to the report using the canvas and the Resources Panel. For
more information on how to use the Resources Panel to add additional fields to the
report, see Understanding the Resources Panel on page 85.
Procedure: How to Insert a Report With Drag and Drop
In Document view, you can insert reports in a number of ways. Inserting reports by dragging
data source fields from the Resources panel onto the Layout Canvas can be accomplished
in both the Interactive Design view and Document view. To insert a report, make sure that
Report is selected in the Destination group of the Format tab. This option is also on the
Home tab, in the Format group.
1. With InfoAssist open in Document view, select the Format tab from the Control Panel.
2. Select Report in the Destination group, as shown in the following image.
Note: Report can also be selected from the Home tab, in the Format group.
3. Select a data source field from the Data pane in the Resources Panel and drag it onto
the Layout Canvas. Make sure that you drop the data source field onto an open area of
the canvas and not on top of another chart or report.
238
WebFOCUS
6. Using Document View and Building Compound Documents
A report with the selected data source will appear in the Results panel, as shown in the
following image.
You can now add fields to the report using the canvas and the Resources Panel. For
more information on how to use the Resources Panel to add additional fields to the
report, see Understanding the Resources Panel on page 85.
Procedure: How to Insert a Report With Double-Click
In Document view, you can insert reports in a number of ways. Inserting reports by doubleclicking a data source field in the Resources panel can be accomplished in the Query Design
view, Interactive Design view, and Document view. To insert a report, make sure that no
report is actively selected on the canvas and Report is selected in the Destination group of
the Format tab. This option is also on the Home tab, in the Format group.
1. You cannot insert a new report with a double-click if a report is actively selected. If a
report is selected, click the canvas to deselect the report and make the canvas the
active object.
2. Select the Format tab from the Control Panel.
3. Select Report in the Destination group, as shown in the following image.
Note: Report can also be selected from the Home tab, in the Format group.
WebFOCUS InfoAssist User's Manual
239
Building a Compound Document
4. Double-click a data source field in the Data pane of the Resources Panel.
A report with the selected data source will appear in the Results panel, as shown in the
following image.
You can now add fields to the report using the canvas and the Resources Panel. For
more information on how to use the Resources Panel to add additional fields to the
report, see Understanding the Resources Panel on page 85.
Procedure: How to Insert a Report With Right-Click
In Document view, you can insert reports in a number of ways. Inserting reports by rightclicking a data source field in the Resources panel can be accomplished in the Query Design
view, Interactive Design view, and Document view. To insert a report, make sure that no
report is actively selected on the canvas and Report is selected in the Destination group of
the Format tab. This option is also on the Home tab, in the Format group.
1. You cannot insert a new report with a right-click if a report is actively selected. If a report
is selected, click the canvas to deselect the report and make the canvas the active
object.
2. Select the Format tab from the Control Panel.
240
WebFOCUS
6. Using Document View and Building Compound Documents
3. Select Report in the Destination group, as shown in the following image.
Note: Report can also be selected from the Home tab, in the Format group.
4. Right-click a data source field in the Data pane of the Resources Panel.
A menu will appear, as shown in the following image.
5. Select from the available right-click options, which are listed below.
Sum
Sort
Across
Include as Coordinated
Filter
Slicers
WebFOCUS InfoAssist User's Manual
241
Building a Compound Document
A report with the selected data source will appear in the Results panel, as shown in the
following image.
You can now add fields to the report using the canvas and the Resources Panel. For
more information on how to use the Resources Panel to add additional fields to the
report, see Understanding the Resources Panel on page 85.
Inserting Reports From Multiple Data Sources
How to:
Insert Two Reports From Two Different Data Sources
With InfoAssist opened in Document view, you can insert multiple charts and reports onto
the canvas. These reports can be from different data sources. With compound documents,
you have the option to add additional data sources to the document.
In order to insert reports from different data sources, the compound document must have
multiple data sources loaded. For more information on adding and switching between data
sources, see Using the Data Tab on page 57.
Note: You do not have the ability to use multiple data sources when working with a Reporting
Object.
Procedure: How to Insert Two Reports From Two Different Data Sources
Compound documents have the ability to display multiple reports from multiple data sources
on the same document.
242
WebFOCUS
6. Using Document View and Building Compound Documents
1. With InfoAssist open in Document view, insert a chart or report following the instructions
in Building a Compound Document on page 230.
2. If your document has only one data source, insert additional data sources.
For more detailed instructions on inserting multiple data sources, see Using the Data
Tab on page 57.
3. Switch to a data source different than the one used in step 1.
For more detailed instructions on switching to a different data source, see Using the
Data Tab on page 57.
4. Insert a chart or report using this new data source, following the instructions given in
Building a Compound Document on page 230.
WebFOCUS InfoAssist User's Manual
243
Building a Compound Document
Your compound document is now populated with reports that have data from different
data sources. You can add as many data sources as you need.
Inserting an Existing Report
How to:
Insert an Existing Report With the Insert Tab
With InfoAssist opened in Document view, you can insert existing charts and reports onto
the canvas. Following the procedure below, you can insert reports into new compound
documents and documents that are already populated with reports, text, and images.
In Document view, you can insert a report from the Insert tab.
Procedure: How to Insert an Existing Report With the Insert Tab
You can create a document in the Custom Reports section of the domain, and use Standard
Reports items as Existing Report components. You cannot use other Custom Report items
as components.
1. With InfoAssist open in the Document view, select the Insert tab from the Control Panel.
2. Select Existing Report in the Reports group, as shown in the following image.
The Open dialog box will appear.
3. Browse to the report you want to insert and click OK.
The report will appear in the top-left corner of the canvas.
Resting the mouse on an existing report displays the report title as a ToolTip. You cannot
edit an existing report that is inserted into a compound document.
244
WebFOCUS
6. Using Document View and Building Compound Documents
Inserting Text and Images
How to:
Insert Text
Insert an Image
With InfoAssist opened in Document view, you can insert text and images onto the canvas.
Following the procedures below, you can insert text and images into new compound
documents and documents that are already populated with reports, text, and images. Inserting
text and images is a feature unique to Document view and cannot be done in Interactive
Design view or Query Design view.
The following procedures detail how to insert text and images. For more information on how
to edit existing text and images, see Editing Components in a Compound Document on page
248.
Procedure: How to Insert Text
1. With InfoAssist open in the Document view, select the Insert tab from the Control Panel.
2. Select Text in the Objects group, as shown in the following image.
WebFOCUS InfoAssist User's Manual
245
Building a Compound Document
A text component will appear in the top-left corner of the canvas with default text, as
shown in the following image.
3. Double-click or right-click the text component to edit the text.
For more information on editing and styling the text, see How to Edit Text on page 260.
Procedure: How to Insert an Image
1. With InfoAssist open in the Document view, select the Insert tab from the Control Panel.
2. Select Image in the Objects group, as shown in the following image.
246
WebFOCUS
6. Using Document View and Building Compound Documents
An Open dialog box appears, as shown in the following image.
3. Browse to the desired image and press OK.
The selected image will appear in the top-left corner of the canvas, as shown in the
following image.
WebFOCUS InfoAssist User's Manual
247
Building a Compound Document
Editing Components in a Compound Document
How to:
Resize a Component
Move a Component
Align Components
Style and Customize a Report
Style and Customize a Chart
Edit Text
Delete a Component
The reports, controls, and text on a compound document can be edited, moved, resized,
and deleted. Each of these components has a context menu which can be accessed by rightclicking the component. Images can be moved, resized, and deleted, but they have no context
menu and cannot be edited. Right-clicking a image will only bring up the option to delete it.
Procedure: How to Resize a Component
You can resize of a component by clicking it, changing the height and width from the Size &
Arrange group on the Layout tab, or by accessing the Size section of the Size and Position
dialog box. This feature is available for all components that can be added to a compound
document.
1. Open or create a compound document with at least one report, text component, control,
or image.
2. Click the component and resize it using one of the following methods:
248
WebFOCUS
6. Using Document View and Building Compound Documents
With a component selected, sizing handles appear around the component, as shown
in the following image.
Resize the component by dragging the sizing handles.
or
Right-click the component and select Size and Position.
WebFOCUS InfoAssist User's Manual
249
Building a Compound Document
Select Size from the left pane, as shown in the following image.
Use the Height and Width options to change the position of the selected component.
You can adjust the pixel size of the object with the Size options or the scale
percentage of the object with the Scale options.
or
With the component selected, change the size and width options from the Size &
Arrange group on the Layout tab, as shown in the following image.
You can lock the aspect ratio using the Aspect Ratio button. With the aspect ratio
locked changing the width will automatically change the height to keep the component
to scale and changing the height will automatically change the width.
250
WebFOCUS
6. Using Document View and Building Compound Documents
Note: The Auto Overflow option is available for reports through the Size & Arrange group
and the Size and Position dialog box. With Auto Overflow set you cannot manually set
the height and width of a report, the area of the report will expand automatically to show
all data.
The AutoFit option is available for reports through the Size & Arrange group and the Size
and Position dialog box. With AutoFit set reports will automatically grow to accommodate
newly added fields.
Procedure: How to Move a Component
You can move a component by clicking it or by accessing the Position section of the Size
and Position dialog box. This feature is available for all components that can be added to
a compound document. You can also align components with each other so that their horizontal
or vertical position matches. For more information, see How to Align Components on page
252.
1. Open or create a compound document with at least one report, text component, control,
or image.
2. Click the component and move it by using one of the following methods:
Use the mouse to drag the component anywhere on the canvas.
or
Right-click the component and select Size and Position.
Select Position from the left pane, as shown in the following image.
WebFOCUS InfoAssist User's Manual
251
Building a Compound Document
Use the Horizontal and Vertical options to change the position of the selected
component.
Procedure: How to Align Components
You can align components with each other so that their horizontal or vertical position matches.
You must have multiple components selected to use the align options.
The alignment is anchored by the component that is farthest in the selected alignment
position. For example, if you select two components and then select Align Left, the
components will be aligned horizontally with the far left component.
1. Open or create a compound document with at least two components.
2. Select a component.
3. Select a second component by holding the Ctrl key and clicking a component.
Sizing handles appear around the components, as shown in the following image.
4. Align the components using one of the following methods:
252
WebFOCUS
6. Using Document View and Building Compound Documents
Right-click one of the selected components and select an alignment option from the
Align drop-down menu, as shown in the following image.
or
WebFOCUS InfoAssist User's Manual
253
Building a Compound Document
Access the alignment options from the Align drop-down menu available in the Size
& Arrange group of the Layout tab, as shown in the following image.
The selected components will be aligned, as shown in the following image.
254
WebFOCUS
6. Using Document View and Building Compound Documents
Procedure: How to Style and Customize a Report
When you click a component, it enables you to perform functions such as moving and resizing,
as explained in How to Move a Component on page 251. After a single click, the Control Panel
can be used to affect all settings of the selected component except for fields. You can
double-click or right-click a component, which allows you to select individual fields to be
edited through the Context menu or Field tab.
The procedure below applies only to reports. Charts can be edited and have a context menu
that is covered in How to Style and Customize a Chart on page 257. Text can be edited and
has a context menu that is covered in How to Edit Text on page 260. Images cannot be edited.
1. Open or create a compound document with at least one report.
2. Click the report.
Sizing handles will appear around the border, as shown in the following image.
Take note of the groups on the Field tab. The groups of the Field tab are still grayed out
and inactive, as shown in the following image.
WebFOCUS InfoAssist User's Manual
255
Building a Compound Document
3. Right-click the report, and select Edit Report, as shown in the following image.
Note: You can also activate the report by double-clicking it, which has the same
functionality as right-clicking and then selecting Edit Report.
4. You can now select fields within the report. Select a field by clicking it in the canvas
and take note of the now active groups on the field tab, as shown in the following image.
256
WebFOCUS
6. Using Document View and Building Compound Documents
Note: You can also select a field within the report by clicking the field in the Query pane
of the Resources Panel. Make sure that the report that contains the field you would like
to edit is selected on the canvas.
You can now edit the selected report through right-click commands, which bring up the
Context menu or use of Control Panel, which contains options similar to those of the
Context menu. For more information on styling and customizing reports, see Customizing
and Styling Reports on page 119.
Procedure: How to Style and Customize a Chart
When you click a component, it enables you to perform functions such as moving and resizing,
as explained in How to Move a Component on page 251. After a single click, the Control Panel
can be used to affect all settings of the selected component except for fields. You can
double-click or right-click a component, which allows you to select individual fields to be
edited through the Context menu or Field tab.
The procedure below applies only to charts. Reports can be edited and have a context menu
that is covered in How to Style and Customize a Report on page 255. Text can be edited and
has a context menu that is covered in How to Edit Text on page 260. Images cannot be edited.
1. Open or create a compound document with at least one chart.
2. Click the chart.
WebFOCUS InfoAssist User's Manual
257
Building a Compound Document
Sizing handles appear around the border, as shown in the following image.
Take note of the groups on the Field tab. The groups of the Field tab are still grayed out
and inactive, as shown in the following image.
258
WebFOCUS
6. Using Document View and Building Compound Documents
3. Right-click the chart, and select Edit Chart, as shown in the following image.
Note: You can also activate the chart by double-clicking it, which has the same
functionality as right-clicking and then selecting Edit Chart.
WebFOCUS InfoAssist User's Manual
259
Building a Compound Document
4. You can now select fields within the chart. Select a field by clicking it in the canvas and
take note of the now active groups on the field tab, as shown in the following image.
Note: You can also select a field within the chart by clicking the field in the Query pane
of the Resources Panel. Make sure that the chart that contains the field you would like
to edit is selected on the canvas.
You can now edit the selected chart through right-click commands, which bring up the
Context menu or use of the Control Panel, which contains options similar to those of
the Context menu. For more information on styling and customizing charts, see Creating
and Customizing Charts on page 159.
Procedure: How to Edit Text
When you click a component, you can perform functions such as moving and resizing, as
explained in How to Move a Component on page 251. You can double-click or access the
Context menu by right-clicking a component.
The procedure below applies only to text. Reports can be edited and styled and have a
context menu that is covered in How to Style and Customize a Report on page 255. Charts
can be edited and styled and have a context menu that is covered in How to Style and
Customize a Chart on page 257. Images cannot be edited.
1. Open or create a compound document with at least one text component.
2. Click the text.
260
WebFOCUS
6. Using Document View and Building Compound Documents
Sizing handles appear around the border, as shown in the following image.
3. Right-click the text, and select Edit Text, as shown in the following image.
Note: You can also activate the context menus by double-clicking the text, which has
the same functionality as right-clicking and then selecting Edit Text.
WebFOCUS InfoAssist User's Manual
261
Building a Compound Document
4. A cursor appears over the text. Click anywhere in the text box and begin entering text.
5. Highlight the text you would like to edit and right-click, a context menu appears.
6. Using the options in the Context menu, you can style the text and insert quick text.
262
WebFOCUS
6. Using Document View and Building Compound Documents
The text component menu options are as follows:
Value
Description
Format Options
Font
Changes the font of the selected
text.
Not available
Size
Changes the size of the selected
text.
Not available
Bold
Changes the font weight of the
selected text.
Not available
Italic
Applies or removes italics from
the selected text.
Not available
Underline
Applies or removes underline
from the selected text.
Not available
Text color...
Changes the text color.
Not available
Cut
Cuts the selected text.
Not available
Copy
Copies the selected text.
Not available
Paste
Pastes text from the clipboard.
Not available
Insert date/time
Inserts Date or Time quick text
with various format options.
MM/DD/YY
HH.MM.SS
MMDDYY
MMDDYYYY
DDMMYY
DDMMYYYY
YYMMDD
YYYYMMDD
WebFOCUS InfoAssist User's Manual
263
Building a Compound Document
Value
Description
Insert page #
Inserts page number quick text
with various format options.
Format Options
Page X
Total pages
Page X of Y
Procedure: How to Delete a Component
The procedure below applies to all components in the Document view.
1. Open or create a compound document with at least one component.
2. Right-click the component, select Delete and the component will be deleted from the
canvas.
Note: You can also delete a component by clicking it and pressing the Delete key.
Reference: Output Format Options in Compound Documents
A compound document cannot output in Excel 2007, Excel Pivot, or Excel Formula format.
264
WebFOCUS
6. Using Document View and Building Compound Documents
Adding Active Technologies Form Controls to a Compound Document
In this section:
Associating a Field With a Control
Using the Active Dashboard Properties Dialog Box
How to:
Add an Active Technologies Form Control to a Compound Document
You can insert active form controls into a compound document to act as filters on the reports
of the document. You can also cascade (chain) controls to populate based on the selections
of the previous controls. The output format of the compound document must be active report,
active Flash, or active PDF in order to insert active form controls.
Procedure: How to Add an Active Technologies Form Control to a Compound Document
1. With InfoAssist open in the Document view, select an active output type (active report,
active Flash, active PDF) from the Output Types group of the Format tab.
2. Select the Insert tab from the Control Panel.
3. Select a form control to insert from the Active Dashboard Prompts group, as shown in
the following image.
An active form control appears in the top-left corner of the canvas.
You can now add the field that the form control filters on. For more information, see
Associating a Field With a Control on page 266.
Note: Once an active form control is added to the canvas, the compound document is
locked in an active output format. You cannot change out of active report, active Flash,
or active PDF format if there are controls present on the canvas. To switch to a nonactive output format, all controls must be removed.
WebFOCUS InfoAssist User's Manual
265
Adding Active Technologies Form Controls to a Compound Document
Associating a Field With a Control
How to:
Associate a Field With a Control From the Query Pane
Associate a Field With a Control From a Report on the Canvas
Associate a Field With a Control From the Active Dashboard Properties Dialog Box
You can bind a field to an inserted active form control from the Query pane, by dragging the
desired column directly from the report on the canvas, or through the Active Dashboard
Properties dialog box. Setting the target reports, cascading controls, and changing the filter
conditions can only be done through the Active Dashboard Properties dialog box. For more
information, see Using the Active Dashboard Properties Dialog Box on page 270.
Procedure: How to Associate a Field With a Control From the Query Pane
1. With InfoAssist open in the Document view and at least one report on the canvas, add
an active form control, as described in How to Add an Active Technologies Form Control
to a Compound Document on page 265.
2. Click the report.
The fields of the report will be populated in the Query pane.
Note: If the report is included as an existing report, you are not able to bind its fields
to a control.
3. Select a data source field from the Query pane and drag it onto the Layout Canvas.
Make sure that you drop the data source field onto the active form control that you want
the field to be bound to.
266
WebFOCUS
6. Using Document View and Building Compound Documents
The control updates with the options from the field, as shown in the following image.
Procedure: How to Associate a Field With a Control From a Report on the Canvas
1. With InfoAssist open in the Document view and at least one report on the canvas, add
an active form control, as described in How to Add an Active Technologies Form Control
to a Compound Document on page 265.
2. Right-click the report you wish to add a filter column from and select Edit Report.
Note: If the report is included as an existing report, you are not able to bind its fields
to a control.
WebFOCUS InfoAssist User's Manual
267
Adding Active Technologies Form Controls to a Compound Document
3. You can now select fields within the report. Click and drag the desired field from the
report and drop it onto the active form control you want the field to be bound to, as
shown in the following image.
Procedure: How to Associate a Field With a Control From the Active Dashboard Properties
Dialog Box
1. With InfoAssist open in the Document view and at least one report on the canvas, add
an active form control, as described in How to Add an Active Technologies Form Control
to a Compound Document on page 265.
268
WebFOCUS
6. Using Document View and Building Compound Documents
2. Right-click the active control you wish to add a filter column to and select Properties, as
shown in the following image.
3. The Active Dashboard Properties dialog box appears. Select the report that contains the
field you wish to filter on from the Report drop-down menu, as shown in the following
image.
WebFOCUS InfoAssist User's Manual
269
Adding Active Technologies Form Controls to a Compound Document
4. Select the field you wish to filter on from the Field drop-down menu, as shown in the
following image.
5. Select OK.
The active form control is updated with the selected options.
Using the Active Dashboard Properties Dialog Box
How to:
Set Target Reports
Change the Filter Condition
Cascade Controls
You can use the Active Dashboard Properties dialog box to bind a field to an active form
control, change the filter condition of an active form control, set the target for the form
control filters, and set up cascading form controls.
Procedure: How to Set Target Reports
You can add or remove target reports from an active form control through the Active
Dashboard Properties dialog box. When you bind a field to an active form control, the default
target report is the report you dragged the field from. More target reports can be added from
the Active Dashboard Properties dialog box.
Reports that can be target reports must meet one of the following requirements:
The report contains a field with the same name as the source field (actual field name or
AS name).
The Master File of the report has a field with the same name as the source field.
270
WebFOCUS
6. Using Document View and Building Compound Documents
If a report is eligible to be a target report because of an AS name and that AS name is
changed, the report is automatically removed.
1. With InfoAssist open in the Document view, bind an active form control to a field, as
described in Associating a Field With a Control on page 266.
2. Right-click the active form control you wish to add a filter column to and select Properties,
as shown in the following image.
3. From the Active Dashboard Properties dialog box, select the reports from the Candidate
Reports list box that you wish to add as target reports, as shown in the following image.
WebFOCUS InfoAssist User's Manual
271
Adding Active Technologies Form Controls to a Compound Document
Note: You can multi-select candidate reports by pressing the Ctrl key and selecting
multiple reports.
4. Click the Add to List arrow to move the selected reports to the Targets list box, as shown
in the following image.
Note: You can remove reports from the Targets list box by selecting reports there and
clicking the Remove from List arrow.
5. Select OK.
Procedure: How to Change the Filter Condition
1. With InfoAssist open in the Document view, bind an active form control to a field, as
described in Associating a Field With a Control on page 266.
272
WebFOCUS
6. Using Document View and Building Compound Documents
2. Right-click the active form control you wish to change the filter condition for and select
Properties, as shown in the following image.
3. From the Active Dashboard Properties dialog box, select the desired filter condition, as
shown in the following image.
Procedure: How to Cascade Controls
When you have more than one control on the canvas you can cascade controls to populate
based on the selections of the previous controls. Cascading controls have a parent-child
relationship, in which the parent filters the available options of the child. An active form
control can be the parent of more than one other control but cannot be a child of more than
one control.
WebFOCUS InfoAssist User's Manual
273
Adding Active Technologies Form Controls to a Compound Document
1. With InfoAssist open in the Document view, bind at least two active form controls to
fields, as described in Associating a Field With a Control on page 266.
2. Right-click an active form control and select Properties, as shown in the following image.
3. Select Cascades from the Active Dashboard Properties dialog box, as shown in following
image.
By default, a cascade named Cascade1 will appear in the Cascades section of the Active
Dashboard Properties dialog box.
You can click the Create a new cascade
You can click the Delete selected cascade
button to create a new cascade.
button to delete the selected cascade.
4. Select the cascade you wish to add controls to.
274
WebFOCUS
6. Using Document View and Building Compound Documents
5. Select the control you wish to add from the Available Prompts list box.
6. Click the Add to List arrow to move the selected control to the Selected Prompts list
box, as shown in the following image.
Note: You can remove controls from the Selected Prompts list box by selecting controls
there and clicking the Remove from List arrow.
7. Add any additional controls you wish to be part of the cascade by repeating steps 5 and
6.
By default, the hierarchy of the controls is determined by the order they are added to
the Selected Prompts list. The cascade of the controls is from the top, down. The controls
that come first in the Selected Prompts list are the parents of the lower controls.
8. You can change the hierarchy of the controls by selecting a control in the Selected
Prompt list box and clicking the Move Up and Move Down arrows, as shown in the
following image.
WebFOCUS InfoAssist User's Manual
275
Adding Active Technologies Form Controls to a Compound Document
276
WebFOCUS
WebFOCUS
Index
3D chart types 172
3D effects 208
A
accessing document view
from document button 228
opening an existing item 226
opening an existing report 227
accessing InfoAssist 16
accordion reports 156
active preview 193
adding
column totals in reports 141
page footings 189
page headings 189
pop-up titles in reports 144
row totals in reports 142
subtotals in reports 141
visualization bars in reports 145
aggregation values 200
alternating colors in reports 127
annotations 178
application main menu 34
application window 32
area chart types 171
axis label elements 215
axis labels 182
axis titles 216
WebFOCUS InfoAssist User's Manual
B
background 207
background elements 209
bar chart types 169
Break group 77
By Group 199
By Series 199
C
Calculation group 57
cell padding in reports 132
chart elements 196
chart types 161
chart types for Charts group 54, 160
Color Mode 199
column totals in reports 141
combination charts 188
compound documents 230
Control Panel 39
creating a new compound document 224
custom chart features 173
custom report features 136
customizing
axis labels 182, 213
axis titles 216
background color 209
277
Index
customizing (continued)
chart background 207
charts 173
data labels 185
frames 207
grid lines 212
legends 183, 220
markers 186
report output 150
series 197
D
data labels 185
Data pane 89
Data Panel group 67
Data Source group 62
Data tab 57, 58, 62
Calculation group 57
Data Source group 62
Filter group 58
deleting components 264
Design group
Home tab 42
View tab 66
Destination group 51
E
Field tab (continued)
Format group 78
Links group 80
Sort group 76
Specific group 79
Style group 78
Visibility group 80
Filter group
Data tab 58
Field tab 72
Home tab 43
Format group
Field tab 78
Home tab 41
Format tab 50, 51, 52, 54, 55
chart types for Charts group 54
Charts group 52
Destination group 51
labels for Charts group 55
Navigation group 51
Output types group 50
Report group 52
frame elements 209
frames 207
freeze column titles in reports 155
G
getting started 21
graph types 161
elements 196
grid line elements 213
embedding page headings and footings 192
grid lines 179, 212
Excel output for reports 120
H
F
Field tab 72, 76, 77, 78, 79, 80
Break group 77
Filter group 72
278
headings and footings in reports 123
help options 22
WebFOCUS
Index
Home tab 41, 42, 43
Design group 42
Filter group 43
Format group 41
Report group 43
Line group 83
I
major grid lines 212
Insert tab 48, 49
active form controls 49
existing reports 48
Objects group 49
Report group 48
inserting a chart 231, 232, 233, 235
drag and drop 232
with double-click 233
with right-click 235
inserting a report 237, 238, 239, 240
with double-click 239
with drag and drop 238
with insert tab 237
with right-click 240
inserting an existing report 244
markers 186
inserting text and images 245
OLAP reports 151
Links group 80
M
mathematical equations 181
minor grid lines 212
N
Navigation group 51
Navigation taskbar 114
O
Objects group 49
Other button 167
L
labels for Charts group 55
launching InfoAssist 18, 19
Domain Tree 19
Layout Canvas 101
Layout tab 64, 66
Page Setup group 64
Report group 66
legend elements 221
legends 183, 220
limiting variables in reports 138
line chart types 170
WebFOCUS InfoAssist User's Manual
Output type group 50
Output window 103
Output Window group 70
P
page and line breaks in reports 139
page footings 189
page headings 189
Page Setup group 64
Personal InfoAssist 15
pie chart types 170
279
Index
Pie group 84
selecting chart types 160
pop-up titles in reports 144
series 197
Series tab 81, 82, 83, 84
Line group 83
Pie group 84
Properties group 82
Select group 82
Show/Hide group 67
Properties group 82
Q
Query Design pane 91, 94, 99
in the Results Panel 99
right-click options 94
Query Panel group 69
Quick Access toolbar 36
smooth lines 188
Sort group 76
special chart types 172
Specific group 79
R
splash screen 21
ranking fields in reports 137
Status Bar 116
reference lines 175
stock chart types 172
rendering page headings and footings 192
Report group
Home tab 43
Insert tab 48
Layout tab 66
View tab 71
Reporting Objects 17
style data and column titles in reports 123
Resources Panel 85
Results Panel 98
rotating charts 174
row totals in reports 142
Style group 78
styling reports 121, 123, 127, 129, 132
alternating colors 127
cell padding 132
headings and footings 123
style data and column titles 123
traffic light styling 129
subtotals in reports 141
T
table of contents reports 154
S
scatter charts 164
Section 508 accessibility 16
Select group 82
title elements 218
traffic light conditional styling 201
traffic light styling 129
trendlines 180
selecting a data source 22
280
WebFOCUS
Index
U
user preferences 26
environment and styling 26
format 26
layout 26
start up options 26
view 26
V
View tab 66, 67, 69, 70, 71
Data Panel group 67
WebFOCUS InfoAssist User's Manual
View tab (continued)
Design group 66
Output Window group 70
Query Panel group 69
Report group 71
Show/Hide group 67
Visibility group 80
visualization bars in reports 145
X
XY plot chart types 171
281
Index
282
WebFOCUS
WebFOCUS
Reader Comments
In an ongoing effort to produce effective documentation, the Documentation Services staff
at Information Builders welcomes any opinion you can offer regarding this manual.
Please use this form to relay suggestions for improving this publication or to alert us to
corrections.Identify specific pages where applicable.You can contact us through the following
methods:
Mail:
Documentation Services - Customer Support
Information Builders, Inc.
Two Penn Plaza
New York, NY 10121-2898
Fax:
(212) 967-0460
E-mail:
[email protected]
Web form:
http://www.informationbuilders.com/bookstore/derf.html
Name:
Company:
Address:
Telephone:
Date:
Email:
Comments:
Information Builders, Two Penn Plaza, New York, NY 10121-2898
WebFOCUS InfoAssist User's Manual
Version 7 Release 7.02
(212) 736-4433
DN4501033.1110
WebFOCUS InfoAssist User's Manual
Creating Reports With
Version 7 Release 7.02
WebFOCUS
Language
Version 7 Release 6
Information Builders
Two Penn Plaza
New York, NY 10121-2898
Printed on recycled paper in the U.S.A.